75
Worklessness, welfare and social housing A report for the National Housing Federation Tony Wilson Paul Bivand Afzal Rahman Carmen Hoya July 2015

Worklessness, welfare and social housing A report for the National Housing Federation
Tony Wilson
Paul Bivand
Afzal Rahman
Carmen Hoya
July 2015

Contents
1 Introduction ............................................................................................... 3
2 Context ....................................................................................................... 6
Social housing and worklessness ....................................................................... 6
Expenditure on income-related benefits ........................................................... 11
Findings from qualitative research ................................................................... 14
3 The characteristics of those out of work ................................................. 21
Comparing the ten groups .............................................................................. 25
4 In-depth assessment of more disadvantaged groups ............................. 31
A closer look at the four disadvantaged groups ................................................ 31
Group 2 – Prime age adults with health problems ............................................. 33
Group 4 – Long-term workless mothers with health problems ........................... 37
Group 7 – Low qualified and out of work a long time ........................................ 41
Group 10 – Older people with poor mental health ............................................ 44
5 Supporting residents: options and recommendations ............................. 48
The role of housing associations ...................................................................... 48
Doing what works – options appraisal .............................................................. 50
1. ‘Skills Academies’ – work-focused training and work experience ................... 52
2. Jobs-Plus .................................................................................................. 55
3. ‘Pathways to Employment’ – personal adviser-led, caseworker support ......... 58
4. Intermediate labour markets (ILMs) ........................................................... 61
5. ‘Return to Work bonus’ – targeted financial incentives ................................. 64
Summary of costs and benefits ....................................................................... 66
Further measures to increase employment ....................................................... 67
6 Conclusions and cross-cutting recommendations ................................... 70
Appendix 1 – Modelling benefit receipt and expenditure .............................. 73

Social housing, worklessness and welfare
3
1 Introduction
1.1 Social housing residents face considerable disadvantage in the labour market. They are less likely to be in work than those in other tenures, and those out of work are much less likely to be looking for work or available for work (described as being ‘economically inactive’). Research1 suggests that these disparities are in part a result of social housing residents being more disadvantaged than those in other tenures – but that this is not the only explanation. Even allowing for these differences, social housing residents are less likely to be in work than those in other tenures. It is critical therefore to better understand residents that are out of work, their barriers to work and how support can be improved.
1.2 In recent years, there have been extensive efforts by housing associations to engage their residents in support to move (back) into work. Many of these examples have been documented by the National Housing Federation2. In large part, this engagement has happened against a backdrop of reduced employment services and support for residents – with the Work Programme largely taking the place of a plethora of other programmes and initiatives.
1.3 With the economy returning to growth and employment at record levels, it is more important than ever to find more effective ways to help those furthest from work. This research is intended to support efforts to do that. Very little previous analysis has explored the nature and characteristics of those out of work and receiving benefits in social housing, nor ‘what works’ in supporting these groups. This research aims to fill these gaps. It does so in four ways:
− First, by mapping the nature and extent of ‘worklessness’ and disadvantage amongst residents of social housing;
− Secondly, by developing a new segmentation of the population of social housing residents who are out of work, so as to better understand their
1 Hills, J. (2007) Ends and means: The future roles of social housing in England, CASE Report 34 2 Most recently in ‘A Home, A Job, A Future’ (2014)

Social housing, worklessness and welfare
4
needs – through grouping residents together according to their characteristics and then analysing their barriers to work;
− Thirdly, by then identifying what may work in supporting those identified groups to prepare for, find and keep sustained employment; and
− Finally, by suggesting a number of interventions and approaches that would help to tackle worklessness – and so also reduce benefits expenditure for these residents.
1.4 The report is underpinned by new analysis of the Labour Force Survey (LFS) and of benefits data, alongside findings from 37 in-depth qualitative interviews with Housing Association residents and extensive review of the literature around ‘what works’ in supporting different groups to find and keep employment.
1.5 Chapter 2 sets out findings from analysis of the LFS and benefits data, as well as the key findings of the qualitative research – giving us an overall picture of the extent and nature of worklessness amongst residents, and the estimated value and composition of benefits expenditure.
1.6 Chapter 3 segments the workless social housing population into ten groups according to their characteristics, using a technique called Principal Component Analysis. It describes these groups, their distance from work, and the extent to which key barriers are associated with labour market disadvantage.
1.7 In Chapter 4 we then go on to look in more depth at four key groups within this analysis, exploring as part of this what we think may work in improving employment support.
1.8 Chapter 5 sets out a number of potential approaches to tackling worklessness and supporting residents to move off benefits and into work.
1.9 Finally, in Chapter 6 we set out key conclusions and cross-cutting recommendations on the future design of employment and skills support for housing association residents.
1.10 The main focus of this research is on housing association residents of ‘working age’ (that is, aged 16-64) who are out of work and live in a

Social housing, worklessness and welfare
5
household that claims benefit. However note that for LFS analysis, we have looked at the wider group of social housing residents (i.e. housing association and Council residents) and at all of those out of work and of working age. This was done because the LFS is a self-reported survey and respondents are likely to under-report being in housing association homes (particularly those transferred from council housing) and under-report benefit receipt.

Social housing, worklessness and welfare
6
2 Context
Social housing and worklessness
2.1 Social housing offers a safety net for vulnerable groups and, through the allocations process, plays a pivotal role in providing accommodation for the most vulnerable people in society3. Housing associations operate within a national and local allocations system which is predicated on access to social housing to those most in need.
2.2 On a range of measures, social housing residents are more disadvantaged than those living in other tenures. More than half (53%) of social housing residents in England of working age are out of work – compared to an average of 30% for other tenures. And of those who are out of work, the large majority are economically inactive. Overall, social housing residents are around twice as likely to be out of work and not looking or available for work as those living in other tenures. This is set out in Figure 2.1 below.
Figure 2.1: Economic activity for working age adults by housing tenure
Source: Labour Force Survey, 2013
3 John Thornhill (2010), Allocating social housing, opportunities and challenges, Chartered Institute of Housing
47%
71%
79%
12%
6%
3%
40%
22%
18%
0% 20% 40% 60% 80% 100%
Social rented
Private rented
Owner occupier
Employed Unemployed Inactive

Social housing, worklessness and welfare
7
2.3 The ‘unemployment rate’ measures the proportion of the labour force4 that is looking for work and available for work. As Figure 2.2 below sets out, the rate amongst working age social housing residents is approaching three times that of private renters, and is more than five times that of owner-occupiers. Overall, one in five of the labour force that are living in social housing are unemployed.
Figure 2.2: Unemployment rate for working age residents by housing tenure
Source: Labour Force Survey, 2013
2.4 There is some variation in employment between regions, with generally more prosperous areas seeing more residents in work. The regions with the highest employment rates are the East (55%), South East (50%), South West (50%) and London (49%). However, none of these regions have employment rates close to the national average: social housing residents are still less likely to be in work than their peers in other tenures across all regions. Yorkshire and Humber (45%), the North West (44%) and West Midlands (42%) have lower employment.
2.5 Households that live in social rented accommodation and where no-one works will usually be entitled to Housing Benefit to help meet their rent, and to an ‘out of work’ benefit (referred to as ‘DWP benefits’ in this report) to help meet their day-to-day living costs – one of:
− Employment and Support Allowance (ESA), for people who have a health condition or disability that substantially limits their ability to work;
− Income Support for Lone Parents (ISLP), for those lone parents with a youngest child below school age; or
4 The labour force is defined as the number of people in work plus the number unemployed – so it excludes those who are economically inactive
21%
8%
4%
0% 5% 10% 15% 20% 25%
Social rented
Private rented
Owner occupier

Social housing, worklessness and welfare
8
− Jobseeker’s Allowance (JSA), for those who do not qualify for either of the above benefits (and so are expected to be available and looking for work).
2.6 Among households in social rented accommodation, the large majority of those claiming a DWP benefit claim ESA or ISLP – accounting for 80% of Housing Benefit recipients in social housing. As a consequence, they will not usually be receiving structured employment support and are not expected to look for work.
2.7 Looking at relative poverty – defined as having a household income below 60% of the median income – adults in social housing are almost twice as likely as private renters and nearly three times as likely as owner occupiers to experience poverty (30% compared with 16% and 11% respectively).
Figure 2.3: Rate of relative poverty (60% of median income before housing costs) for working age adults by housing tenure
Source: HBAI, FRS 2012/13
2.8 Amongst children, poverty is higher still – with 35% of children in social housing living in poverty, compared to 16% of children in private lets and 5% in owner occupied housing.
2.9 Perhaps of most concern, there is evidence that social housing tenants have been hit hardest by the recession, and have benefited least from the subsequent recovery. As John Hills et al5 have put it, “the UK has become sharply polarised by tenure, with large differences between social tenants and others” while “the period since 2007 has seen that intensify within the labour market.”
5 See Hills, J., Cunliffe, J., Obolenskaya, P. and Karagiannaki (2015), Falling Behind, Getting Ahead: The Changing Structure of Inequality in the UK, 2007-2013
11%
16%
30%
0% 5% 10% 15% 20% 25% 30% 35%
Owner occupier
Private rented
Social rented
Social housing, worklessness and welfare
9
Key barriers to work for social housing residents
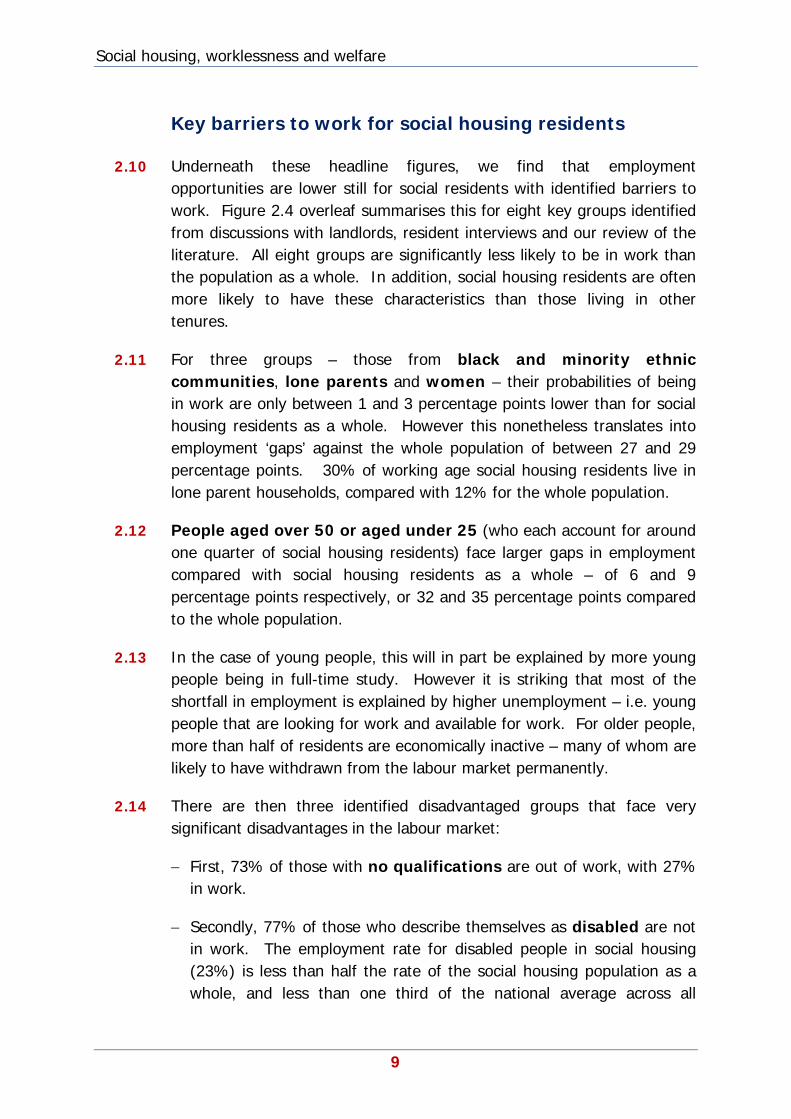
2.10 Underneath these headline figures, we find that employment opportunities are lower still for social residents with identified barriers to work. Figure 2.4 overleaf summarises this for eight key groups identified from discussions with landlords, resident interviews and our review of the literature. All eight groups are significantly less likely to be in work than the population as a whole. In addition, social housing residents are often more likely to have these characteristics than those living in other tenures.
2.11 For three groups – those from black and minority ethnic communities, lone parents and women – their probabilities of being in work are only between 1 and 3 percentage points lower than for social housing residents as a whole. However this nonetheless translates into employment ‘gaps’ against the whole population of between 27 and 29 percentage points. 30% of working age social housing residents live in lone parent households, compared with 12% for the whole population.
2.12 People aged over 50 or aged under 25 (who each account for around one quarter of social housing residents) face larger gaps in employment compared with social housing residents as a whole – of 6 and 9 percentage points respectively, or 32 and 35 percentage points compared to the whole population.
2.13 In the case of young people, this will in part be explained by more young people being in full-time study. However it is striking that most of the shortfall in employment is explained by higher unemployment – i.e. young people that are looking for work and available for work. For older people, more than half of residents are economically inactive – many of whom are likely to have withdrawn from the labour market permanently.
2.14 There are then three identified disadvantaged groups that face very significant disadvantages in the labour market:
− First, 73% of those with no qualifications are out of work, with 27% in work.
− Secondly, 77% of those who describe themselves as disabled are not in work. The employment rate for disabled people in social housing (23%) is less than half the rate of the social housing population as a whole, and less than one third of the national average across all

Social housing, worklessness and welfare
10
tenures. This is particularly concerning as one in three social housing residents is disabled, compared to 14% in other tenures.
− Finally, those who describe themselves has having a mental health problem are the least likely of any of the eight groups to be in work. Just 17% of those with a mental health problem are in employment. This is an employment gap of 30 percentage points compared with the social housing average, and 56 percentage points compared with the population as a whole. Overall, 18% of social housing residents have a declared mental health problem, compared with 6% in other tenures.
2.15 For the three most disadvantaged groups below, the entire shortfall in employment is explained by higher economic inactivity – the proportions unemployed are virtually identical to the average for social housing. So these groups are out of work and a long way from work – either not looking for work, not available to work, or both.
Figure 2.4: Economic activity for working age adults by tenure...
...and for social housing residents by characteristics
Source: Labour Force Survey, 2013
73%
47%
5%
12%
22%
40%
0% 10% 20% 30% 40% 50% 60% 70% 80% 90%100%
Whole population
Social housing
Employed Unemployed Inactive
46%
44%
44%
41%
38%
27%
23%
17%
14%
15%
10%
7%
19%
11%
10%
11%
39%
41%
46%
52%
43%
62%
67%
72%
0% 20% 40% 60% 80% 100%
Ethnic Minority
Lone parents
Women
Older (50-64)
Young (16-24)
No qualifications
Disabled
Mental health

Social housing, worklessness and welfare
11
2.16 Looking at individual barriers in this way is useful in identifying key gaps in employment and potential indicators of disadvantage. However this analysis does not recognise how disadvantages may combine, nor the impacts of multiple disadvantages – for example of having multiple health conditions, low qualifications, caring responsibilities and so on. For this reason, in chapter 3 we set out a new approach to segmenting and mapping the population out of work, so as to identify key common characteristics and how these impact on employment chances.
Expenditure on income-related benefits
2.17 Inclusion estimates that around £12 billion is spent per year on income-related benefits6 for working age residents of housing associations in England. This is equivalent to one fifth of all spending on these benefits.
2.18 These estimates are based on a range of sources. For Housing Benefit and the main DWP benefits (JSA, ESA and ISLP), estimates are derived from data available through Stat X-Plore7. Based on this data, the number of claimants of DWP benefits who live in housing association homes in England is:
Benefit Recipients
Jobseeker’s Allowance 113,000
Employment Support Allowance/ Incapacity Benefit 375,000
Income Support for Lone Parents 201,000
Total 689,000
Source: DWP Stat X-Plore and Inclusion calculations
2.19 Note that the above estimates capture those claimants that claim one of the three benefits and also claim Housing Benefit. However given that households in social rented accommodation that claim income-related DWP benefits are automatically entitled to Housing Benefit, it is
6 Defined as Income-Based JSA, ESA and ISLP, Housing Benefits, and Tax Credits. Analysis is restricted to these benefits partly due to data limitations but mainly so as to better reflect the share of spending targeted at those on low incomes. 7 Available at: https://stat-xplore.dwp.gov.uk/

Social housing, worklessness and welfare
12
reasonable to assume that this captures the very large majority of claimants of DWP benefits.
2.20 In addition, a further:
− 97,500 tenants are out of work, claim Housing Benefit but do not claim one of the three main DWP benefits; and
− 284,800 tenants are in work (working more than sixteen hours a week) and claim Housing Benefit – so just over a quarter of all HB claimants.
− In total, then, 1.07 million households in housing association accommodation in England claim Housing Benefit either in or out of work.
2.21 For Tax Credits, estimates are reached by combining data from the Family Resources Survey on the proportion of social renters claiming tax credits with government data on the number of claimants and total awards for these benefits. This is then weighted for the share of social housing tenants living in a housing association home. This leads to estimates of:
Benefit Recipients
Working Tax Credits 219,000
Child Tax Credits 474,000
Source: Family Resources Survey, HMRC data and Inclusion calculations
2.22 It is important to note that claimants of Child Tax Credits can be in work or out of work (estimates are shown separately below), individuals can claim both Working Tax Credits and Child Tax Credits at the same time and they can claim Child Tax Credits and DWP benefits at same time.
Total expenditure
2.23 Drawing this together, our estimates of total annual benefit expenditure for social housing residents are:

Social housing, worklessness and welfare
13
Benefit Spending (£m)
Housing Benefit – out of work claimants £4,126
Housing Benefit – in work claimants £1,154
Tax Credits – out of work claimants £983
Tax Credits – in work claimants £2,196
Employment and Support Allowance/ incapacity benefits £1,972
Income Support for lone parents £756
Jobseeker's Allowance £425
Total £11,612
Source: Stat X-Plore, Family Resources Survey, HMRC data and Inclusion calculations
2.24 Of the £11.6 billion estimated expenditure, we estimate that £3.3 billion (28% of the total) is paid to working households, through Housing Benefit and Tax Credits. We estimate that £8.2 billion is paid to households out of work.
2.25 Note that expenditure on Disability Living Allowance and Personal Independence Payments have been excluded from these calculations as these are non-means tested, universal benefits paid to help to meet the additional costs of being disabled.
2.26 More information on the approach taken to this modelling is set out in Appendix 1.

Social housing, worklessness and welfare
14
Findings from qualitative research
2.27 Thirty-seven housing association residents who were claiming benefits were interviewed for this research. The interviews were conducted between January and March 2015.
Characteristics of interview participants
2.28 Those interviewed had a range of circumstances and backgrounds that were broadly representative of those claiming benefits and living in social housing: they were around twice as likely to claim ESA as JSA, one quarter were aged over 50, two thirds reported having either a health condition or disability, one third reported having low or no qualifications and one third were lone parents.
2.29 However there were some variations between the sample interviewed and the population of workless residents of social housing. In particular, interviewees were less likely to be aged under 25 than the population of social housing residents out of work, more likely to have very large families and were somewhat more likely to be from Black and Minority Ethnic communities.
2.30 Looking at those out of work, most respondents had either never worked or had been out of work for a considerable length of time – with more than two thirds having been out of work for over a year, and nearly half for more than five years. This is set out in Figure 2.5 below.
Figure 2.5: Length of time out of work reported by those interviewed for research
Source: Inclusion
11 9 6 6 5
0 5 10 15 20 25 30 35
One year or less 1 to 4 years 5-9 years
10 years or more Never worked

Social housing, worklessness and welfare
15
Attitudes to work
2.31 Overwhelmingly, respondents reported that they wanted to work. Respondents variously described employment as enabling them to “hold your head up”, to have “a sense of purpose”, or needing to work “for peace of mind”. Within this, respondents divided into three groups: those who were looking for work and ready to work; those who wanted to work now or in the near future but felt that their barriers to work prevented this; and those who wanted to work in the future.
2.32 The first group – those ready to work and looking for work – were usually JSA claimants, without health conditions or caring responsibilities, but often with other barriers such as poor qualifications, a lack of recent experience or low confidence. As one respondent in his 40s put it, who had been made redundant and been out of work for over a year, ”There is the stuff out there, they just need to give us the chance.”
2.33 Those who wanted to work but felt unable to work more often than not had a health condition or impairment alongside other barriers to work. Within this group, many respondents reported real challenges in finding work that they would be able to do or employers that would take them on. As one put it, “I don’t know if it’s all in my head or what, but I feel like people treat me different.”
2.34 However, there were also examples of participants with more confidence that they could find work. In one instance, a respondent reported asking to move from the Support Group of ESA to the Work Related Activity Group so as to access more support: “I was in an ESA group for people not working who would probably never work, so I asked [them] to move me to the work activity group.”
2.35 The final group – those who wanted to work in the future – were not currently looking for work due mainly to caring responsibilities. Many respondents had worked before having children and were confident of their ability to find work when they did start looking again. As one lone parent put it, “It is realistic [to find work] if you are looking every day, getting yourself out there, creating opportunities.” However others reported that they were concerned about their prospects – due to their lack of work experience, their qualifications, and often due to challenges with finding ‘family friendly’ work.

Social housing, worklessness and welfare
16
2.36 Nonetheless across the three groups, despite often very positive attitudes to work and the benefits of work, those who had taken steps to look for work usually reported real struggles in the jobs market. Many of these issues were around a lack of appropriate jobs; struggling to compete with those with more experience or fewer barriers to work; and having their confidence affected by applying for jobs and failing to get them. As one put it, “it’s been hard to find a job – even though I have applied to loads, not many people message you back.”
2.37 In some cases – particularly for those with impairments and health conditions – these negative impacts had ultimately led to residents giving up on looking for work.
Attitudes to being on benefit
2.38 No respondents reported that they were comfortable or happy on benefits, and the large majority had very negative attitudes to being on benefit. This ranged from embarrassment – “I feel embarrassed to tell people I'm on benefits now” – through to helplessness. In some cases, participants reported that this was in turn impacting on their mental wellbeing: “It’s not even not getting money, its feeling useless, like I am not useful for anyone and that is psychologically stressful.”
2.39 A range of other negative impacts were reported by participants:
− First, the experience of claiming benefits – as one put it, “Having to rely on the benefits system has been a degrading experience”
− Secondly, the loss of income – particularly for those who had recently left work, or those who had seen benefits reduced and were struggling to pay bills
− Thirdly, social isolation from being out of work – again often compounded by barriers to work. One disabled person described the benefits of their old job as “having a life, going out there, making friends, having money... I miss interactions now I can’t walk very far... no one’s been in my flat for a month”
Barriers to work
2.40 Around one third of respondents reported that their disability or health condition was a barrier to work. In most cases, respondents felt that they would be able to work if they could find a job that could

Social housing, worklessness and welfare
17
accommodate their condition. However they were struggling to do so, and often had very little support (covered in more depth below). One respondent with a mental health problem said that they were now concealing their condition so as to improve their chances: “I've been told now not to tell people about my bipolar, only if someone asks directly”.
2.41 In other cases, disabled respondents felt able to work, but that their impairment meant that employers were more likely to overlook them. As one former self-employed disabled person put it, “If I applied to my business, I would not take me on”.
2.42 Interestingly, around half of those with a health condition or disability did not consider it to be a barrier to work. So while disability and ill health may be a clear indicator of disadvantage, it does not always follow that the impairment or health condition is itself a key barrier to work.
2.43 The next most common barrier reported by participants was caring responsibilities, reported by around one in five of respondents. This was also often seen as limiting the range of jobs that individuals could apply for. Childcare issues were also consistently identified as problematic. As one described, “It’s hard because I can’t afford childcare. What would I do in the holidays, who would pick them up from school?”
2.44 There were four more barriers reported relatively frequently (by between five and seven respondents):
− First, the state of the jobs market – both the perceived lack of jobs and competition for those jobs. However as noted earlier, this was balanced by some respondents having high confidence that they would find work.
− Secondly, low confidence – often but not always as a result of repeatedly looking for work without success. As one young parent put it, “I don't have any confidence at all to go into work, which is really bad for a 26 year old to say... I didn't even have the confidence to be a parent, let alone find a job”.
− Thirdly, a lack of recent experience was seen by many as their main barrier. A number of respondents felt that being out of work for a long time made it less likely that employers would consider taking them on.
− Finally, five respondents felt that their age was a key barrier to work. In most cases, this was seen in straightforward terms of employer

Social housing, worklessness and welfare
18
discrimination: “I think age [is the main barrier], because people want to employ young people so they can pay them less money”.
2.45 In addition to these barriers, smaller numbers of respondents reported a number of other disadvantages: two residents with criminal records felt that these were making it harder to find work, one ethnic minority claimant felt that they were being discriminated against on the basis of their race; while two who had poor English skills felt that this was a key barrier. In addition, three participants felt that their lack of qualifications was preventing them from finding work – as one put it, “I’m not that educated – I wouldn’t [even] be able to do minimum wage jobs.”
2.46 Just one of the thirty-seven participants reported that the value of benefits themselves made work less attractive. The respondent, a single parent with more than five children, reported that they had experienced being both better and worse off in work: “I was on £9 an hour so I was better off. But I have had jobs where I've been on minimum wage and I've been worse off.”
Experiences of employment support
2.47 Two thirds of those interviewed had recent experience of engaging with Jobcentre Plus. Generally, participants had negative views of this process – as one put it, “Having to sign on is the worst thing in the world, it’s like going to the dentist” – and very few said that they were receiving support to look for work: “They just sign your form, they don’t even check to see if I've looked in places.” Following on from this, a number stated that they wanted more support to look for work: “There needs to be pro-active support, not just signing my book and threatening to take my money away.”
2.48 As a consequence, some respondents felt that their experiences were impacting on their own self-esteem and confidence: “It makes me feel like if the Jobcentre isn't bothered about going through my forms then why would an employer, I'm not special.”
2.49 However, set against this, a smaller number of participants did report very positive experiences of Jobcentre Plus support. One felt that their personal adviser has “given me the confidence boost I needed” after having a number of setbacks in looking for work. Another, claiming ESA,

Social housing, worklessness and welfare
19
reported that their specialist personal adviser had “been lovely about my health issues.”
2.50 Six respondents reported that they had participated in the Work Programme. There were distinctly mixed views of this support. One respondent described the support received as “spot on” – seeing a specialist adviser who understood their health condition and could offer tailored and personalised support. However another respondent (a JSA claimant) had had far more negative experiences, including of multiple sanctions: “they find any excuse to sanction [you]”.
2.51 Around half of those interviewed (seventeen participants) reported that they had received support through their housing association. By contrast, views of this support were overwhelmingly positive. In particular, participants reported that their adviser was able to give them the confidence to keep going. As one put it, “It was just nice to have someone be like ‘yeah you can do it, you're better than that’ and I never got that in the job centre.” A number also reported receiving high quality support with preparing for work and an understanding of their needs. As one participant described, “They have a good understanding of my barriers and how I can tailor my CV to show off my skills.”
2.52 Many respondents also felt that they had a closer connection with their landlord, due to their proximity and their ability to help them with other issues like benefits, housing and support with budgeting and skills: “Oh they are fantastic, always saying come in and have a chat, helped me sort out my benefits, I don’t know where we'd be if it wasn't for them”.
Views on future support needs
2.53 When participants were asked what support they would like in future, by far the most common response was for face-to-face support. As one put it, “seeing people face to face is important, so they can see me for who I am”. Participants wanted personalised support, which understood their specific needs and barriers, and got to know them as a person.
2.54 Linked to this, many respondents also emphasised the need for more frequent support. This was particularly common amongst those claiming ESA, who typically only saw an adviser every six months (if at all). Many wanted to have support from an adviser weekly if not more often: “At the beginning it should be twice a week and then decrease to once a month, to make sure they know how everything is going.”

Social housing, worklessness and welfare
20
2.55 Beyond this, on the content of the support, respondents often had fairly modest expectations. Most common was a desire for help with the practicalities of finding work – so help with looking for jobs, searching online, preparing CVs, finding and engaging with employers, preparing for interviews and so on. In addition, motivational and confidence-building support was raised by a number of participants: “Having someone to say ‘go on, go and do your best, the worse they can say is no’".

Social housing, worklessness and welfare
21
3 The characteristics of those out of work
3.1 In order to better understand the characteristics of social housing residents who are out of work, we segmented the population into groups using a statistical method called Principal Component Analysis. This technique enables us to simplify a large number of different variables into a smaller number of groups, according to how closely they correlate or fit together with each other. In effect, it is a tool to group people together according to their characteristics.
3.2 In this case, we have analysed the characteristics of social housing residents that are out of work, using five consecutive Labour Force Survey (LFS) longitudinal 2-quarter datasets covering the period from quarter 4 of 2012 to quarter 1 of 2014. These datasets can measure people flowing into work between quarters. We began with a long list of characteristic variables, and tested which ones appeared to have the greatest impacts on the likelihood of moving into work in the LFS (i.e. moving from reporting that they are out of work in one quarter to being in work in the next). This gave us 669 observed social housing residents who were workless and started work, compared with 12,996 who were workless and remained workless.
3.3 The weighted and unweighted figures are summarised in Table 3.1 below.
Table 1: Social housing residents who remained workless or entered work within a three-month period
Weighted estimates Percentage
Unweighted sample
Entering work 208,050 5.5% 669 Remaining workless 3,602,030 94.5% 12,996 Total workless in first quarter 3,810,080 100.0% 13,665
Source: LFS longitudinal datasets and Inclusion analysis
3.4 From this, we then reduced the number of variables being analysed to thirty – which described gender, age, household composition, health and disability, labour market status, length of time out of work, qualification levels and likelihood of entering work.

Social housing, worklessness and welfare
22
3.5 Using Principal Component Analysis, we could then simplify this further into ten principal groups. Between them, these ten groups describe around three quarters of all social housing residents who are out of work.
3.6 The ten groups are set out below with brief descriptions, ordered from largest in size to smallest. As one of the variables analysed was the likelihood of finding work, for each group we can also describe the extent to which they are disadvantaged in the labour market.
3.7 Alongside this, we estimate the expenditure on benefits for each group, based on their share of the population out of work – with adjustments made for the likely patterns of benefit receipt within the groups, based on their characteristics.
Group 1 – women with dependent children This group mainly comprises women aged 25-49, who have small families and low or intermediate qualifications. They are split between those who are looking for work and those looking after families, and between those who have never worked and who have worked in the last few years. They are unlikely to be disabled but may have a health problem. They are more likely to find work than other residents. Members of this group are likely to be claiming Child Tax Credit. They may also be claiming JSA if their partner does not work, or Income Support for Lone Parents if they are a single parent.
About 650,000 out of work social housing residents fall into this group, which accounts for 17% of the total workless social housing population.
Group 2 – ‘prime age’ adults with health problems This group is made up mainly of adults aged 25-49 with multiple health problems (including poor mental health and disability) and usually not looking for work. Members of this group are likely to have been out of work for a long time or to have never worked, and are much less likely than other residents to find work. Most have dependent children and low qualifications. Members of this group are likely to be claiming ESA and may also be receiving Disability Living Allowance. Those with dependent children may be eligible for Child Tax Credit.
About 380,000 out of work social housing residents fall into this group, which accounts for 10% of the total workless social housing population.

Social housing, worklessness and welfare
23
Group 3 – unemployed men with some qualifications Members of this group are more likely to be male, unemployed, separated and with low or intermediate qualifications. They are unlikely to have dependent children and unlikely to have been out of work for a very long period. This group is slightly more likely to find work than other residents. They are likely to be claiming JSA.
About 270,000 out of work social housing residents fall into this group, which accounts for 7% of the total workless social housing population.
Group 4 – long-term workless mothers with health problems This group is made up of women with three or more health problems, who have been out of work for over five years and tend to be looking after their family. They are likely to have worked in the past, but to have been out of work for a long time. Their health problems are unlikely to include poor mental health, but may limit their ability to work. They will usually have some qualifications – either low or intermediate level. This group is among the least likely to enter work. Members of this group are likely to be claiming Child Tax Credit. They may also be claiming JSA or ESA if their partner does not work, or Income Support for Lone Parents if they are a single parent.
About 270,000 out of work social housing residents fall into this group, which accounts for 7% of the total workless social housing population.
Group 5 – low-qualified married men Members of this group are highly likely to be married men with low qualifications. They have an average likelihood of having health problems, but are unlikely to have a mental health problem. They are slightly more likely to enter work than other residents. Members of this group are likely to be claiming ESA or JSA, depending on the extent of their health conditions.
About 230,000 out of work social housing residents fall into this group, which accounts for 6% of the total workless social housing population.
Group 6 – prime age men with intermediate qualifications This group is made up of residents with intermediate qualifications, more likely to be men, and more likely to be aged 25 to 49. Members of this group have a broadly average likelihood of looking for work but many have been out of work for five years or more. They are more likely than other residents to have children and to be married,

Social housing, worklessness and welfare
24
and are relatively unlikely to have a mental health problem. Members of this group are slightly less likely to enter work than other residents. They are likely to be claiming JSA.
About 230,000 out of work social housing residents fall into this group, which accounts for 6% of the total workless social housing population.
Group 7 – low qualified and out of work a long time This group comprises low qualified residents, again aged 25-49, likely to have a couple of health problems and to have been out of work for more than five years. Members of this group are slightly more likely than average to have a mental health problem. They are somewhat more likely to be men than women, and relatively less likely to have children than those in other groups. Members of this group are slightly less likely to enter work than other residents. They are likely to be claiming ESA or JSA, depending on the extent of their health conditions, and may receive Disability Living Allowance.
About 190,000 out of work social housing residents fall into this group, which accounts for 5% of the total workless social housing population.
Group 8 – separated, physical health condition and low/no qualifications This group consists of residents with one physical health condition who are often separated from their partners. They are slightly more likely to be aged under 50, and more likely to have low or no qualifications. They are slightly more likely to enter work than other residents. Members of this group could be claiming either JSA or ESA depending on their health condition, and may also be receiving Disability Living Allowance.
About 190,000 out of work social housing residents fall into this group, which accounts for 5% of the total workless social housing population.
Group 9 – men with multiple health problems, looking for work Members of this group are highly likely to be men, aged 25-49, with three or more health problems including poor mental health and no qualifications. Despite these barriers, this group is the most likely to enter work, probably because they are much more likely to be looking for work (unemployed) and very unlikely to be inactive due to their health conditions. They are very unlikely to have families.

Social housing, worklessness and welfare
25
Members of this group are likely to be claiming ESA or JSA.
About 150,000 out of work social housing residents fall into this group, which accounts for 4% of the total workless social housing population.
Group 10 – older people with poor mental health This group is made up of older adults aged 50-64 with poor mental health. They are the least likely to enter work, and are usually not looking for work because of their health problems. Many have been out of work for more than five years. They are likely to have dependent children and above average qualifications. Members of this group are likely to be claiming ESA.
About 150,000 out of work social housing residents fall into this group, which accounts for 4% of the total workless social housing population.
Comparing the ten groups
3.8 Figure 3.1 below maps these ten groups of residents by their likelihood of entering work. It does this by comparing the probability of members of that group moving from being out of work to being in work in successive quarters in the Labour Force Survey. The size of the bubbles represents the size of each group.
Figure 3.1: ‘Employability’ of workless social housing residents by segmented group
Group 10 Group 2 Group 4 Group 6 Group 7 Group 8 Group 5 Group 1 Group 3 Group 9
-0.04 -0.03 -0.02 -0.01 0.00 0.01 0.02 0.03 0.04 0.05 0.06Employability - below/above social housing average

Social housing, worklessness and welfare
26
3.9 This analysis shows that the ten ‘segments’ can be further grouped into three broad clusters:
Least likely to enter work – the left hand side of the graph – comprising groups:
10 – older people with poor mental health
2 – prime age adults with health problems
4 – long term workless mothers with health problems
This cluster accounts for 21% (or approx. 800,000 people) of the workless social housing population.
Average chance of entering work – the middle, comprising groups:
6 – prime age men with intermediate qualifications
7 – low qualified and out of work a long time
8 – separated, physical health condition and low/no qualification
5 – low qualified married men
This cluster accounts for 22% (or approx. 840,000 people) of the workless social housing population.
Most likely to enter work – the right hand side – comprising groups:
1 – women with dependent children
3 – unemployed men with some qualifications
9 – men with multiple health problems, looking for work
This cluster accounts for 28% (or approx. 1,070,000 people) of the workless social housing population.
3.10 It is important to note that this analysis sets out residents’ likelihood of entering work compared with other social housing residents. As Chapter 2 sets out, social housing residents are more disadvantaged in the labour market than those who live in other tenures – so having an average chance of entering work relative to other social residents would still equate to being disadvantaged compared with the population as a whole.

Social housing, worklessness and welfare
27
3.11 The analysis above also suggests that there are a number of common characteristics that are associated with a higher or lower likelihood of entering work – around looking for work, disability and ill health, qualifications and caring responsibilities. These are explored in more depth below, and build on the findings set out in Chapter 2.
3.12 Figure 3.2 shows the likelihood of entering work for different groups, compared with whether residents are looking for work. This shows a strong and positive relationship between seeking work and entering work. Members of Group 9 – men with multiple health problems, looking for work (represented by the small bubble in the top right) have both the highest chance of moving into work and the highest likelihood of looking for work. Group 2 – prime age adults with health problems (represented by the red bubble in the bottom left) have the lowest likelihood of being unemployed and are among the least likely to find work. The largest group – Group 1 – women with dependent children – are relatively highly likely to find work and to be unemployed.
Figure 3.2: Employability and whether seeking work
Group 10 Group 2 Group 4 Group 6 Group 7 Group 8 Group 5 Group 1 Group 3 Group 9
3.13 We can also spot patterns when looking at the likelihood of entering work compared with qualification levels. In the bottom right of Figure 3.3 below, Group 3 – unemployed men with some qualifications are the least likely to have no qualifications and among the most likely to enter work. Two other groups are also in that bottom right hand quarter of the graph. However, this is a weak relationship – two groups are in the top right hand (meaning they are both more likely to have no qualifications and
-0.30
-0.20
-0.10
0.00
0.10
0.20
0.30
0.40
0.50
-0.04 -0.03 -0.02 -0.01 0.00 0.01 0.02 0.03 0.04 0.05 0.06
Bein
g un
empl
oyed
- be
low
/abo
ve
soci
al h
ousi
ng a
vera
ge
Employability - below/above social housing average

Social housing, worklessness and welfare
28
more likely to find work), while four groups are in the bottom left (less likely to have no qualifications but also less likely to find work).
Figure 3.3: Employability and no qualifications
Group 10 Group 2 Group 4 Group 6 Group 7 Group 8 Group 5 Group 1 Group 3 Group 9
3.14 Figure 3.4 below plots the likelihood of having dependent children against the likelihood of finding work. We can see several groups who are likely to have dependent children and are less likely to enter work in the top left of the graph. Four groups which are unlikely to have children and more likely to enter work sit in the bottom right. This suggests some relationship between having children and the chances of finding work. However Group 1 – women with dependent children – are again unusual: with a high likelihood of finding work.
-0.80
-0.60
-0.40
-0.20
0.00
0.20
0.40
-0.04 -0.03 -0.02 -0.01 0.00 0.01 0.02 0.03 0.04 0.05 0.06
No
qual
ifica
tions
- be
low
/abo
ve
soci
al h
ousi
ng a
vera
ge
Employability - below/above social housing average

Social housing, worklessness and welfare
29
Figure 3.4: Employability and dependent children
Group 10 Group 2 Group 4 Group 6 Group 7 Group 8 Group 5 Group 1 Group 3 Group 9
3.15 Finally, Figures 3.5 and 3.6 below show the fit between the likelihood of being disabled and of finding work, and of having a mental health condition and finding work. This shows a strong negative correlation between disability and employability – i.e. those groups that are most likely to be disabled are also generally less likely to find work. There are no groups with an above-average likelihood of being disabled and of finding work (the top right of the graph).
Figure 3.5: Employability and disability
Group 10 Group 2 Group 4 Group 6 Group 7 Group 8 Group 5 Group 1 Group 3 Group 9
-0.30
-0.20
-0.10
0.00
0.10
0.20
0.30
0.40
-0.04 -0.02 0.00 0.02 0.04 0.06
Havi
ng d
epen
dent
child
ren
- be
low
/abo
ve so
cial
hou
sing
av
erag
e
Employability - below/above social housing average
-0.25
-0.20
-0.15
-0.10
-0.05
0.00
0.05
0.10
0.15
0.20
-0.04 -0.03 -0.02 -0.01 0.00 0.01 0.02 0.03 0.04 0.05 0.06
Disa
bilit
y - b
elow
/abo
ve so
cial
ho
usin
g av
erag
e
Employability - below/above social housing average

Social housing, worklessness and welfare
30
3.16 On mental health, the relationship is less clear: there is a weak negative correlation (poor mental health is associated with a lower likelihood of finding work), but the three groups with the highest chances of finding work also have above average likelihoods of mental health conditions.
Figure 3.6: Employability and mental health
Group 10 Group 2 Group 4 Group 6 Group 7 Group 8 Group 5 Group 1 Group 3 Group 9
3.17 Overall, this analysis shows that there are clear correlations between a number of indicators of disadvantage and the likelihood of entering work. Those seeking work (and by extension those with more confidence and motivation) are more likely to find work; while disabled people, those with children and those with no qualifications are less likely. To a large extent, this confirms the findings in Chapter 2, that there are clear indicators or predictors of disadvantage among social housing residents.
3.18 However, the analysis above also demonstrates why it is important to look beyond individual indicators of disadvantage, and instead to look at the characteristics (and needs) of residents in the round. A number of groups would appear to be disadvantaged on one or more indicator – such as having children or a mental health problem – but overall are relatively more likely to find work than other residents. At the same time, others would appear to be less disadvantaged on one indicator (most notably on qualifications) but are less likely to find work.
3.19 It appears in particular that not looking for work, when combined with other barriers such as having dependent children or being disabled, is most strongly associated with residents being less likely to find work.
-0.40
-0.20
0.00
0.20
0.40
0.60
0.80
-0.04 -0.02 0.00 0.02 0.04 0.06
Havi
ng a
men
tal h
ealth
pro
blem
- be
low
/abo
ve so
cial
hou
sing
av
erag
e
Employability - below/above social housing average

Social housing, worklessness and welfare
31
4 In-depth assessment of more disadvantaged groups
4.1 This chapter takes a closer look at four of the more disadvantaged groups that were identified in the segmentation above. It combines this with further and more detailed analysis of the findings from the qualitative interviews with out-of-work residents.
4.2 The four groups comprise the three that were identified as being the least likely to enter work in the above analysis, plus Group 7. This group has a slightly below average likelihood of finding work and multiple characteristics that correlate with being disadvantaged – including poor health, low qualifications disability and long periods out of work.
A closer look at the four disadvantaged groups
4.3 Below we set out a ‘radar chart’ for each group and repeat the group description from Chapter 3. This chart is a simplified way of showing how the characteristics of the group compare with the average for all social housing residents who are out of work.
4.4 An example radar chart is below. Each of the lines running from the centre of the chart represents one of the characteristics that was analysed in the Labour Force Survey. The red circular line represents the average score for that characteristic for residents that are out of work and that live in social housing. The blue line then represents the score for that specific group of social housing residents – if the blue line is above the red line (closer to the outside of the radar), then the group is more likely to have that characteristic; if it is below the line (closer to the middle of the radar), the group is less likely to have the characteristic.
4.5 So in the example below, this group is more likely to contain people that:
• Are aged 25-49;
• Have dependent children;
• Have three or more health problems and/ or a mental health problem; and

Social housing, worklessness and welfare
32
• Are economically inactive and not seeking work, due to health or disability.
4.6 The group is less likely to contain people that:
• Are 50-64;
• Are not disabled and/ or not on a disability benefit;
• Are unemployed (rather than economically inactive); and
• Are economically inactive due to early retirement.
Figure 4.1: Example ‘radar chart’
4.7 Following each radar chart below, we then set out case study examples of residents that fit these groups, drawn from the in-depth qualitative research. As part of this, residents were given a number of statements and asked the extent to which they agreed with them. The findings from this are also presented here. Names have been changed for anonymity.
4.8 Lastly, for each group, we set out headline findings around ‘what works’ in supporting individuals with those or similar characteristics. This draws on a range of sources in the UK and overseas. It is important to note that despite more than two decades of research, there is very little that rigorously measures the net (additional) impact of employment interventions. Therefore some of the findings are necessarily high level.
-0.50-0.40-0.30-0.20-0.100.000.100.200.300.400.500.60Entering work
Remaining worklessFemale
age 25-49 yrs
age 50-64 yrs
Dependent children
1 child
2 children
3 or more children
Married, living as couple
Separated etc.
Not disabled
One health problem
Two health problemsThree or more health problems
Mental health problemNo sickness, disability benefit
Health limits kind of work
Unemployed
Inactive, seeking
Inactive, nt seeking, lk after family
Inactive, nt seeking, sick or disabled
Inactive, nt seeking, retired
out of work 1 year but less than 3 years
out of work 3 years but less than 5 years
out of work 5 years or more
out of work Never had paid job
quals Intermediate qualifications
quals Low/other qualificationsquals No qualifications
Group 2 Social housing residents average

Social housing, worklessness and welfare
33
Group 2 – Prime age adults with health problems
This group is made up mainly of adults aged 25-49 with multiple health problems (including poor mental health and disability) and usually not looking for work. Members of this group are likely to have been out of work for a long time or to have never worked, and are much less likely than other residents to find work. Most have dependent children and low qualifications. Members of this group are likely to be claiming ESA and may also be receiving Disability Living Allowance. Those with dependent children may be eligible for Child Tax Credit. This group makes up 10% of out-of-work social housing residents.
Findings from qualitative research
Harold is a single, white British man aged 47 who has been out of work for 10 years, due to a variety of serious health issues. He finds job searching frustrating and depressing, sometimes debilitating.
“Companies just don’t want to give you a chance”.
He has been actively looking for work as well as undertaking various qualifications. He would ideally like to work in security, so is currently doing a four week work placement as a security guard.
“I think you need to work, like mentally it’s the best thing to have that self worth”.
-0.50-0.40-0.30-0.20-0.100.000.100.200.300.400.500.60Entering work
Remaining worklessFemale
age 25-49 yrs
age 50-64 yrs
Dependent children
1 child
2 children
3 or more children
Married, living as couple
Separated etc.
Not disabled
One health problem
Two health problemsThree or more health problems
Mental health problemNo sickness, disability benefit
Health limits kind of work
Unemployed
Inactive, seeking
Inactive, nt seeking, lk after family
Inactive, nt seeking, sick or disabled
Inactive, nt seeking, retired
out of work 1 year but less than 3 years
out of work 3 years but less than 5 years
out of work 5 years or more
out of work Never had paid job
quals Intermediate qualifications
quals Low/other qualificationsquals No qualifications
Group 2 Social housing residents average

Social housing, worklessness and welfare
34
He says that he has received good support from a number of organisations.
“They have all been great, I feel prepared but it’s frustrating still because I need someone to give me a chance”.
He considers that his main barriers are his lack of references and the length of time that he has been unemployed.
“If no one gives me a chance, how will I get experience?”
“These young healthy lads are getting the jobs, with references and stuff, I haven’t got a chance”.
Liz is a White British 29 year old woman who is currently employed, but on long term sick leave due to severe hip problems. She has had contact with Jobcentre Plus before, but did not feel that she received adequate support. She applied for ESA but was assessed as being fit for work, and subsequently returned to work. However she said that this “made my disability 20 times worse”, and after dislocating her hip she left work and is now claiming ESA.
“I can't even bend down to cut my toe nails, but they don’t understand that”.
Liz says that she wants to work, and that “I've always had a job”. She is keen to return to work, but sees her health problems and lack of employment support as the key barriers.
Respondents in this group tended to strongly agree with the following statements:
Having almost any type of paid work is better than not working.
Being in paid work allows you to contribute properly to society.
Having paid work makes you a better role model for those close to you.
They tended to strongly disagree with the following statements:
− I am very happy with my life as it is.
− The idea of not finding paid work fills me with dread.
− Telling people you are not working would be embarrassing.

Social housing, worklessness and welfare
35
What works?
4.9 Across all four of the groups described in this Chapter, research points to the critical importance of personalised, intensive, face to face support.8 Typically, this includes support to:
Prepare for work – building confidence and motivation, setting goals, referral to specialist support, preparing for interviews and applications
Look for work – assessing skills and capabilities, understanding where and how to look, support to then find jobs, overcoming setbacks/ maintaining confidence
Get into work – through engaging employers and then brokering between them and candidates, supporting with application processes
Stay in work – particularly through the first few days and weeks
4.10 Good quality adviser support typically involves regular contact. It usually combines both rights and responsibilities – with support being conditional on engagement. Adviser support was also identified by participants in this research as their key support need, and has been the mainstay of the support offered in employment services and by housing associations.
4.11 However, there is also a broad consensus that personal adviser support is often not enough. The group described above are particularly likely to be out of work due to ill health or disability, and to have low or no qualifications. Taking those in turn, research by Inclusion last year9 pointed to a number of lessons around support for disabled people or those with health conditions.
There is strong evidence that ‘Supported Employment’ can lead to significant positive impacts. This model is built around holistic and intensive engagement by a specialist adviser with the participant and
8 See Hasluck, C. and Green, A. (2007) What works for whom? A review of evidence and meta-analysis for the Department for Work and Pensions, Department for Work and Pensions Research Report 407; Martin, J. and Grubb, D. (2001) “What Works and for Whom: A Review of OECD Countries’ Experiences with Active Labour Market Policies”, Swedish Economic Policy Review, Vol. 8, No. 2 9 Purvis, A., Foster, S., Lanceley, L. and Wilson, T. (2014) Fit for Purpose: Transforming employment support for disabled people and those with health conditions, Centre for Economic and Social Inclusion

Social housing, worklessness and welfare
36
with those around them; vocational profiling; rapid job matching with supportive employers; and then extensive support in work.
Specialist support is important, tailored to the needs of those with specific impairments – especially sensory impairment, musculoskeletal conditions, learning disability and mental health. This can include support from specialist advisers, as well as specialist interventions (like condition management) or equipment (like assistive technology).
Research also points to a different model of employer engagement – with a greater focus on working with employers to support employees in work, as well as support to fill vacancies and grow their business.
There may be a role for well-designed ‘intermediate labour market’ models (ILMs) – which create temporary employment with structured support to move into unsubsidised work. However these are relatively expensive, so need to be well targeted.
Finally, the evidence points to the importance of effective partnership working – and in particular drawing together support across health, employment, skills, housing and social services or support.
4.12 For the lowest qualified, the evidence is often more mixed. In a review of what works for poorly qualified young people10, Inclusion found that training programmes can often have poor results – as they may not be targeted at what employers need, and may lead to people spending less time looking for work. However, programmes appear to be more effective where they are: tightly targeted on those with greatest need; relatively small in scale; linked to employers; and linked to wider support.
4.13 More generally, evidence suggests that having low qualifications is often an indicator of other disadvantages – like poor work histories, disability, older age, being a lone parent and so on.11 The interviews conducted for this research also found that residents with low qualifications often reported that their main barriers included time out of work, lack of work experience, age and ill health.
10 Wilson, T. (2013) Review of training for unemployed young people, Department for Business, Innovation and Skills 11 Research on these links, in the context of the characteristics of other disadvantaged groups, is well summarised in Hasluck, C. and Green, A. (2007) What works for whom? A review of evidence and meta-analysis for the Department for Work and Pensions, Department for Work and Pensions Research Report 407

Social housing, worklessness and welfare
37
Group 4 – Long-term workless mothers with health problems
This group is made up of women with three or more health problems, who have been out of work for over five years and tend to be looking after their family. They are likely to have worked in the past, but to have been out of work for a long time. Their health problems are unlikely to include poor mental health, but may limit their ability to work. They will usually have some qualifications – either low or intermediate level. This group is among the least likely to enter work. Members of this group are likely to be claiming JSA or ESA if they have a partner who is also out of work, or Income Support for Lone Parents if they are separated. They will likely also claim Child Tax Credit. This group makes up 7% of out-of-work social housing residents.
Findings from qualitative research
Jenny is a white 32 year old woman who suffers from asthma and who has been out of work while raising her two children. She used to be a care assistant but has been out of work for eight years now.
“It’s been good being with the kids, but now I need the money”
-0.30
-0.20
-0.10
0.00
0.10
0.20
0.30
0.40
0.50Entering work
Remaining worklessFemale
age 25-49 yrs
age 50-64 yrs
Dependent children
1 child
2 children
3 or more children
Married, living as couple
Separated etc.
Not disabled
One health problem
Two health problemsThree or more health problems
Mental health problemNo sickness, disability benefit
Health limits kind of work
Unemployed
Inactive, seeking
Inactive, nt seeking, lk after family
Inactive, nt seeking, sick or disabled
Inactive, nt seeking, retired
out of work 1 year but less than 3 years
out of work 3 years but less than 5 years
out of work 5 years or more
out of work Never had paid job
quals Intermediate qualifications
quals Low/other qualificationsquals No qualifications
Group 4 Social housing residents average

Social housing, worklessness and welfare
38
She is currently looking for evening work as she can only work when her partner gets home.
“I’ve been going round shops but once I say I have children they aren't interested”
She has received a range of support from her housing association, which she has welcomed.
“She’s building my confidence up more, because I haven’t worked for such a long time... Doing interviews is what I'm mostly scared of”
When her youngest son reaches school age she will begin looking for full time work. She says that she would then like more face-to-face support to help build her confidence.
“Seeing people face to face is important, so they can see me for who I am”
Gemma is a White British 28 year old woman who has never worked due to having children at a young age. Now that they are older she is very keen to start working. Her main barrier to work is the responsibility of childcare but she is willing to go back into work.
“It’s been very depressing”
Child support is an area in which she would like more support.
“It’s hard because I can’t afford childcare what would I do in the holidays, who would pick them up from school'”
However she has been happy with the help received from her housing association.
“[My landlord] have been good at getting me out there and being proactive... They have calmed a lot of my worries, made me more confident, said I can work flexible hours so I can watch the kids – it makes me feel a bit better”
She is due to start a two week work placement with an international retail store and is hoping this will lead to a paid job.
“I have just done two days training for [name of company] so hopefully I can get a job in retail”
“I do feel confident now, I feel like I'm a people person, I would be hard working, I don't see what would stop me from working”

Social housing, worklessness and welfare
39
Respondents in this group tended to strongly agree with the following statements:
It is important to me to earn my own money rather than rely on benefits.
Having paid work makes you a better role model for those close to you.
Having paid work is an essential part of life.
They strongly disagreed with the following statements:
− Having paid work is more hassle than it’s worth.
− The people who depend on me would rather I wasn’t in paid work.
− Telling people you are not working would be embarrassing.
What works?
4.14 The evidence on support for parents again points to the importance of effective one-to-one, adviser support that is tailored to their needs. Of particular importance for parents who have been out of work for some time appears to be helping with rebuilding confidence, looking for work (particularly part-time and school-time work12), updating or obtaining new skills and helping to overcome challenges around childcare and the flexibility of employers.13 The evaluation of lone parent work-focused interviews in Jobcentre Plus also underlined the importance of having a menu of additional support that advisers could refer to, particularly around childcare.14
4.15 There is mixed evidence on the effectiveness of training and skills acquisition for mothers returning to work. A meta-analysis of programmes in the US15 found consistent positive results for poor adult
12 Sims, L., Casebourne, J., Bell, L. and Davies, M. (2010) Supporting lone parents’ journey off benefits and into work: a qualitative evaluation of the role of In Work Credit, Department for Work and Pensions Research Report 712 13 Casebourne, J. and Britton, L. (2004), Lone parents, health and work, Department for Work and Pensions Research Report 214 14 Hasluck, C. and Green, A. (2007) What works for whom? A review of evidence and meta-analysis for the Department for Work and Pensions, Department for Work and Pensions Research Report 407 15 Stanley M., Katz L.F., Krueger A.B..” Developing Skills: What We Know About the Impact of American Employment and Training Programs on Employment, Earnings and Educational Outcomes” G8 Economic Summit, 1998

Social housing, worklessness and welfare
40
women, particularly lone parents, and particularly through on-the-job training.
4.16 Available UK evidence is less conclusive however: education and training options on the New Deal for Lone Parents were associated with a lower chance of finding employment (although this may be due to the unobserved characteristics of those referred), while only a minority of lone parents participating in Work-Based Learning for Adults cited lack of skills as a barrier to work (which again is consistent with findings from qualitative interviews for this research).16 By contrast however, a pilot scheme within which lone parents could access an NVQ Level 3 qualification in childcare, or a sector within which there was an identified skills shortage, appeared to have very positive impacts on entry into work.17 This suggests that returning parents may benefit most from training that is formal, sector-specific and leads to qualifications where there is local demand (including in sectors with flexible opportunities).
4.17 Finally, there is evidence18 that returning parents can often struggle with making the transition back into work. So in-work support is particularly important for this group – including financial support to help with the transition to work, having regular contact with an adviser (in person or by phone) and support to the employer. Evidence also suggests that lone parents may continue to need support to find more suitable, less physical, less stressful or more flexible jobs.19
16 Anderson, T. and Pires, C. (2004), Lone Parents and Work Based Learning for Adults, Department for Work and Pensions 17 Thomas, A. and Jones, G. (2006), Work Focused Interviews and Lone Parent Initiatives: Further Analysis of Policies and Pilots, Department for Work and Pensions Research Report 319 18 Griffiths, R., Durkin, S and Mitchell, A (2005) Evaluation of the single provider Employment Zone extension. Department for Work and Pensions. Research report 312 19 Casebourne, J. and Britton, L. (2004), Lone parents, health and work, Department for Work and Pensions Research Report 214

Social housing, worklessness and welfare
41
Group 7 – Low qualified and out of work a long time
This group comprises low qualified residents, again aged 25-49, likely to have a couple of health problems and to have been out of work for more than five years. Members of this group are slightly more likely than average to have a mental health problem. They are somewhat more likely to be men than women, and relatively less likely to have children than those in other groups. Members of this group are slightly less likely to enter work than other residents. They are likely to be claiming ESA or JSA, depending on the extent of their health conditions, and may receive Disability Living Allowance. This group makes up 5% of out-of-work social housing residents.
Findings from qualitative research
Sunita is a British Asian, 43 year old female. She is a single parent and has never worked, but is actively looking for work now.
“I don’t mind now, if I can’t get health and social care [jobs] I will do anything... I really need to work now”
She thinks it is realistic for her to find work, but she is not very confident with the English language.
“I used to have no confidence, but I've built myself up and my skills so hopefully it will get better”
-0.60
-0.40
-0.20
0.00
0.20
0.40
0.60
0.80Entering work
Remaining worklessFemale
age 25-49 yrs
age 50-64 yrs
Dependent children
1 child
2 children
3 or more children
Married, living as couple
Separated etc.
Not disabled
One health problem
Two health problemsThree or more health problems
Mental health problemNo sickness, disability benefit
Health limits kind of work
Unemployed
Inactive, seeking
Inactive, nt seeking, lk after family
Inactive, nt seeking, sick or disabled
Inactive, nt seeking, retired
out of work 1 year but less than 3 years
out of work 3 years but less than 5 years
out of work 5 years or more
out of work Never had paid job
quals Intermediate qualifications
quals Low/other qualificationsquals No qualifications
Group 7 Social housing residents average

Social housing, worklessness and welfare
42
Sunita feels that her main barriers to work are her lack of work experience and language barriers.
“Sometimes when I try to explain to somebody I get muddled up”
“I just couldn’t talk with them properly”
She is currently on the Work Programme and is happy with the support that she has received – although she would like to have more personal, tailored support.
“I felt like they did listen to me and sent me on the right course... [but] I want someone to help me and also tell me what training I need'”
Thura is an Asian Burmese 42 year old male. He does not speak English and has no formal qualifications. He feels that there is a lot of competition already in the job market in the area where he lives, which has also affected his confidence to look for work. He regularly attends Jobcentre Plus, looks on the internet for jobs and goes to places where he thinks he has a chance to find a job. However, he does not feel that it is realistic for him to find a job right now. He is attending English courses, but also thinks that this is taking a lot of his time away from finding a job.
Overall, Thura was very anxious about his financial situation and prospects. He felt that even if he started work, it would not be enough to cover his bills and allow him to take care of his six children.
Respondents in this group tended to strongly agree with the following statements:
Having almost any type of paid work is better than not working.
It is important to me to earn my own money, rather than rely on benefits.
Society looks down on people who don’t work or who are on benefits.
They strongly disagreed with the following statements:
− I enjoy life and don’t worry about the future.
− The people who depend on me would rather I wasn’t in paid work.
− The idea of not finding paid work fills me with dread.

Social housing, worklessness and welfare
43
What works?
4.18 This group is particularly characterised by people who have been out of work for a long time. So as well as the findings presented for other groups, the evidence suggests that long-term worklessness can itself lead to greater disadvantage20. This is for four reasons:
Loss of confidence and motivation – with repeated setbacks making it harder for individuals to remain positive about finding work
Loss of skills – with workplace skills and job-specific skills becoming less relevant as more time passes
Loss of networks – missing out on the opportunities that come up from being in work or close to work
Employer discrimination – with evidence that employers sift out applicants who have gaps in their employment
4.19 Addressing these barriers points to similar interventions and support as has been described elsewhere – indeed much of the best evidence on ‘what works’ is specifically from programmes targeting the long-term unemployed. So intensive and work-focused support from a coach or adviser appears to be key, with direct work experience, pre-employment training and financial support all playing important roles.21 Evidence suggests that direct work experience can play a particularly important role, as it can help to address risks of employer discrimination (by demonstrating that someone is ‘ready to work’) while also building confidence and improving workplace skills.22
4.20 For those longest out of work, there is evidence.23 that wage subsidies, subsidised jobs and direct job creation (including through Intermediate Labour Markets) can be effective – but also expensive.
20 Hasluck, C. (2011) Employers and the recruitment of unemployed people: An evidence review, UK Commission for Employment and Skills Briefing Paper 21 Hasluck, C. and Green, A. (2007) What works for whom? A review of evidence and meta-analysis for the Department for Work and Pensions, DWP Research Report 407 22 See for example “Early impacts of work experience”, Department for Work and Pensions, April 2012 23 Martin, J. and Grubb, D. (2001) “What Works and for Whom: A Review of OECD Countries’ Experiences with Active Labour Market Policies”, Swedish Economic Policy Review, Vol. 8, No. 2

Social housing, worklessness and welfare
44
Group 10 – Older people with poor mental health
This group is made up of older adults aged 50-64 with poor mental health. They are the least likely to enter work, and are usually not looking for work because of their health problems. Many have been out of work for more than five years. They are likely to have dependent children and above average qualifications. Members of this group are likely to be claiming ESA. Many will also likely be claiming Disability Living Allowance. This group makes up 4% of out-of-work social housing residents.
Findings from qualitative research
Nicola is a white British female aged 57, who left her job four months ago due to mental health issues and feeling uncomfortable at work.
“I felt like I was bullied out of that job”
She does not like being out of work and has been actively looking for work – through her social networks and by approaching local shops.
“I absolutely hate it, it’s made my depression worse”
“Oh yes I need to work, for peace of mind more than anything”
She suffers from psoriasis, which affects her confidence when looking for work, and also depression, which at the moment seems under control.
“I don’t know if it’s all in my head or what but I feel like people treat me differently”
-0.40
-0.20
0.00
0.20
0.40
0.60
0.80Entering work
Remaining worklessFemale
age 25-49 yrs
age 50-64 yrs
Dependent children
1 child
2 children
3 or more children
Married, living as couple
Separated etc.
Not disabled
One health problem
Two health problemsThree or more health problems
Mental health problemNo sickness, disability benefit
Health limits kind of work
Unemployed
Inactive, seeking
Inactive, nt seeking, lk after family
Inactive, nt seeking, sick or disabled
Inactive, nt seeking, retired
out of work 1 year but less than 3 years
out of work 3 years but less than 5 years
out of work 5 years or more
out of work Never had paid job
quals Intermediate qualifications
quals Low/other qualificationsquals No qualifications
Group 10 Social housing residents average

Social housing, worklessness and welfare
45
She has been receiving support from her landlord and was due to visit Jobcentre Plus at the time of her interview.
“So far [my landlord] has been wonderful... always saying come in and have a chat, helped me sort out my benefits, I don’t know where we'd be if it wasn't for them”
Thomas is a single male aged 51 who has epilepsy. He has recently left hospital. He would like to have a job but thinks it will be difficult due to his health and medication. This is compounded by living in a rural area – where there are relatively few jobs, and from where he cannot travel far due to his ill health.
He has received help to look for work from his library, but little else.
Respondents in this group tended to strongly agree with the following statements:
Society looks down on people who don’t work or who are on benefits.
There is little I can do to change my life.
Having paid work is more hassle than it’s worth.
They strongly disagreed with the following statements:
− You get more respect from friends by not working than doing a job beneath you.
− The idea of not finding paid work fills me with dread.
− I am very happy with my life as it is.
What works?
4.21 We know that barriers for older people often include poor health, a lack of workplace skills (including IT and team skills), a lack of recent work experience, concern around benefits and pension entitlements, negative experiences of employment support and lack of knowledge of what help is available. To compound this, older people are often lower skilled than the jobs available, reflecting changes in the jobs market in recent decades.24
24 L. Cappellari et al, Labour market transitions among the over-50s, DWP Research Report 296

Social housing, worklessness and welfare
46
4.22 Research conducted by Inclusion for Age Concern25 identified many similar barriers, as well as issues around age discrimination and older unemployed people feeling like they wouldn’t ‘fit in’ to modern work environments. The research also found that older jobseekers were more reluctant than younger jobseekers to take short-term or temporary jobs.
4.23 However, there is very little evidence on what may work for older people who are significantly disadvantaged in the labour market, as most employment programmes for older people tend to focus on those closer to work. What research does exist points to similar themes as presented elsewhere, in particular:
The importance of good quality personal adviser support, especially from advisers with experience of working with older people and with helping people to access appropriate, quality jobs.26
Targeted skills and training support – in particular around IT, jobsearch and workplace skills. There is evidence that same-age group sessions may be more effective than mixed age groups.27
Confidence building – with the evidence from the New Deal programme for those aged over-50 suggesting that those who benefited most from the programme were those with the most confidence and the strongest commitment to finding work28
Employer engagement – to address the real or perceived risks of discriminating against older people
4.24 There is stronger evidence on support for those with mental health conditions. Recent work by the OECD points to the importance of engaging with people early in their unemployment; partnership working between health and employment services; integration of psychological
25 Lane, P and Franceschelli, M., (2010) Over 50s Self-Advocacy Employment Project: Evaluation Report 26 Kirkpatrick, A. (2012) How ready is Jobcentre Plus to help people in their 60s find work?, Department for Work and Pensions In House Research 11 and Cappellari, L. et al (2005), Labour market transitions among the over-50s, DWP Research Report 296 27 Ibid 28 Atkinson, J. (2001), Evaluation of New Deal 50plus: ESR92.

Social housing, worklessness and welfare
47
therapies with employment support; personalised and tailored adviser support; and peer-led, group based work. 29
4.25 Individual Placement and Support (IPS), a form of Supported Employment, combines many of these elements and has delivered impressive results. Studies in the US30 and Europe31 have compared IPS models with traditional approaches to vocational rehabilitation (‘train then place’ models) and found that IPS is twice as effective in supporting participants to achieve employment – with typically more than half of participants securing employment.
4.26 IPS emphasises supporting participants to get into work as quickly as possible, with then a lot of intensive support to the individual and the employer to make that a success. It has seven key features32:
A focus on competitive, unsubsidised employment as the primary goal;
Voluntary access, open to all who wish to take part;
Personalised jobsearch support, based on the individual’s preferences;
Rapid jobsearch – usually within one month of engaging;
Joint working between employment specialists and clinical teams;
Personalised support to the individual and employer, without time limits; and
Support with accessing benefits.
29 OECD (2014) Mental Health and Work: United Kingdom, OECD 30 Bond, G.R., Drake, R.E. and Becker, D.R. (2008) “An update on randomized controlled trials of evidence-based supported employment”, Psychiatric Rehabilitation Journal, 31, 280-289 31 Burns, T., Catty, J., Becker, T. et al. (2007) “The effectiveness of supported employment for people with severe mental illness: A randomized controlled trial”, The Lancet, 370, 1146-1152. 32 Taken from “Doing what works: Individual placement and support into employment”, Sainsbury Centre for Mental Health, Briefing 37, 2009

Social housing, worklessness and welfare
48
5 Supporting residents: options and recommendations
5.1 Chapters 2 to 4 set out the extent and nature of labour market disadvantage amongst social housing residents. It finds that residents are more likely to have been out of work for a long time, more likely to have poor health, disability and other labour market disadvantages, and more likely to claim benefits. We identify particular disadvantage amongst four groups: those with health problems, workless mothers, those out of work the longest and older people with poor mental health.
5.2 The qualitative interviews with residents reiterate that often these groups have low confidence, have had negative experiences of work, and have had either little recent employment support or generally poor experiences. The one exception to this was where residents had been supported by their social landlord – where they often spoke very highly of the support they had received, its personalised and supportive nature, and the quality of the help to find work.
The role of housing associations
5.3 By providing secure accommodation at sub-market rents, housing associations can improve work incentives, by enabling individuals to achieve higher financial gains from taking up work or taking on more working hours.
5.4 Housing associations are also playing an increasingly important role in supporting residents to prepare for and look for work, by investing in helping to create strong, vibrant communities and support the health and wellbeing of their residents. Housing associations are in a strong position to contribute to the employment and skills agenda because they:
They have a unique relationship with their residents.
They operate in some of our most deprived areas.
They take a long-term approach to working with their residents and the communities in which their homes are based as part of their general social purpose.

Social housing, worklessness and welfare
49
They are major employers in their own right, with established supply chains which can provide further employment opportunities.
They have an investment in the success of their employment, training and skills programmes.
They have a good understanding of the local employment market and strong relationships with other organisations across both the public and private sector
They use their own resources as well as attracting investment from partners.
5.5 A secure and decent home is often the starting point to helping people back into work. However as we have shown unemployment is significantly higher amongst housing association residents, many of whom face multiple barriers to employment. As social enterprises with a commitment to investing in economically and socially healthy and resilient communities many housing associations are already actively engaged in the employment and skills agenda.
39% of housing associations currently offer employment and skills support with a further 28% planning to do so in future
32% of housing associations see supporting their residents, and the wider community, into employment, education or training as a top priority33
5.6 Housing associations have developed a range of approaches to help their residents become ‘work ready’, to support them in accessing existing employment and training opportunities, and bring new training and employment opportunities to the communities where they operate. Through having a good understanding of the needs and circumstances of the individuals and families living in their properties, and of the local employment market and partner agencies operating in their communities, housing associations are able to offer bespoke employment, education and training services.
33 IPSOS MORI, National Housing Federation commissioned research, October 2014

Social housing, worklessness and welfare
50
5.7 Those housing associations engaged in employment and skills carry out a range of activities and programmes in partnership with each other, local councils, local enterprise partnerships, employment services providers, training and skills providers. They leverage in a range of funds to support this work, including from their own resources, and in some cases are sub-contracted through the Work Programme or make use of Skills Funding Agency contracts with partner agencies.
5.8 Housing associations are major employers in their own right, with established supply chains which can also provide employment opportunities. Housing associations have a big impact on jobs and the economy. Currently, housing associations employ more than 155,000 people and the economic impact of housing associations is worth £13.9bn a year to England’s economy. Between 2011 and 2015, housing associations will have built over 170,000 new affordable homes, generating almost £18.4bn in the economy and supporting over 390,000 jobs34.
Doing what works – options appraisal
5.9 In going further, we have identified nine possible interventions that could help to increase employment and reduce disadvantage for social housing tenants. These have a particular focus on the four most disadvantaged groups identified in Chapter 4. They are potential options intended as measures that could be designed and implemented by landlords, by central government, or by a combination of the two – for example through future reforms to the Work Programme or through European Social Fund investment. There may also be the potential to develop social impact bonds for those measures that have strong fiscal benefits (where investors provide up-front funding in return for a share of future savings).
5.10 Five of the policy options are explored in more detail below. We have presented indicative cost-benefit figures for each. This uses a Cabinet Office-certified tool designed by New Economy Manchester, which follows the approach for estimating costs and benefits that is set out in the DWP Cost-Benefit Analysis Framework. The model has been further refined by Inclusion to incorporate a costs calculator developed internally.
34 Estimates using CEBR’s (2013) Economic impact database of affordable housing and day-to-day operations of housing associations, for the National Housing Federation

Social housing, worklessness and welfare
51
5.11 We have presented indicative total costs, impacts, the ‘net present value’ (NPV) and a benefit-cost ratio (BCR). The NPV is a simplified way to present the net benefit or cost of an intervention in constant prices (i.e. taking account of how the value of money changes over time). The BCR describes the net cost or benefit per pound of investment – we have categorised these as Low, Medium and High in each proposal.
5.12 For individual measures, we have only presented the fiscal benefit-cost ratios – that is, the direct fiscal savings compared to costs. In summing up, we also present the overall economic benefits (that is, those accruing to the economy from higher growth due to higher employment). We have assumed in each case that programmes run for two years, and we present the two-year figures for caseloads, costs and impacts. The modelling tool then measures fiscal and economic benefits over a five year period.
5.13 The model is highly dependent on the assumptions made when specifying costs and benefits to each programme, which are set out for each option. In particular, it is important to note that this model does not capture Tax Credits or Housing Benefit expenditure. This is consistent with the approach taken in a range of analyses including by central government, but means that benefit savings may be under-estimated overall.
5.14 Following the descriptions of the five policy proposals below, we then briefly summarise the four further measures that were not taken forward for detailed design, before making a number of cross-cutting recommendations on future employment and welfare support.

Social housing, worklessness and welfare
52
1. ‘Skills Academies’ – work-focused training and work experience
Summary
Combined work-focused training followed by a work experience placement, leading to a guaranteed job interview. Open to all workless tenants, but targeted on those with training and re-training needs (including the lowest qualified and those returning to work).
Target group
5.15 We propose that this could be available to all workless tenants, but would primarily be taken up by those with skills needs – specifically, those with low qualifications, or those whose skills are out of date. This is therefore intended in particular to support Group 2: Prime age adults with health problems and Group 7: Low qualified and out of work a long time.
Evidence base and rationale
5.16 As Chapter 4 sets out, there is relatively little high quality research evidence on the effectiveness of training for those who are out of work and who have poor qualifications. The proposal here builds on the evidence from the Inclusion research for the Department for Business Innovation and Skills35 which found that effective interventions: were relatively small in scale, were strongly focused on employment needs, involved employers in their delivery, had a focus on making a transition to work, and included more holistic/ ‘wraparound’ support.
5.17 The proposal is similar to the ‘Sector Based Work Academies’ model that has operated through Jobcentre Plus since 2011, which combines work-focused training with work placements and (where possible) a guaranteed job interview. However, their model is largely limited to Jobseeker’s Allowance claimants. It is important to note that ‘Sector Based Work
35 Wilson, T. (2013) Review of training for unemployed young people, Department for Business, Innovation and Skills, Research Report 101

Social housing, worklessness and welfare
53
Academies’ has not been evaluated and its impacts are unknown. However, it is reasonable to assume that its net impact would be at least in line with the impacts of adviser-led support (set out in proposal 3 below). We have also incorporated a slight uplift to take account of the greater intensity of support and the direct link to a job in this model.
Potential approach
5.18 Skills Academies could combine three elements:
A work-focused training placement, lasting six to eight weeks, with direct employer involvement in its design and delivery – this would likely have a focus on entry-level sectors that meet local demand, like personal caring, distribution, administrative roles, hospitality, retail
A work experience placement with that employer or one in the same sector
A guaranteed job interview, and/ or intensive jobsearch support to make the transition to sustained employment
5.19 Housing associations’ role could be to act as co-ordinators and brokers for the service – bringing together those with training budgets (colleges and independent training providers), employers and adviser services (including their own services where available). Alternatively, some landlords may themselves be the training provider – so providing ‘end to end’ support. There are a small number of examples of landlords currently providing Sector Based Work Academies in this way.
Costs and benefits
5.20 We estimate that from a total of 29,500 participants over the assumed two year programme period, almost 10,000 would find employment in a national programme – an overall success rate of 33.4%. Of these, we estimate that almost 2,000 jobs would be additional – i.e. extra employment that would not have happened if the support had not been available.
5.21 The model generates per-participant costs of £1,500, which are plausible for a programme of this type. Most of these costs would likely be eligible for funding through Adult Skills Budgets held by training providers, where

Social housing, worklessness and welfare
54
those are available. This generates total costs of £41.6 million over the programme period.
5.22 Against this, the model generates total fiscal benefits of £70.6 million over five years. This means that the programme more than pays for itself in fiscal terms, with a benefit-cost ratio of 1.70 and a net present value of £29.0 million.
5.23 77% of these benefits accrue to DWP through lower benefit expenditure, meaning that the programme would lead to direct additional savings in benefits of £54.4 million.

Social housing, worklessness and welfare
55
2. Jobs-Plus
Summary
A ‘saturation’ approach focused on tenants in targeted disadvantaged communities – combining on-site employment services; personal adviser support; peer mentors; and temporary financial incentives for work.
Target group
5.24 This type of approach would target all tenants in areas of high social housing receipt and high worklessness – and therefore all of the four Groups identified.
5.25 By definition, most of the participants would have the characteristics described in our research – many older people and lone parents, generally low skills, often claiming ESA or ISLP, and with other barriers to work. However, the Jobs-Plus model would not exclude tenants that are in work or closer to the labour market.
Evidence base and rationale
5.26 The ‘Jobs-Plus’ model was developed in the US and initially implemented in six cities from 1998 – as a partnership between welfare and employment agencies, housing authorities and tenants. The model combined three elements:
Employment and training services – with convenient on-site ‘job centers’ and trained specialist advisers
New rent rules to ‘make work pay’ – so that there is a clear (but time-limited) financial incentive for entering and staying in work
Community support for work – with neighbourhood and peer outreach (‘community coaches’)
5.27 Importantly, Jobs-Plus was a ‘saturation’ approach, supporting all tenants, not just those out of work. This meant that it could benefit from local economies of scale and could operate as a true ‘community’ service. However, wider eligibility increases the risks of ‘deadweight’ costs.

Social housing, worklessness and welfare
56
5.28 Where it was fully implemented, Jobs-Plus increased average earnings by 16 percent relative to a control group. These earnings gains persisted throughout the seven year follow-up period. This level of additionality is broadly in line with impacts for other adviser-led programmes, but it is unusual for impacts to persist for so long after an intervention.
5.29 This model would be well-suited to housing associations for three main reasons:
Our review has found high levels of worklessness in social housing and that these are concentrated in disadvantaged areas. Therefore a ‘saturation approach’ could work well, with lower risks of deadweight.
There is extensive existing and planned work that this could build on – both in terms of employment support and regeneration work.
Jobs-Plus is designed to provide a flexible, onsite service rather than a discrete programme – so it can fit or overlay existing provision.
Potential approach
5.30 A Jobs-Plus approach would have the following key features:
A place-based, ‘saturation’ approach open to all working age tenants in selected areas (we assume one fifth of those on DWP benefits).
Personal adviser support delivered on-site. This would make it easier to engage tenants, including those already in low-paid work.
Tapping social networks through ‘community coaches’. This would ensure that information comes from peers and neighbours, not just professional staff – which can help reinforce work-related norms.
Integrated housing and employment support, so that housing staff steer tenants towards employment support (and vice versa).
Financial advice and counselling – which would directly support preparation for rollout of Universal Credit (when the housing element will be paid directly to tenants).
Time-limited financial incentives for full-time work – we would propose £500 per person entering work, paid over the first six months.
Social housing, worklessness and welfare
57
5.31 Housing associations could potentially play an active role in the delivery of Jobs-Plus, although the nature and extent of that role may vary from place to place. In some cases, landlords that actively deliver employment and support services will want to deliver something close to an ‘end to end’ service. In others, the role may be more limited to delivering housing support and/ or specific interventions from the list above.
Costs and benefits
5.32 We estimate that from a total of 34,000 participants over the assumed two year programme period, almost 10,500 would find employment in a national programme – an overall success rate of 30.5%. Of these, we estimate that around 1,500 jobs would be additional.
5.33 The model generates per-participant costs of around £1,000. These costs would likely largely reflect the re-direction and repurposing of existing expenditure by landlords and partners. This generates total costs of £32.9 million over the programme period.
5.34 Against this, the model generates total fiscal benefits of £52.3 million over five years. This means that the programme more than pays for itself in fiscal terms, with a benefit-cost ratio of 1.59 and a net present value of £19.4 million.
5.35 80% of these benefits accrue to DWP through lower benefit expenditure, meaning that the programme would lead to direct additional savings in benefits of £41.9 million.

Social housing, worklessness and welfare
58
3. ‘Pathways to Employment’ – personal adviser-led, caseworker support
Summary
Intensive support to prepare for and find work, for those furthest from employment. Potentially focused on tenants with health problems or the longest out of work, who are least likely to be receiving other support.
Target group
5.36 We would propose that this be a voluntary programme, but with a strong focus on engaging those not currently accessing – or not benefiting from – other mainstream programmes. We assume that this is primarily targeted at those with health problems and those out of work the longest – so Group 2: Prime age adults with health problems, Group 4: Long-term workless mothers with health problems and Group 7: Low qualified and out of work a long time.
Evidence base and rationale
5.37 Chapter 4 sets out the extensive evidence on the effectiveness of good quality, professional adviser support. We consider that there are four tiers to effective support, which are summarised in Figure 5.1 below.

Social housing, worklessness and welfare
59
Figure 5.1 – Characteristics of effective adviser support
5.38 Currently, many disadvantaged claimants are mandated to join the Work Programme. However, Inclusion36 has shown that job outcomes for the most disadvantaged are well below rates overall. In addition, there is very little voluntary support available – with virtually no-one volunteering to join the Work Programme, and local support often struggling to reach those furthest from work.
Potential approach
5.39 We would propose voluntary, personal adviser-led, caseworker support targeted at housing association tenants on DWP benefits (‘Pathways to Employment’). This would be a voluntary programme.
5.40 The support would in particular need to:
36 “DWP Work Programme: How is it performing?” http://cesi.org.uk/responses/dwp-work-programme-how-it-performing-4

Social housing, worklessness and welfare
60
Focus on outreach and engagement – through community-based work, partnership with housing management and other agencies, and local and personal contact
Be tailored to the needs of specific groups identified within this research, particularly long-term workless people (where confidence building, workplace skills and quality job-matching are all likely to be key) and workless mothers (peer support, job preparation, quality childcare and bridging financial support are particularly important)
5.41 Social landlords would be well placed either to co-ordinate or deliver this support. Many landlords are currently delivering similar employment services.
Costs and benefits
5.42 We estimate that from a total of 30,000 participants over the assumed two year programme period, 5,500 would find employment – an overall success rate of 18.0%. This rate is lower than for other programmes, as we have assumed that the most disadvantaged will have lower hiring rates than the social housing population as a whole. Of these, we estimate that around 1,000 jobs would be additional.
5.43 The model generates per-participant costs of around £750. This is plausible for a well-designed adviser-led intervention. Again, it may be possible to meet these costs in many cases through existing spending by housing associations, or through re-prioritising resourcing that is currently directed through the Work Programme or will be available through the European Social Fund. This generates total costs of £20.8 million over the programme period.
5.44 The model generates total fiscal benefits of £25.5 million over five years. This means that the programme more than pays for itself in fiscal terms, with a benefit-cost ratio of 1.22 and a net present value of £4.7 million.
5.45 80% of these benefits accrue to DWP through lower benefit expenditure, meaning that the programme would lead to direct additional savings in benefits of £20.4 million.

Social housing, worklessness and welfare
61
4. Intermediate labour markets (ILMs)
Summary
Targeted creation of temporary jobs with additional support to provide a stepping stone to sustained, unsubsidised employment.
Target group
5.46 This kind of approach would be best targeted at the most disadvantaged tenants. ILMs have very high gross costs, and so tend to be highly targeted. It is therefore likely to particularly benefit those in Group 7: Low qualified and out of work a long time.
Evidence base and rationale
5.47 ILMs provide waged, temporary work for those who are long-term unemployed or otherwise disadvantaged. They tend to have high costs – as the programme pays the wages of participants as well as the costs of additional ‘wraparound’ support. There are also potential risks that participants could be worse off as a result of taking part (if they miss out on ‘real’ jobs whilst on their ILM) and that jobs elsewhere in the economy could be displaced by the ILM (because the ILM job is being subsidised).
5.48 Nonetheless, well-designed programmes can have significant positive impacts. For example the Future Jobs Fund, which ran from 2009 to 2011 and was targeted at long-term unemployed young people, increased the likelihood of participants being in employment by more than 20% compared with a matched comparison group37. This is a very large impact by the standards of employment programmes.
5.49 Separate research by Inclusion, which evaluated the the StepUp pilot, found the strongest positive impacts for adults who were highly motivated to work but had clear barriers to work such as low qualifications or poor
37 “Impacts and costs and benefits of the Future Jobs Fund”, Department for Work and Pensions, November 2012

Social housing, worklessness and welfare
62
work experience.38 This would suggest that an ILM model could be effective in tackling the significant barriers that some social housing tenants would face, where they are highly motivated to work.
Potential approach
5.50 We propose an ILM that would be tightly targeted on those out of work for longer durations. In principle, this could include those enrolled in the Work Programme or its successors, although in practice there would be significant demand from those who have either not entered that programme or have not secured a job through it. The design of the ILM would reflect the best practices from previous programmes. It would:
Be six months in length
Pay the equivalent of the National Minimum Wage for 25-30 hours a week (we have assumed on average £7 an hour)
Be jobs of community benefit, and additional to jobs already planned by that employer
Include wrap-around support to stay in work – coaching, confidence building, skills support and so on
Include on-the-job training, where possible leading to qualifications
Include transitional support to move into unsubsidised employment, with incentives for achieving that transition
5.51 Housing associations played a leading role in the delivery of the Future Jobs Fund. Through a partnership between the Federation and Groundwork, around 10% of all FJF jobs were created by housing associations – often working in community outreach, estates renewal and in support roles within associations. There is strong appetite among landlords to deliver similar services, notably evidenced through the ‘Proving Talent’ pilot that created waged temporary jobs for young people participating in the Work Programme39. It is highly likely that social
38 Bivand, P., Brooke, B., Jenkins, S. and Simmonds, D. (2006) Evaluation of StepUP Pilot: Final Report, Department for Work and Pensions Research Report No.337 39 Roberts, E. and Gardiner, L. (2013) Evaluation of the temporary jobs pilot: Proving Talent, Centre for Economic and Social Inclusion and Give Us a Chance Consortium

Social housing, worklessness and welfare
63
landlords would be ready to provide ILM opportunities for their tenants if funding were available.
Costs and benefits
5.52 All participants would be in paid employment for the duration of their ILM. During this time, they would be paid a wage instead of DWP benefits.
5.53 We estimate that from a total of 25,500 participants over the assumed two year programme period, around 8,000 would go on to secure sustained employment – an overall success rate of 31.2%. Of these, we estimate that nearly 1,500 jobs would be additional.
5.54 The model generates per-participant costs of £5,700. These are somewhat below the per-participant costs of the FJF (around £6,000). This would be sufficient funding to cover wages, administration and some support costs. This generates total costs of £138.4 million over the programme period. It is highly unlikely that this could be met by landlords from current budgets, and so would require new funding – for example from the European Social Fund.
5.55 The model generates total fiscal benefits of £154.0 million over five years. This means that it more than pays for itself in fiscal terms, with a benefit-cost ratio of 1.11 and a net present value of £15.6 million.
5.56 88% of these benefits accrue to DWP through lower benefit expenditure, meaning that the programme would lead to direct additional savings in benefits of £135.5 million.

Social housing, worklessness and welfare
64
5. ‘Return to Work bonus’ – targeted financial incentives
Summary
A payment of £750 to tenants that move off benefits and into work, targeted in particular at those with additional costs of employment (due to caring responsibilities or ill health).
Target group
5.57 We propose that this could be available to tenants that are out of work, disadvantaged and that have additional costs from returning to work – in particular due to childcare responsibilities or health conditions. Therefore this is particularly intended to support Group 2: Prime age adults with health problems and Group 7: Low qualified and out of work a long time.
Evidence base and rationale
5.58 Financial incentives for disadvantaged groups were a feature of employment support up until 2012. The Return to Work Credit was available for ESA and IB claimants, while a separate In Work Credit was available for lone parents. In both cases, the subsidy paid out up to £2,000 over a year, where jobs met certain eligibility criteria.
5.59 Both subsidies were ended in 2012, with the assumption that Universal Credit would be implemented concurrently and would serve the same purpose of improving incentives to enter employment40. The long delays to Universal Credit mean that financial incentives are now in fact worse than they were for these groups (and will continue to be so for a number of years), while in any case the financial incentives under UC are broadly similar overall to the ones that exist in the current benefit system (better for some claimants and worse for others).
40 “Universal Credit: Welfare that Works”, Department for Work and Pensions Command Paper 7957, November 2010

Social housing, worklessness and welfare
65
5.60 Neither the RtWC nor IWC were fully evaluated, so we do not know the additional impact, costs nor benefits of these measures. However we do know from qualitative research41 that recipients often welcomed the payments, that they were considered a help in bridging the transition to work, and that in some cases they may have been important in decision-making to enter work. This research also suggested that recipients often were not aware of the availability of subsidies, and that many would likely have entered employment with or without a subsidy (i.e. ‘deadweight’). This points to the need for careful design and targeting, as well as appropriate signposting by advisers.
Potential approach
5.61 We propose a more modest incentive, of on average £750, paid to those who enter employment within target groups and at adviser discretion.
Costs and benefits
5.62 We estimate that there would be 8,500 recipients of the incentive over the two year programme period. Of these, we estimate that around 1,500 of those entering work would be additional jobs.
5.63 The model generates per-participant costs of £1,100, which are above the £750 average subsidy due to assumed costs of promotion and management. This generates total costs of £50.3 million over the programme period.
5.64 Against this, the model generates total fiscal benefits of £52.1 million over five years. This means that the programme just about pays for itself in fiscal terms, with a benefit-cost ratio of 1. 03 and a net present value of £1.6 million.
5.65 77% of these benefits accrue to DWP through lower benefit expenditure, meaning that the programme would lead to direct additional savings in benefits of £40.1 million.
41 Sims, L., Casebourne, J., Bell, L. and Davies, M. (2010) Supporting lone parents’ journey off benefits and into work: a qualitative evaluation of the role of In Work Credit, Department for Work and Pensions Research Report 792; and Adam, S. et al (2008) A cost-benefit analysis of Pathways to Work for new and repeat incapacity benefits claimants, Department for Work and Pensions Research Report 498

Social housing, worklessness and welfare
66
Summary of costs and benefits
5.66 Drawing these five strands together, the overall costs and benefits of the package of options are summarised in Table 5.2 below.
Table 5.2 – Costs and benefits of proposed employment measures
Source: Inclusion analysis
5.67 Overall, across the five proposed measures, we estimate that:
• Total programme costs would be £285 million over two years;
• Government would save £355 million from this investment;
o Of which £292 million would be saved from the benefits bill;
• The programmes would generate a positive fiscal return of £70 million, net of costs – with a fiscal saving of £1.25 for every £1 spent;
• Nearly 130,000 people will benefit from additional support; and
• 42,000 will find employment, with 7,000 of these being additional jobs.
5.68 Our modelling also estimates that there would be an additional £214.6 million of economic benefits as a result of these measures. As with the principal modelling above, this uses the approach set out in the DWP Cost-Benefit Analysis Framework for valuing economic impacts.
Skills Academies Jobs-Plus
Pathways to Employment
Intermediate Labour Market
Return to Work Bonus Total
Beneficiaries 29,273 33,909 30,096 25,475 8,452 127,204 Jobs (total) 9,786 10,355 5,422 7,944 8,452 41,959 Jobs (additional) 1,957 1,428 904 1,324 1,409 7,022 Costs 41,612,422 32,934,984 20,806,367 138,391,330 50,503,262 284,248,364 Fiscal savings 70,633,935 52,327,813 25,463,194 153,987,017 52,123,017 354,534,976 Of which: DWP benefits 54,388,130 41,862,250 20,370,556 135,508,575 40,134,723 292,264,234 Net Present Value 29,021,513 19,392,829 4,656,828 15,595,688 1,619,755 70,286,612 Benefit-Cost Ratio 1.70 1.59 1.22 1.11 1.03 1.25
Social housing, worklessness and welfare
67
Further measures to increase employment
5.69 This research also explored a further four options for improving support for social housing tenants. These were not taken forward for more detailed design, but could merit further consideration. These are set out briefly below.
‘Working Families’
5.70 This option would test more integrated support for couples and families. It would be adviser-led, and join up with other family and social services.
5.71 This option was intended specifically to meet the needs of partners in households where no-one works – so Group 4: Long-term workless mothers with health problems (as well as parents in other groups). There are very few evaluations of partner/ family employment programmes, and no robust impact assessments for employment interventions. However, qualitative research suggests that the key features are:
Effective outreach – finding the right people
Joint engagement and sessions
Linking up with other services – particularly with the early evaluation findings of the Troubled Families programme pointing to the importance of integrated teams and lead caseworkers
Adviser-led support – with access to financial advice, skills, job preparation and other support
5.72 Evidence also suggests that couples that are out of work often have very similar levels of disadvantage to each other, and that they tend to move in the same direction (becoming more or less disadvantaged).
5.73 In practice, a new programme could look to build on existing provision through the Troubled Families programme, but extend it to bring in those in social housing and a long way from work. It could build on partnership working with local agencies (in particular Jobcentre Plus, local authority services and health agencies) and would focus on effective outreach, engagement, jobsearch support and active referral to specialist support.

Social housing, worklessness and welfare
68
Individual placement and support (IPS)
5.74 IPS is a very well-evidenced intervention for people with mental health conditions, described in more detail in Chapter 4. This would be particularly well targeted at Group 10: Older people with poor mental health, as well as those with mental health problems in other groups.
5.75 Extending IPS to more areas and more tenants would likely lead to significant benefits. However, IPS has tended in the past to be a relatively targeted intervention (specifically, on those in contact with secondary mental health services) so there may be challenges in extending its scope and reach.
Employer brokerage services
5.76 This option would comprise an employer-facing service to source vacancies and to place tenants into work. Employer services tend to underpin other active labour market policies, but recent years have seen an increased fragmentation within the sector. Jobcentre Plus employer services are increasingly centralised, while contractors within the Work Programme tend to compete with each other in sourcing vacancies and engaging employers.
5.77 There is very little evidence on the additional impact of effective employer engagement, but qualitative research suggests that key features of effective support include:
In-depth analysis of labour market needs
Outreach and engagement support
Case management of employers
Help with HR, business processes and management as well as recruitment
A new model of employer engagement could include:
Area-based team(s), working in partnership between landlords
Specialist ‘business to business’ support

Social housing, worklessness and welfare
69
A strong focus on recruitment into sectors with entry-level roles suitable for those with disadvantages
Linking up between employers and employment services/ other provision
Childcare services
5.78 Finally, we also explored the scope for provision or subsidy of childcare services for partners and lone parents returning to work – so targeting in particular Group 4: Long term workless mothers with health problems.
5.79 We know that access, affordability and flexibility of childcare are key barriers for lone parents and partners. We also know that there is increasing pressure on local services – driven by cuts in local government funding and market failures in the non-public sector – that can often make childcare too expensive or inflexible for those returning to work. There may be scope therefore for landlords to intervene – as providers of childcare, hosts for childcare facilities, or funders of provision.
5.80 Given the paucity of evidence on the costs and benefits of childcare interventions, this option was not worked up in detail. However there would be value in further exploration of the options here.

Social housing, worklessness and welfare
70
6 Conclusions and cross-cutting recommendations
6.1 To conclude, we make four recommendations.
1. Job seekers furthest from the labour market experience gaps in current employment and skills support. Government, landlords and other stakeholders should work together to reform existing programmes and introduce new initiatives to provide a comprehensive offer.
6.2 This research shows that around one fifth of all benefit spending is paid to support housing association tenants. Fewer than half of tenants are in work, with tenants more disadvantaged than those living in other tenures on a range of measures – for example they are more likely to be over 50, more than twice as likely to be disabled, nearly three times as likely to be lone parents and three times as likely to have mental health problems. We found particular combinations of disadvantage amongst those furthest from work – poor health, long-term worklessness, poor qualifications and detachment from looking for work – while qualitative research has found often poor experiences of employment support. The current system of employment support often either does not reach these disadvantaged tenants, or does not meet their needs.
6.3 We set out in this report a number of potential options for exploration by central and local decision takes which include; skills academies, jobs-plus, pathways to employment, intermediate labour markets and a return to work bonus. These should be explored further.
6.4 There is also an opportunity to reform existing contracted support programmes so that they more effectively meet the needs of all residents, including those furthest from the job market. The retendering of the Work Programme provides a timely opportunity for the government to consider reforms which should include an increased focus on the distance travelled, with payment arrangements not wholly focused on achieving and sustaining employment.
6.5 Finally, the forthcoming arrangements for Universal Support provide an opportunity to consider alignment and the role of housing associations in

Social housing, worklessness and welfare
71
delivery. One option could be for government to identify housing associations as a preferred partner for the delivery of Universal Support Services locally when allocating contracts for Universal Support services.
2. The current approach to ‘payment by results’ could be improved for those furthest from the jobs market to reward support that moves participants closer to work.
6.6 Analysis42 by Inclusion has shown that for the most disadvantaged groups in the Work Programme, a combination of ‘payment by results’ for employment outcomes, lower-than-expected performance and over-ambitious targets has led to a vicious cycle of low performance leading to lower funding which has then locked in low performance. It is highly likely too that the focus on employment outcomes as the only measure of success has contributed to more disadvantaged groups being ‘parked’ without access to the more intensive support that may enable them to stay close (or move closer) to work.
6.7 We consider that the research evidence strongly supports the need to measure success in terms of keeping people close to the labour market or moving them closer, as well as in terms of securing job outcomes. This points to the importance of including within any ‘payment by results’ model payments that recognise and reward efforts to support those further from work to move closer to work. There are challenges in doing this in a way that pays for ‘distance travelled’ towards work, but there is scope to link payments to those activities and ways of working that we know work (and that are set out in this report) – around intensive adviser support, specialist provision, well-targeted interventions and so on.
6.8 The segmentation revealed a number of groups further from the job market currently facing multiple barriers to employment. For these groups the current ‘payment by results’ model of only paying contracting organisations when someone is in sustained employment is not working.43 There is a strong case for measuring success in terms of moving people close to, or keeping them close to the labour market, as well as purely securing job outcomes.
42 Riley, T., Bivand, P. and Wilson, T. (2014) Making the Work Programme work for ESA claimants: Analysis of minimum performance levels and payment models, Centre for Economic and Social Inclusion
43 See: DWP, Work Programme evaluation: Findings from the first phase of qualitative research on programme delivery. 2012

Social housing, worklessness and welfare
72
3. Any future contracted employment support services should give contracting housing associations flexibility to determine their clients, allowing them to focus on those who live within their homes and communities.
6.9 Housing associations are uniquely well placed to provide employment support to people living within their homes and communities. Many are keen to deliver this work as part of their general social purpose and should have the opportunity to be formally involved in providing contracted services. Any revisions to existing employment programmes, or any new interventions (including those proposed in this report), must give housing associations contractors the flexibility to focus on those they house. This would enable them to target the support most effectively to have maximum impact and bring more people closer to the labour market.
4. Data and information sharing between Jobcentre Plus, providers of contracted employment support and housing associations should be facilitated to make the most of limited resources.
6.10 The segmentation demonstrates that a number of resident groups are facing multiple and combined barriers to entering work. Sharing information and data at a local level between contracted and non-contracted providers of employment support would enable limited resources to be targeted much more effectively. This would save money and ensure better outcomes for the service user, helping us achieve our shared ambition to support residents into employment and training.

Social housing, worklessness and welfare
73
Appendix 1 – Modelling benefit receipt and expenditure
Pages 11 to 13 set out our estimates for receipt and expenditure on working age, income-related benefits for residents of housing associations. More detail on the approach is set out below.
Scope
The scope of this modelling was the main income-related benefits paid to residents of housing associations of working age (16-64). Those benefits are:
• Income-based Jobseeker’s Allowance (JSA)
• Income-based Employment and Support Allowance (ESA)
• Income Support for Lone Parents (IS)
• Housing Benefit (HB)
• Tax Credits
We did not include contributory JSA or ESA, nor Disability Living Allowance or the Personal Independence Payment, as these are paid irrespective of income.
All estimates were produced for England only.
Estimating numbers in receipt of benefit
Stat X-Plore44 provides an exact administrative count of the number of households in housing associations that are in receipt of Housing Benefit in England. This source also provides us with an exact administrative count of those households in receipt of Housing Benefit and also income-based JSA, ESA or IS.
Therefore Stat X-Plore was used to estimate the numbers of recipients for these four benefits.
44 Available at: https://stat-xplore.dwp.gov.uk/

Social housing, worklessness and welfare
74
The estimates for JSA, ESA and IS may be an under-estimate, as they capture only those claimants that claim one of the three benefits and also claim Housing Benefit. However given that households in social rented accommodation that claim income-related DWP benefits are automatically entitled to Housing Benefit, any under-estimate is likely to be very small indeed.
Stat X-Plore also gives us an administrative count of those HB claimants that do not claim any of ESA, JSA or IS, and those that are ‘in work’ (defined as working more than 16 hours a week). These figures have therefore also been presented in the report.
For tax credits, the estimated number of households in receipt in housing associations was estimated as follows:
a) The 2011 Census (table DC4101EW - Tenure by household composition) gives us an estimate of 1.82 million households in England living in housing association homes
b) The Family Resources Survey 2012-13 (Table 3.5 – Households by tenure and state support receipt) estimates that 12% of all social rented households claim Working Tax Credit, and 26% claim Child Tax Credit. We have assumed that this proportion is the same in housing associations.
c) Applying this proportion to the Census household estimate gives us household estimates of 219,000 for Working Tax Credit and 474,000 for Child Tax Credit.
As set out in the report, it is important to note that individuals can claim both Working Tax Credits and Child Tax Credits at the same time, and can claim Child Tax Credits and DWP benefits at same time.
Estimating expenditure
Expenditure estimates for Housing Benefit were calculated using Stat X-Plore. This gives us a precise administrative estimate of weekly award amounts, which could be grossed up to an annual estimate both for those in work and out of work.
For JSA, ESA and IS, estimates were derived using published weekly benefit rates for those benefits, multiplied by the estimated number of participants above, again grossed up to give an annual figure. These estimates were adjusted to account for the known number of couple and single households claiming these benefits, and their different benefit rates.

Social housing, worklessness and welfare
75
For tax credits, expenditure was estimated as follows:
d) Total caseload and spending on tax credits is available from HMRC (Table 1.1 in ‘Child and Working Tax Credits Statistics: Finalised Annual Awards 2012-13’). This gives data for Great Britain level, broken down between Working and Child Tax Credit and in-work and out of work households.
e) There is no data available for England specifically – however we know from NOMIS working age client group data45 that 85% of claimants of DWP benefits in Great Britain reside in England – so this is a reasonable proxy for estimating tax credit volumes
f) HMRC data on caseloads and expenditure was therefore multiplied by 85% to give an England estimate
g) The estimated caseload claiming tax credits in housing association households in England (step (c) above) was divided by the estimated total England caseload (step (f) above) to give an estimated share of tax credits households that live in housing association properties
This estimated share was then multiplied by the estimated expenditure on tax credits in England (step (f)) to give estimated expenditure for housing association households in England.
These figures were then presented separately for in-work and out-of-work households, based on the shares between in- and out-of-work households in the HMRC data.
45 Available at: https://www.nomisweb.co.uk/


![hira.hope.ac.ukhira.hope.ac.uk/id/eprint/2113/1/Work Programme Article… · Web view‘WP’] has extended Labour’s policies, focusing on putative ‘intergenerational worklessness’,](https://static.documents.pub/doc/80x56/5a78ac427f8b9a1f128e8000/hirahopeac-programme-articleweb-viewwp-has-extended-labours-policies.jpg)

