Page 1
WORKPLAN FOR CHARACTERIZATION
OF SOIL LEAD AND MERCURY LEVELS IN SUPPORT
OF RISK ASSESSMENT
Anclote Key Lighthouse, Anclote Key, Pinellas County, Florida
Florida Department of Environmental Protection
Bureau of Waste Cleanup
Tallahassee, FL
January 18, 2013
Page 2
i
Table of Contents
1.0 Introduction ............................................................................................................... 1
1.1 Site History and Background Information ............................................................... 1
2.0 Sampling Methodology and Strategy ...................................................................... 2
2.1 Overview ............................................................................................................... 2
2.2 Sampling Objectives .............................................................................................. 2
2.3 Conceptual Site Model .......................................................................................... 3
2.4 Decision Units ....................................................................................................... 3
2.5 Number and Mass of Increments ........................................................................... 4
3.0 Sample Analysis ........................................................................................................ 5
3.1 Data Analysis ........................................................................................................ 6
4.0 Field Procedures for Sampling ................................................................................. 6
4.1 Soil Sampling for ISM ............................................................................................ 6
4.2 Discrete Sampling Procedures .............................................................................. 7
4.3 Equipment Decontamination in the Field .............................................................. 7
4.4 Field Sample Documentation ................................................................................. 7
4.4.1 Sample Identification and Documentation ..................................................... 7
4.4.2 Custody Seals .............................................................................................. 8
4.4.3 Chain-of-Custody Forms ............................................................................... 8
4.5 Field Activity Logs ................................................................................................. 8
4.5.1 Corrections in Field Activity Logs .................................................................. 9
5.0 Quality Assurance/Quality Control (QA/QC) ........................................................... 9
5.1 Field Operations ................................................................................................... 9
5.2 Control Parameters .............................................................................................. 9
5.3 QC Samples in the Field ....................................................................................... 9
6.0 Data Reporting........................................................................................................... 10
References ....................................................................................................................... 10
Figures
Figure 1. Designation of DUs ............................................................................................ 11
Figure 2. Schematic representation of the sampling grids for DU1 and DU2 .................... 12
Figure 3. Schematic representation of the proposed sampling coordinates within the grid
cells of Decision Unit 1 (DU1) for ISM ............................................................... 13
Figure 4. Proposed Decision Unit 1 (DU1), with 32 sampling grid cells ............................. 14
Figure 5. Schematic representation of the proposed sampling coordinates within the grid
cells of Decision Unit 1 (DU1) for discrete sampling .......................................... 15
Page 3
ii
Figure 6. Schematic representation of the proposed sampling coordinates within the grid
cells of Decision Unit 2 (DU2) for ISM ............................................................... 16
Figure 7. Proposed Decision Unit 2 (DU2), with 30 sampling grid cells, and the sampling
pattern. .............................................................................................................. 17
Figure 8. Schematic representation of the proposed sampling coordinates within the grid
cells of Decision Unit 2 (DU2) for discrete sampling .......................................... 18
Appendices
Appendix A Maps of Historical Sampling
Appendix B Incremental Sampling Checklist
Page 4
iii
ACRONYMS AND ABBREVIATIONS
ATON Aid to navigation
BWC Bureau of Waste Cleanup
CSM Conceptual site model
COC Contaminants of concern
DQO Data quality objectives
DU Decision unit
FDEP Florida Department of Environmental Protection
GPS Global positioning system
HASP Health and safety plan
HWS Hazardous Waste Section
ID Identification
ISM Incremental sampling methodology
LCS Laboratory control sample
MS Matrix spike
MSD Matrix spike duplicate
QA Quality assurance
QC Quality control
SCTL Soil cleanup target level
SOP Standard operating procedure
UCL Upper confidence limit
UF University of Florida
Page 5
1
1.0 Introduction
This workplan was prepared for the assessment of lead and mercury in soil at the
Anclote Key Lighthouse, Anclote Key, Pinellas County, Florida. The site is located in the
Anclote Key Preserve State Park and includes the lighthouse and surrounding
landscaped areas, as well as an adjacent residence for the Park Ranger. This workplan
describes data available historically for mercury and lead concentrations in soil and
provides a conceptual site model (CSM) from which potential exposure pathways have
been identified. The primary scope of the site assessment is to characterize
concentrations of lead and mercury in soil in the area northwest of the lighthouse and in
the residential area. These areas are being sampled because there are limited data
available regarding lead and mercury concentrations in soil there. Sampling efforts will
focus on the upper six inches of soil, although several deeper samples will also be
collected. The incremental sampling methodology (ISM) will be utilized because it has
been shown to provide highly reliable estimates of the mean concentration of soil
contaminants. Discrete sampling of soil in these areas will also be conducted for
comparison with incremental sampling. The ISM and discrete samples will be analyzed
for lead and mercury, and the grand mean and a 95% UCL will be calculated for
comparison to residential soil cleanup target levels. The areas to the east and south of
the lighthouse will not be sampled because lead and mercury concentrations in soil in
these areas are being addressed by AECOM.
On January 7, 2013 FDEP and UF held a teleconference regarding the
designations of the decision units (DUs), and on January 9th the FDEP planning team
met again to talk about various decisions to be made during the systematic planning
step. This work plan encompasses the discussions and agreements reached during that
teleconference and meeting.
1.1 Site History and Background Information
The Anclote Key Lighthouse is a cast-iron lighthouse constructed in the southern
area of the Anclote Key Island in 1887. The lighthouse was decommissioned as a
navigation light in 1985 and is currently part of the Anclote Key Preserve State Park,
located approximately three miles off the coast of Tarpon Springs. The paint used on
this lighthouse was lead-based paint, which has eroded and chipped with time. In the
1960s the lighthouse became a battery-powered lighthouse. Throughout the years the
casings from the depleted aid to navigation (ATON) batteries were discarded near the
tower or stored in buildings adjacent to the lighthouse.
An initial assessment of this site was conducted in 1994. At the time, 100
batteries were found and removed from the site. The assessment found lead and
mercury in soil at concentrations above their respective Cleanup Target Levels (CTLs),
thus making them contaminants of potential concern (COPCs). The source of the
mercury is presumed to be the batteries that were found at the site. No lead acid
batteries were found at the site during the 1994 reconnaissance, but there is the
Page 6
2
possibility that lead-containing batteries were discarded onsite. Another potential source
of lead in the soil is the lead-based paint used on the lighthouse.
The most recent sampling was conducted in October 2010, by AECOM to
continue delineating the extent of lead and mercury in soil. The soil concentrations were
evaluated using discrete sampling methodology. The surface soil (0-6 inches) results
obtained from this delineation event (appendix figures: Figure A1 and Figure A4) indicate
that further delineation of the contaminants is needed throughout, especially for the Park
Ranger residence and the area to the northwest of the Lighthouse.
2.0 Sampling Methodology and Strategy
2.1 Overview
Previous sampling events on the Anclote Lighthouse property investigated the
levels of lead and mercury in the soil using discrete sampling methodology. The data
obtained during the previous investigations indicate that further characterization of the
soil contaminants is necessary especially in areas of the property designated in this
workplan as DU-1 and DU-2 (Figure 1). Soil will be sampled in these areas using ISM.
The main goal of ISM is to obtain a mean analyte concentration representative of the
smallest volume of soil for which a decision needs to be made. This defined volume of
soil is specifically referred to as a DU. ISM is a systematic sampling protocol developed
in order to reduce data variability and provide a more reliable estimate of the mean
concentration of an analyte across an area/volume of concern. Inherent soil
heterogeneity and variation of the contaminant distribution in the soil often lead to
variability in measured analyte concentrations among discrete soil samples. ISM
addresses sampling error and controls data variability through a well structured
composite sampling protocol that involves planning, field collection of soil samples, and
laboratory processing and analysis procedures (Draft DEP ISM Guidance, 2012 and
ITRC, 2012). Using ISM, a better estimate of the grand mean for lead and a 95% UCL
for mercury concentration within the DUs slated to be sampled at the Anclote Key
Lighthouse area can be obtained to determine whether soil remediation/management is
needed.
2.2 Sampling Objectives
The purpose of this assessment is to build upon the previous site investigation in
order to obtain a reliable estimate of the grand mean and 95% UCL soil lead and
mercury concentrations as appropriate at the two DUs through ISM sampling. These
concentrations will be used to support an assessment of human health risk from existing
lead and mercury contamination. In the case of mercury, a 95% UCL will be derived
from replicate ISM samples for comparison with the default residential mercury CTL. In
the case of lead, uncertainty in the estimate of the mean from soil data is addressed in
the model relating soil lead concentration to blood lead concentration. Accordingly, a
grand mean of the lead concentrations from the three replicates rather than the 95%
UCL will be compared with the default residential lead CTL.
Page 7
3
For comparison purposes, 30-32 discrete samples will also be collected from each DU
with the mean or 95% UCL calculated for lead and mercury as appropriate.
.
2.3 Conceptual Site Model
The lead and mercury in the soil at the Anclote Key Lighthouse are believed to
originate from batteries that were discharged in the area surrounding the lighthouse, and
from lead-based paint used on the exterior of the lighthouse. It is plausible that metals,
including mercury, leached into the soil from spent and un-used batteries that were
stored and buried on the property. The source of lead on the property is believed to be
the lead-based paint that chipped with time, or lead batteries that may have been used
to power the lighthouse. It should be noted that lead batteries were not found during the
1994 investigation; however, that does not exclude the possibility that they were used.
The primary medium contaminated on this property is the soil. The property is a
State Park, but the residence of the Park Ranger is on the property; therefore, current
and future residents as well as park visitors could be exposed to the site-related
contaminants in the surface soil. The potential routes of exposure considered for these
receptors are: incidental ingestion, dermal contact and inhalation of particulates from the
surface soil.
2.4 Decision Units
The designation of the two DUs (Figure 1) proposed for the ISM sampling was
established based on the data previously obtained with discrete sampling (appendix
Figures A1-A6), and on the discussions held on January 7th and 9th, 2013.
DU1 is approximately 0.18 acres (112 ft x 80 ft) and is located in the area to the
northwest of the lighthouse structure. DU1 has been divided by grid into 32 cells of equal
size measuring 16 x 16 ft (Figure 2). One 0 – 6 inch depth increment from each cell will
be taken and combined to form a single ISM sample. This process will be repeated to
generate three 0 – 6 inch depth ISM samples (3 replicates) from DU1. The locations for
sampling within the cells for each replicate have been determined using systematic
random sampling as described in the following section.
Thirty-two discrete samples will also be collected in the 0 – 6 inch interval (one
per grid). The location of the sample within each grid cell has been determined using a
systematic random sampling approach, and will be discussed in the next section. Ten
additional samples will be collected from DU1 at the 6 – 24 inch interval or to the water
table (whichever is reached first), using discrete sampling. Locations for the subsurface
samples will be chosen at random.
The second DU, DU2 encompasses the area surrounding the Park Ranger’s
residence. This area is approximately half of an acre and has an irregular shape (Figure
1). DU2 was subdivided using a grid containing 30 grid cells with each cell measuring
28 ft x 28 ft (Figure 2). Thirty increment samples from a depth of 0 – 6 inches (one per
grid) will be collected and combined into a single ISM sample. This process will be
repeated to generate three replicate ISM samples. The locations for the sampling within
Page 8
4
cells for each replicate have been determined using a systematic random sampling
approach, and are specified in the following section. Thirty discrete soil samples at the 0
– 6 inch interval will also be take from DU2, one from each grid cell. The location of the
discrete sample from each cell was also determined using a systematic random
sampling approach (Figure 5). Ten additional discrete samples will be collected from
DU2 at the 6 – 24 inch interval or to the water table (whichever is reached first); with
sample locations chosen at random.
2.5 Number and Mass of Increments
Three different ISM sample replicates, each consisting of 30 or 32 increments
(from DU2 and DU1, respectively), will be collected from each DU using a systematic
random sampling design. For systematic random sampling, a grid is used to divide the
DU into cells of equal size. A random sampling location is established in the first grid
cell. A soil increment is taken from that location and combined with increments taken
from the same location in each of the other cells to produce a single ISM sample. The
process is repeated with different random locations to produce replicate ISM samples for
the DU.
The random sampling locations for each of the DUs were identified using an
internet-based random integer generator (random.org). The input values in the software
were selected to generate two random integers, corresponding to a location within the
cell. The range of possible values for the integers, were based on the dimensions of the
grid cells for each DU.
For DU1, the input values in the software were zero and 16 (the size of the cell in
feet). The output was given in two columns. The number given in the first column was
taken as the location (coordinate) to the East of the corner; the number given in the
second column was taken as the location (coordinate) to the South of the corner. The
three independent outputs were as follows: (15, 5), (5, 8), (2, 14). Sampling will begin in
the grid cell in the northwest corner of DU1. The location of the initial incremental
samples for the three replicates is (relative to the northwest corner of the grid cell) (15 ft
over (East), 5 ft down (South)), (5 ft over (East), 8 ft down (South)), (2 ft over (East), 14
ft down (South)). A schematic representation of these is shown in Figure 3. Samples
will then be taken from adjacent cells, at the same relative location within each cell. The
samples from the adjacent cells will be collected sequentially, in a serpentine pattern
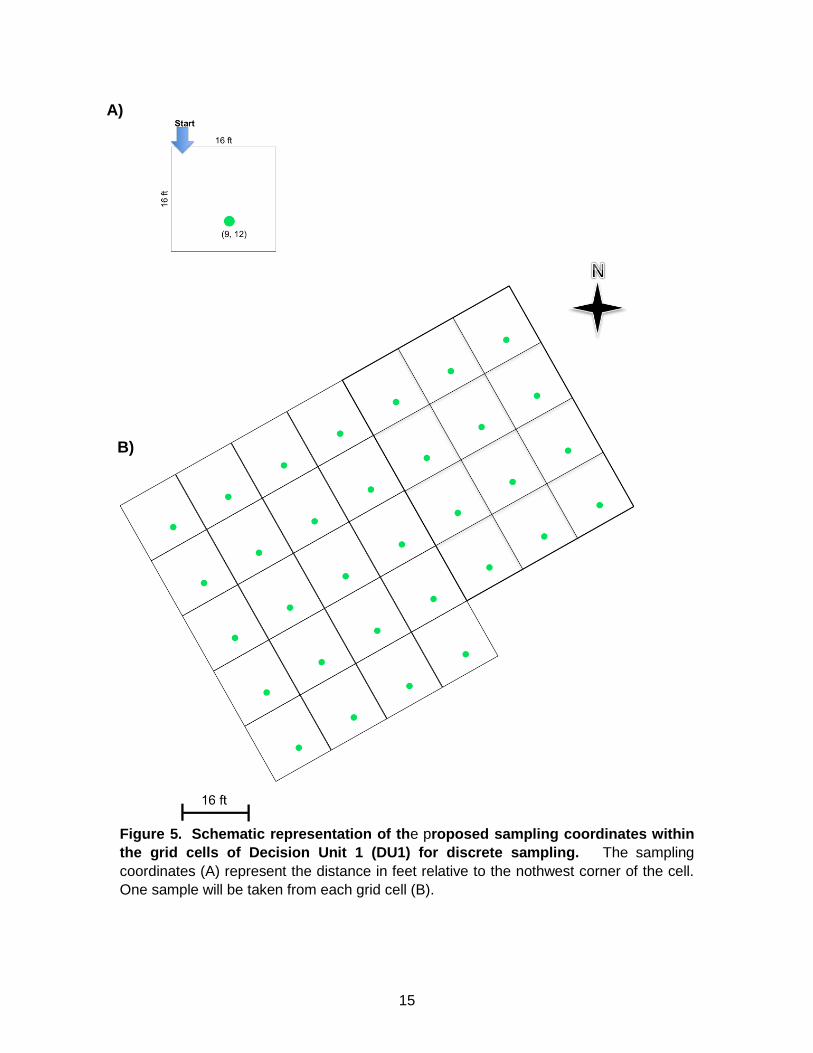
(ITRC 2012, FDEP 2012), as depicted in Figure 4. For discrete sampling one sample
will be collected from each cell. The coordinates for the samples were determined in the
same way as for ISM, and are depicted in Figure 5A. The location of the first sample
relative to the northwest corner of the DU is 9 ft over (East), 12 ft down (South). The
remaining 31 samples will be collected at the same location within each grid cell (Figure
5B).
The sample coordinates for DU2 were determined in a similar manner as for
DU1, with the exception that the input values in the random integer generator software
were zero and 28 (the size of the cell in feet). The number given in the first column was
taken as the location (coordinate) to the East of the corner; the number given in the
second column was taken as the location (coordinate) to the North of the corner. The
Page 9
5
three independent outputs were as follows: (26, 8), (1, 19), (13, 16). Sampling will begin
in the grid cell in the southwest corner of DU2. The location of the initial incremental
samples for the three replicates is (relative to the southwest corner of the grid cell) (26 ft
over (East), 8 ft (North)), (13 ft over (East), 16 ft up (North)), (1 ft over (East), 19 ft up
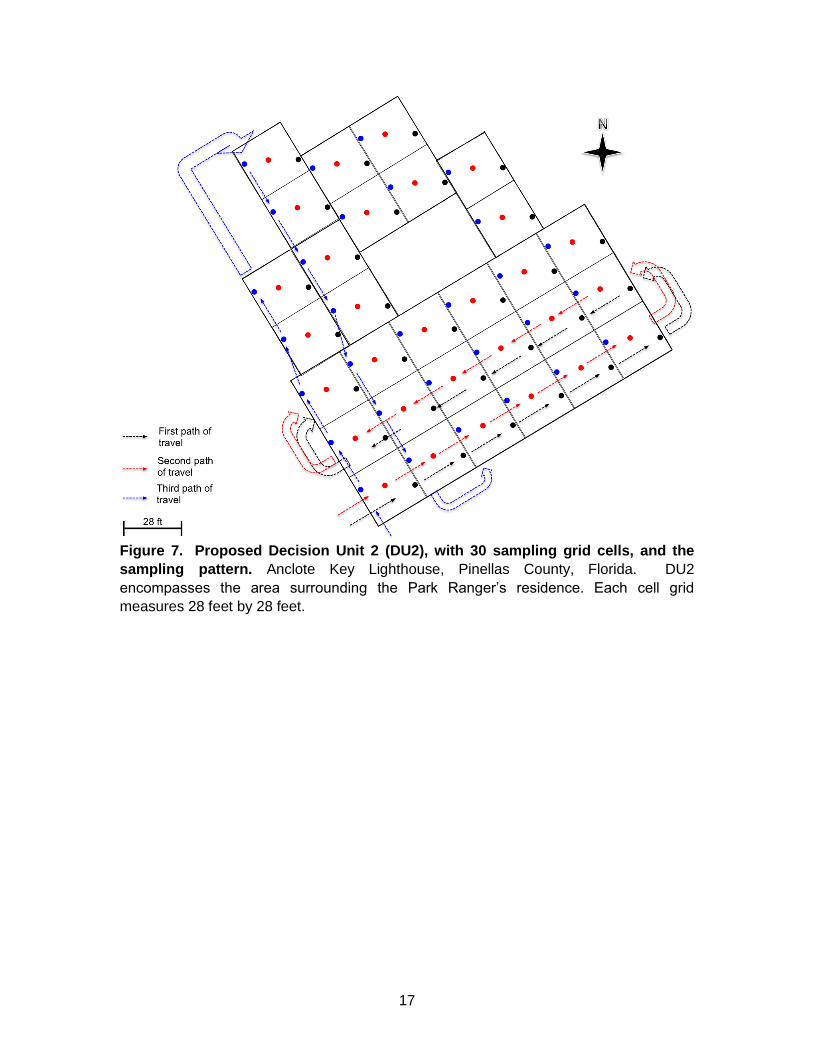
(North)). A schematic representation of these is shown in Figure 6. Samples will then be
taken from adjacent cells, at the same relative location within each cell. The samples
from the adjacent cells will be collected sequentially, in a serpentine pattern (ITRC
2012), as depicted in Figure 7. For discrete sampling one sample will be collected from
each cell. The coordinates for the samples were determined in the same way as for
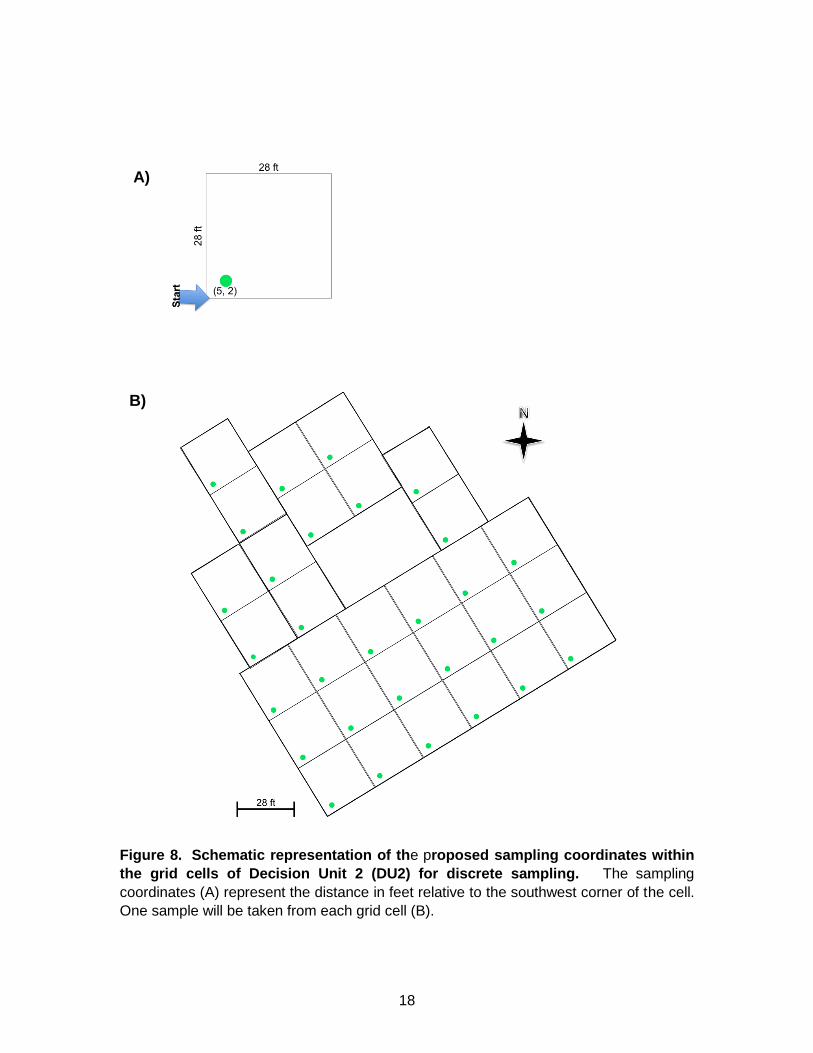
ISM, and are depicted in Figure 8A. The location of the first sample relative to the
southwest corner of the DU is 5 ft over (East), 2 ft up (North). The remainder 29
samples will be collected at the same location within each grid cell (Figure 8B).
If field conditions do not allow for a given increment to be collected (e.g., building
structures, trees), a new location will be chosen in the field as near as possible to the
target location. Relevant data including increment locations (i.e., GPS coordinates when
possible) will be recorded on field sheets for each sample.
Each of the increments should weigh approximately 50 g in order to achieve the
target sample mass of approximately 1.5 kg for each replicate sample to be delivered to
the analytical laboratory. This assumes a sample core diameter of approximately 2 cm.
Formula for estimating sampling equipment requirements based on a pre-
determined ISM mass and number of increments
Ms = • n • Ds • • ( / 2)2
Ms – targeted mass of sample (approx. 1,500 g)
Ds – increment length (15 cm)
n – number of increments (30)
- soil or sediment density (1.5 g/cm3)
- diameter of sample core (2 cm)
3.0 Sample Analysis
The ISM replicates will be sent to the FDEP laboratory qualified to process and
analyze ISM samples. The laboratory will provide a copy of its internal standard
operating procedure (SOP) for the processing for ISM samples, including sample
preparation and subsampling methods.
After processing, each sample will be analyzed for total mercury based on EPA
Method 7471A (Mercury in Solid or Semisolid Waste (Manual Cold-Vapor Technique)
and total lead by EPA Method 6020A. A copy of the laboratory data quality objective
(DQO) summary for the analytical methods will be provided by the laboratory. This DQO
summary must indicate that the analytical methods have detection limits for mercury and
lead well below the FDEP default residential SCTL for the metals.
Page 10
6
3.1 Data Analysis
The mercury and lead data obtained from the analytical laboratory will be
compared with the FDEP current residential SCTL for mercury (3 mg/kg) and lead (400
mg/kg). The basis for comparison for mercury will be the 95% UCL concentration
derived from the three replicate ISM samples. If the 95% UCL from the three replicates
is below 3 mg/kg, no further action will be necessary from the human health perspective,
once the assessment for the whole Site is complete (including the work that will be done
by AECOM), the ecological evaluation will be accomplished. For lead, the basis of
comparison will be the grand mean of the lead concentration from the three replicates for
each DU. If the grand mean is below 400 mg/kg, no further action will be necessary from
the standpoint of protection of human health. Discrete sample data from each DU will be
used to determine the degree of heterogeneity of mercury and lead concentrations in the
soil. If the coefficient of variation (CV) for the data is <1.5, Student’s t-test will be used
for calculating the 95% UCL. If a larger CV is observed, the Chebyshev method for
calculating the 95% UCL will be used. The 95% UCL will be calculated using the
Microsoft Excel-based ISM Calculator available on the ITRC website:
http://www.itrcweb.org/ISM-1/4_2_2_UCL_Calculation_Method.html. Because both ISM
and at least 30 discrete samples are available for each DU, all of the data will be used.
If the ISM indicates that the decision unit fails, the discrete sample data will be utilized to
determine the areas of exceedances for management or remediation decisions.
4.0 Field Procedures for Sampling
4.1 Soil Sampling Procedures for ISM
The field sampling will be performed under the supervision of personnel trained
in ISM. The proposed location of the DUs and grid cell location are shown in Figure 1,
Figure 3 and Figure 5. Prior to beginning the ISM fieldwork, a portable global positioning
unit (GPS) will be used to record the grid intersections for each grid cell, while the
location is flagged on the ground. The portable GPS unit will also be available in the
field to assist in the sample collection and recording.
The upper six inches of soil will be collected at each incremental sampling
location using appropriately sized PVC tubes (¾ inch diameter and 6 inches long). If the
ground is too dry and loose, a trowel may be used to collect the same mass/volume of
soil. Care will be taken to insure that the increments will be the same mass. The
collected soil will be placed in a new container. All increments of soil from a single
replicate ISM sample from the DU will be placed together in the container and sealed.
Three replicates are required; therefore, three containers will be collected per DU, each
composed of 30 or 32 increments (depending on the DU).
All field supplies will be transported to the site. The collected soil samples will be
maintained in iced coolers prior to transport.
Page 11
7
4.2 Discrete Sampling Procedures
Discrete soil sampling activities will be conducted in accordance with FDEP
Standard Operating Procedures (SOP)-001/01 Field Sampling (FS) 3000. One discrete
sample will be collected at the 0 – 6 inch interval from each cell in each DU. As with the
ISM samples, the locations of the discrete samples have been determined utilizing the
internet-based random integer generator. The input values in the software were
selected to generate two random integers, based on the dimensions of the grid cells for
each DU. The locations are displayed in the accompanying figures. Ten discrete soil
samples will also be collected from each DU at the 6 – 24 ft interval (or the top of the
water table, whichever is first encountered). These sample locations will be determined
in the field.
All discrete samples will be collected in individual sample containers and properly
sealed and labeled prior to placement in iced coolers for transport.
4.3 Equipment Decontamination in the Field
Because the increments will be combined, the tools used for increment collection
will only be wiped clean of any soil or mud after collecting each of the increments.
However, for each replicate ISM, the ISM sampling tool will be washed in a 5-gallon
bucket filled with a solution of Liqui-nox, rinsed with deionized water, rinsed with 70%
isopropyl alcohol, and rinsed again with deionized water. Decontamination of the tools
between ISM replicates is important to ensure that there is no contamination between
ISM replicates.
Sampling equipment used during discrete sampling activities will be
decontaminated between sample collections. Four equipment blanks will be collected
and analyzed to confirm the effectiveness of decontamination procedures.
4.4 Field Sample Documentation
Detailed logs of pertinent data will be maintained in the field and will include
sample information and field activity logs, which are described in detail below. Field
photographs should also be included and documented when appropriate.
4.4.1 Sample Identification and Documentation
The log will include detailed information about the samples as they are being
taken. Sample labels, custody seals, and chain-of-custody forms are described below.
After sample collection, all sample containers will be labeled with an identification
number that uniquely identifies the sample. This will include:
• the year the sample was taken;
• the month and day of sample collection;
Page 12
8
• the replicate designation (for ISM samples); and
• the Decision Unit designation.
Each sample container will be labeled using permanent ink. The sample
identification number will be logged in the field log book. The following information about
the sampling event will also be documented into the field log book along with the sample
identification number:
• Date and time of sample collection;
• Person(s) sampling;
• Sample location (i.e., GPS coordinates if possible)
• Method of sampling
• Analysis to be performed
• Observations on ambient conditions;
4.4.2 Custody Seals
No samples will be shipped. Members of the field sampling team will personally
transport the samples to the lab for analyses and the samples will be in the custody of
the team at all times. Custody seals that are customarily used during shipping will not
be required.
4.4.3 Chain-of-Custody Forms
Chain-of-custody is a chronological documentation used to trace sample
possession from the time of sample collection until receipt by the laboratory. One chain-
of-custody form will be filled out for each shipping container and will list all the samples
contained within. One copy of the completed form will be placed in a plastic bag and
taped to the inside lid of the transportation container and one copy will be kept with the
project files.
4.5 Field Activity Logs
Detailed records of the sampling events will be made on site. Field sampling logs
will include the following information, as applicable:
date and time;
personnel;
sample medium;
sample collection technique(s);
sample containers;
sample number, location, and depth;
Page 13
9
any pertinent field observations.
4.5.1 Corrections in Field Activity Logs
The field documents will be completed using permanent ink and mistakes will be
crossed out using a single line. The correction will be dated and initialed. The field
documents shall not be thrown away or destroyed, even in the event that the document
needs to be replaced. The field documents remain on the site for the duration of the
fieldwork.
5.0 Quality Assurance/Quality Control (QA/QC)
5.1 Field Operations
The Project Manager will ensure that control of field operations and sampling
methods will be discussed and will ensure that each field team member is familiar with
the provisions of the workplan as well as the health and safety program (HASP), prior to
commencement of field operations. The Project Manager will provide a QA review of
field activities at the beginning of the sampling event to ensure that all procedures are
followed. The Project Manager will regularly check field notebooks and forms.
5.2 Control Parameters
ISM requires that QC measures are taken both in the field as well in the laboratory.
Field QA/QC involves the collection of field QC samples, as well as control of field
operations, sampling, and measurements. Field QA/QC requirements are described
below.
5.3 QC Samples in the Field
For every 20 environmental samples, there needs to be one field duplicate sample
for QC. Since this work plan requires a total of three ISM samples per DU, no field
duplicate is necessary for this ISM sampling event. For the discrete soil samples, one
duplicate will be collected for each DU.
No trip blanks or equipment rinsate blanks will be collected or analyzed. Trip blanks
are typically used for volatile analytes and therefore are not relevant in this case.
Equipment rinsate blanks are used to evaluate the effectiveness of equipment
decontamination between samples. Because ISM requires less sample handling due to
less total number of samples submitted to the laboratory, there are fewer opportunities
for cross-contamination. Therefore, no equipment blanks are needed for this procedure.
However, the sampling equipment utilized to collect the discrete soil samples will be
decontaminated between each location. Four equipment rinsate blanks will be collected.
These samples will be analyzed for mercury (EPA Method 7470A) and lead (EPA
6020A).
Page 14
10
6.0 Data Reporting
Data deliverables from the analytical laboratory will consist of the following items:
Case Narrative;
Laboratory Final Reports;
Surrogate Recovery Summary;
Method Blank Summary;
Laboratory Control Sample (LCS) Recovery Summary;
Initial Calibration Summary Gas Chromatograph (GC) Method Printout;
Continuing Calibration Summary;
Analytical Sequence Printout;
Chromatographs and Quantification Reports for all Samples, Standards, and QC
Samples;
Copies of Extraction Log Page and Copies of Chain-of-Custody Document;
LCS;
Extraction Logbook Pages and Chain-of-Custody Documents;
References
FDEP 2005. Technical Report: Development of Cleanup Target Levels (CTLs) for
Chapter 62-777, F.A.C. Division of Waste Management, Florida Department of
Environmental Protection, Tallahassee, Florida.
FDEP 2008. DEP-SOP-001/01, FS 3000
Soilpublicfiles.dep.state.fl.us/dear/sas/sopdoc/2008sops/fs3000.pdf
FDEP 2012. Draft Incremental Sampling Methodology (ISM) Guidance, Bureau of Waste
Cleanup, Florida Department of Environmental Protection, Tallahassee, FL.
Interstate Technology and Regulatory Council (ITRC) 2012. Incremental Sampling
Methodology. (Washington, D.C.: Interstate Technology & Regulatory Council,
Incremental Sampling Methodology Team, (www.itrcweb.org),
Page 15
11
Figure 1. Designation of DUs. Anclote Key Lighthouse, Pinellas County, Florida.
Figure was modified from aerial map of Anclote Key Preserve State Park obtained from
Google maps (http://maps.google.com/).
Page 16
12
Figure 2. Schematic representation of the sampling grids for DU1 and DU2.
Anclote Key Lighthouse, Pinellas County, Florida. Figure was modified from aerial map
of Anclote Key Preserve State Park obtained from Google maps
(http://maps.google.com/).
Page 17
13
Figure 3. Schematic representation of the proposed sampling coordinates within
the grid cells of Decision Unit 1 (DU1) for ISM. The sampling coordinates were
obtained using an internet-based random number generator. The coordinates represent
the distance in feet relative to the northwest corner of the cell.
Page 18
14
Figure 4. Proposed Decision Unit 1 (DU1), with 32 sampling grid cells. Anclote Key
Lighthouse, Pinellas County, Florida. DU1 encompasses the area northwest of the
lighthouse structure. Each cell grid measures 16 feet by 16 feet.
Page 19
15
Figure 5. Schematic representation of the proposed sampling coordinates within
the grid cells of Decision Unit 1 (DU1) for discrete sampling. The sampling
coordinates (A) represent the distance in feet relative to the nothwest corner of the cell.
One sample will be taken from each grid cell (B).
B)
A)
Page 20
16
Figure 6. Schematic representation of the proposed sampling coordinates within
the grid cells of Decision Unit 2 (DU2) for ISM. The sampling coordinates were
obtained using an internet-based random number generator. The coordinates represent
the distance in feet relative to the southwest corner of the cell.
Page 21
17
Figure 7. Proposed Decision Unit 2 (DU2), with 30 sampling grid cells, and the
sampling pattern. Anclote Key Lighthouse, Pinellas County, Florida. DU2
encompasses the area surrounding the Park Ranger’s residence. Each cell grid
measures 28 feet by 28 feet.
Page 22
18
Figure 8. Schematic representation of the proposed sampling coordinates within
the grid cells of Decision Unit 2 (DU2) for discrete sampling. The sampling
coordinates (A) represent the distance in feet relative to the southwest corner of the cell.
One sample will be taken from each grid cell (B).
B)
A)
Page 23
Appendix A
Maps of Historical Sampling
Page 24
1
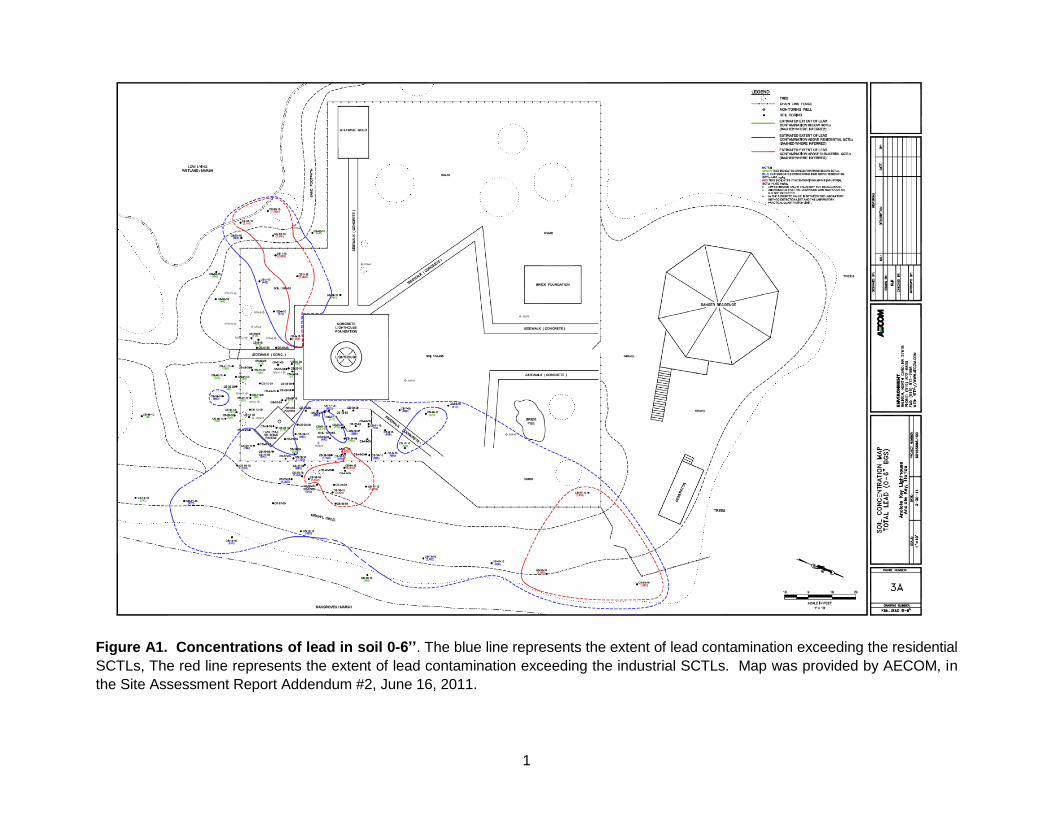
Figure A1. Concentrations of lead in soil 0-6’’. The blue line represents the extent of lead contamination exceeding the residential
SCTLs, The red line represents the extent of lead contamination exceeding the industrial SCTLs. Map was provided by AECOM, in
the Site Assessment Report Addendum #2, June 16, 2011.
Page 25
2
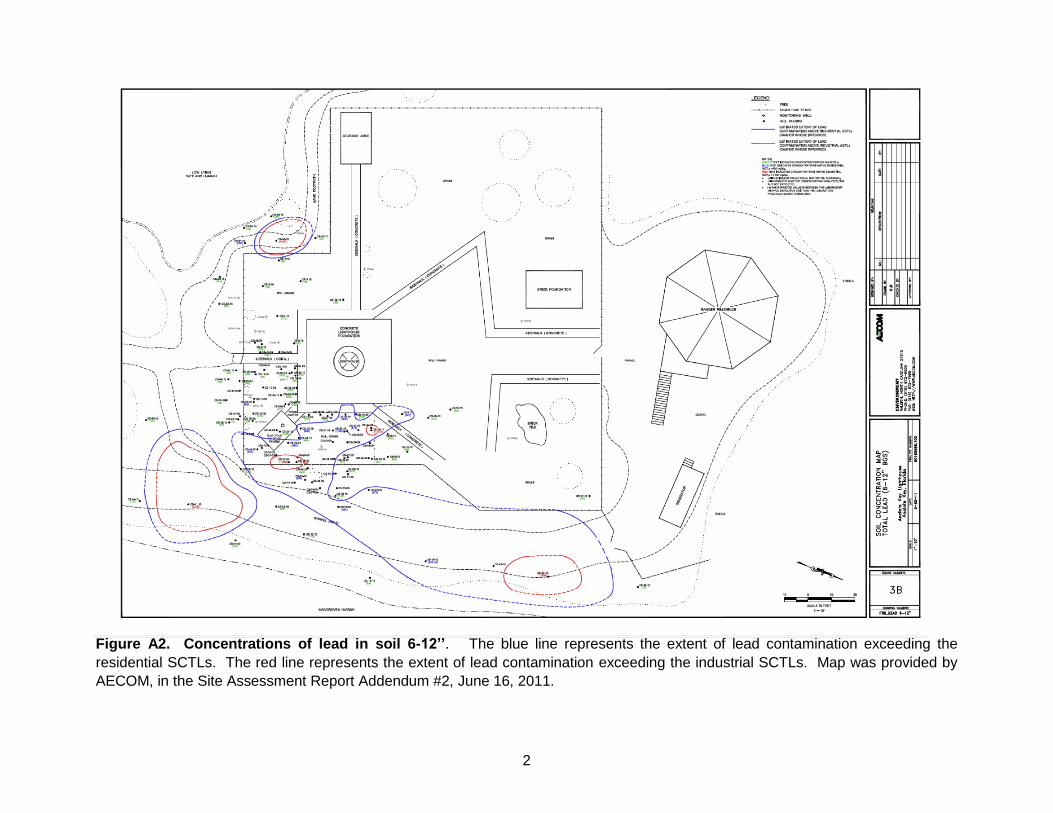
Figure A2. Concentrations of lead in soil 6-12’’. The blue line represents the extent of lead contamination exceeding the
residential SCTLs. The red line represents the extent of lead contamination exceeding the industrial SCTLs. Map was provided by
AECOM, in the Site Assessment Report Addendum #2, June 16, 2011.
Page 26
3
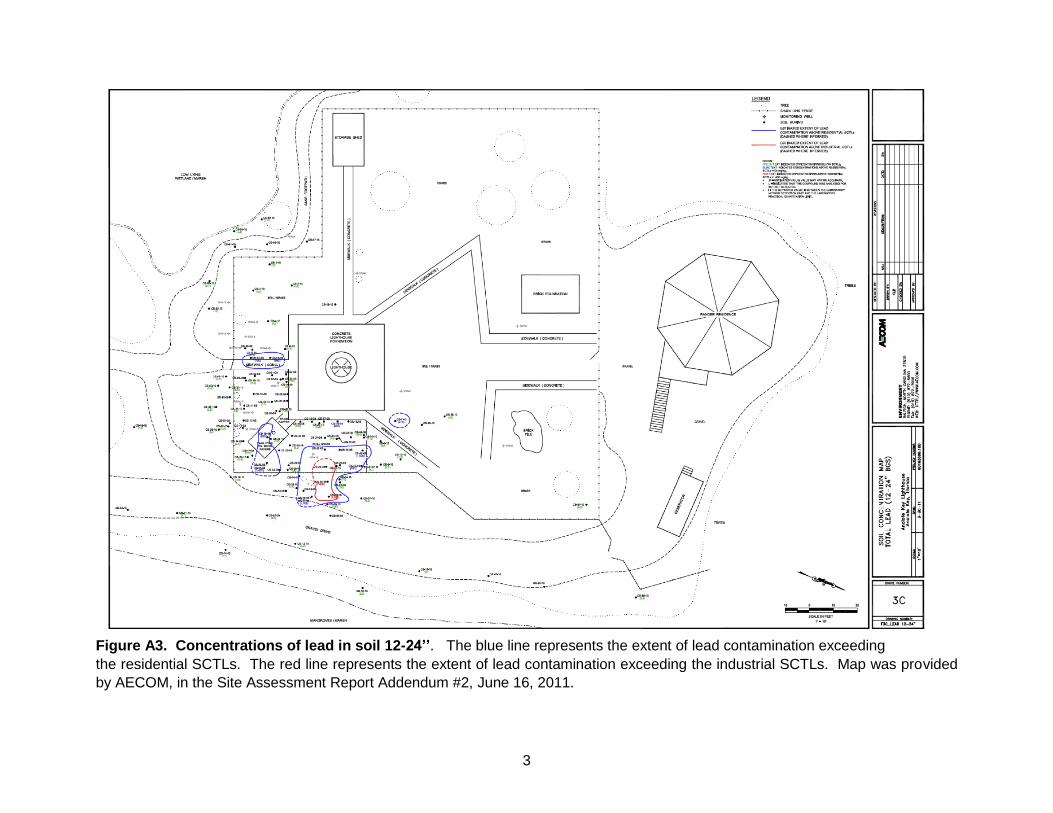
Figure A3. Concentrations of lead in soil 12-24’’. The blue line represents the extent of lead contamination exceeding
the residential SCTLs. The red line represents the extent of lead contamination exceeding the industrial SCTLs. Map was provided
by AECOM, in the Site Assessment Report Addendum #2, June 16, 2011.
Page 27
4
Figure A4. Concentrations of mercury in soil 0-6’’. The blue line represents the extent of mercury contamination exceeding
the residential SCTLs. The red line represents the extent of mercury contamination exceeding the industrial SCTLs. Map was
provided by AECOM, in the Site Assessment Report Addendum #2, June 16, 2011.
Page 28
5
Figure A5. Concentrations of mercury in soil 6-12’’. The blue line represents the extent of mercury contamination exceeding the
residential SCTLs. The red line represents the extent of mercury contamination exceeding the industrial SCTLs. Map was provided
by AECOM, in the Site Assessment Report Addendum #2, June 16, 2011.
Page 29
6
Figure A6. Concentrations of mercury in soil 12-24’’. The blue line represents the extent of mercury contamination exceeding
the residential SCTLs. The red line represents the extent of mercury contamination exceeding the industrial SCTLs. Map was
provided by AECOM, in the Site Assessment Report Addendum #2, June 16, 2011.
Page 30
Appendix B
Incremental Sampling Checklist
Page 31
1
Incremental Sampling Checklist
General Items
Pens and Sharpies
Coolers
Ice, water, Gatorade
Documentation supplies (e.g. field book, camera, field activity logs)
Workplan and figures
Trash bags
HASP
Sampling Equipment
Stainless steel rods, handles and coring tips
Pry bar
Mallet and block
Drill, auger bit, generator, gas, extension cord, paper plates
Stainless spoons and scoops
Scale (requires 6 AA batteries)
PVC sections and PVC pipe cutter
Funnel
1-gallon and 2-gallons bags
1-gallon containers (6) and labels
Work gloves, sampling gloves
Trays and aluminum foil
Clean 5-gallon bucket
Sampling coolers
Custody seals
Chain-of-custody paperwork
Decon Supplies
5-gallon buckets and brushes
Gloves
Liquid soap
Organic-free water, DI water
Alcohol and squeeze bottle
Handy-wipes
Survey Equipment
Tripod, transit, both types of rods and rod level
Plumb-bob and string
Page 32
2
Compass
Two tape measures (300’ and 100’)
Pin flags (four colors, 50 each)
Maps
Walkie-talkies
GPS unit and extension
Spray paint