52
Workshop 3C: An economy that works for people: R&I, SMEs competitiveness Thursday 16 September 2021 11:45 – 13:00 GMT+1

Workshop 3C:An economy that works for people: R&I, SMEs competitiveness
Thursday 16 September 202111:45 – 13:00 GMT+1

Housekeeping
• In the room: microphones available
• Online: Post questions in the Zoom “chat” Moderator will ask online questions to panellist.
• Video and presentations will be online here: Conference Website
Twitter: #CohesionEval2021 - #CohesionOpenData - @RegioEvaluation

CHAIR: Nicola De Michelis, Director of Smart and Sustainable Growth and Programmes Implementation, DG REGIO, European Commission
PANELLISTS:
• Silvia Vignetti, Director, Development and Evaluation Unit, CSIL Centre for Industrial Studies
• Slavo Radošević, Professor of Industry and Innovation Studies, University College London
• Jana Drlíková, Head of the Evaluation Unit, Ministry of Regional Development, Czech Republic
• David Alba, Team Leader, Evaluation and European semester Unit, DG REGIO, European Commission

Workshop 3C_1:An economy that works for people: R&I, SMEs competitiveness
ERDF support in R&I, SMEs 2014-20State of play
David Alba, Team Leader, Evaluation and European semester Unit, DG REGIO, European Commission

1. ERDF support in R&I & SME competitiveness 2014-20 by Theme (EU support planned)

2. ERDF support in R&I & SME competitiveness 2014-20 by MS (EU support planned)

3. ERDF support in R&I & SME competitiveness 2014-20 by CoI(decided amount end 2020)

5. ERDF support in R&I & SME competitiveness 2014-20 diversity

7. MS evaluations of R&I & SMEs in 2014-20

New insights from evaluation findings of the regional RTDand S3 policy
Presentation by Prof. Slavo Radosevic
9th Conference on THE
EVALUATION OF EU COHESION POLICY, 16-17 SEPTEMBER 2021
“Shaping Transitions with Evidence”
Alfandega Conference Centre, Porto, PORTUGAL
Workshop 3C: An economy
that works for people: R&I, SMEs competitiveness

Outline
ERDF support in between need for experimentation and accountability
Transformation or scale effect of RTD investments
Institutional capacity for S3 design and implementation

Outline
ERDF support in between
need for experimentation
and accountability

The experimentation-accountability trade-off in innovation and industrial (I&I) policy: three propositions
In conditions of conventional public administration, we do
not (yet) have an organisational solution to
experimental governance to facilitate the development of
new public policies
The collective or multi-stakeholder nature of I&I
policy reduces the effectiveness of accountability
and increases the gap between procedural and
substantive accountability
Reconciling political power with experimentation in I&Ipolicy would require new forms of accountability
There is a trade-off between the need for experimentation in I&I policy and the demand
for public accountability
Kanellou, Radosevic and Tsekouras (2021) The experimentation-accountability trade-off in innovationand industrial policy: are learning networks the solution?Paper revised and resubmitted to a journal

Dynamic Policy Cycle
Policy prioritiesPolicy governance
Conversion fit
Programe design &
managememt
EDP governance Implementation governance
Strategic fit Operational fit
RTOs and
companies
strategies and
M&E governance
Learning and feedback
Programe
Implementation &
Monitoring

Example:
Assessment of Croatian S3 policy cycle
Policy prioritiesConversion fit
Programe design &
managememt
Strategic fit Operational fit
RTOs and
companies
strategies and Learning and feedback
Programe
Implementation &
Monitoring
Undeveloped EDP participatory
governance inhibits
experimentation which requires
active involvement of innovation
Poor conversion of TPA into
portfolio of policy instruments
Implementation governance driven by
conventional public policy procedural
accountability rules applied in poorly
design implementation system
S3 policy does not have built-in
mechanisms of learning and
mutual adjustment

Also, ……
Muddling through policy: Major mismatches in the policy cycle
2014
Operational Program adopted in 2014 before the S3 (2016)
2018
National Innovation Council established in 2018 when implementation was already well on the way
2019
The Innovation Council for Industry (INNOVA) and TICs started to operate in 2019 when the majority of programs have been already initiated

A need for diagnostic monitoring and ‘learning networks’ (‘real time M&E network’) as governance solution
Diagnostic monitoring is ‘the systematic evaluation of the portfolio of projects to detect errors as each of the specific projects evolves and to correct the problems (including the weeding out of inefficient projects) in light of implementation experience and other new information’ (Sabel and Kuznetsov, 2017, p52).
The aim of ‘diagnostic monitoring’ is to identify potential unforeseen events and correct them or transform them into opportunities rather than ex-post project-by-project evaluation
Learning networks as the solution!
See Kanellou, Radosevic and Tsekouras (2021) The experimentation-accountability trade-off in innovation and industrial policy: are
learning networks the solution? Paper revised and resubmitted to a journal

Learning Networks in dynamic policy cycle Converting policy priorities into suitable policy package (program, instruments)
Policy prioritiesPrograme design &
managememt
RTOs and
companies
strategies and
Programe
Implementation &
Monitoring
Revising policy priorities in the light of understanding feasibiliy of individual
programs and instruments
Ensu
re e
ffec
tive
imp
lem
enta
tio
n o
f
pro
gram
s a
nd
inst
rum
ents
Det
ecti
ng
imp
lem
enta
tio
n a
nd
des
ign
ch
alle
nge
s an
d o
pp
ort
un
itie
s
and
ad
dre
ssin
g th
em
Co
nve
rtin
g st
rate
gies
an
d n
eed
s o
f
firm
s an
d R
TOs
into
po
licy
pri
ori
ties
Res
hap
ing
stra
tegi
es o
f fi
rms
and
RTO
s in
th
e lig
ht
of
un
der
stan
din
g
chal
len
ges
in t
ech
no
-eco
no
mic
Forseeing changes in M&E system and in delivery mechanisms that arise from
changes in strategies and new challenges in techno-economic environment
Forseeing new challenges for firms and RTOs that arise through successful
implementation of programs and instruments
Learning networks
Source: Kanellou, Radosevic and Tsekouras (2021) The experimentation-accountability trade-off in innovation and industrial policy: are learning networks the solution?
Paper revised and resubmitted to a journal

Outline
Transformative vs. scale
effect of RTD investments

ERDF RTD 2007-12
Poor sustainability = Scale effects dominate + Missing transformative effects
•Increased science – science collaboration … but
•Enhanced applied R&D…..but
•Increased number of students…. but
•Massive investments in RETD infrastructure…. but
• Support to R&D excellence….but
•Expanded EU RTD excellence…. but
•Increased regional R&D intensity ….but
Expanded scale effects
•…..not science – industry collaboration
•…..BES not using results of PRO applied R&D
•….. not research based university
•……not access of large firms to public RTD infrastructure
……not industry commons generated
•…….not local R&D relevance
•….. EU value added is unintended consequence
•……regional R&D concentration
Missing transformation effects
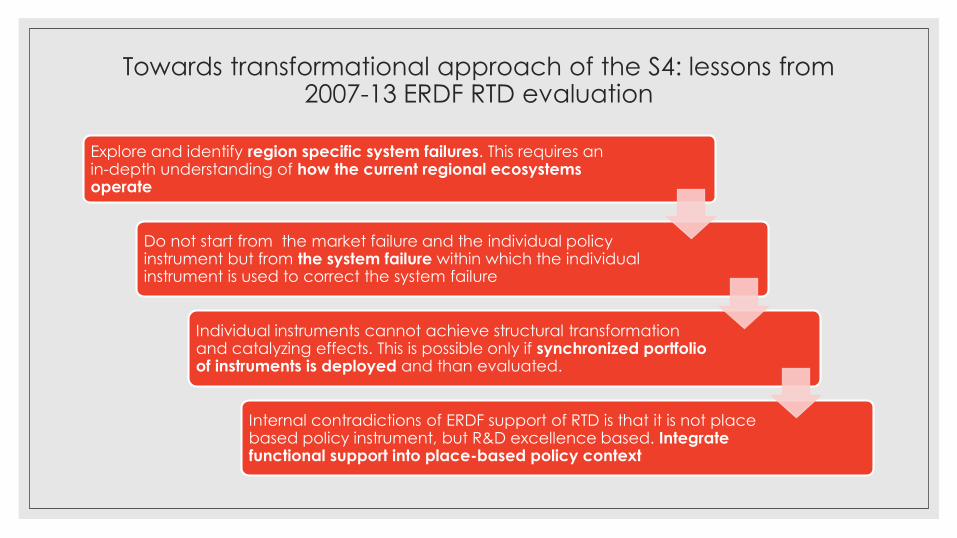
Towards transformational approach of the S4: lessons from 2007-13 ERDF RTD evaluation
Explore and identify region specific system failures. This requires an in-depth understanding of how the current regional ecosystems operate
Do not start from the market failure and the individual policy instrument but from the system failure within which the individual instrument is used to correct the system failure
Individual instruments cannot achieve structural transformation and catalyzing effects. This is possible only if synchronized portfolio of instruments is deployed and than evaluated.
Internal contradictions of ERDF support of RTD is that it is not place based policy instrument, but R&D excellence based. Integrate functional support into place-based policy context

Outline
Institutional capacity for S3
design and implementation

Institutional capacity: what it is and how to measure it?
'The capability of an institution to set and achieve social and economic goals, through knowledge, skills, systems, and institutions’ (UNDP and UNISDR definition)
The S3 requires the institutional capacity, which goes beyond the state capacity
Institutional capacities for S3 include organisations' abilities to undertake the strategy-setting capacities, coordination, implementation (technical, operational and policy capabilities), and monitoring & evaluation (M&E) capacities (Radosevic, 2020)
The assessment of the institutional capacities cannot be confined to implementation but also need to include strategy design, M&E capacities, and in the context of S3, especially, policy co-creation capacities

Institutional capacity for S3
Institutional capacity for policy design = the capacity to design S3 and its policy instruments
Institutional capacity for policy co-creation = capacity for joint formulation and negotiation of the policy objectives and instruments between public and private stakeholders
Implementation capacity = the capacity of stakeholders (managing authorities, intermediate bodies, and beneficiaries) involved in the S3 to achieve policy objectives effectively and efficiently
Monitoring & evaluation capacity = the capacity to systematically collect and analyze information and use it to assess project, program or policy performance

Policy implementation capacity Policy design
Job expectations Clearly defined by the nature of the activity
Not clearly designed tasks. Ad hoc activities driven entirely by daily needs
Performance Feedback
Proximity to end users gives prompt feedback on performance
As objectives and expectations are not clearly defined, there is no feedback
Environment and Tools
Available technical tools and handbooks serve as the standard or reference
No understanding of the best practice or professional standards
Organizational Support
Self-contained units with appropriate management support
Isolated units within ministries, which also have other responsibilities
Incentives EU 'top up' makes huge differences in retention of staff
Chronically 'understaffed' and inadequately remunerated
Skills and Knowledge
On the job training / Not strategic approach to training
Few training opportunities (e.g., within strategic projects)
Overall outcome Satisfactory or very good administrative capacity
Undeveloped and fragmentary capacity for policy design
S3 policy design is disadvantaged in comparison to S3 policy implementation –at both individual and organizational levels of institutional capacity
• Institutional capacity for S3 policy design is undeveloped and very fragmentary
• Institutional capacity for policy co-creation has been developed in fragments, but by now, it has been lost and would need to be rebuilt
• Institutional capacity for implementation of S3 has been developed to a satisfactory degree.
• The S3 governance system has a very rudimentary M&Ecapacity, while the overall system has an undeveloped capacity for self-monitoring and adjustment
Example: Assessment of Croatian S3 policy cycle

Example:
Assessment of Croatian
S3 policy institutional
implementation
capacities, in nutshell
Croatian S3 meets threshold requirements for administrative absorption capacity
Governance requirements for effective and efficient absorptive capacity are uncertain and very much ‘work in progress.’ i.e. effective and efficient absorption is beset with problems and challenges many of which have been identified in reports produced within the World Bank PER project
S3 governance for transformative capacity is unlikely without significant changes in the governance system.
Administrative absorption capacity = the capacity to prepare and implement administrative work for or by applicants and administrative capacity of state administration. For further see Horvat (2005) Absorptive capacity = “The extent to which a member state is able to spend effectively fully and efficiently the allocated financial resources from the Structural Funds” (NEI, 2002 )(Boot et al., 2001).
AAC and AC capacity do not guarantee the structural transformation of the innovation system which may grow and enlarge in size and competences but still retain all its weakness such as weak commercialization and weak science –industry collaboration or continuing low productivity and low technological competitiveness
Transformative capacity = The extent to which a member state or region can use the EU cohesion funds to transform its innovation system in the way that it ensures future technology-based growth and sustainable development (Radosevic et al, 2021)
Types of implementation capacity
Instead of conclusion:
Key challenge for S4
◦How S4 governance can improve the
transformative capacity of the innovation
system?

THANK YOU

MINISTRY OF REGIONAL DEVELOPMENT
National Coordination Authority
Jana Drlíková, M.A.Head of the evaluation unit, National Coordination Authority, Ministry of Regional Development, Czech Republic
Challenges/lessons learned/experience from the MS
The point of view of the Czech Republic
16. 9. 2021

What we did from 2007…
Total: 841 evaluations, analyzes, studies
R&D: 172 evaluations, including process evaluations
R&D: 20 results evaluations
All outputs are available in Evaluation library here.
Research and development

What we know about R&D I.
Results of research centres:
• 4 000 FTE jobs for researchers
• 400 researchers abroad
• more than 25 000 students using their infrastructure
• cooperation between research institutions and industry has risen
• increasing professionalization of management of research projects
• higher performance of the centres (patents, publications in number and in quality)
• involving of research teams into international projects
• integration of research centres into international R&D network

What we know about R&D II.
61%
79%
38%
70%
29%
55%
25%
35%
45%
55%
65%
75%
85%
2006 2007 2008 2009 2010 2011 2012 2013 2014 2015 2016 2017 2018
Published articles Patents Industrial and utility designs
PERFORMANCE OF SUPPORTED RESEARCH CENTRES (OP RDI)Share of institutions with R&D centers within the total results of the Czech republic

Innovations
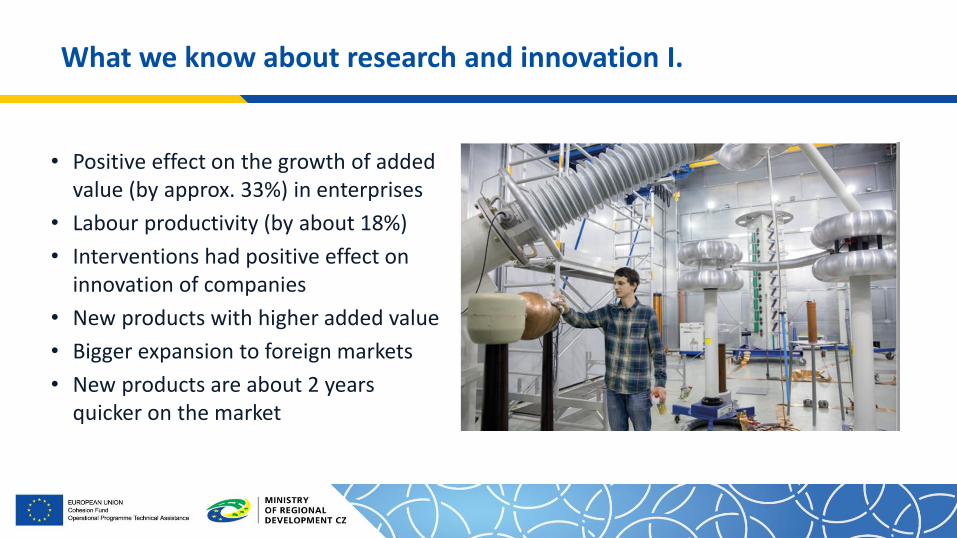
What we know about research and innovation I.
• Positive effect on the growth of added value (by approx. 33%) in enterprises
• Labour productivity (by about 18%)
• Interventions had positive effect on innovation of companies
• New products with higher added value
• Bigger expansion to foreign markets
• New products are about 2 yearsquicker on the market

Challenges (not only) for evaluations

Challenges I.
Time
Experts
Indicators, data

Challenges II.
Clear effect
Public aid
Aiming / definition
Questions for panelist
TIMEThe results in R&D are seen after longer period of time. How do you convince your management that even „old“ results are still useful and valuable?
INNOVATIVENESS
We know that there is limited interest for high level of innovation from beneficiaries. How to overcome this gap between what we want from the market from the strategical point of view and the everyday reality of companies?

Some Food for Thought
How many innovations do we really need?

Shaping Transitions with Evidence
9th Conference on the Evaluation of EU Cohesion PolicyPorto, 16-17 September 2021
Lessons from ex-post evaluations of R&I and SMEs competitiveness
Silvia Vignetti, CSIL

LESSONS DRAWING FROM PAST EXPERIENCES, IN PARTICULAR:
• Evaluation of investments in Research and Technological Development (RTD) infrastructures and activities supported by the European Regional Development Funds (ERDF) in the period 2007-2013
• Project duration: 2014-2016
• Ex post evaluation of Cohesion Policy programmes 2007-2013, focusing on the European Regional Development Fund (ERDF) and the Cohesion Fund (CF) - Work Package 2, Support to SMEs –Increasing Research and Innovation in SMEs and SME Development
• Project duration: 2019-2021
BACKGROUND

SMEs evaluation:- Analysis of expenditure data of 50 OP in
20 MS and related strategies- 8 case studies at the level of individual
OP- In depht analysis of 3 policy instruments
R&I evaluation- Mapping of projects and beneficiaries of
53 OPs in 18 MS- 7 case studies at the level of MS (multiple
OPs)- 21 deep dives for 21 policy instruments- 4 cross-cases analysis
SCOPE (1): width and depht
ANALYSIS OF EXPENDITURES
AND OP STRATEGIES
CASESTUDIES AT
MS/OP LEVEL
INDIVIDUALPOLICY
INSTRUMENTS

Mapping: examples
Number of policy instruments and public contribution amount paid in the 50 OPs by main objective
Types of funded projects, number and million EUR
Access and diffusion of ICT
6%
Business creation and development
26%
Creation of innovative companies
3%
Development of
technological or non-
technological innovation
8%
Eco-innovation3%Generic access
to finance3%
Infrastructures and related
services12%
Internationalisation and visibility
7%
Knowledge and technology
transfer3%
Networking2%
Support for improving capacities
4%
Support for R&D projects
23%
Number of instruments
Access and diffusion of ICT
6%
Business creation and development
33%
Creation of innovative companies
3%Development of
technological or non-
technological innovation
16%
Eco-innovation0.6%
Generic access to finance
5%
Infrastructures and related
services7%
Internationalisation and visibility
2%
Knowledge and technology
transfer1%
Networking0.4%
Support for improving capacities
1%
Support for R&D projects
26%
Paid Amount

Deep dives: examples
CMO #1: Economic effects of R&D projects
Policy instrument:Grant for
R&D projects
Development of the CyLknowledge-
based economy
Reduced risks to
embark in R&D
activities
SMEs introduce new or
improved products on the market Improved
economic performance of supported
SMEs
Start of R&D
projects
The R&D projects are successfully completed
SMEs introduce new or
improved production processes
R&D is meant to generate innovative
and marketable products
Propensity/interest for
carrying out R&D
Availability of complementary
sources of financing
Other policy instruments supporting public and
private R&D and innovation are successfully
implemented
A large number of SMEs undertakes successful R&D
strategies
The market demand for the research outputs has
been adequately estimated
Availability of skills to
implement the R&D project
The R&D projects also causedother changes, whichdetermined the generation of outcomes, like the improvement of the company reputation and the increase in employment.
- Observed economic performance is mainly in terms of increasing sales and export. Most of the effects are notyet visible. Expectations on future economic performance are generally positive.
- The economic crisis is an unexpected context variable thatinfluenced the projects and made their outcome even more uncertain.
- There is no information on how many projects wereinterrupted.
The risksassociated with R&D do not affectonly the projectstart, but also itssuccessfulimplementation.
The badeconomic contextand the high riskof R&D preventedmany SMEs to undertakesuccesfull R&D projects.

SCOPE (2): blurred boundaries
ERDF allocation for the 53 selected OPs by code of expenditure
Source: Authors’ elaboration based on DG REGIO 2007-2013 Cohesion data from closure reports

SCOPE (2): ERDF in the wider policy mix
Country covered by thestudy
Total ERDF contribution to RTD(01 and 02) over total R&Dexpenditure (2007-2013)
Total ERDF contribution to RTD (01and 02) over public R&Dexpenditure (2007-2013)
Belgium 0.30% 0.80%Czech Republic 8.10% 18.60%Germany 0.40% 1.30%Estonia 11.80% 25.50%Finland 0.20% 0.50%France 0.20% 0.60%Hungary 1.10% 3.00%Ireland 0.50% 1.70%Italy 0.80% 1.90%Lithuania 10.00% 13.60%Latvia 14.80% 20.90%Poland 10.90% 16.40%Portugal 2.60% 6.00%Romania 6.30% 9.90%Slovenia 1.50% 5.10%Slovakia 19.40% 33.50%United Kingdom 0.30% 0.80%
0.00%
0.05%
0.10%
0.15%
0.20%
0.25%
0.30%
0.35%
0.40%
LU IE NL FR DK BE AT UK SE DE FI IT CY ES MT RO BG SK CZ EE LT SI PL LV GR HU PT
ERDF for business support State Aid for SMEs
ERDF allocated to business support and State Aid expenditures for “SMEs” by Member State (both as a percentage of GDP)
Source: CSIL based on DG Regio and 2014 State Aid Scoreboard

Objective: - Expenditure data
- Statistical data on socio-economic context, R&D performance, SME competitiveness
- Analysis of programme strategies
- Monitoring indicators (high variability in terms of reliability)
- Secondary evidence (evaluations at MS level)
Subjective:- SMEs study: 400 interviews to stakeholders, 700 questionnaires collected, stakeholders seminar
- R&D 200 interviews to stakeholders, stakeholders seminar
EVIDENCE

Example of use of surveys data
R&D grant
C1.5 Funding risk
A8. Spinoff from university
A9. Spinoff from enterprise
D1.1 Larger range of products
C1.3.2 Previous collaboration with
universities
D1.4 More knowledge and
assets via collaboration
D4.6 Increased capacity to resist the
crisis
A6. Education
D1.8 Hired new
employees
D1.5 Improved reputation
D4.1 Increased sales
D4.5 Decreased total costs
F2.6 Future increase in
collaboration with
universities
F2.8 Increasing R&D
expenditure
E3 Willingness to apply in
future
D4.4 Increased exports
D4.3 Increased type of clients
D5. Future expected results
F2.7 Future increase in
collaboration with
enterprises
F2.1 Better opinion of
public support
D1.7 Improved work
organisation
Input file: DB_CyLData rows: 97
Learning algorithm: Bayesian SearchElapsed time: 78.438 secondBest score in iteration 4: -3751.35
Algorithm parameters: Max parent count: 8Iterations: 20Sample size: 50Seed: 0Link probability: 0.1Prior link probability: 0.001Max search time: 0Use accuracy as score: no
D1.2 Upgraded production
process
D1.3 Improved
R&D equipment
D1.6 Entered new foreign
markets
A10 NACE sector
Size
Year of project start
G3 Initial export share
E2 Satisfaction for the application
process
E2 Satisfaction for the payment
process
C1.4 Previous partnership with
enterprises
C1.2 Achievement of R&D objective
Eco
nom
icperf
orm
ance
Province NUTS 3
C1.5 Market and
managerial R&D risk

Contribution of past evaluations: - Provide a detailed overview of where the money was spent and to do what
- Describe the trajectories of change of target variables
- Discuss contribution of ERDF and role in the broader policy mix
- Discuss contextual factors enabling/hampering materialisation of results
Remaining challenges:- Always adopt a counterfactual approach
- Provide conclusive answers on attribution of impact
- Reconciling evidence and level of analysis for a conclusive answer
- Providing answers to all (too many?) evaluation questions
Summing up


