42
June 5, 2014 Gillette, WY Vladimir Alvarado, Ph.D. 1 Workshop: Minnelusa I Day 3 10:40 – 11:40 am ASP Blend Optimization Challenges and Strategies

June 5, 2014 Gillette, WY
Vladimir Alvarado, Ph.D.
1
Workshop: Minnelusa I
Day 3 10:40 – 11:40 am
ASP Blend Optimization Challenges and Strategies
Outline
Introduction: Critical Issues
Issues specific to Minnelusa reservoirs
Minnelusa ASP Design Example
Minnelusa SP/ASP at higher temperature
Summary
2

Issues specific to Minnelusa
Chemical methods critical constraints: Reservoir characterization → Conformance &
location of ROIP. Water source → Fresh vs. produced Rock-fluid interaction → Calcium sulfate!
What about Minnelusa sands? Foxhill water is not a major issue, except for exacerbation of anhydrite dissolution. This sustains calcium concentration at equilibrium
3

Issues specific to Minnelusa
Most reservoirs contain measurable fractions
of calcium sulfate in the form of anhydrite
Water source typically employed ranges in
salinity from 100’s to less than 2000 ppm,
which leads to dissolution of anhydrite
As a result, salinity can be low, but calcium
concentration can be high 4

Issues specific to Minnelusa (cont.)
Low-salinity conditions complicates
attainment of optimum salinity, which can be
mitigated with the use of alkali
Inexpensive alkalis will tend to precipitate and
high-pH conditions can accelerate anhydrite
dissolution
5

MINNELUSA ASP EXAMPLE Casey Gregersen and Mahdi Kazempour
6

Parameter • Salinity • Surfactant blend ratio • Soap/surfactant ratio
Optimal parameter
Winsor Type - I
Winsor Type - II
Varying parameter
Winsor Type - III
mic
ro
mic
ro
Pipette (bottom sealed)
Brine + surfactant
Oil
Initial interface
24 hr
7

Connate brine
• Injection brine
Only 1600 ppm NaCl
Component Wt (gr)
MgSO4 0.313
KCl 0.136
CaCl2.2H2O 1.676
NaCl 0.697
Na2SO4 4.661
TDS 7100 ppm
Materials and Methods
8
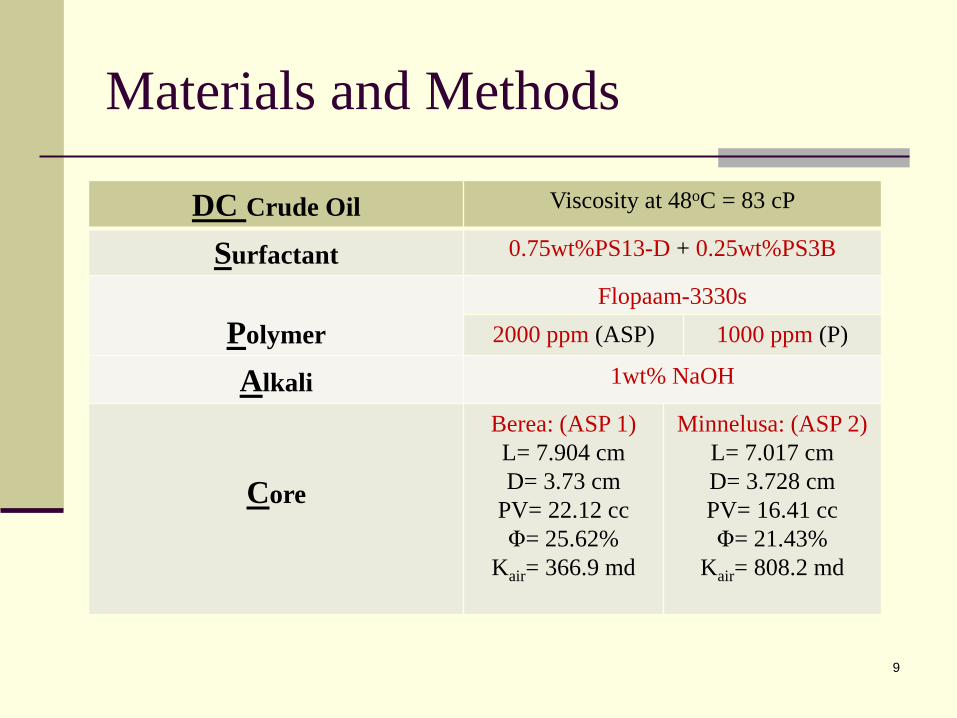
DC Crude Oil Viscosity at 48oC = 83 cP
Surfactant 0.75wt%PS13-D + 0.25wt%PS3B
Polymer
Flopaam-3330s 2000 ppm (ASP) 1000 ppm (P)
Alkali 1wt% NaOH
Core
Berea: (ASP 1) L= 7.904 cm D= 3.73 cm
PV= 22.12 cc Φ= 25.62%
Kair= 366.9 md
Minnelusa: (ASP 2) L= 7.017 cm D= 3.728 cm PV= 16.41 cc Φ= 21.43%
Kair= 808.2 md
Materials and Methods
9
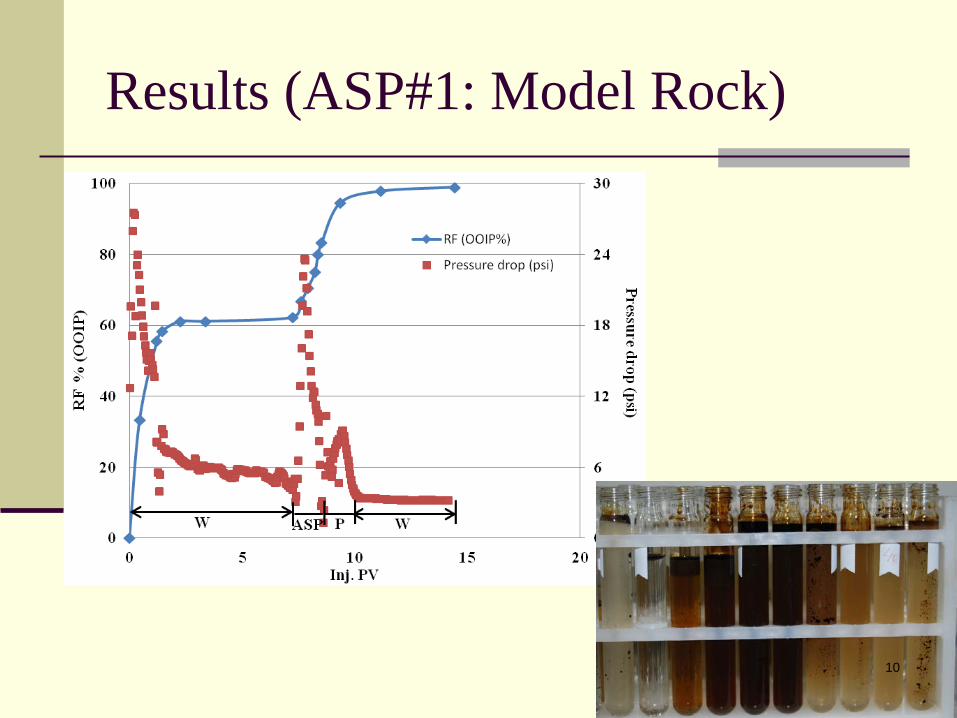
Results (ASP#1: Model Rock)
10
11
WF ASP P WF
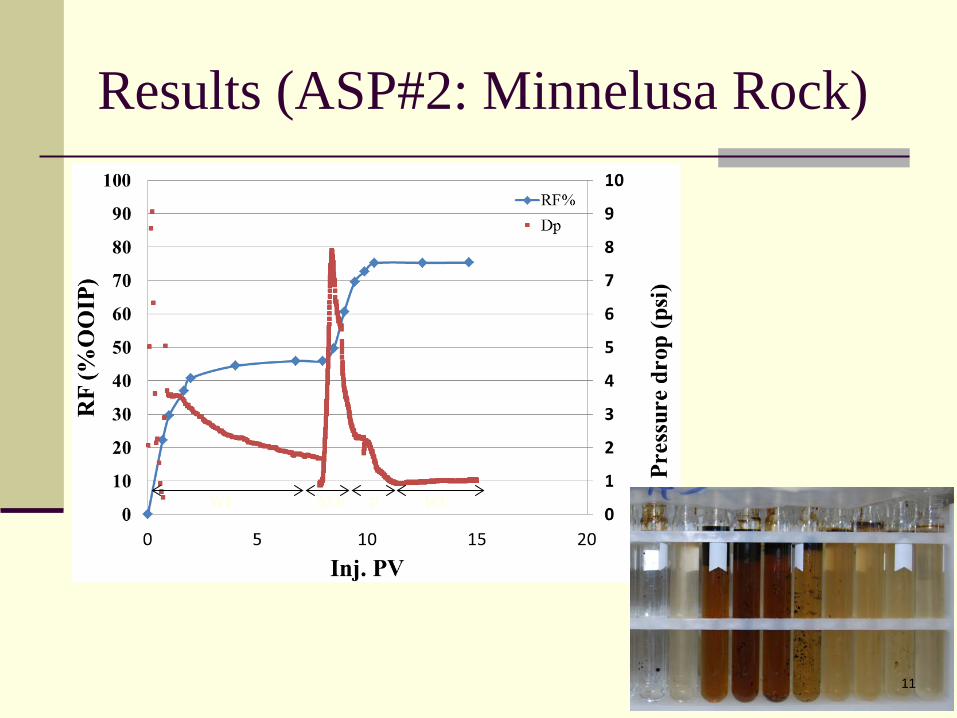
Results (ASP#2: Minnelusa Rock)
11

Observed precipitation at effluent samples:
ClKSi
ClCa
K
CaK
S
O
Na
Cl
Ca
0 1 2 3 4 5 6 7 8 9 10keVFull Scale 4240 cts Cursor: -0.031 (82 cts)
Spectrum 1
ClKSi Cl
KCa
CaS
K ONa
Cl
Ca
0 1 2 3 4 5 6 7 8 9 10 11keVFull Scale 5549 cts Cursor: -0.009 (361 cts)
Spectrum 4
As we expected some secondary minerals was produced (here calcite, also some sulfur was produced which is a really evidence for anhydrite dissolution) 12

MITIGATION OF ANHYDRITE DISSOLUTION
Casey Gregersen and Mahdi Kazempour
13
14
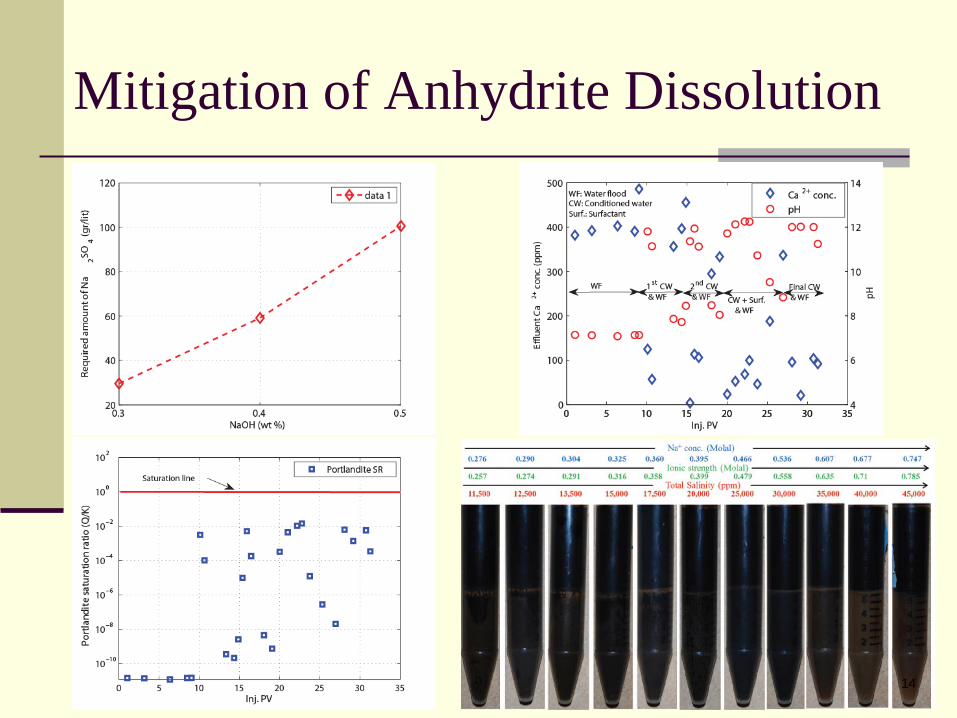
Mitigation of Anhydrite Dissolution
14

Model Rock
WF
ASP
P W
Anhydrite-Rich Rock
Traditional Design
Designed B
rine
Kazempour et al., 2012, 2013
Mitigation of Anhydrite Dissolution
15
MINNELUSA ASP/SP AT HIGH TEMPERATURE
Casey Gregersen and Mahdi Kazempour
16
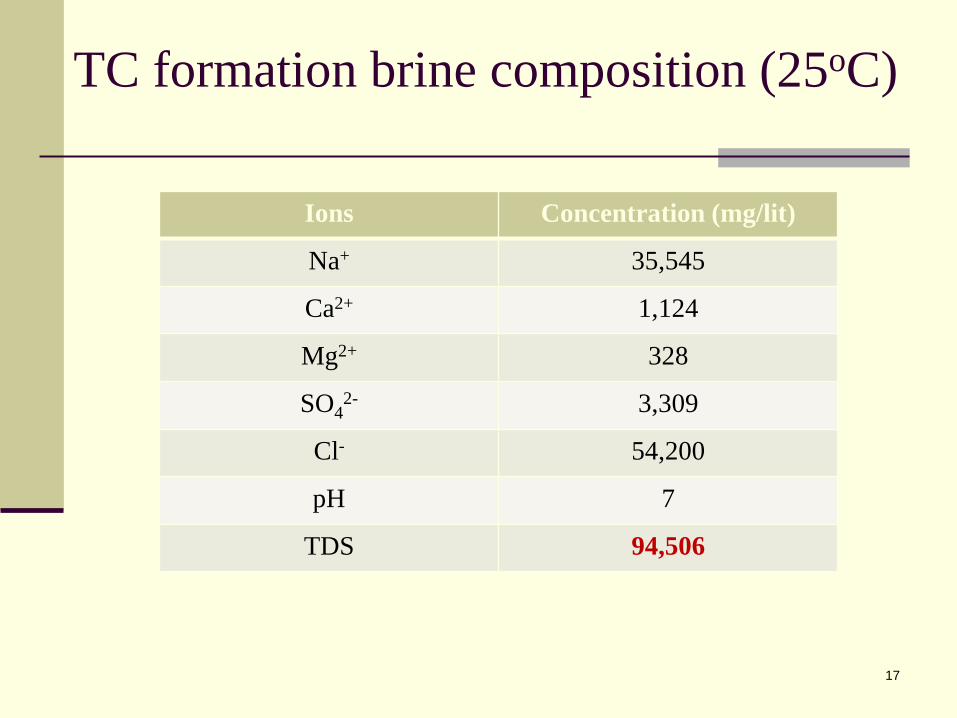
TC formation brine composition (25oC)
Ions Concentration (mg/lit)
Na+ 35,545
Ca2+ 1,124
Mg2+ 328
SO42- 3,309
Cl- 54,200
pH 7
TDS 94,506
17
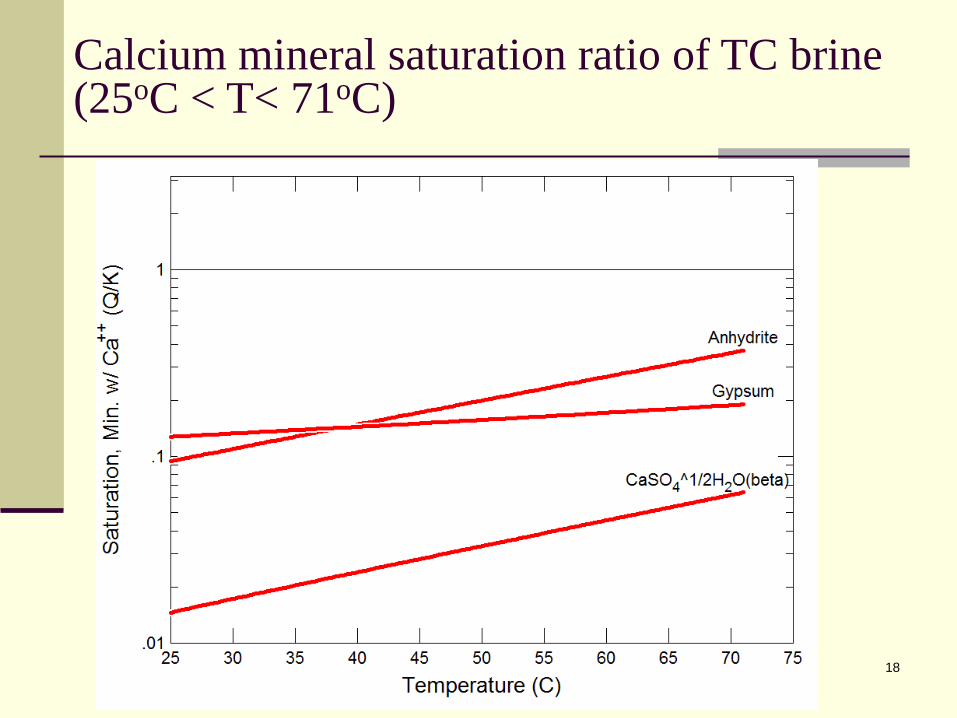
Calcium mineral saturation ratio of TC brine (25oC < T< 71oC)
18

Surfactant Bulk Precipitation Phase-behavior
Surf1 Cloudy + OK
Surf2
Cloudy
+ OK
Surf3
Cloudy ( not very)
- OK
Surf4
Clear (but not 100%)
- OK
Surf5
Cloudy
- Not satisfactory
Surf6
Cloudy
- OK
TC crude oil Aqueous: 0.5wt% surfactant + 50% diluted TC brine
Phase-behavior (coarse screening)
19
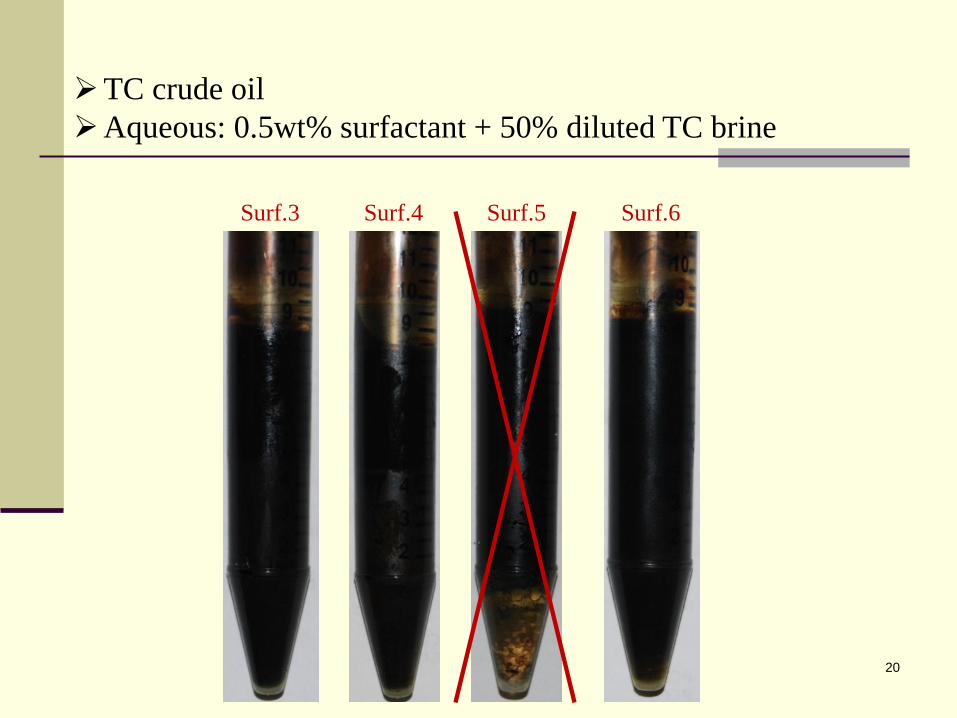
TC crude oil Aqueous: 0.5wt% surfactant + 50% diluted TC brine
Surf.3 Surf.4 Surf.5 Surf.6
20
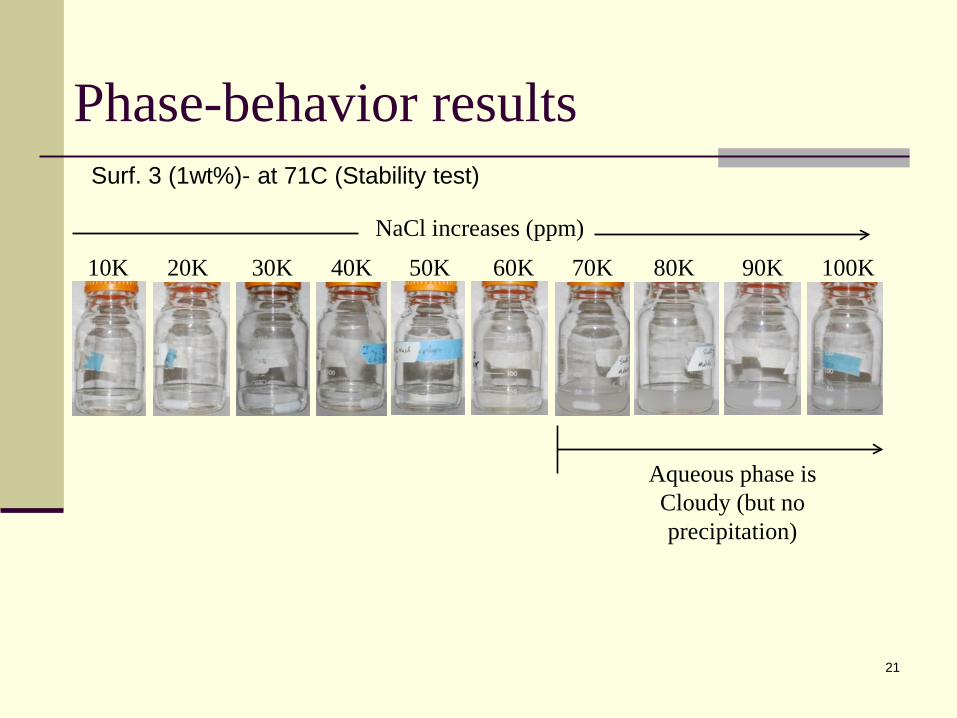
Phase-behavior results Surf. 3 (1wt%)- at 71C (Stability test)
10K 20K 30K 40K 50K 60K 70K 80K 90K 100K
NaCl increases (ppm)
Aqueous phase is Cloudy (but no precipitation)
21
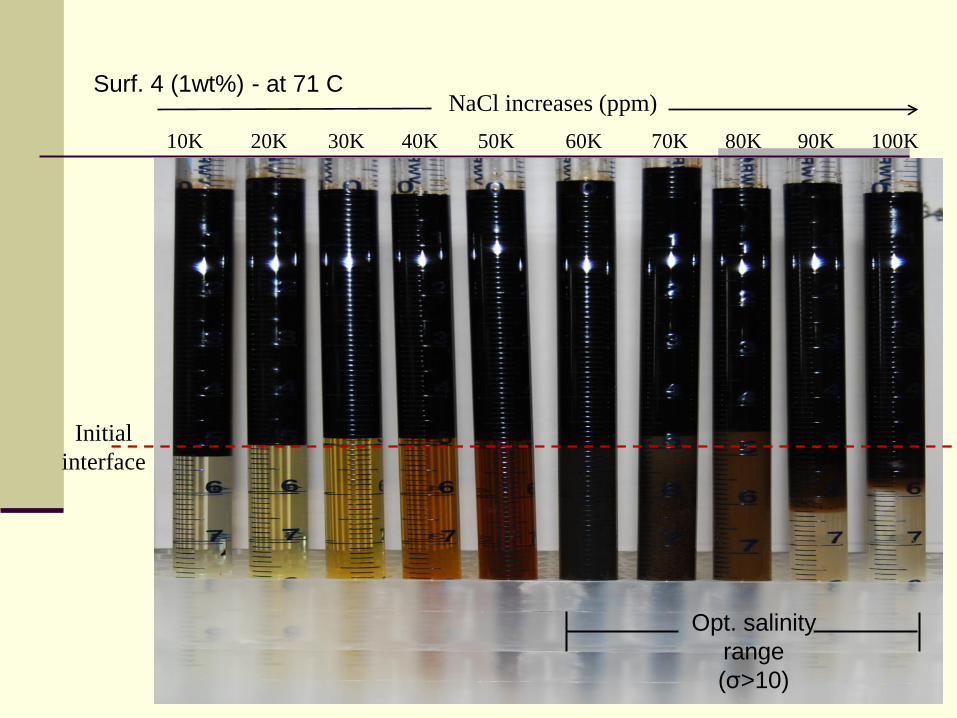
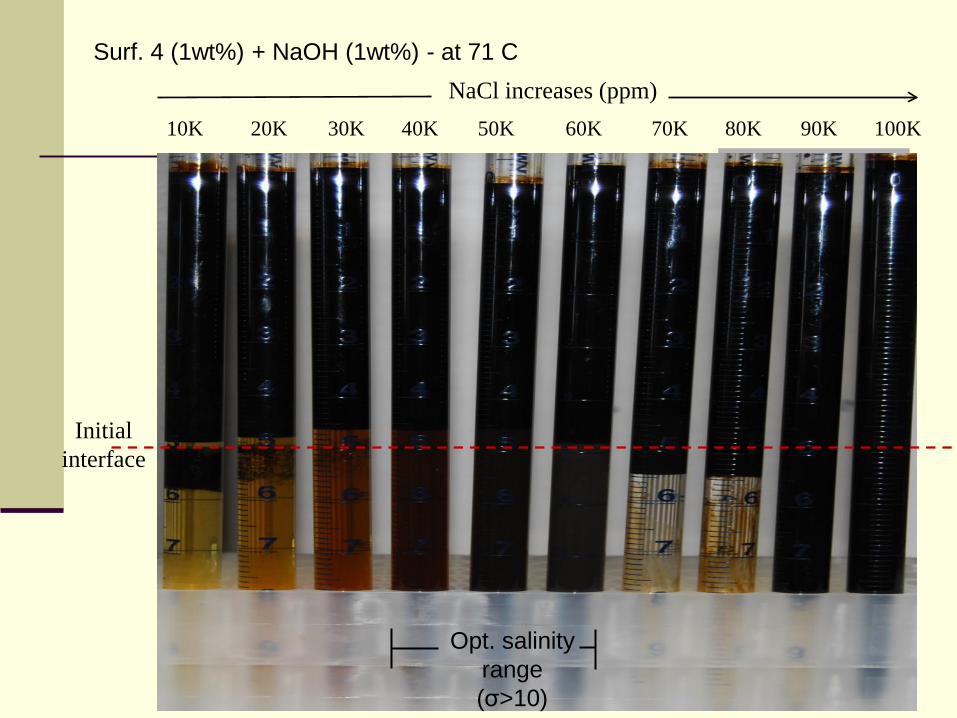
Surf. 4 (1wt%) - at 71 C
10K 20K 30K 40K 50K 60K 70K 80K 90K 100K
NaCl increases (ppm)
Initial interface
Opt. salinity range (σ>10)
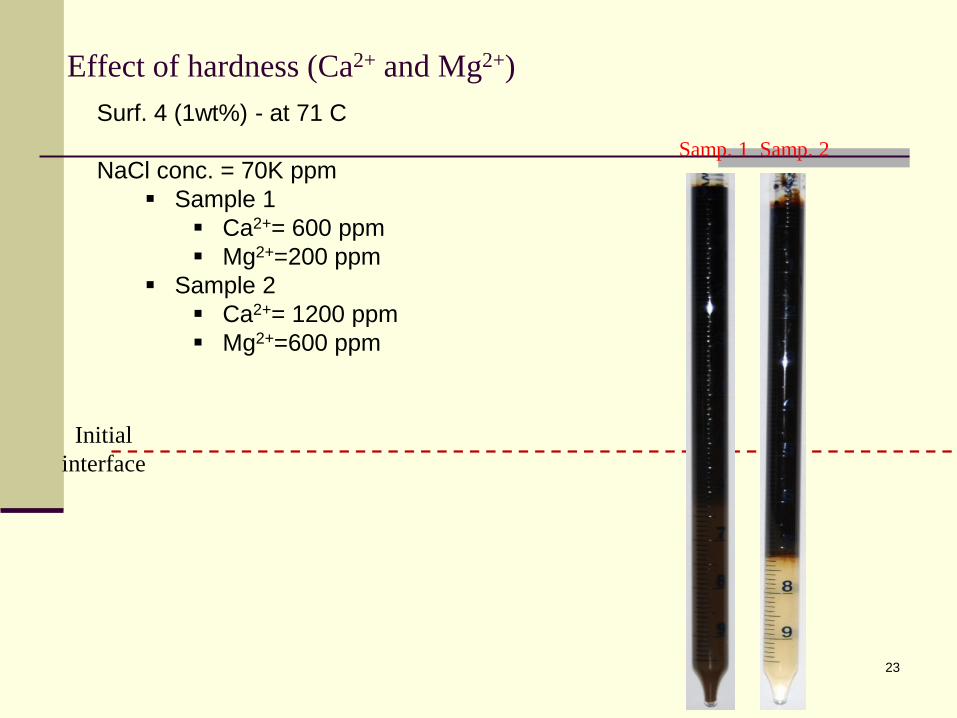
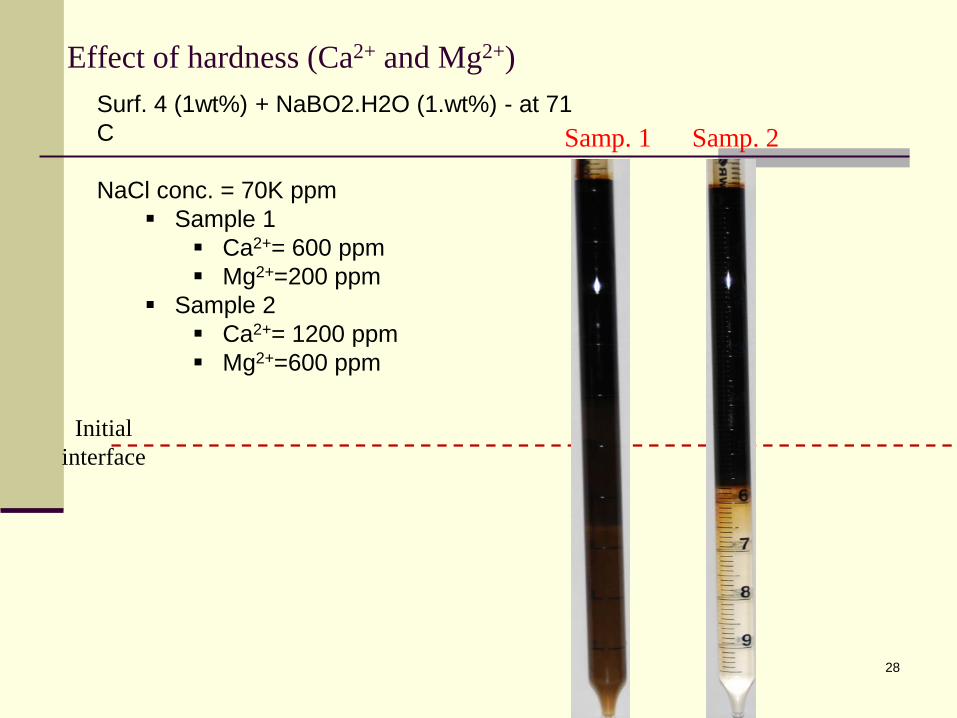
Effect of hardness (Ca2+ and Mg2+) Surf. 4 (1wt%) - at 71 C NaCl conc. = 70K ppm
Sample 1 Ca2+= 600 ppm Mg2+=200 ppm
Sample 2 Ca2+= 1200 ppm Mg2+=600 ppm
Initial interface
Samp. 1 Samp. 2
23
Effect of alkali
24
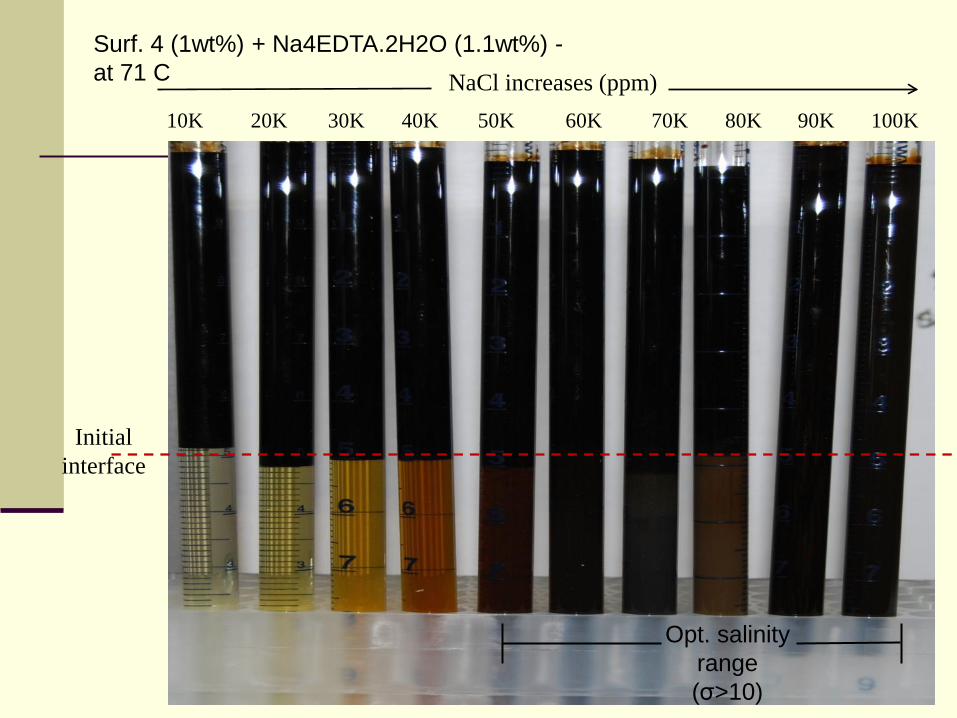
Surf. 4 (1wt%) + Na4EDTA.2H2O (1.1wt%) - at 71 C
10K 20K 30K 40K 50K 60K 70K 80K 90K 100K
NaCl increases (ppm)
Initial interface
Opt. salinity range (σ>10)
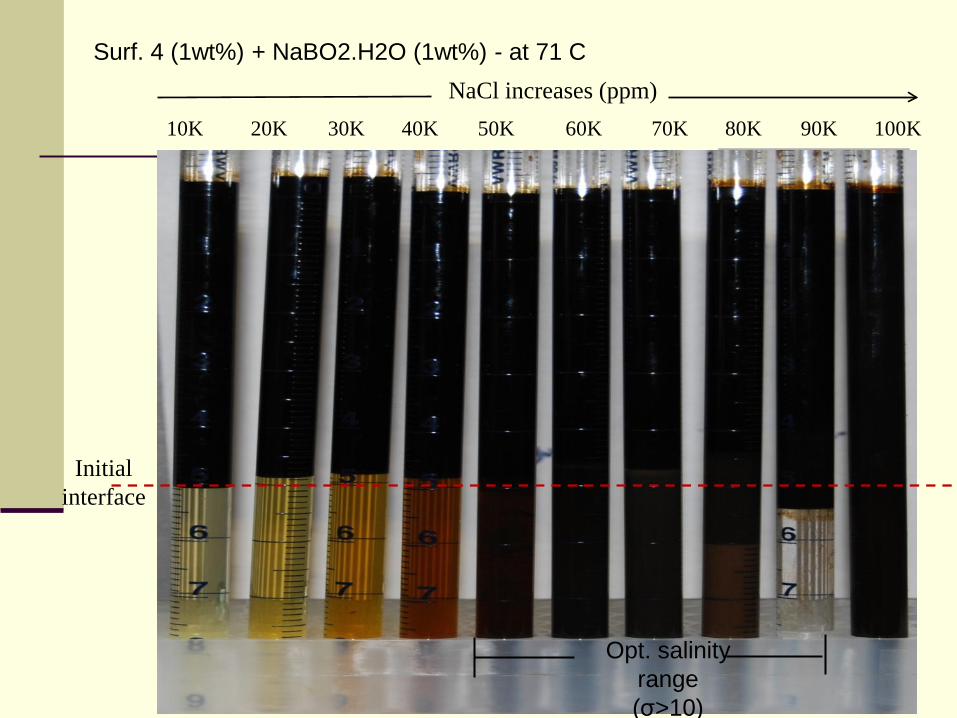
Surf. 4 (1wt%) + NaBO2.H2O (1wt%) - at 71 C
10K 20K 30K 40K 50K 60K 70K 80K 90K 100K
NaCl increases (ppm)
Initial interface
Opt. salinity range (σ>10)
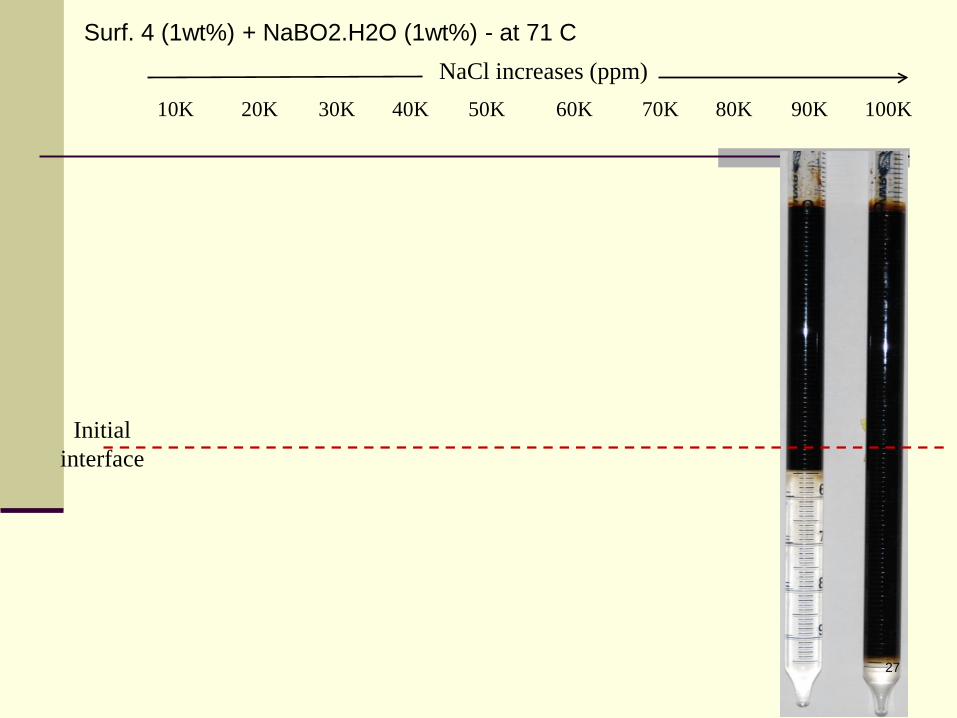
Surf. 4 (1wt%) + NaBO2.H2O (1wt%) - at 71 C
10K 20K 30K 40K 50K 60K 70K 80K 90K 100K
NaCl increases (ppm)
Initial interface
27
Effect of hardness (Ca2+ and Mg2+) Surf. 4 (1wt%) + NaBO2.H2O (1.wt%) - at 71 C NaCl conc. = 70K ppm
Sample 1 Ca2+= 600 ppm Mg2+=200 ppm
Sample 2 Ca2+= 1200 ppm Mg2+=600 ppm
Initial
interface
Samp. 1 Samp. 2
28
Surf. 4 (1wt%) + NaOH (1wt%) - at 71 C
10K 20K 30K 40K 50K 60K 70K 80K 90K 100K
NaCl increases (ppm)
Initial interface
Opt. salinity range (σ>10)

Surf. 4 (1wt%) + NaOH (1wt%) - at 71 C
10K 20K 30K 40K 50K 60K 70K 80K 90K 100K
NaCl increases (ppm)
Initial interface
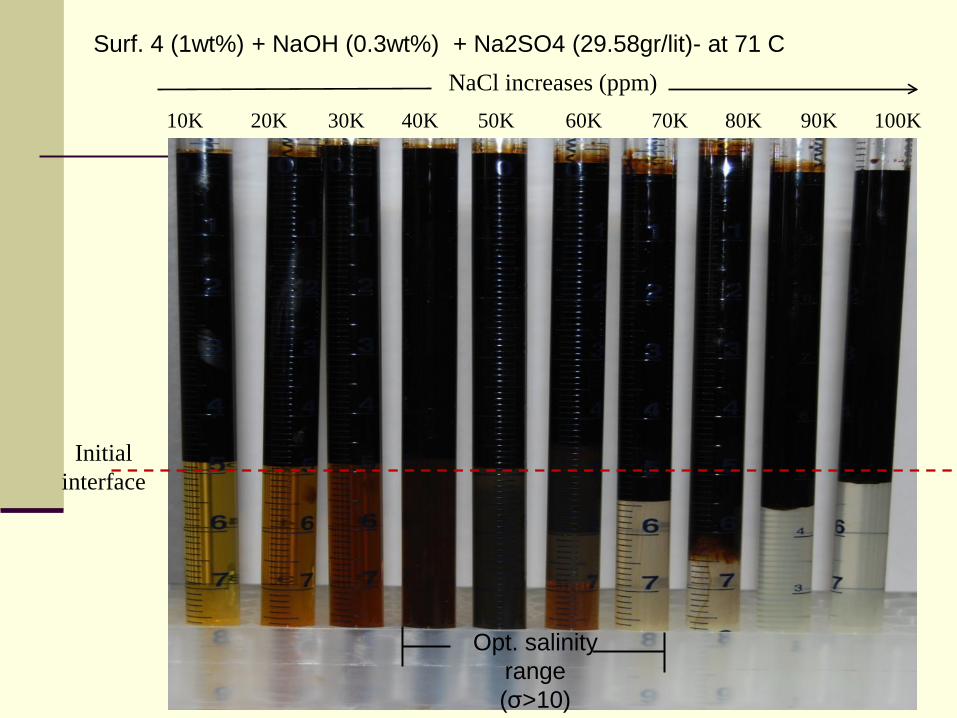
Surf. 4 (1wt%) + NaOH (0.3wt%) + Na2SO4 (29.58gr/lit)- at 71 C
10K 20K 30K 40K 50K 60K 70K 80K 90K 100K
NaCl increases (ppm)
Initial interface
Opt. salinity range (σ>10)
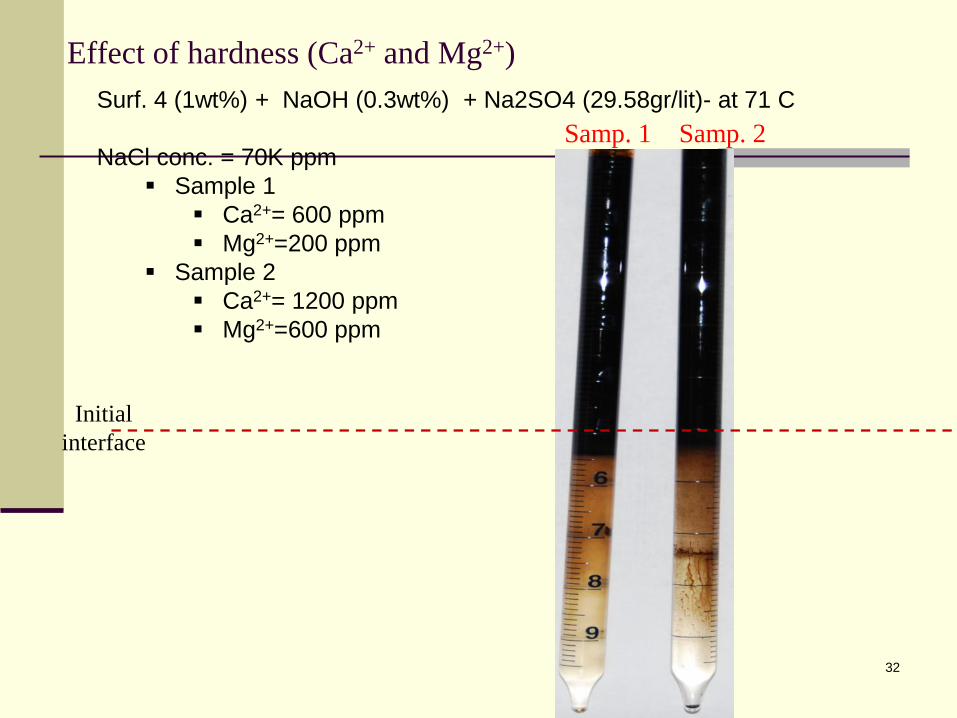
Effect of hardness (Ca2+ and Mg2+) Surf. 4 (1wt%) + NaOH (0.3wt%) + Na2SO4 (29.58gr/lit)- at 71 C NaCl conc. = 70K ppm
Sample 1 Ca2+= 600 ppm Mg2+=200 ppm
Sample 2 Ca2+= 1200 ppm Mg2+=600 ppm
Initial interface
Samp. 1 Samp. 2
32
Effect of surfactant concentration↓
33

Surf. 4 (0.5wt%) - at 71 C
10K 20K 30K 40K 50K 60K 70K 80K 90K 100K
NaCl increases (ppm)
Initial interface
Opt. salinity range (σ>10)
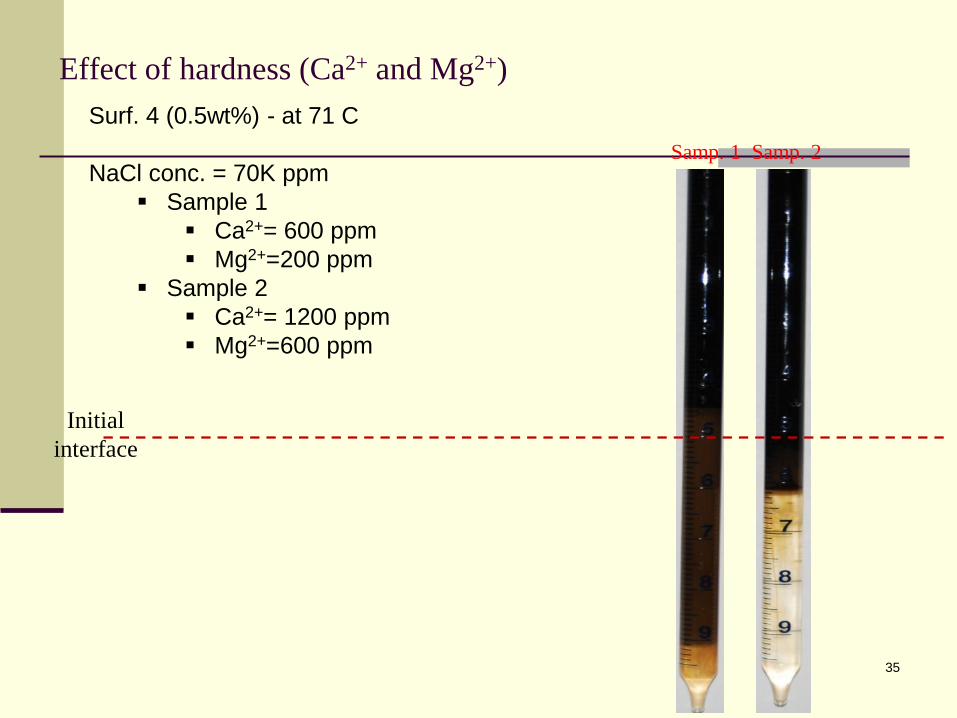
Effect of hardness (Ca2+ and Mg2+) Surf. 4 (0.5wt%) - at 71 C NaCl conc. = 70K ppm
Sample 1 Ca2+= 600 ppm Mg2+=200 ppm
Sample 2 Ca2+= 1200 ppm Mg2+=600 ppm
Initial interface
Samp. 1 Samp. 2
35
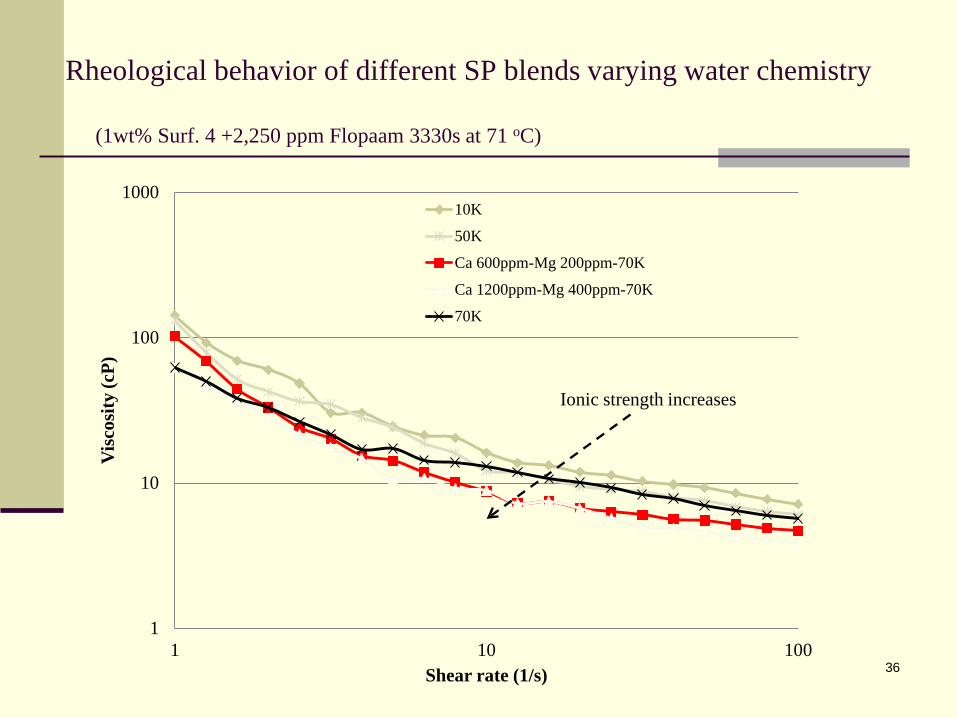
Rheological behavior of different SP blends varying water chemistry (1wt% Surf. 4 +2,250 ppm Flopaam 3330s at 71 oC)
1
10
100
1000
1 10 100
Vis
cosi
ty (c
P)
Shear rate (1/s)
10K
50K
Ca 600ppm-Mg 200ppm-70K
Ca 1200ppm-Mg 400ppm-70K
70K
Ionic strength increases
36
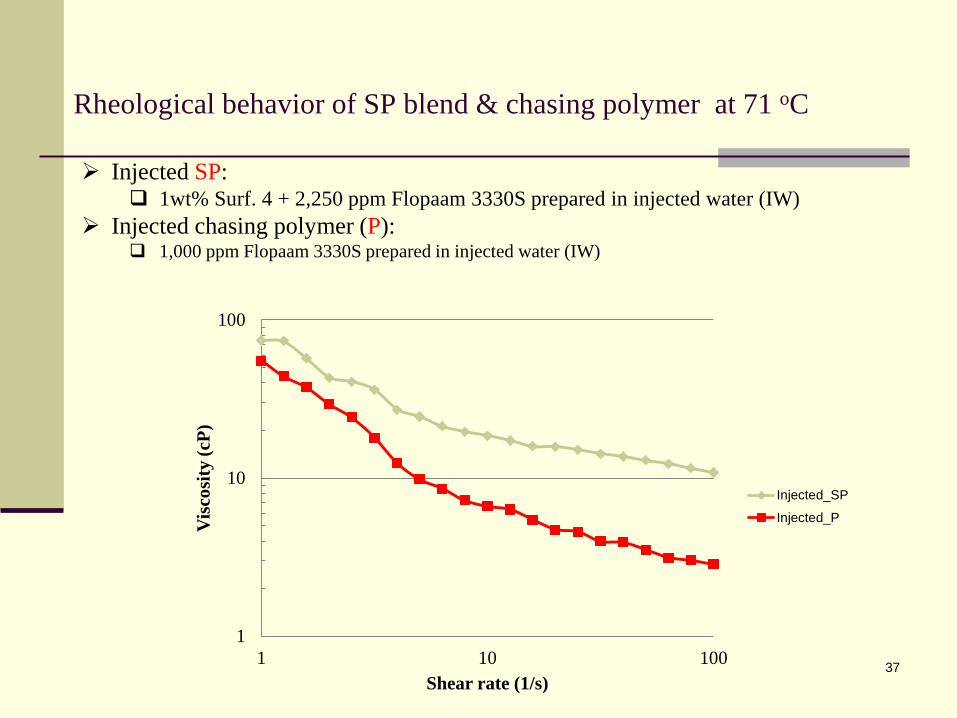
Rheological behavior of SP blend & chasing polymer at 71 oC
Injected SP: 1wt% Surf. 4 + 2,250 ppm Flopaam 3330S prepared in injected water (IW)
Injected chasing polymer (P): 1,000 ppm Flopaam 3330S prepared in injected water (IW)
1
10
100
1 10 100
Vis
cosi
ty (c
P)
Shear rate (1/s)
Injected_SP
Injected_P
37

Water composition during different flooding steps
Waters Connate water (CW) Water flooding (WF)
Injected water (IW)
Ions Concentration (mg/lit)
Na+ 35,545 29,363 17,698
Ca2+ 1,124 955.4 627
Mg2+ 328 278.8 162
SO42- 3,309 2,812.7 2,876
Cl- 54,200 46,070 25,085
pH 7 7 7
TDS 94,506 80,330 46,448

First chemical flooding condition Flow rate: 0.5 cc/min Confining pressure: 2,000 psi Back-pressure: 1,500 psi Temperature: 71 oC Utilized core: core 104-b
• Contains anhydrite • L= 6.671 cm and D= 3.805cm • Porosity= 16.2% and PV= 14.13 cc • Kair= 139 mD
Flooding steps: 1. Aging the core in connate brine (TDS= 95K) for one week at
above conditions and then measuring brine permeability (Sw=1) 2. Establishing Swi by injecting TC crude oil and then aging the core
for one more week for any possible of wettability alteration in presence of crude oil
3. measuring oil permeability at Swi at the end of aging period 4. 8 PV injection of WF brine in secondary mode (TDS= 80K) 5. Measuring water permeability at Sor 6. 1 PV injection of SP blend prepared in IW (TDS= 46K) 7. 1 PV injection of P solution prepared in IW (TDS= 46K) 8. 3 PV injection of WF brine (TDS= 80K) in the post-brine flooding
mode 39

Core 104-b (anhydrite distribution)
2) 3)
4)

Primary results of first coreflooding
WF SP flood P flood Post-WF
Looks very promising 41
Summary
Low salinity conditions in Minnelusa reservoirs under fresh water flooding can be addressed with proper ASP design
Issues associated with anhydrite dissolution can be dealt with proper water strategy and understanding of geochemical effects
High-salinity, higher temperature reservoirs are better targets for SP designs, which alleviates the need for high-quality water
42


