Interagency Commodity Estimates Committee Forecasts World Agricultural Outlook Board, Chairing Agency Economic Research Service Foreign Agricultural Service Farm Service Agency Agricultural Marketing Service World Agricultural Supply and Demand Estimates Report of April 10, 2018
Transcript
Interagency Commodity Estimates Committee ForecastsWorld Agricultural Outlook Board, Chairing Agency
Economic Research ServiceForeign Agricultural Service
Farm Service AgencyAgricultural Marketing Service
World Agricultural Supply and Demand EstimatesReport of April 10, 2018
WASDE: World Agricultural Supply and Demand Estimates
Secretary's WASDE Briefing Slides
Foreign Ag Service: World Agricultural Production
Weekly Weather and Crop Bulletin
Links to the latest WASDE related publicationsOffice of the Chief Economist
World Agricultural Outlook Board (WAOB)
US Drought Monitor ( in cooperation with NOAA and NDMC)
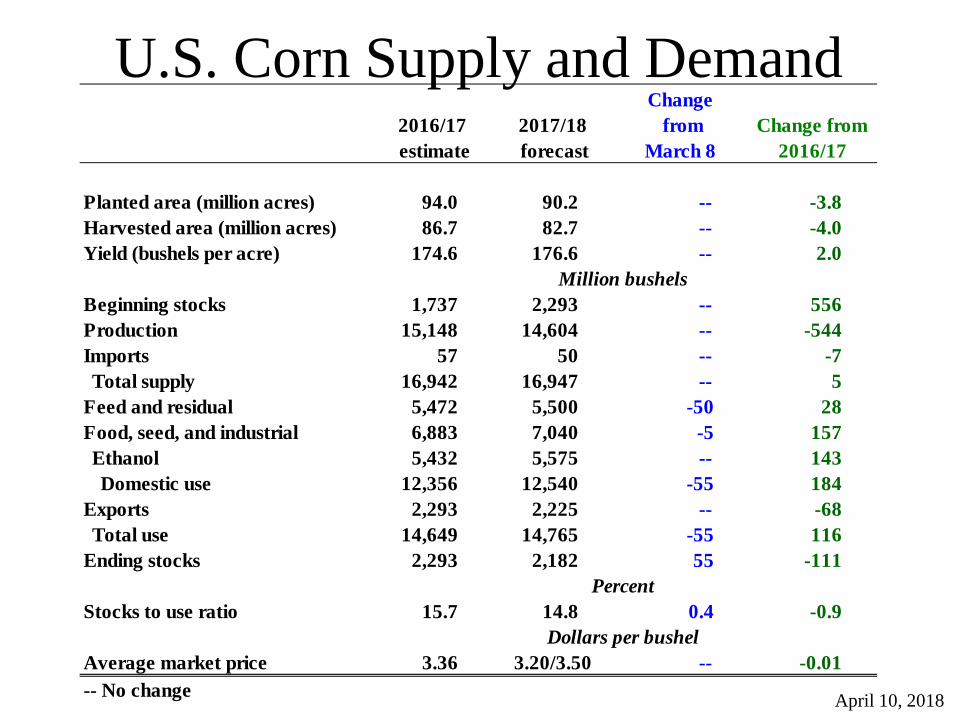
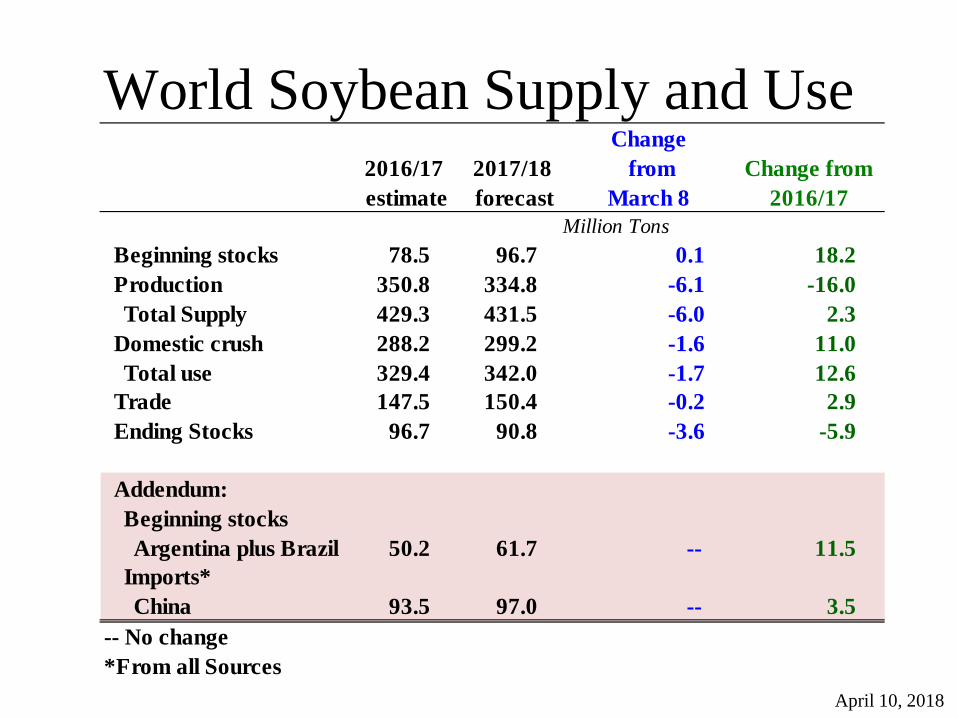
Domestic use 131.4 120.0 -- -11.4Exports 116.7 96.0 -4.0 -20.7Total use 248.0 216.0 -4.0 -32.0
Ending stocks 46.0 33.3 4.1 -12.8
Stocks to use ratio 18.6 15.4 2.1 -3.2
Average market price 10.40 12.40/12.80 0.10 2.20-- No change
Percent
Dollars per cwt
Agricultural Weather AssessmentsWorld Agricultural Outlook Board
MajorIntensityProductionMinor
*Source: IBGE
JAN FEB MAR APR MAY JUN JULAUG SEP OCT NOV DEC
Soybean crop calendar for most of Brazil
Period of Highest Intensity
PlantHarvest
Leading Soybean Producers1) Mato Grosso2) Parana3) Rio Grande do Sul4) Goias1
23
4
MajorIntensityProductionMinor
*Source: IBGE
JAN FEB MAR APR MAY JUN JULAUG SEP OCT NOV DEC
First-crop corn crop calendar for most of Brazil
Period of Highest Intensity
PlantHarvest
Leading First-Crop Corn Producers1) Minas Gerais2) Rio Grande do Sul3) Parana4) Santa Catarina
123
4
MajorIntensityProductionMinor
*Source: IBGE
JAN FEB MAR APR MAY JUN JULAUG SEP OCT NOV DEC
Rice crop calendar for most of Brazil
Period of Highest Intensity
PlantHarvest
Leading Rice Producers1) Rio Grande do Sul2) Santa Catarina3) Tocantins4) Mato Groso4
1
3
2
April 10, 2018
MajorIntensityProductionMinor
*Source: IBGE
JAN FEB MAR APR MAY JUN JUL AUG SEP OCTNOV DEC
*Cotton crop calendar for most of Brazil
Period of Highest Intensity
PlantHarvest
Leading Cotton Producers1) Mato Grosso2) Bahia3) Mato Grosso do Sul4) Goias1 2
34
MajorIntensityProductionMinor
*Source: IBGE
Leading Second-Crop Corn Producers1) Mato Grosso2) Parana3) Mato Grosso do Sul4) Goias1
32 4
* Later planting (Feb – Jun) in northeast
JAN FEB MAR APR MAY JUN JUL AUG SEP OCTNOV DEC
Second-crop corn calendar for most of Brazil
Period of Highest Intensity
PlantHarvest
* Later planting (Apr – Jul) in northeast
Agricultural Weather AssessmentsWorld Agricultural Outlook Board April 10, 2018
Foreign Agricultural ServiceOffice of Global AnalysisIPA Division
Mato GrossoMODIS 8-day NDVI Anomaly
Dec 19 -26, 2017
Rio Grande do SulMODIS 8-day NDVI Anomaly
Feb 10-Feb 17, 2018
BET
ER
NO
RM
AL
WO
RSE
MODIS NDVI Anomaly during peak greeness (soybeans) indicates vegetation condition generally near normal in Mato Grosso and north Rio Grande do Sul but below normal in south Rio Grande do Sul.
April 10, 2018
Foreign Agricultural ServiceOffice of Global AnalysisIPA Division
April 10, 2018
(%)
Rio Grandedo Sul
SantaCatarina
Mato GrossoBahia
Mato Grossodo Sul
Parana
SaoPaulo
MinasGerais
Goias
Tocantins
Maranhao
Piaui
ParaAmazonas
Rondonia
Roraima
Amapa
Acre
HarvestingJAN FEB MAR APR MAY JUN JULAUG SEP OCT NOV DEC
Soybean crop calendar for most of BrazilPlanting
FillFlower
Temperature Departure from Normal (C)November 2017
Percent of Normal Rainfall (%)November 2017
(°C)
Rio Grandedo Sul
SantaCatarina
Mato GrossoBahia
Mato Grossodo Sul
Parana
SaoPaulo
MinasGerais
Goias
Tocantins
Maranhao
Piaui
ParaAmazonas
Rondonia
Roraima
Amapa
Acre
Rio Grandedo Sul
Agricultural Weather AssessmentsWorld Agricultural Outlook Board April 10, 2018
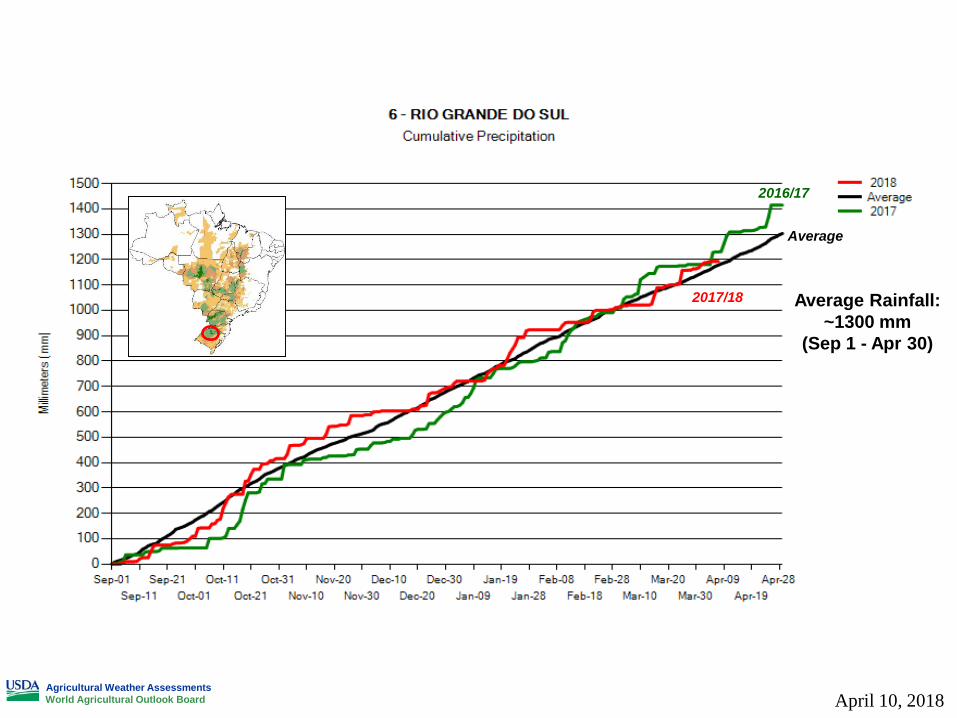
Average
2017/18
2016/17
Average Rainfall:~1300 mm
(Sep 1 - Apr 30)
Agricultural Weather AssessmentsWorld Agricultural Outlook Board April 10, 2018
Average
2017/18
2016/17
Average Rainfall:~940 mm
(Sep 1 - Apr 30)
Agricultural Weather AssessmentsWorld Agricultural Outlook Board April 10, 2018
Average
2017/18
2016/17
Agricultural Weather AssessmentsWorld Agricultural Outlook Board April 10, 2018
2017/18
Average
2016/17
Agricultural Weather AssessmentsWorld Agricultural Outlook Board April 10, 2018
Average
2017/18
2016/17
Agricultural Weather AssessmentsWorld Agricultural Outlook Board April 10, 2018
Average
2017/18
2016/17
Agricultural Weather AssessmentsWorld Agricultural Outlook Board April 10, 2018
Brazil Soybeans
Rio Grandedo Sul
SantaCatarina
Major
Soybean Production*Average (2009-13)
IntensityProductionMinor
*Source: IBGE
Mato GrossoBahia
Mato Grossodo Sul
Parana
SaoPaulo
MinasGerais
Goias
Tocantins
Maranhao
Piaui
a – Cearab – Rio Grande do Nortec – Paraibad – Pernambucoe – Alagoasf – Sergipeh – Espirito Santoi – Rio de Janeiro
abc
de
f
h
i
Para
Amazonas
Rondonia
Roraima
Amapa
Acre
HarvestingJAN FEB MAR APR MAY JUN JULAUG SEP OCT NOV DEC
Soybean crop calendar for most of BrazilPlanting
FillFlower
Source: IBGE Brazil
* State-Level Production(as % of total)
Mato GrossoParanaRio Grande do SulGoiasMato Grosso do SulMinas GeraisBahiaSao PauloMaranhaoSanta CatarinaTocantinsOther
30191411
7442222
~3
* 2009 to 2013 Average
Agricultural Weather AssessmentsWorld Agricultural Outlook Board April 10, 2018
Foreign Agricultural ServiceOffice of Global AnalysisIPA Division
Rio Grande do SulWhite points indicate soybean observations
April 10, 2018
Foreign Agricultural ServiceOffice of Global AnalysisIPA Division
Drought-stressed soybean plants with few pods and malformed shriveled seed
coats
Soybean Crop, Southeastern Rio Grande do Sul March 2018
April 10, 2018
2.00
2.20
2.40
2.60
2.80
3.00
3.20
3.40
3.60
0
20,000
40,000
60,000
80,000
100,000
120,000
140,000
2007
/08
2008
/09
2009
/10
2010
/11
2011
/12
2012
/13
2013
/14
2014
/15
2015
/16
2016
/17
2017
/18
F
MT/
HA
Thou
sand
Hec
tare
s or M
etric
Tons
BRAZIL Soybeans
Area Production Yield Source: USDA/FAS/PSD
Foreign Agricultural ServiceOffice of Global AnalysisIPA Division
2017/18 Production up on higher estimated yield
Area 35.0 mhaYield 3.29 mt/haProduction 115.0 mmt
April 10, 2018
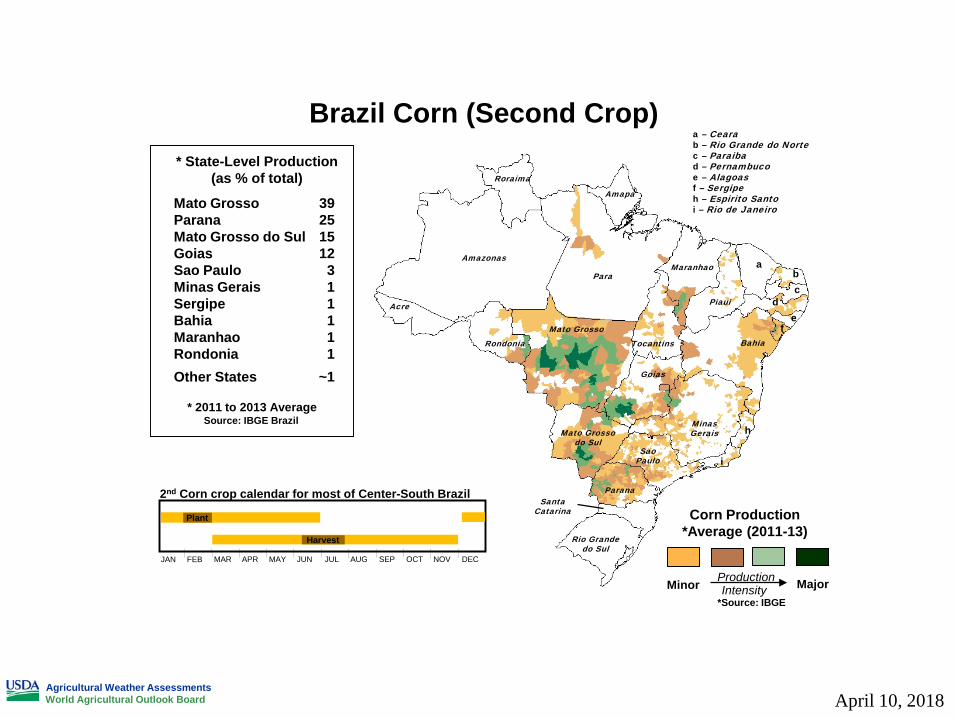
Brazil Corn (Second Crop)
Major
Corn Production*Average (2011-13)
IntensityProductionMinor*Source: IBGE
Rio Grandedo Sul
SantaCatarina
Mato GrossoBahia
Mato Grossodo Sul
Parana
SaoPaulo
MinasGerais
Goias
Tocantins
Maranhao
Piaui
a – Cearab – Rio Grande do Nortec – Paraibad – Pernambucoe – Alagoasf – Sergipeh – Espirito Santoi – Rio de Janeiro
abc
de
f
h
i
Para
Amazonas
Rondonia
Roraima
Amapa
Acre
JAN FEB MAR APR MAY JUN JUL AUG SEP OCT NOV DEC
2nd Corn crop calendar for most of Center-South Brazil
Plant
Harvest
Source: IBGE Brazil
* State-Level Production(as % of total)
Mato GrossoParanaMato Grosso do SulGoiasSao PauloMinas GeraisSergipeBahiaMaranhaoRondoniaOther States
39251512
311111
~1
* 2011 to 2013 Average
Agricultural Weather AssessmentsWorld Agricultural Outlook Board April 10, 2018
0.00
1.00
2.00
3.00
4.00
5.00
6.00
0
10,000
20,000
30,000
40,000
50,000
60,000
70,000
80,000
90,000
100,000
2006
/200
7
2007
/200
8
2008
/200
9
2009
/201
0
2010
/201
1
2011
/201
2
2012
/201
3
2013
/201
4
2014
/201
5
2015
/201
6
2016
/201
7
2017
/201
8 F
Yiel
d (m
t/ha
)
Thou
sand
Hec
tare
s or T
ons
Brazil Corn
Area (th ha) Production (th ton) Yield (mt/ha)
Foreign Agricultural ServiceOffice of Global AnalysisIPA Division
2017/18 Production down on lower areaArea 17.1 mha, Yield 5.38 mt/ha Production 92.0 mmt
Mato GrossoBahiaGoiasMato Grosso do SulSao PauloMinas GeraisMaranhaoParanaPiauiOther States
5028
8433111
~1
* 2005 to 2009 Average
Major
Cotton Production*Average (2005-09)
IntensityProductionMinor
*Source: IBGE
Rio Grandedo Sul
SantaCatarina
Mato GrossoBahia
Mato Grossodo Sul
Parana
SaoPaulo
MinasGerais
Goias
Tocantins
Maranhao
Piaui
a – Cearab – Rio Grande do Nortec – Paraibad – Pernambucoe – Alagoasf – Sergipeh – Espirito Santoi – Rio de Janeiro
abc
de
f
h
i
Para
Amazonas
Rondonia
Roraima
Amapa
Acre
JAN FEB MAR APR MAY JUN JUL AUG SEP OCT NOV DEC
Cotton crop calendar for most of Center-South BrazilPlanting
Harvesting
JAN FEB MAR APR MAY JUN JUL AUG SEP OCT NOV DEC
Cotton crop calendar for most of Northeastern Brazil
Period of Highest Intensity
Period of Highest IntensityPlantingHarvesting
Agricultural Weather AssessmentsWorld Agricultural Outlook Board April 10, 2018
Foreign Agricultural ServiceOffice of Global AnalysisIPA Division
Site visit to new AMPA/SENAR facility in Sorriso:• 200+ hectares• field trials for cotton and soybeans• research pest and disease resistance• training on equipment, applications,
pivot irrigation• main focus is to increase efficiencies.
April 10, 2018
1000
1100
1200
1300
1400
1500
1600
1700
0
500
1,000
1,500
2,000
2,500
2007
/200
8
2008
/200
9
2009
/201
0
2010
/201
1
2011
/201
2
2012
/201
3
2013
/201
4
2014
/201
5
2015
/201
6
2016
/201
7
2017
/201
8F
kilo
gram
/Hec
tare
Thou
sand
Hec
tare
s or M
etric
Tons
BRAZIL Cotton
Area Production Yield Source: USDA FAS PSD
Foreign Agricultural ServiceOffice of Global AnalysisIPA Division
2017/18 Production up on higher area and yieldArea 1.18 mha, Yield 1.61 mt/ha Production 8.7 MBales, 1.89 mmt
April 10, 2018
Brazil Rice
Source: IBGE Brazil
* State-Level Production(as % of total)
Rio Grande do SulSanta CatarinaMato GrossoMaranhaoParaTocantinsGoiasMato Grosso do SulPiauiMinas GeraisParanaRondoniaRoraimaOther States
57996332222111
~3* 2005 to 2009 Average
Major
Rice Production*Average (2005-09)
IntensityProductionMinor
*Source: IBGE
Rio Grandedo Sul
SantaCatarina
Mato GrossoBahia
Mato Grossodo Sul
Parana
SaoPaulo
MinasGerais
Goias
Tocantins
Maranhao
Piaui
a – Cearab – Rio Grande do Nortec – Paraibad – Pernambucoe – Alagoasf – Sergipeh – Espirito Santoi – Rio de Janeiro
abc
de
f
h
i
Para
Amazonas
Rondonia
Roraima
Amapa
Acre
JAN FEB MAR APR MAY JUN JUL AUG SEP OCT NOV DEC
Rice crop calendar for most of Center-South BrazilPLANT
HARVEST
JAN FEB MAR APR MAY JUN JUL AUG SEP OCT NOV DEC
Rice crop calendar for most of Northeastern BrazilPLANT
HARVEST
Agricultural Weather AssessmentsWorld Agricultural Outlook Board April 10, 2018
Foreign Agricultural ServiceOffice of Global AnalysisIPA Division
Rice CropSouthern Rio Grande do Sul
March 2018 • Rice crop generally in good
condition this season, despite drought, and benefited from plenty of sunshine. Water supply for irrigation was sufficient throughout the season.
• Yield is estimated down from last year. In Rio Grande do Sul, yield is estimated higher than earlier estimate.
• Harvest is underway.
April 10, 2018
3.000
3.500
4.000
4.500
5.000
5.500
6.000
6.500
0
2,000
4,000
6,000
8,000
10,000
12,000
14,000
16,000
2008
/200
9
2009
/201
0
2010
/201
1
2011
/201
2
2012
/201
3
2013
/201
4
2014
/201
5
2015
/201
6
2016
/201
7
2017
/201
8
MT/
HA
Thou
sand
Hec
tare
s or M
etric
Tons
BRAZIL Rice
Area Rough Production Yield Source: USDA/FAS/PSDA
Foreign Agricultural ServiceOffice of Global AnalysisIPA Division
2017/18 Production up on higher yieldArea 1.96 mha, Yield 6.06 mt/ha Production 11.88 mmt, 8.08 mmt(milled)
April 10, 2018
Higher
Yields*Average (2005/06-09/10)
IntensityProductionLower
*Source: SAGPyA
* Corn Yields
Stations in “Main Crop Area”
BuenosAiresLa Pampa
EntreRios
SantaFe
Cordoba
Chaco
Santiagodel
Estero
SanLuis
Salta
Corrientes
Form.
Tu.
BuenosAiresLa Pampa
EntreRios
SantaFe
Cordoba
Chaco
Santiagodel
Estero
SanLuis
Salta
Corrientes
Form.
Tu.
* Soybean Yields
April 10, 2018
Jan Lockup
2017/18
Average
ConsensusDeclining Condition,
But Time For Improvement
Several analogs showing possibility of improvement
Agricultural Weather AssessmentsWorld Agricultural Outlook Board April 10, 2018
Jan Lockup
2017/18
Mar Lockup
Further Deterioration
Feb Lockup
Average
Agricultural Weather AssessmentsWorld Agricultural Outlook Board April 10, 2018
Jan Lockup
2017/18
Mar Lockup
Mostly dry through March;Then soaking rain in April.
Feb Lockup Apr Lockup
Average
Agricultural Weather AssessmentsWorld Agricultural Outlook Board April 10, 2018
Agricultural Weather AssessmentsWorld Agricultural Outlook Board April 10, 2018
# Days >= 35°
Agricultural Weather AssessmentsWorld Agricultural Outlook Board
April 10, 2018
Number of Days
April 10, 2018
World Corn Production
April 10, 2018
Country or Region
2016/17 estimate
2017/18 forecast
Change from
March 8Change from
2016/17
World 1,075.5 1,036.1 -5.66 -39.4United States 384.8 371.0 -- -13.8