%,Document of The World Bank FOR OFFICIAL USE ONLY Repot No. 8610-IN STAFF APPRAISAL REPORT MNDIA PRIVATE POWER UTILITIES (TEC) PROJECT FOR |THE TATA ELECTRIC COMPANIES JUNE 6, 1990 The World Bank Asia Country Department rV (India) Transport and Energy Operations Di'viqion International Finance Corporation Department of Investments, Asia II Division I M&i documenlt hs a resuRIctddiIbm and may be sed by recpient ady In hde d o twpfiI dtes iJts contents may not othoise be wIlsdosedd B=k e \ '. \.~~~~~~~~ Public Disclosure Authorized Public Disclosure Authorized Public Disclosure Authorized Public Disclosure Authorized
Transcript
%,Document of
The World Bank
FOR OFFICIAL USE ONLY
Repot No. 8610-IN
STAFF APPRAISAL REPORT
MNDIA
PRIVATE POWER UTILITIES (TEC) PROJECT
FOR
|THE TATA ELECTRIC COMPANIES
JUNE 6, 1990
The World BankAsia Country Department rV (India)Transport and Energy Operations Di'viqion
International Finance CorporationDepartment of Investments, Asia IIDivision I
M &i documenlt hs a resuRIctd diIbm and may be sed by recpient ady In hde d otwpfiI dtes iJts contents may not othoise be wIlsdosedd B=k
1 Metr (i) a 89.8? inchoa (in)1 Kilometer (km) 3 1,000 matoro (a) a 0.0214 mlsca (ml)1 Cubla Motor (m1) a 1-81 cubic yord (eu ydA a 8.86 cubic feet (eu ft)1 Thousand Cubic Motor (1CM) a 1,000 cubie c eoro1 Berrol (Bbl) a 0.159 cubic mater1 Normal Cubic Rotor a 87.82 Standord Cubic Foot (SCF)
of intrsl Gae am 8 )1 Mebric Ton of 01 I (89 API) = 7.60 barrolo1 MIlligram a 0.001 gram (a) a 0.05 ounce1 Ton (t) a 1,000 Itlogramo (kg) a 2,200 pounds (Ibs)1 Kiloeolorlo (kcal) a 8.07 British Thermal Unito (DM1)1 Ton of Oil Equivalont (too) 10 millon kilocalorios1 Kilovolt (kV) 1,000 volts (V)1 Kilovolt amporo (kVA) a 1,000 voit-ampores (VA)1 Meyaatt (MW) a 1,000 kilowatto (kV) = 1 million attesI Kilowatt-hour (kWh) 1,000 watt-hours1 Mbgawatt-hour (UWh) 14000 ki owatt-hours1 Glgmaatt-hour (=W) a 1,000,000 kilowatt-hours1 Gigaealorio (Gcal) * 1,000,000 colories
ABBREVIATIONS AND ACRONYNS
AA4R - Avorago Annual Growth Rato KM - KilomiteoroACSR - Alumlnum Conductor Stool Roinforcod KV - KilovoltsAct - Tho Eloctricity (Supply) Act, 1948 as amended LF - Load FactorAEC - Ahmadabad Eloctriclty Company LSHS - Low Sulphur Heavy StockAndhra - Tho Andhra Valley Pomer Supply Company Ltd. MPC8 - Maharashtra Polution Control BoardASTU - American Society for Testing and Matorials UPSEB - Madbyn Pradoeh Stato Electricity BoardBEST - Bombay Electric Supply and Transport MSEB - Mahorashtra Stato Eloctricity Board
Undertakink MU - UMoeattiOOT - Build, Oen, Operato and Transfer NELCO - National Radio and Electronics CompanyBiES - Bombay Suburban Electric Supply Company NHPC - National Hydroelectric Power CorporationCC - Combined-Cycle NO - Nitrogn OxidesCCI - Controller of Capttal Iesues NPTC - National Povwr Trsnsamlsion CorporationCEA - Central Electricity Authority NTPC - Natlonal Thermal Power CorporationCESC - The Calcutta Electric Supply Corporation 0 a U - Operotion and MaintenanceCOP - Doepartment of Power am4c - Oil and Natural ans CorporationDSC - Debt Service Cover p.o, per annumERR - Economic Rate of Return PCD - Partly Convertiblo DebenturesFAC - Fuel Adjustment Chargo PCR - Projet Completion ReportFOD - Fluo Gas Dosulphurixation PFC - Poer Finance CorporationGIs - Gas-Insulatod Swltchgar Powe - Tho Tate Power Comany Ltd.001 - Government of India PS - Pumpd StorageGm - Govornment of Maharsshtre SEB - Stato Electriclty BoardCOUID - Irrlgation Department of the Cowernment SEC - Surot Electricity Company
of Maharashtra SO> - Sulphur DloxideGSEt - GujarataState Eloectricity Board 0 - Steam Turbino GeneratorCT - Cas Turbine Tap - Transmission and DistributionHPP - Hydro Powor Plant TEC The Tata Electric CompaniesHRSN - Mast Recovory Steam Gnerator TEDS - Tate Electronic Data Systema
\HV - High Voltago PP - Thermal Power PlantHydro - The Tata Hydro-Eloctric Power Supply Company IrI - Westinghouso-tata-Indus Ltd.Ltd. MRsB - Westorn Region Eloctrility BoardIPR - Industrial Policy Roolution me - Western Reglonol GridIRR - Internal Rate of Return
6uarantor's and Borrower's Financial Year: Aprl 1 - March 31
(In this report FY.. would mean the Guarantor's and the Borrower's fiscal yearbeginning April 1 of the previous year and ending March 31 of the indicated year; e.g.FY90 would mean the \fiscal year from April 1, 1989 to March 31, 1990) \
lFO OFFICAL USE O1JLY
INDIA
PRIVATE POWER UTILITIES (TEC) PROJECT
Loan and Project Summary
Borrower s Tata Electric Companies (The Tata Hycdro-Electric PowerSupply Company Limited, The Andhra Valley Power SupplyCompany Limited, and The Tata Power Company Limited,referred to collectively as the Tata Electric Companies --TEC). The three companies have generated and supplied powerin the Bombay area since the 1910s. They pool theirresources, share their assets, costs and revenues in thesame proportion 20:30:50, and are operated as. one companyunder the same 'anagement. A majority of their shares(51.71, 50.81 and,52.72) is held by the public. The Tatainterests hold only about 32 of the shares.
Guarantor s IBRD Loant India, acting by its President. The Governmentof India (GOI) would charge a guarantee fee of 2.75 S p.a.on the principal amount of the IBRD Loan withdrawn andoutstanding.
|IBRD Loan s US$ 98 million equivalent.
Terms s RepSyment over 20 years, including 5 years grace, at theIBRD's standard variable interest rate.
IFC Investment\ , First loan of US$ 30 million and se loan of Yen4,600 million.
Terms s Rep\syment on a 15-year balloon schedule, including 4 yearsgrace. Interest rates fixed at 10 718 X p.a. for the firstloan and 8 114 2 p.a. for the second loan. Front-end fee 1Z.Commitment fee 12 p.a. on the undisbursed balance.
ForeiRn ExSchane andInterest Risks s The interest rate risk op the IBRD loan, a*d the foreign
exchange risk on IBRD and IFC loans will be borne by theBorrower.
Mortgage andSecurity s IBRD and IFC loans aill be secured against first charge on
all of -TM's assets, subject to certain charges on currentassets in favor of working capital lenders. pari passu withother senior lenders.
This docuX en_ has a\restricted distribution and may be used by recipients only in the performanceof their official duties. Its contents may not otherwise be disclosed without World Bank authorization.
' ~~~~~~~~~is
Project Oblectives s The Project's objectives are to increase TEC's peakgenerating capacity, reduce their dependence on theMaharashtra State Electricity Board, reduce the average costof generation and improve system reliability and quality ofsupply to consumers In the Bombay area.
Project Description t The Project copprises four componentes a) a pumped storageunit at the existing Bhira hydroelectric station, togenerate 150 Mg of additional peak power by consumingoff-peak thermal power; b) a 220 kV transmission line tocarry this power to the license area; c) a gas basedcombined-cycle unit of 180 MH at the Trombay thermal powerplant; d) a second flue gas desulphurization unit to controlthe sulphur dioxide emissions from the coal and oil burningUnit No. 5 at Trombay; and (e) review of design andtechnical specifications and supervision of construction ofthe Bhira pumped storage scheme and acquisition of know-howfor the extension of the FGD facility at Trombay.
Estimated Costs:
Project Components Local Foreign Total-- _-------------------------- ---- SS million--------I. 150 MV Pumped Storage Scheme at Bbira 30.8 22.2 53.0II. Bhira-Dharavi 220 kV Transmission System 16.2 17.2 33.4III. 180 MV Gas Based Combined Cycle Scheme
at Trombay 43.9 47.1 91.0IV. Flue Gas Desulphurization Stream
Economic s 251 (1990-2000 time-slice of the WesternRegion Development Program).
Benefits s (a) Technical: The project will incregse TEC's peakgenerating capacity and capacity utilization ofthe existing thersm generating stations, andreduce the tran mi*uon losses and the averagecost of generation and improve systemreliability. It will also limit sulphur dioxide'emissions from coal and oil burning at TrombayUnit 5.
(b) institutioumlS Tariff adjustments and loadmanagement initiatives will bring the level andstructure of T@C's tariffs more closely in line.Witi supply costs. The support by the Bank Groupfor increased participation of She private sectorin the development of the power\sector in India,would free equivalent public resources whichwould be used for investmnts in other sectorsthat cannot attract private funds.
iv
Risks ( (a) Technicalt The physical project components,which are based on conventional technology, donot present unusual technical risks. The MulshiDam, upstream of the Bbira Hydro Power Projectwill continue to be monitored and inspectedperiodically by the Irrigation Department of theGovernment of Maharashtra (GOM).
(b) Financial: Under the Electricity (Supply) Actregulating power utilities in India, TEC settheir tariffs to recover their full costs,including depreciation at 3.62 p.a., interest anda predetermined return on the capital base.Additional special reserves are allowed by theGOM to fully cover the debt service and raiseinternal funds for future investments.Continuation of these appropriations is essentialfor TEC to attain comfortable debt servicing.
(c) Relationship with Maharashtra State ElectricityBoard (MSEB): TEC's system and operations areclosely interlinked with the State grid operatedby the MSEB. TEC purchase power from MSEB duringpeak hours, and share the backdown during offpeak hours. Maintaining the present workingbalance is critical for TEC's long-termviability.
N N~~~~~~~~~~~~~~~~~~~~~~~~~~~~~~~~~~~~~~~~~~~~~~~~~~~~~~~~~~~~~~~~~~~~~~~~~~~~~~~~~~~~~~~~~~~~~~~~~~~~~~~~~~~~~~~~~~~~~~~~~~~~~~~~~~~~~~~~~~~~~~~~~~~~~~~~~~~~~~~~~~~~~~~~~~~~~~~~~~~~~~~~~~~~~~~~~~~~
This report is based *n the findings of a joint Bank and IFC appraisal mission toIndia in January 1990. Mission members from IFC were Messrs. D. Damianos (Sr.Investment Officer), O.' Roche (Investment Officer), D. Fenton (Sr. Engineer) and M.Riddle (Sr. Environmental Adviser) and from the Bank, Messrs. A. Ceyhan (Sr. PowerEngineer), M. Tomlinson (Energy Economist), R. Bentjerodt (Sr. Operations Officer),C.K. Teng (Financial Analyst), B. Baratz (Sr.\Environmental Engineer), R. Lopez-Rivera (Power Engineer-Consultant), R.K. MaLhotra (Irrigation Engineer) and Ms. N.Pa? had (Operations Officer).
1.0 All-India: Electricity Supply and Demand1.1 Comparison of 141B's and INC's Tariffs1.2 Previous Loans and Credits to India's Power Sector
2.0 Tata Electric Companies" Organization Structure
3.0 Western Region interconnected Power Systems3.1 Project Description3.2 Project Cost Summary3.3 Tata Electric Companies' Project Management Structure3.4 Project Implementation Schedule3.5 Procurement Arrangements3.6 Procurement Schedule3.7 Schedule of Disbursements for IIRD and IFC Loans3.8 Statement of Separate and Joint Secured Borrowings3.9 Environmental Issues
5.0 Economic AnalysisTable Is Western Regions Actual and Projected Power and Energy DemandsTable 2s Western Regions Electricity Consumption by Consumer CategoryTable 3: Least-Cost Analysis: Comparative Analysis of System Cost with Bhira
and AlternativesTable 4s Least-Cost Analysis: Comparison of Generation Cost From Trombay With
Alternative Base Load OptionsTable 5: Program Analysis: Program costs and BenefitsTable 6S estimation of Consumer SurplusTable 7s Program ReturnsTable 8s Sumnary of Analysis Assumptions
6.0 Documents in Project File
IBRD No. 22293
INDIA
PRIVATE POWER UTILITIES (TEC) PROJECT
I. SECTORAL CONTEXT
Overview
1.01 The principal challenge facing the Government of India (GOI) asIndia's power sector enters the 19908 is to improve the balance in sectordevelopment between expansion and efficiency improvement. This will require GOIto ensure that the sector's institutional development keeps pace with thephysical expansion of power supplies. Electricity demand is projected to grow atapproximately 92 p. a. through 2000 and to continue to be supply constrained,though less so than at present. To meet a higher proportion of demand andimprove supply quality, GOI plans to install an additional 80,000 MW of capacityby 2000. At a cost of about US$150 billion, (equivalent to between 251 and 302of expected allocations under the Eighth and Ninth Plans) this would exert strongpressures on GOI's finances and pose considerable managerial and technicalchallenges for GOI and State utilities. To meet these enormous investmentrequirements, GOI recognizes that it must realize more of the private sector'spotential to mobilize additional resources. Similarly, GOI is keen to exploitmore of the private sector's ability to implement major projects efficiently.
1.02 At present, India's power systems have an installed capacity of over59,000 MW, comparable to the power system of France or of the United Kingdom orto all the power systems in Sub-Saharan Africa combinedli. In FY89, India'ssystems generated 206,000 GVh - about 702 from coal stations, 252 from hydrostations and 52 from gas, oil and nuclear stations (Annex 1.0). Public supplyhas expanded quickly: since FY82, installed capacity has increased from 32,000 MWand generation from 114,000 GWh. Even so, India faces a shortage of generatingcapacity of 27X and approximately 102 of total demand is left unserved. Thequality of electricity supplies also remains mostly unsatisfactory- interruptionsto supply and voltage reductions are common, and technical and commercial losseshave increased to 222 of net generation.
1.03 In parallel with expanding supply, the sector has made encouragingefficiency gains. Key amongst these is that plant load factor averaged 552 inFY90, compared with only 442 in FY81. Each 1 kW of capacity now provides 1,031kWh (272) more electricity annually than in FY81. In addition, the rate of coalconsumption by power stations has been cut 1O0 since FY80. It now requires 720tons of coal to generate 1 GWh, compared with 802 tons in FY80. This savesapproximately 12 million tons of coal annually - about 82 of the sector's totalconsumption. These improvements reflect a strengthening of plant Maintenance andoperations and are commendable in view of the deteriorating quality of coal thesector is receiving. A significant institutional gain has been a 34Z cut-in -staffing ratios: from 29 per thousand consumers in FY81 to 19 at present.
l1 Excluding the Republic of South Africa.
2
kfficiency has also improved, though more modestly, through increases in tariffsrelative to supply costs. Between FY82 and FY89, the average tariff rate doubledto Rs. 0.671kWh through real increases averaging 3.5S p.a.. Rates to industrialand commercial consumers (over 601 of total coneumption) are now about 80X ofmarginal cost. The lowest rates are those to agriculture - on average Rs.0.16/kWh - which are heavily subsidized. These low rates inflate demand and area principal cause of the poor financial performance of the sector.
1.04 Notwithstanding the efficiency gains secured in recent years.considerable scope remains for further improvements. Key remaining constraintsare weaknesses in the structure of the sector. inadequate financial autonomy ofGOI and state-owned utilities and weak financial discipline. Physically, theimpact of these constraints is that India's power systems provide less power andof a poorer quality than they should be able to, and at higher cost. Economiccosts of shortages and poor quality supplies are exacerbated by inefficientend-use of power - the result mostly of a lack of conuercial incentives in manymarkets and subsidized power prices.
1.05 Pinancially, the effects of remaining constraints are to underminesector financial performance and hold down resource mobilization. AlthoughGOI-owned and private utilities financially are much stronger than the StateElectricity Boards (SEBs), it is the latter which dominate the finances of thesector. In FY89, SEEs incurred a combined loss after interest and depreciationof Rs. 17.7 billion (about US$ 1 billion). This corresponded to a return on netassets at historic cost of -9.8Z. In FY90, SEBs' losses are expected to reachRs. 21.6 billion (about US$ 1.28 billion) and the Boards, combined internalresource is expected to fall to Rs. -7.7 billion (about US$ -460 million). TheMaharashtra State Electricity Board (MSEB) - TEC's licensor - is the most,efficient and financially the strongest of the SEBs. Recently, MSEB increasedits tariffs 20X. As a result, MSEB expects to be the first SEB able to meetGOI's minimum requirement for a 32 return on net assets at historic cost afterdepreciation,and interest.
1.06 GOI is aware of these constraints and how they threaten futuresector development. Under the Seventh Plan, GOI strengthened its resolve toaddress these constrlaints in a substantive way. Of particular note are GOt'sinitiatives to strengthen financial discipline in the sector and improve resourcemobilization, both through direct negotiation with States and through creatingthe Power Finance Corporation (PFC). The latter will provide project financingto SEBs willing to make needed institutional reforms. GOI has also accelerateddevelopment of the efficient central utilities, (particularly the NationalThermal Power Corporation -- NTPC) to improve cost recovery and ensure thatpriority projects are implemented on schedule. to tap private sector potentialfor additional resource mobilization, GOI also aims to ease financial andregulatory disincentives to private investment in the sector.' To this end, GO0has under review a White Paper proposing, inter alia, to increase to 15? thereturn private utilities are permitted to earn on their capital base (para.1.17). Finally, GOI is also reviewing its fuel use policy for the sector. Aswell as considering fuel imports, GOI has decided to sanction wiore domesticnatural gas for power generations 8,000 KW of gas-fired plant Is to be addedunder the Eighth Plan.
i~~~~~~~~~~~~~~~
Organization of the Power Sector
1.07 Responsibility for electricity supply is shared between SOI and theStates. COX controls the Central Electricity Authority (CEA), NTPC and itshydropower counterpart, the National Hydro Power Corporation (NHPC). All reportto the Department of dower (DOP) within the Z4inistry of Energy. DOP alsocontrols PFC and will take responsibility for the newly-created National PowerTransmission Corporation (NPTC). CEA's task is to develop national power policyand coordinate sector development. Its effectiveness, however, is limitedseverely by shortages of skilled staff and resources. NTPC and NHPC are bulksupply utilities which sell power to the SEBs. NTPC provides about 13X ofIndia's total power supplies, and has a track record of efficiency and financialstrength. NHPC, on the other hand, has not yet enjoyed the same success and isdeveloping relatively slowly. PFC will mobilize additional resources for theSEBs and pursue institutional strengthening of its borrowers throughconditionality linked to its financ,g. NPTC will coordinate development andoperation of transmission systems, initially systems associated with NTPC's andNHPC's power stations and later systems owned by the SEBs.
1.08 The States control the SEBs, which generate about 752 of totalsupplies and provide most distribution to final consumers. Although supposedlyautonomous, SEBs in practice are under state control as regards theirinvestments, tariffs, borrbwings, and salary and personnel policiis. SEBs aregrouped into five regional systems. Activities coordinated regionally includegeneration schedules, overhaul and maintenance programs, power transfers andconcomitant tariffs. SEBs also license India's private power utilities. Onlyfive private utilities remain: TEC, Bombay Suburban Electric Supply (BSES),Ahmedabad Blectricity Company (ABC), Surat Electric Company (SEC) and theCalcutta lectric Supply Corporation (CESC). The Bombay Electric Supply andTransport Ltd. (BEST) is a municipal corporation. All but BSES and BEST generateat least some of the power they distribute. However, BSES is embarking upon a500 Mg thermal power station, for which a second joint IBRD/IpC operation isIeing considered.
Private Utilities
1.09 At inoependence. private utilities and licensed local authoritiestogether provided 'about 801 of public electricity supply. The Electricity(Supply) Act of 1948 created the SEBs and entrusted the Boards with primaryresponsibility for public power supply. The Act also made SEBs responsible forregulating private utilities. The Industrial Policy Resolution (IPR) of 1956subsequently defined aspects of generation and distribution which were to be theexclusive responsibility of the State. All but the few remaining licenseescosequently were taken over on the expiry of their licenses. go new licenseshave been granted since 1956. However, the IPR did not rule out expansion ofremaining licensees, or;the possibility of joint ventures with the private sectorwhen these could be showh to be in the national interest. Private utilitiesprovide less than 51 of public supplies, though private captive generation inindustry is extensive'- equivalent to about 151 of public supplies. The latterhas ,developed in responte to poor quality and unreliability of public supplies. "
.. ..~~~~~~~'I'~~~~~~~~~~~~~~~~.
^ ~~~~~~~~~4
Re&ulatory Framework
1.10 Private power utilities in India are regulated by the ElectricitytSupp.y) Act of 1948 as amended (the Act). The Act allows them to charge throughtheir'tariffs to consumers their full cost, including depreciation (at 3.6Z p.a.)and interest; plus special reserves as allowed by the State Government; plusprofit equal to a 12Z return on their remunerable capital base. The specialreserves, like depreciation, are charged on the tariffs, thus increasing therevenues, b4t unlike cash costs, are not paid out. Hence they help increase thecashflow while the clear profit (after the special reserves) remains within thereasonable return limits. The capital base comprises share-capital and freereserves, but excludes the special reserves. The rate of return is 'currently setat 12X p.a. (still the pre-1966 part of the capital base earns only 72 p.a.). Ifa utility makes higher profits, it can retain only 20X of the excess androll-overs against future losses are not permitt6d. The private utilities arearguing that the 122 p.a. rate of return is inadequate. Their cost of borrowingis now 142 p.a. for long term loans and 172 p.a. for working capital.
1.11 In TEC's case, the special reserves allowed by the GOM include a DebtRedemption Reserve, to cover the difference between depreoiation and principalrepayments; a Foreign Exchange Liabilities Reserve, to cover exchange losses onthie foreign durrency loans; a Project Cost Res4rve, to raise funds for futureinvestments; id a Deferred Tax Liability Reserve, to cover an eventual tax'liability of shareholders for unrealised capital gains (arising from differentdepreciation rates under the Income Tax Act and the Electricity Act) in the eventa utility is taken overt These reserves were allowed by the state at a time thatthey did not result in an increase of the tariffs (other than the fuel adjustmentcharge, which is not subject to any restriction). 'when the fifth Trombay unit2'came into operation in 1984 and natural gas from the nearby Bombay High Oilfieldswas made available at a promotional price (for taking interruptible supplies),the average cost of generation declined. Rather than rebate the savings toconsumiers throu*h tariff reductions, TEC were able to retain them through thesereserves, to raise funds towards subsequent investments. This allows them tofinance their future projects with more internal accruals and less debt, which inturn reduces the interest burden and therefore the future tariffs. Thus thesavings come full circle back to the consumer.
1.12 GOI has been considering in\the last 2-3 years a set of amendments inthe Act, including increased depreciation allowance and return on capital, toimprove the incentives for private sector investment in power generation (para.1.17). While there is widespread recognition that present allowances are too lowto attract new private investment, the proposed changes are unpopular with theStates and the SEBs -- which face stiff oppos.tion to higher rates for publicelectricity supplies. Because of the difficulty of building the \necessary,consensvs with the States, progress on improving private sector incentives willprobably materialize only at a\comparatively modest pace, with the le4dership
2/ Financed under IBRD Loan 1549-IN -- The Third Trombay Project, whichco^ered the' construction of a 500 MW triple-fired (coal, low sulphurhea:4 stock fuel oil and gas) Trombay bth unit.
'\ \
conzinuing to be taken by States such as Maharashtra and 0ujarat that alreadyhave a private sector presence.
Tariffs
1.13 Tariff adjustments by private utilities are permitted annually and donot, require state approval, only 60 days notice by the licensee. The tariffscomprise a demand charge, a fixed component designed to recover the utility'sfixed costs, and an energy charge for actual consumption, reflecting theutility's variable cost of generation. The latter comprises a basic energycharge and a fuel adjustment charge (FAC), reflecting the increases in the costof fuel between two successive tariff revisions. In deciding the actual amountand especiaily the timing of their increases, the util1ties also take intoaccount economic and political f4ctors, including the state of the economy intheir area and the attitude of consumers and of the authorities. Petitions byconsumers requesting stays of the increases are common as is their rejectP;n bythe courts. TEC normally follow the M4SEB in raising tariffs. TEC's tariffs arelower than MSEB's for the same category of high voltage consumers and also arelower than the rate TEC pay for power purchased from MSEB, i.e. purchases-raiseTEC's average supply cost and hence its ta riffs. TEC's cost of generation islower because: (a) their newer thermal units are very efficient; (b) they uselow-cost natural gas as fuel; (c) about a fifth of their generation is hydro; and(d) they do not have the costs associated with low voltage distribution. Theevolution of TEC's and MSEB's tariffs since 1975 is shown in Annex 1.1. Duringproject preparation, IBRD and lFC have reviewed with TEC the possibilities forimproving the structure of TEC's retail tariffs to encourage further consumerload management. TEC confirmed that they will plan to restructure the3r tariffsto include, inter alia, options for time-of-day energy pricing and toad'management. TEC further agreed that, after consultation with the GOM, they willcommence implementation of the restructured tariffs in their 1991 round of tariffadjustments.
GOI Strategy In the\Power Sector
1.14 The Five-Year Plan constitutes the only formal statement of India'senergy and power policies. While the Eighth P.an has yet'\to be finalized,preliminary indications suggest little change in objectives from those reflectedin the Seventh Plan. Principal energy objectives are likely to remain tot (a)develop supplies at rates which will facilitate growth in other sectors and 'meetparticular econom*c and social objectives assigned to the energy sector (e.g.extending irrigation pumping and meeting basic e4ergy needs of the rural poor);(b) substitute indigenous energy for imported fuels wherever economicallyfeasible; and (c) promote rational and more efficient energy use. Power sectorobjectives are broadly s'imilar, though within GOI there is a growing recognitionfor the economic role of imported coal (and possibly imported gas) could play tofuel supply to the p*wer sector. Over the short term, objectives are likely tofocus on easing the persistent supply shortages and improving financialdi'scipline in the sector.
1.15 Over the longer term, the organ4zational, institutional and financialobjectives are less clearly defined. Although GOI is heavily constrained in itsabibity to act unilaterally, key initi~tives it is likely to pursue will be to:
l A
6
(a) accelerate development of the relatively efficient GOI-owned utilities; and(b) promote,more extensive private sector participation in power supply.
1.16 GOI's recent initiative in forming PFC is expected to begin yieldingresults under the Eighth Plan. In addition, GOI's minimum 3? return requirementfor SEBs, and its appropriations from States' budgets, provide strong incentivesfor States to work more concertedly to improve SEBs' resource mobilization.
Private Utilities: Prospective Policy Adjustments
1.17 As mentioned in paragraph 1.05, SEBs' combined losses in FY90amounted to Rs. 17.7 billion, a return on net assets at historic cost of -9.8X.In FY90, their combinud resource mobilization is expected to fall to Rs. -7.7billion. These serious financial problems (para. 1.05) have left GOI deeplyconcerned about the difficulty it faces in financing sector investments throughthe Eighth Plan. It is primarily this concern that has prompted GOI to re-assessfinancial conditions under which the private sector can invest in public powersupply. Key reform included in the White Paper GOI is considering are:
Ci) an increase in returns private utilities are permitted to earn --tofive percentage points above the Reserve Bank of India (RBI) ratefrom two points at present (i.e. an increase to 15? from 12X);
(ii) an obligation for state governments to permit private utilities aspecial appropriation for repayment of loans;
Ciii) a standard license period of 30 years with extensions, where granted,of 20 years -- currently, licenses may not exceed 20 years andextensions my not exceed 10 years;
Uiv) release from the highly constraining Monopolies and Restrictive TradePractices Act, under which private utilities presently are requiredto obtain clearances for new business ventures and major projects;and,
(v) streamlining of licensing procedures for new private utilities.
1.18 India's newly formed Cabinet is expected to diseuss the proposals inthe near future. However, the progress through the Government of these reformshas been interrupted -- in our assessment only temporarily -- by the change ofadministration and by the preoccupation of the concerned authorities withrevision of the Eighth Plan. It is not yet clear whether the Cabinet will alsopropose increases in depreciation rates for private utilities. SEBs are keen tosecure similar concessions. Without commensurate increases in tariffs, this woulddeepen SEBs' losses, possibly substantially. It is probable, however, that theCabinet will require at least 60? of new investment by private utilities to comefrom sources other than the main financial institutions. This will help ensurethat private investment resulting frow the concessions does not draw heavily uponresources that otherwise would have been available to the SEBs.
1.19 In an interim initiative prior to policy changes being announced, GOIhas approached selected private investment houses to present proposals for Build,
A
7
Own, Operate and Transfer (BOOT) generation projects. Such projects fall withinthe provisions of the IPR (para. 1.09), under which SEBs may enter into jointventures with the private sector for projects in the national interest. Resultsso far have been disappointing -- no new joint ventures have yet been launched -since the groups approached are wary of the same financial restrictions troublingexisting private utilities.
1.20 While most in government recognize the need to extend private sectorparticipation in power supply, some continue to view private utilities asprofiteering at the expense of SEBs. These views are deeply held and willcontinue to slow the pace of reform. New incentives therefore are likely to beincremental in nature and are likely to be sponsored by states unevenly. Themore progressive state governments, such as in Mabarashtra, undoubtedly will takethe lead. Overall, it is difficult to predict how quickly private participationcould increase. If GO decides to allocate additional natural gas to privatesector combined-cycle projects, private participation could develop relativelyquickly -- some projects could be completed within the Eighth Plan. However, atpresent, the outcome is uncertain.
Bank Group Strategy in the Power Sector
1.21 GOI's sector strategy is sound in its broad objectives and direction.As regards public utilities, however, additional efforts are needed ininstitutional development, planning, finance, pricing and load management. Asregards the ptivate sector, GOI's objectives need to be defined more clearly andits strategy needs expression through a first round of reforms. The nature ofconstraints afflicting public utilities recommends the IBRD adopt a sector-widelending strategy. Consequently, the IBRD is extending its inpvolvement withcentral entities and in parallel is pursuing direct involvement with selectedSEBs which, together with their state government, are committed to reform. TheIBRD and IFC strategy towards private utilities is to accelerate development ofthe existing suppliers and to advance thinking on lowering entry barriers for newinvestors. In dealing with public and private utilities alike, the IBRD and IFCare also promoting more comprehensive and vigorous analyses of environmentalinputs in project design and improved implementation of environmental projectcomponents (para. 1.23).
1.22 The IBRD's support for central entities provides furtherinstitutional strengthening these entities require to manage their rapiddevelopment. It also helps promote efficiency in those SEBs with which the IBRDdoes not have a direct relationship. PFC's lending operations, for example, willbe linked closely to institutional strengthening of its borrowers. The IBRD'ssupport for particular SEBs aims to organize the Boards to operate more alongcommercial lines -- invariably a long process fraught with difficulty, butessential to improve overall sector efficiency. Recurring objectives in theseoperations are to: (a) tighten financial discipline and improve financialplanning; (b) reorganize management to facilitate decision making; (c) improvethe quality and timeliness of management information; and (d) strengthentechnical abilities, particularly as regards project management. The IBRD'sinvolvement throughout the sector also facilitates a dialogue with GOI on broaderissues facing the sector - for example, on utilities' need for improved financialautonomy, ways to improve SEBEs' financial performance and options to improve
; ~~~~~~~~~~~~8
incentives for private investment in power supply. These and other issues are tobe explored in detail in forthcoming IBRD econqmic sector Work, which aims toidentify and appraise feasible reform options3' .
1.23 In addition to addressing areas where GOI's strategy requiressupport, the IBRD also attempts to catalyze progress in remaining areas. Keyobjectives the IBRD has adopted in this regard are to: (a) assist withdevelopment of a strategy to address in a uniform and co-ordinated way theenvironmental and sociological aspects of power development; and (b) supportdevelopments requiring coordinated actions within and outside the power sector --improving coal quality and transport are priority areas.
1.24 Joint preparation of the p:oposed project by IBRD and IFC underscoresthe commitment of the World Bank Group to the development of private sector powersupply in India. The association has proved key in advancing the Group'sdialogue with GOI on the regulatory and other constraints presently deterringextended private sector participation in public power supply (para. 1.12). Underthe forthcoming Private Power Utilities Project II, IBRD and IFC are seeking thatGOI will take the first concrete steps to lowering the existing barriers toextended private participation in the sector.
Bank Group Participation
1.25 The Bank Group has made 29 IBRD loans (USS 5,719 million) and 18 IDAcredits (US$ 2,307 million) for power projects in India (Annex 1.2). Inaddition, a loan of US$ 485 equivalent for the Northern Region TransmissionProject is being considered by the Executive Directors of IBRD. Twenty-sevenprojects have been completed: 20 generation; 4 transmission; and 3 ruralelectrification. Projects currently under implementation include 9 generation (3of which are hydro); 2 transmission; and 6 which include a mix of generation,transmission and distribution. Four of the IBRD loans have been to TEC, in 1954,1957, 1979 and 1984. With the exception of a few notable trouble spots,implementation of Bank power projects has proceeded broadly according toexpectations. Loan and credit disbursements, however, continue to show largeoutstanding balances (USS 3,753 million, as of March 31, 1990). These are dueprimarily to the very long construction periods of generation projects compoundedby frequent delays in procurement and foreign exchange and import licenceclearances by the various ministries and the rising number of projects underimplementation. Balances have been increased further by frequent cost under-runson major equipment contracts - the result of a recent softening of internationalmarkets and rapid real devaluation of the Rupee.
1.26 IFC has made 2 loans for power projects in India to AEC and TEC inFY89 and is considering a loan to CESC in FY90. Although disbursements from theFY89 loans have not yet commenced, both projects are progressing satisfactorily.Including this proposed project, IFC cumulative commitments in the Indian powersector would be about USS 140 million equivalent; including about US$ 100 millionto TEC.
St An economic sector work study entitled "Long Term Issues Facing ThePower Sector, is expected to be completed by the end of 1990.
.,.
9
1.27 The Bank Group participation in these projects has strengthened thefinancial performance of these borrowers, not only by bringing in additionalfinancing but more critically by encouraging regulatory improvements, e.g. thespecial reserves. Also, by protecting the borrowers from adverse stateintervention it bolstered their private ownership as it enhanced theircontribution to the public.
1.28 The Project Completion Report (PCR) for the Bank's Third TrombayProject (Loan 1549-IN; para. 1.11) notes that costs at project completion were34X higher than at appraisal and completion was one year behind schedule.Despite this, the PCR rates the project a success: cost increases were largelybeyond TEC's control and the replacement of an unsatisfactory contractor washandled expeditiously. TEC's financial performance throughout projectimplementation exceeded appraisal estimates and the PCR estimated the projectrate of return to be 312, compared with 142 estimated at appraisal.Implementation of the Fourth Trombay Project (Loan 2452-IN) which covers theconstruction of the 500 MW Trombay 6th unit, proceeded satisfactorily after aslow start due to GOI's delay in establishing a fund to secure the IBRD loan.The 500 MW unit was synchronized with the interconnected system on March 23,1990. TEC's financial performance during project implementation again exceededappraisal estimates.
II. THE BORROWER
CoErorate Structure
2.01 TEC consist of three companiess
(a) The Tata Hydro-Electric Power Supply Company Limited (Hydro), formedin'1910;
(b) The Andhra Valley Power Supply Company Limited (Andhra), formed in1916; and,
Cc) The Tata Power Company Limited (Power), formed in 1919.
In the 1950s the three companies pooled their facilities and their staff to forma single integrated grid. Although they have not actually merged, they areoperated as one company under the same management. They share their assets andliabilities, revenues a*td costs in the same proportion (20? Hydro; 30? Andhra;50S Power) and are collectively referrid to as the Tata Electric Companies.
Licenses
2.02 The three hydro-electric power stations at Khopoli, Bhivpuri andBhira (para. 2.18) are still separately owned by the three companiep under theoriginal licenses issued in 1907, 1919 and 1921. The Trombay Thermal PowerStation, the receiving stations and the transmission and subtransmission networkare owned jointly in the ratio of 20:30:50 by Hydro, Audhra and Powerrespectively. The three companies operate Trombay under the jointly owned
-~~ ~ \
Trombas Thermal Rover Electric License issued In 1953 and amended in 1978, whenthe fifth Trombay unit was apprbved.
2.03 The HSUB has the option to acquire, with appropriate compensation.the assets of the undertakings covered by the licenses. This option isexercisable every 10 years, but not before August 15, 2004, the maturity date ofTIC's last loan from the IBRD. GOl agreed to cause the State of Maharashtra toextend, not later than June 30, 1991, the validity of TEC's licenses at least upto September 15, 2010, the maturity date,of the proposed IBRD loan (para.6.01.b.i).
2.04 The licenses are not exclusive, i.e. other utilities may also belicensed to distribute power in the same area. There are two such distributionutilities in TEC's area (para. 2.20), who are supplied by TIC and retail power to9 million consumers through their own distribution networks. In addition, TECsupply directly about 90 large industrial consumers. About 70 more of thesedirect consumers located in TEC's area were taken over by KSEB in 1980, becauseTEC did not have adequate capacity to supply them (para. 2.22). At that time TECwere importing about two thirds of their requirements from MSEB, an excessivedependence that has since decreased. TEC is still in a deficit position, but theprobability that their distribution rights may be truncated again is consideredvery low. Under the terms of the License, T@C Owill be allowed to retain suchdistribution rights and loads in the licensed area as may be warranted by theirsurplus generating capacity". 1sE1 has no financial incentive to take over moredirect custaomrs. GOI agreed to cause 00M not to take gay actions, includingdelimiting TEC's area of supply, that would adversely affect TEC's operationalperformance and financial position (para. 6.0l.b.ii).
Shareholding
2.05 TEC were founded by the two sons of Jamshetji Tata, who were grantedthe initial licenses. Today the Tata group's hoJ'ding company 'Tata So0is Inc."holds less than 2.5s of TIC's shares. The Tata family members own lesi than 102of Tata Sons. More than 753 of Tata Sons' shares are held by Tata Trust, acharitable institution governed by a board of trustees independent from the Tatafamily. The essence of the 'Tata Group' is effectively a network of professionalmapagers, bred thro gh a long tenure in the group companies.
2.06 The three companies are private sector entities, whose coumon sharesare held as given in Table 2.li
Table 2.1: Shareholders of the Tata Electric Companies(As of March 31, 1989)
Life Insurance Corporation 9.6 9.2 7.4Other Insurance Companies 12.9 17.7 10.2Unit Trust of India 14.8 13.5 12.1Financial Institutions 5.6 3.6 12.5Nationalized Banks 1.1 1.0 1.1
100.0 100.0 100.0
Number of Private ShareholdersIndividuals 30,568 27,713 55,302Other Private 173 187 268
2.07 TEC's last share issue, by all three companies simultaneously, was in1981 on a rights basis and was oversubscribed four times. Debentures are alsoissued individually but simultaneously. Each new loan agrc ,ment is signed by allthree companies.
2.08 As part of the financing for this project TEC are planning a largeissue of 5.3 million partly convertible debentures (PCD) in FY91 (para. 3.07).Subject to approval by the Controller of Capital Issues (CCI), TEC plan todistribute these as follows:
(a) 3.9 million (74.1* of the PCD issue) to existing shareholders on all rights basis;
(b) 0.2 million (3.7Z) to employees;
(c) 0.7 million (13.2X) to other Tata group companies; and,
(d) 0.5 million (9.4?) to a private financial institution.
After the compulsory conversion on the basis of one share per PCD% the number ofshares outstanding will increase to 9.2 million, and the private sectorshareholding of TEC will increase to over 60X.
Management, Organization and Training
2.09 The three companies are managed as one, sharing their assets andliabilities, revenues and costs in the proportions 20X Hydro; 301 4ndhra; 502Power. Each has a Board of ten directors of which four, i.e. the Chairman, ViceChairman, Managing Director and Joint Managing Director, are on all three boards.Each board Includes a representative of the Indian Financial Institutions. OneGOI and one GOM representatives serve on the Board of Andhra. The otherdirectors are representatives of leading industrial and banking institutions in
i_ __ --
12
India. The three companies hold joint board meetings and share the samemanagement and staff (Annex 2.0).
2.10 TEC are proessionally managed a"d have an excellent record ,ofefficient operation and technical innovation. They were the first to introducein India 220 kV high voltage transmission lines, and in 1984 they successfullycommissioned the first 500 MV generating unit. They have successfullyimplemented the Third and Fourth Trombay Power Projects (Loans 1549-IN and2452-IN), partly financed by the Bank. As of January 1, 1990, TEC's humanresources strength numbered about 3450, comprising about 122 senior managers, 953engineers and technicians, 1987 skilled and semi-skilled workers, and the balanceadministrative personnel. The staffing is commensurate with the size and scopeof activities of TEC and is adequate to carry out the proposed project.
2.11 TEC provide extensive in-house and external training, primarily forpower plant operation personnel.' Their training cenIter at Vashi, about 10 km fromTrombay provide specialized training on power system managementa Their other keyin-house training includes using computerized simulators to replicate theresponses and operating sequences of the 500 MW Unit 5 at Trombay. TEC alsooffer training for SEBs' staff.
Maintenance
2.12 The maintenance of TIEC's facilities is carried out by TEC's ownstaff. Well established preventive maintenance norms are applied for theelectrical and mechanical equipment. Overhaul£ng of units is planned inconsultation with MSEB to minimize disruption to the system. \Effectivemaintenance results in high availability: io FY89, the plant load factor forTrombay Thermal Power Plant was 67.52 overall, and in particular for the 500 MW5th Unit 802; in FY90, the plant load factor increased to 77.22 on average andabout 94Z for Unit 5 while the all-India average was about 60X.
Accounting and Audit
2.13 The accounting functions are well managed by a few competent andexperienced officers, with a relatively sophisticated computerized system. Whilethe financial accounting is centralized at the headquarters, TEC are implementingan on-line financial accounting system for the Trombay Thermal Power Station _
Which will later-tbeextended to other divisions. The management informationsystem of TEC iv one of the best in the electric utility sector in India.Financial planning and funding operations-are still done by the Joint ManagingDi ector in consu(tation with external advisers. As TEC's operations expand anddiNersify, top management plans to strengthen these functions by inducting asenior financial executive.
2.14 The internal audit division is appropriately staffed and reports aresattsfactory. The\external auditors' reports are unqualified and indicatecompliance with the regulatory Acts. TEC agreed to furnish to IBRD and IFC,latest by July 31 of each year, their audited annual accounts including a copy oftheir combined accounts (para. 6.02.a).
13
Billing and Collections
2.15 TEC send out less than one hundred bills each months one each toBSES, BEST, the Railways and the 90 direct industrial consumers. Industrialconsumers and the railways get a 1Z discount for prompt payment, or a 2a penaltybeyond the payment date. Defaulting consumers face disconnection. In general,most of TEC's consumers pay within the ten'day discount period. TEC's billingand collection system is well established and efficient as evident by its lowreceivables of less than 40 days of sales in FY89. TEC also provide consultancyservices ¢i billing and collections to other electric utilities.
Insurance
2.16 TEC maintain fire and machinery breakdown insurance policy on theiroperating plant and machinery on replacement value basis while projects underconstruction are covered under a marine, storage and erection policy. TEC alsoensure that turnkey contractors provide adequate insurance for the project.
Income Tax
2.17 TEC's profit from the electricity business is n6t subject to theminimum tax of 302 on book profits (before various deductions). Due to theirsubstantial new investment program, TEC project that they will not be subject toincome tax for most of this decade. The non-electricity businesses (para. 2.27)are still at an early stage, with expenses outstripping revenue, so that no taxis envisaged on them either.
Existing Operations and Facilities
2.18 The sixth unit at Trombay (500 MW) was completed ahead of sche4uleand- came on stream, supplying power to the interconnected grid,--on March 23,1990. At present, TEC's own generating capacity is-rated-a} 1,614 MW, comprising276 MW from three hydro statiqns (Khopol., Bhivpuri, Bhira4 ) and 1,338 MW fromone thermal station (Trombay5I) with 6 unit*. Net of internal plant usage andtransmission losses, the units in Qperation in FY90, met about 900 MW of peak
Khopoli s 72 MWBhira s 132 MWBhivpurit 72 MWTotal s276 MW
5L1\ X \ Units-1 2 and 3s 3 x 62.5 MWUnit 4 s 150 MWUnitS s 500MWUnit 6 (a) s 500 MWTotal 1,337.5 MW
-v (a) Synchronized with the interconnected system in March 23, 1990.
14
load61. The oldest three thermal units of 62.5 MW each were scheduled to beretired when unit 6 was commissioned, but in view of the peak power shortage,they are being extended until the combined-cycle unit of the proposed projectcomes on stream In FY94. The fourth unit (150 MW) will be relegated to a standbystatus from FY95.
2.19 TEC also own the transmission lines and switching substations,through which they deliver power to their clients at High (HV) and Medium (MV)Voltages. The transmission lines are at 6.6kV-220 kV and add up to a totallength of 1,141 km overhead and 434 km underground.
Clients
2.20 TEC's clients aret (a) two distribution utilities (BSES and BEST;para. 1.08), who in turn through their own distribution network retail power tonine million consumers; and (b) about 90 large industrial consumers supplieddirectly by TEC. The license areas of TEC, BSES and BEST are shown in Map IBRD22293.
2.21 The HV transmission and MV subtransmission is the p-imaryresponsibility of TEC. MS1B, BSES and BEST each have their owl. HV and MV linesinterconnected with TEC's. In its license area which covers South Bombay, BESTis licenced to distribute power to consumers whose requirements do not exceed 250KVA. For BSES, whose licence area covers north of the Bombay Metropolitan Area,this limit is 1,000 IVA. Larger consumers whose requirements exceed these limitsmay be supplied by either TEC or BESTIBSES and they choose the source that cansupply them at the least cost. BEST and BSES purchase power in bulk delivered tothem at TEC's receiving stations for onward distribution to their clients. BothBEST and BSES supply residential, commercial and industrial consumers. The peakload of TEC's clients was about 1,400 MW in FY90 and is growing at 8Z p.a. TECmet around 900 MV from their own generation and imported the balance from MSEB.With the addition of Trombay Unit 6, TEC's own peak availability increased toabout 1,300 MV. Thus, reliance on MSEB for peak power dropped to a very lowlevel but will rise again as the peak load keeps growing at over 100 MW eachyear.
IheelinR
2.22 In addition, TIC "wheel' about 300 MV for MSEB, i.e. transmit itthrough their lines to MS3B's clients. In late 19708 TEC were importing overhalf of their requirements from MSEB, i.e. their direct customer base was toolarge for their own generating capacity. As one of its conditions for approvingthe Trombay fifth unit, msn8 took over about one third of TEC's direct industrialcustomers. The physical connections for supplying these customers did notchange. Power coming from MSEB is brought to them through TEC's lines, but since1980 they pay their bills to MSEB, which in turn pays TEC a tolling fee for theuse of their lines.
6/ Peak availability is less than the rated capacity. During FY90, theannual peak occurred prior to the synchronization of Trombay Unit 6.
15
2.23 MSEB's reason for the takeover was that direct industrial consumersare highly desirable clients, because they pay higher tariffs and cost less tosupply than residential consumers. Regarding those direct clients that haveremained with T6C, MSEB has neither the grounds nor the motivation to take themover. First, TEC's dependence on lSEB has since been reduced to a reasonablelevels imported energy was 252 of total energy sold in PY90, and is projected at331 for FY2000. Second, MSEB is already charging the highest tariff in its book(Rs. 1.60/kVh after the May 1990 increase, i.e. about twice the MSEB average) forall the energy it sells to TEC, including that resold to the direct clients;hence MSEB would not enhance its Income by taking them over, and it wouldincrease its administrative costs.
Sales Growth
2.24 The recent evolution of TIC's sales by category of client is shown in
Table 2.2:
Table 2.2 a Sales by Client Category(GUdh)
Licensees Own ConsumersYear BEST BSES Total Textile Rall Other Total Total
Currently, BSES and BEST account for about two thirds of TEC's sales and directclients for one third. BEST, who supply the south of the city and BSES, whosupply the north, have shown consistent growth over the decade; BEST at 5.22 andBSES at 8.92. Both have a mixed consumer base of residential, commercial andindustrial, which has to some extent been changing over this period. BSES's baseremains largely static, whilst BEST's consercial consumption is steadilyincreasing with the development of office and hotel complexes. On the otherhand, sales to TEC's direct clients, textiles, railways and other industries,have been largely static in the last 6 years. The average growth rate of energysales, in kWh, is 5.52 p.a.
Dependence on MSEB
2.25 The average growth rate of the peak load, in kW, is much higher,about 82 p.a. Capacity additions are driven by the peak load growth, rather thanby the energy requirement. In FY90 TIC's own generation covered two thirds ofthe peak load, but three quarters of the energy requirement in its system. Byimporting from the grid a larger portion of their peak load than of their energy
16
requirement, TEC enjoyed a higher utilization of their own capacity. TEC'sdegree of dependence on MSEB for meeting their peak has varied between a high ofone half in the early 1980s to a low one tenth since the addition of Trombay Unit6 in March 1990. It will increase again as the system peak load grows at 8? eachyear, while the planned capacity additions are essentially to replace retiringunits. Assuming no further additions beyond the components of the proposedproject, TEC's dependence on MSEB would reach about one half of their peak loadand one third of their energy requirement by FY2000.
2.26 TEC's preferred degree of dependence on MSEB would be for about aquarter of their peak load and about a tenth of their energy requirement. Thisprofile would ensure a reasonable utilization of their own capacity, withoutexposing their franchise to the remote risk of erosion. To maintain this profilein the long-term, TEC would need to increase their generation capacity in linewith the peak load growth. Assuming the required government approvals would beforthcoming as in the recent past, financial resources, both internal andexternal, would not be a constraint.
Diversification
2.27 TEC have also been exploring diversification avenues and haveinvested modest amounts to date both in other companies and through TECdivisions. Examples of the former are an investment of about Rs. 70 million inequity (listed shares) and loans to National Radio and Electronics Company(NELCO), a Tata group company manufacturing radios; and Rs. 2 million in WTIAdvance Technologies Limited (Westinghouse-Tata-Indus), the computer servicescompany with Westinghouse and IFC (IFC's $250,000 equity investment was approvedin FY88). The Tata Electronic Data Systems Division (TEDS) is developing andmarketing new products and services for plant operator training and defenseapplications; its revenues account about for 0.4X of TEC's total revenues in FY89. The Contracts Division has been selected to participate in the constructionof hotels by an Indian consortium in the Soviet Union.
2.28 These ventures are not substantial in cash flow terms and in any casetheir costs and revenues are accounted for separately from the electricitybusiness and do not affect the tariffs. However, TEC regard them as an importantinsurance for the companies' long term survival. Consequently, they plan togradually increase the level of investment and attention devoted to theseactivities. Of the Rs. 2,130 million to be raised from the new PCD issue (paras.2.08 and 3.07), about Rs. 750 millAon is intended to be used for diversification.
i~~~~~~~~~~~~~~~~~~~~~~~~~~~
17
III. THE PROJECT
Project Setting
3.01 The project will be located in the Western Region of the Indianinterconnected power system, where the major supply utilities are the GujaratState Electricity Board, the Madhya Pradesh State Electricity Board and the MSEB,all of which are state-owned. The Bhira hydro power plant is located about 100km south-east of Bombay, while the Trombay thermal power plant is located in themetropolitan area. Bhira is at present connected to Bombay by 110 kVtransmission lines and both plants supply TEC's license area in Bombay, which isthe largest demand center in the region. Other suppliers in the Western Regionare the TEC, AEC and SEC. A total of 17,669 MW was installed in the region as oiMarch 31, 1989. Of this, private utilities owned 1,624 MW (AEC; 510 MW, TEC:1,114 MW) i.e. 92; the contribution of GOI-owned entities was 3,150 MW cpmprising420 MW from Tarapore Nuclear Station, 2,100 MW from NTPC Korba and 630 MW fromNTPC Vindhyachal coal-fired power plants. Thermal stations accounted for 85Z ofthe capacity (78Z in 1984), hydro about 132 (18Z in 1984) and nuclear for thebalance of about 22 (Annex 3.0).
3.02 The coincident maximum demand of the Region in FY89 was estimated tobe 10,637 MW (Annex 5.0, Table 1), of which only 9,913 MW was able to be metbecause of a capacity shortage. Power systems operated with a frequency below49.8 Hz for about 22.842 of the time in FY89. In Maharashtra, power cutscontinue to be in force on certain categories of customers. In addition, due toforced outages of thermal plants, the Region periodically faces peaking shortagesand load shedding, particularly in the evening peak hours. Moreover, the needfor thermal plant to operate at partial load during off-peak hours is shorteningequipment life considerably. To correct these imbalances, the long termexpansirn plan for the Region includes the installation of a number of peakingplants7 (para. 5.05).
Proiect Objectives
3.03 The physical objectives of the proposed project are to:
(a) provide additional peak generation capacity to meet more of theincreasing demand in the Bombay area and reduce TEC's dependence onthe state's grid;
(b) increase the capaq ity utilization of existing thermal generatingunits at Trombay8 l and add a gas based combined cycle plant, all of-which will reduce the average cost of generation;
7| The existing 560 MM Koyna hydropower plant, owned and operated by MSEBis being expanded by an additional 1,000 MW capacity, within the BankMaharashtra Power Project (Lu. 3096-IN), to allow the entireinstallation to operate in a more peaking mode than at present.
at 8 By operating these units at a higher load factor during off-peak hoursfor pumping water at Bhira PS Scheme.
(c) mitigate the sulphur dioxide emissions from the coal and oil burningTrombay Unit No. 5; and,
(d) improve system reliability and quality of service to consumers.
The institutional and sectoral objectives are tot
te) support increased private sector participation in the supply ofpower; and,
(f) encourage improved tariff structures and load management proceduresfor TEC's direct consumers.
Project Description
3.04 The proposed project is part of the least-cost development programfor the Western Region Interconnected System. It consists of the followingelements which are described in detail in Annex 3.1:
(i) Construction of a pumped storage (PS) scheme with one nominally rated150 MV pump-turbine at the existing hydro-electric power plant atBhira; the scheme will benefit from the existing Mulshi dam, tailpond and tunnel, so new civil works will be limited;
(ii) Expansion of the transmission link to evacuate the additional powerfrom Bhira to TEC's licence areas upgrading of the transmission linesfrom Bhira to Dharavi in Bombay to 220 kV using the right-of-way ofthe existing 110 kV lines; installation of a 220 kV underground cable-t the Dharavi end for environmenial and resettlement reasons; and,extension of the Dharavi substation;
(iii) Construction of a 180 MV gas fired combined-cycle (CC) unit at theTrombay power station, with one 120 MW gas.turbine-generator, arecovery boiler and one 60 MV steam turbine-generator and associatedauxiliaries; and,
(iv) extension of the flue gas desulphurizatign (FGD) facility in TrombayUnit 5: installation of a second stream9' using the Flakt sea-waterbased technology, adopted successfully for the first stream and in
. operation since March 1988; this will scrub sulphur dioxide from theemissions of the Trombay Unit 5 to comply with the limits of theMaharashtra Pollution Control Board (MPCB); and
;t, (v) review of design and technical specifications and supervision of.ponstruction of the Bhira pumped storage scheme and acquisition ofkInow-how for the extension of the FGD facility at Trombay.
\~~~~~~~~~~~~~~~~~~~~~~~
9/ Each stream would process one quarter of the flue gases from the 500mW unit.
cost Istiinteo
S *0O The Ostimated cost Of the proposed project is summarized in Table3.1. Detalls are Cilven In Annen 3.2.
Tma io 8.1 Sotc,atc PWROlCoat Cooa
PuoJccat C.eato .oAaI ForoigsL Totl 1*coDl Foroigs Total
Total Ptomaoine QOqnlrv 2199 804 5242 12.5 144".2 278.7
70-roalMrd-W d w - - - mal on
Basis for theEsetinates
3.06 Cost estimates for the civil works are based on available ditafrom other proijects engineered by ThC's consultants (para. 3.10). Cost,estimates for .quipnsnt and materials are baled on the budgetary offersreceived from a nAmber of manufacturevs and' copred with the most recent-quotations received tor similar projects. The estimated cost for consultingseeV4cee is based an the already recqived quotations. Base prices wereupdqted to January 1990. Physical contingencies of 103 on civil works (202for civi, voths at Uhira PS Scheme) and 53 on equipment were assumed on the'basis of experience with similar projects and amount to about 72 of the basecost. Price contitngencies, which amount to 161 of the base cost, are based on-the expected annul domestic and International Inflation rates. The domesticinflation rates used for cost estimates are as followsi 7.33 for FY91. 7.03for Fift and MS9, 6.63 for FY4 and 6.53 thereafter. The Internationalinflation rates are assind as follows. 4.93 for FY91 and therea fter.
Prjoiet Pinancins
3.07 Vhe project is the largest component of bTECsa Investment programever the namt fgm years. fhe 6oveall program also inclm;des routine capitalexpenditure, diversification investments and most notably an expansion ofseveral Lines. nd substations to augment TiC's transmission system. Half the
i
20
cost of the latter is to be financed by a SF 60 million (USs 40 million) IFCloanapproved in FY89. The part of the overall financing notionallyattributable to the proposed project, if segregated from the cumulativeamounts, is shown in Table 3.2.
Table 3.2: Incremental Financing Plan for the Prolect
Local Foreign Total Local Foreign Total---------Rs Million-------- ---------USS million------
3.08 The proposed IBRD and IFC loans of USS 98 million and US$ 60 millionequivalent, would cover about 38Z and 241 respectively of the total projectfinancing requirements, net of duties and taxes.
3.09 The IBRD loan would be lent directly to TEC and would be guaranteed by
GOI, which would levy a guarantee fee of 2.75? p.a. The IFC loan would be madedirectly to TEC. The interest risk on the IBRD loan, and the foreign exchange riskon IBRD and IFC loans would be borne by TEC. The IBRD loan and the IFC loans would,be cross effective with each other (para. 6.03.d).
Status of Engineering and Project Management
3.10 TEC would be responsible for implementing all the components of theproposed project; with the assistance of Tata Consulting Engineers (TCE) and aninternational consulting firm with specific experience on pump-turbine projects.TEC's proposed project management structure is shown in Annex 3.3. TEC will retainTCE as the le#d consulting firm for all components of the project. TCE will assistin the engineering design, preparation of tender documents, specifications anddrawings, assistance during bidding process, preparation of construction drawings,supervision during equipment\manufacture, erection, and civil works construction.TCE engineered successfully all the projects realized by TEC, including TrombayUnits 5 and 6, partly financed by IBRD and the transmission system developmentpartli financed by IFC. TCE's experience is acceptable to the Bank for thisproject. For their part, TEC have demonstrated competence in project managementduring the construction ,of the above IBRD and IFC financed projects.
3.11 The type and size of the pump-turbine and generator-motor to beinstalled within the Bhira PS Scheme is relatively new in India and no substantialexperience is available in the country with equipment of similar characteristics.Therefore, with IBRD financing under the Trombay IV Project (LN. 2452-IN) inmid-1989, TEC and TCE initiated the selection-,process f4r a qualified foreignconsulting firm to assist in'the review of design and technical specificati\ns of
21
these major mechanical and electrical equipment. TEC and TCE have received fiveoffers and they have selected Electricite de France (EdF), who are satisfactory toIBRD and IFC. About 70 person-months would be required for these tasks,Consultants' supervision activities would be financed under the proposed proje t.The know-how for the expansion of the FGD scrubber stream at Trombay would beobtained from A/S Norsk Viftefabrikk (Flakt), Norway.
Project Schedule
3.12 The project would be implemented over a period of four years (Annex3.4). The Bhira PS Scheme would be implemented in three years from the date ofaward of the contract for the main civil works, during the 1991-1994 period.Delivery of the main plant and equipment would be within 21 months and subsequenterection and commissioning is envisaged to be completed by September 1994. Thetransmission development associated with Bhira PS Scheme would also be implementedin the 1991-1994 period, to be ready when the pumped storage project iscommissioned. The combustion turbine of the CC Scheme at Trombay would bemanufactured and erected within 24 months of the award, i.e. during the 1991-1993period, and will initially be operated in open cycle. The heat recovery boiler andsteam turbine would be commissioned within 36 months of award, i.e. during the1991-1994 period. Then the entire scheme will operate in combined cycle. Theextension of the FGD Scrubber Stream at Trombay Unit 5 would be realized during1991-1994 period, within 24-30 months of award. The proposed project would becompleted by March 31, 1995.
Procurement
3.13 The procurement arrangements are summarized in Table 3.3 and details, aswell as major milestones of the procurement process, are shown in Annexes 3.5 and3.6. For performance guarantee reasons, the main package for the 180 MW Gas BasedCC Scheme (120 MW gas turbine and its generator, 60 MW waste heat recovery boiler,steam turbine and generator and auxiliaries) would be procured as a singleresponsibility contract under international competitive bidding (ICB) and on asupply-and-erect basis. The turbine-generator / pump-motor for the Bhira PS Schemewould also be procured under ICB, also on a supply-and-erect basis. Among theremaining contracts, some would also include civil works (e.g. substation structureand transmission lines); this would ensure better coordination duringimplementation. Civil works packages would be procured under local competitivebidding (LCB), because the size of each package is too small (four contractsestimated to cost a total of about US$16.1 million; the largest being US$6.7 millionfor the Bhira PS Scheme) to attract interest from international contractors. Inprinciple the IBRD funds would be used to finance the above mentioned main packagesfor the Trombay CC and Bhira PS Schemes, and the IFC funds would cover most of theremaining materials and equipment contracts. It is estimated that the majority ofthe latter will be imported directly by TEC, but a portion of the IFC funds may beused to pay for locally procured items. This allocation of the IBRD and IFC fundsmay be revised, in consultation with the Guarantor, during project implementation.
Total 112.8 21.1 92.0 4.8 230.7IBRD: (93.0) ( 4.0) (1.0) C - ) (98.0)IPC s _) C-) (60.0) C_) (60.0)
a/ Contract values include contingencies and taxes and duties (US$ 18.8 million).bI Consultants' services to be procured under IBRD Guidelines for Consultants.ICB: International Competitive Bidding.LCBs Local Competitive Bidding.Others Direct imports and locally procured items.N.A.: Not Applicable (Administrative Expenses)Note: Figures in parenthesis are the respective amounts financed by the IBID and IFC
loans.
3.14 Contracts for materials, equipment and erection worth less thanUS$200,000 each and vith an aggregate value of US$4 million may be procured on thebasis of local competitive bidding in accordance with procedures satisfactory toIBRD. Bidding documents an4 recommendations for the award of contracts would beprepared by TEC with the assistance of TCE. Contracts financed under the IBiD Loanworth US$2 million or more would be subject to prior review by IBRD. This categoryis estimated to cover about 90X of the value of all ICB contracts. The smaller IERDfinanced contracts under ICB would be subject to selective post award review. Localmanufacturers would be expected to bid for most categories of equipment, and adomestic preference of 151 or the corresponding import duty, whichever is less,would be applied in the compatison of bids for equipment contracts. Foreignconsultants to assist TEC and TCE in the design and Implementation of the Bhira PSScheme have been selected in accordance with Bank Guidelines on the selection ofconsultants (para. 3.11). The know-how supplied by AIS Norsk Viftefabrikk, Norway(Flakt) will be obtained through a negotiated contract, satisfactory to the IBRD andIFC; this contract would be financed under the IFC loan.
3.15 Procurement under ICB reduces the cost of inputs purchased fromdomestic suppliers, because of exemptions from customs and excise duties.Customs duties are not waived on imported packages. This treatment applies toloans from certain development lenders, including IBRD but not MFC. IFC loans
23
do not qualify for the deemed export benefits, and do not entaii the GOIguarantee fee.
Diasursemekts\
3.16 Disbursements from the proposed IBRD loan would be made againsts(a) lOOS of the foreign currency expenditures and 1002 of the localexpenditures (ex-factory cost if manufactured in India) of equipment, andmaterials; (b) 10OX of foreign expenditures and 702 of local expenditures forthe erection of plants, transmission lines anA substationsg and (c) 1002 ofthe foreign expenditures on consultants. Disbursements for equipment,materials, and erection under contracts valued less than US$200,000 equivalentwould be made against statements of expenditures (SOE), the documentation ofwhich would not be sent to the Bank but would be retained by TIC forinspection by supervision missions. All other disbursements would be fullydocumented. Retroactive financing, in an aggregate amount not exceeding US$2million has been provided in the IBRD loan, for expenditures made after May31, 1990.
3.17 To facilitate disbursements a special account would be establishedfor the IBRD loan with an authorized allocation of US$7 million. Annex 3.7shows the estimated disbursemuent schedule as derived from the constructionprograms of the project components (para. 3.12), assuming normal terms forcommircial payments, including retention paymients. The aggregateddisbursement profile for the project is four years.and does not fit IBRD'sstandard profiles because the components of the proposed project haveparticular characteristics. The Bhira PS Scheme does not involve theconstruction of any dam or tunnel, the upgrading of the transmission capacityfrom Bhira would not require any clearing and development of transmission lineright-of-ay, and in the Trombay CC Scheme the equipment, which would requirethe longeSt manufacture and installation time is the waste heat recoveryboiler which would be installed in about 36 months from the date of award ofcontract. The last payments are estimated to be made during the first half of1995. Accordingly, the closing date for the loans would.be June 30, 1995.
Security Arrangements
3.18 The proposed IBRD and IFC loans would be secured by first chargeon all of TEC's assets,lsubject to Aertain prior charges on current assets infavor of working capital lenders, shared pari passu with other senior lenders.Annex 3.8 shows TEC's borrowing position and the priority of existing liens onits properties as of March 31, 1989. Partial disbursement of the IFC loanwould be permitted against hypothecation on moveable assets.
3.19, The Bank, loans (1549- IN and 254Z-IN) for the Trombay fifth andsixth units (500 MW each) have been secured bi mortgage, charge and floatingcharge on TEC's assets at the Trombay Thermal Power Station (including the 500KW units), the Trombay Housing Colony and the Trombay License. TEC's otherborrowings for these units are secured by mortgages, charges sad flgatingcharges on all their assets and all their joint and separate licens6s. Theother debentures bf the three companies forming the TEC are secured by amortgage, charge and floating charge op the respective assets and licenses of
24
each, including their respective interests in the assets and licenses jointly
owned by them.
3.20 TEC agreed to the following security arrangements for the proposedloans (para. 6.02.b)t
(a) A mortgage over all the immoveable properties of TEC;
(b) A floating charge hypothecation on all moveable assets of TEC;and,
(c) Assignment by way of mortgage of TEC's Licenses, includingextensions and renewals thereof.
3.21 The proposed security will be shared parn passu with TEC'sexisting senior lien holders and also with the Indian Financial Institutionsand other senior lenders for the proposed project. The security will beobtained in the form of an equitable mortgage with an assurance from TEC that
- at the request of IBRD andlor IFC, TEC will convert such security to anEnglish Mortgage and for this purpose will also execute a Power of Attorney tofacilitate the conversion of the mortgage from an equitable one to the Englishform. The creation of an equitable mortgage and execution of a Power ofAttorney are conditions of effectiveness of the proposed IBRD loan (para.6.03,a and b).
Fuel Supply for the Trombay Thermal Power Plant
3.22 The actual amount of natural gas supplied to Trombay is currentlyabout 2.5 million m3lday, equivalent to 748,000 tons/year. However, thefirm" gas supply committed by the Oil and Natural Gas Commission (ONGC) is1.5 million m3/day. The 180 MV CC Scheme is estimated to operate at a loadfactor of 68Z and generate 1,080 GWh p.a., consuming 630,000 m3Jday of gas.This will be taken from the existing 'firm* commitment; i.e. the project isnot based on additional gas allocation. The balance of the gas,will continueto be burned in the conventionalVthermal units 5 and 6. Unit 5 (500 Mv) \alsoburns coal and oil and Unit 6 is equipped to burn oil and gas only. ONGC 4asa gas pipeline to Trombay, and since 1978 has been supplying the existingunits with associated gas from the Bombay High Oilfields, as and when it isavailable. TEC are so far the only user for much of this fuel,.which wouldotherwise have to be flared. New consumers will be taking quantities of gasfor the next few years, but new oil and gas finds are made regularly.Although ONGC can give no firm commitment today for supplie; beyond 1.5million m3/day, it seems that for some years there may be no market except TECfor a large part of the associated gas currently being flared offshore.
3.23\ Gas now contributes the largest share of the calorific input atTrombay. The second is residual fuel oil, known as low sulphur heavy stock(LSHS), supplied by small dedicated pipelines from nearby refineries. Thisviscous liquid is extremely difficult to transport by heated trucks, hence TECare a\very convenient client for the refineries. Itdian Oil Corporation hasrecently offered a further 240,000 tons/year of LSHS, which added to thealready contracted 400 000 tonslyear supplied by Bharat Petroleum Corporation
25
and Hindustan Petroleum Corporation, would take care of the complete LSHSrequirements. The actual quantities and unit costs of the fuels consumed inFY90, and their share in the total calorific input are given in 'Xable 3.4:
Table 3.4-: Sunttico 14e Fuolo Uood ot Trombay TPP and Unit Costs
Con__u_tion Unit Cost Shoso of total Sharo of totalFYilO _ Reao calorific InRt SO; ouloslone
sa 829 200 So5 OsCoal 122 200 au B0%oil a10 277 go 70sT
3.24 Trombay TPP is equipped to receive coal by rail. Indian Railwaysnow have facilities to deliver up to about 2.3 million tons of coal per yearto Trombay. However, in order to remain within the S02 emissions limitstipulated by the MPCB, a much lower amount (about 1.3 million tons p.a.) isexpected to be burned at Trombay.
3.25 Neither the limits to the supplies of these fuels, nor the extentof the demand for them which may develop from other users, is yet known, butit is likely that Trombay will burn gas, some LSHS and coal for a number ofyears to come. During negotiations of Loan 2452-IN (Trombay IVth Project),GOI un4ertook to ensure the availability of adequate supplies of suitable fuelfor the optimum operation of the Trombay TPP. GOI reconfirmed this commitment(para. 6.0l.a).
Water Rights for the Bhira Pumped Storage Scheme
3.26 There are no pending water rights issues that could affect theimplementation and operation of the proposed Bhira PS Scheme, which will notrequire additional water and which will simply recycle some of the water nowpassing through the existing hydro electric power plant. Actual water usagein the three hydro stations of TEC is within the allocation sanctioned by theKrishna Water Tribunal. There is no dispute o6 the water rights of Bhira andthe PS scheme has been cleared by the Maharashtra Water Authority.
Land Acquisition
3.27 At Bhira and Trombay, the proposed schemes would be locatedadjacent to the existing Bhira hydro and Trombay thermal power plants,respectively, and would be built completely within the limits of the landsalreidy owned by TEC. No additional land therefore would be acquired;consequently no resettlement is involved. The double circuit 220 kVBhira-Dharavi transmission line would use the right of way of the existing 110kV lines; at Dharavi the lines would end through underground cables of about 5km, which would be buried under the existing streets.
26
Envirgonmetal Aspects1o'
3.28 All &hO components of the project will comply with GOI and GOMstandards as well as with all applicable environmental policies and guidelines,of the iorld Bank. The 8hira PS Scheme would result in expansion of theexisting penstocks and power house. The operation of \the scheme will haveminimal effect on the environment and the water levels,of the existingupstream (Mulshi Lake) and downstream reservoirs. One of the existing 110 kVsingle circuit transmission lines between Shira and Dharavi will be dismantledand a new 220 kV double circuit line ising the existing right-of-way will bebuilt. At the D4aravi end, the line will be connected to the substation by anunderground cable. The environmental impact of this component is alsominimal. With the commissioning of the Trombsy CC Scheme, Units 1, 2 and 3(total capacity-187.5 MS) will be decommissioned. As a result, cooling waterdischarges from Troambay TPP will be reduced, even though existing coolingwater discharges are within GOI and GM4 standards and Bank guidellnes. Themajor air emissions of concern from the proposed CC Schemae are nitrogen oxides(NOx), and the plant will be designed to meet GOI and GOM standards and Bankguidelines. The proposed PGD scrubber stream will be identical to the firstFGD stream, which has been operating satisfactorily since March 1988. -Airemissions and liquid effluents from this unit comply with GOI and GOMstandards and Bawk guideliae.. Receipt by TEC of all necessary environmental.clearances from the GOI and GOM aut1orities is a condition of effectiveness ofthe proposed IBID loan (para. 6.03.c).
Benefits
3.29 The project will increase TEC's peak generating capacity, reducetheir dependence on the supply from MSEB, reduce the transmission losses andthe average cost of generzat-- mand improve system reliability. Tariffadjustments and load management initiatives will bring the level and structureof TEC's tariffs more closely in line with supply costs. The support by theIBRD and IFC would demonstrate the Bank Group's resolve in assisting thedevelopment of private sector participation in\ India's power sector.
Risks
3.30 The physical project components, which are basd on conventionaltechnology, do not present unusual technical risks, in particular whencqnsidering.that , for the 8hira PS Scheme, water reservoirs and conduitsalready exist, and therefore civil works will be minimal. ICE and EdF (para.3.10)have been appointed as engineering consultants; both are acceptable tothe Bink for this project. The Multhi Dam, upstream of the Bhira Hydro PowerProject will be continued to be monitored and inspected periodically by theIrrigation Department of 00M in accordance with Indian regulations.
3231Sl The future performance and viability of TEC depend ;n maintainingthe pr sent operational balance with MSEB. First, TEC rely on MSEB to make upits deficit in peak demand and energy requirements. Second, MSEB has a
101 Oi Details are provided in Annex 3.9.
27
decisive input in the regulatory decisions that affect TEC, e.g. specialreserves, tariffs, approvals for new projects. Third, TIC's physical assetsare fully integrated with MSEB's in the Bombay area, as power generated instations owned by TEC or MSEB travels alternately through lines andsubstations belonging to either, to reach the final consumer. Thisinterdependence has helped TEC to maintain and develop their concession, whilecontinuing to serve their consumers efficiently. Ensuring the supply of powerto consumers "in the most efficient and economic manner is MSEB's mainmission under the Act, and it is fulfilled partly through TEC. In thepolitical climate of the late 1970's there was a tendeacy for the state sectorto take over all power generation and distribution. and the future of privateutilities seemed bleak. Ten years later, as deficits persist, the role of theprivate sector in power is being encouraged, with additional incentives beingconsidered. As long as TEC continue to be efficient and are able to controltheir costs and consequently the tariffs, there will be little incentive andmuch risk for MSEB to upset the present working balance. Consequently, therisk of an adverse change in MSEB's relationship with TEC that might seriouslyaffect TEC's operations is considered remote (para. 2.04).
3.32 Increases in TEC's fuel costs or in MSEn's tariffs would increaseTEC's tariffs, i.e. would be passed on to its consumers. The debt servicecoverage would not be affected, unless, in the event of sharp and sustainedincreases, consumers were able to stop TEC from raising its tariffs to thelevel allowed under the Act. As long as input costs and tariffs increases arenot much steeper than general inflation and as long as power deficits persist,this risk is considered manageable.
Project Monitoring and Supervision
3.33 TEC will submit, starting with the quarter in which the loans aresigned, quarterly reports covering the work of coniultants, physical progress,costs, disbursements and administrative aspects of the proposed project. Inaddition annual financial and administrative reports will be submitted.
=.
28
IV. FINANCIAL ANALYSIS
Past and Projected Financial Performance
4.01 TEC's recent and projected financial performance is detailed inAnMax 4.0 and its FY8S5-Y2000 performance is summarized in Table 4.1.
4.02 As a regulated utility under the Act (para. 1.10) TEC recover theirfull costs and earn a predetermined return on their capital base. They havealways serviced their debt regularly and paid dividends at 162 and, in the lastthree years, at 182 of par. Despite the low depreciation rate allowed under theAct, TEC had a comfortable cash flow because of the special appropriationsallowed by the State (para. 1.11). The cash flow raised through specialappropriations, which are charged in the tariffs, was about 1.8 times the amountof depreciation during the MYSS-MYOg period. The majority of TEC's debt (over 702in PY89) is In foreign exchange, hence subject to revaluation in Rupee terms.This revaluation, charged through a special appropriation, has increased tariffsby less than 22 to date.
4.03 The cash costs of generation have been contained, mainly due to theuse of competitively priced gas as the main fuel, as well as the high plant loadfactor and overall operating efficiency. The cost of purchased power increasedsharply in the past 5 years, to currently about twice the full cost of TEC's owngeneration. 1iSEB's tariff to TEC is now significantly higher than TEC's averagetariff: Rs. 1.60/kVh since May 1990 vs. TEC's 1.00.
4.04 TIC's financial condition is projected to remain solid, with a longterm debt: net worth ratio of 1.5 maximum and a current ratio of 1.2 minimum.Cash flow will remain strong, with a debt service coverage (DSC) of 1.25 averagethrough PY2000 and a mini=w= of 1.20 in FY96. About 202 of total new investment,
29
including normal capital expenditures is expected to be covered by internalresources (self-financing). To yield the return allowed under the Act, after thevarious appropriations allowed today, tariffs will need to increase from Re.1.00/kWh average In FY90 to 2.11 in FY2000, i.e. at an average rate of 7.7? p.a..
4.05 These projections include the effect of fuel cost increases, assumedat 82 p.a., and imported power cost increases, assumed at lOZ p.a., which arepassed on to the consumers through automatic tariff rises. They also assume a68.52 load factor of the newer thermal units, which is lower than the actualhistoric level, but much higher than the average in MSEB. The impact of adversechanges in these key assumptions on the tariffs and the DSC is quantified in thesensitivity analysis (para 4.08). The key assumptions for these projections aredetailed in Amnex 4.0, Table 5.
4.06 TEC's ability to service their debt depends both on their maintainingan efficient operation and cost position relative to MSEB and also on theircontinuing to charge the special appropriations allowed by GOM. The financialprojections assume that the special appropriations for project costs allowed byGOM would continue as per existing practice. To prevent adverse change in theexisting,practice, GOI agreed to cause GOM to continue to allow TEC the currentpractice of collecting certain special reserves as are permissible under theElectricity (Supply) Act (para. 6.01.b.iii). In addition, to ensure the continuedfinancial strength of TEC, TEC agreed to limit their long-term borrowings suchthat their long-term debt to equity ratio will not exceed 2.0 at any given time(para. 6.02.c). To monitor TEC's financial position, TEC agreed to provide theBank and IFC by December of each year, with their financial projections for thecurrent and next four financial years (para. 6.02.d).
4.07 To compute the incremental project return, full financialprojections were run for the case with and the case without the project, thelatter excluding all the effects of the project on the generation, costs,revenues, investment and financing. The cash flows attributable to the projectwere calculated as the difference between the two cases. The project rate ofreturn (ungeared, i.e. excluding the interest on the project loans only) is theITR of the differential cash flow stream to TEC was computed at 23.82. This doesnot include the savings accruing to consumers as a result of reduced tariffs inthe case with the project, compared to what tariffs would be without it. The IRRof the Combined Cycle (with the FGD) project alone is 27.32 and that of the BhiraPS Scheme (with the transmission lines) is 17.8?.
Sensitivity Analysis
4.08 Increases in the fuel or purchased power costs are charged on toconsumers in full, so TIC will raise the additional cash flow through increasedtariffs and therefore the debt service cover (DSC) will not be affected. If bothfuel costs and MSEBs tariffs increased by 13? p.a. (the other parametersremaining unchanged) TEC's tariffs would have to increase 'by an average of 10.02p.a. (vs. 7.7X p.a. average in the base case) to maintain the same DSC. If fueland imported power costs remained at today's levels the tariff increase would beonly 1.22 p.a.. MSEB1's ability to increase its current level of generation andprovide surplus energy to TEC during off-peak hours is limiteA by constraintsmainly on plant maintenance and coal supply. If TEC's average plant load factor
30
decreased to 602 from 68.52 in the base case, the additional tariff increasenecessary to maintain the same DSC would be small: 8.58 p.a. average vs. 7.72 inthe base case. The impact of a 20S cost overrun or of a 1 year delay of thestart up on tariffs, DSC or project IiR is insignificant. This is due primarilyto the cost-plus nature of TEC's operation under the Act.
4.09 Most of TEC's debt (702 on 3131189) is in foreign currencies and adevaluation of the Rupee would increase interest and principal payments in Rsterms. The increase in interest costs would affect the tariffs, while inflatedprincipal repayments, which are not charged through the tariffs, would depressthe DSC somewhat. If the Rupee devalued vis a vis the US dollar more than in thebase case (102 p.a.), tariffs would have to increase by 8.02 p.a. and the DSCwould decrease to a minimum of 1.15 in FY96 vs. 1.20 in the base case. A summarytable of the sensitivity analysis is shown in Annex 4.0. In summary, TEC'sfinancial performance is projected to be quite robust, with the debt servicecover remaining acceptable under a range of possible adverse changes.
V. ECONOMIC ANALYSIS
5.01 India's power systems are planned on a regional basis. Because ofthis, the economic analysis focuses primarily upon the Western Region powersystem, of which the components of the proposed project would be an integralpart. However, when prices are low (as in India), demand and investment can beinflated above economic levels. Analysis of the Western Region power systemtherefore is complemented by analysis of the Bhira and Trombay projectsseparately to demonstrate that each is an economic component of the regionalinvestment program.
Electricity Demand In The Western Region And Supply Capacity
5.02 Electricity consumption in the Western Region and projected demandthrough PY2000 are summarized in Annex 5.0, Tables 1 and 2. Between FY81 andFY88, generating capacity increased at 7.12 p.a., but demand was not able to bemet in full: CIA estimates that in FY88, shortages were equivalent to about 92 ofthe maximum load met. Through FY2000, CIA expects maximum demand will increaseon average at 8.82 p.a.. Capacity additions averaging 10.12 p.a. will meet thisincrease and fully cover the existing shortage. In addition to the presentshortages at times of highest demand, scheduled maintenance and plant breakdownsalso leave small shortages of supply during some off-peak periods. ThroughFY2000, CEA expects that total consumption in the Region will increase at 8.82p.8.. Generation from new plant is expected to increase the supply in total by8.92 p.a., and this would be sufficient to eliminate all off-peak deficits.
5.03 At present, the Region's elasticity of electricity consumption toeconomic growth is approximately 2.1. This can be expected to decline modestlywith gradual improvement in industrial energy efficiencies. Even so, comparedwith projected economic growth of 62 p.a. under the Eighth Plan and 52 p.a.thereafter, generation expansions averaging 8.92 p.a. appear comparativelymodest. Nevertheless, if economic growth fell to below 4.22 p.a., the Regioncould be left with an energy surplus. This is unlikely, but not inconceivable.
31
The effect of a surplus would be to reduce the utilization of base-load coalstations located near load centers (because of their high fuel costs). Stationsgenerating only during peak periods (such as Bhira) would not be affected11 .Neither would combined-cycle stations (such as Trombay), whose fuel costs arelower than those of some existing load-center thermal stationsl2i.
5.04 In practice, lower growth in total consumption is likely also to beassociated with lower growth in maximum demand. If growth in maximum demand fellto below 7.82 p.a., the development program as presently planned would leave theRegion with surplus generating capacity. 'While again unlikely, this also is notinconceivable. The prospect of a capacity surplus combined with a surplus ofoff-peak energy would reduce the desirable rate of adding new base-load capacity.Load-center coal stations would be the preferred candidates for deferral becauseof their relatively high costs (Annex 5.0, Table 5). It is most unlikely thatdeferral of combined-cycle stations would be economic.
Least-Cost Analysis
5.05 Bhira Pumped-Storage Project. CEA's least-cost generation planningfor the Western Region through FY98 shows a requirement for additional capacityin excess of the 10,900 MW able to be installed during this period. Most of therequirement is for additional base load capacity, though to improve supplyreliability during periods of highest demand, the Region also needs to installcapacity that will generate only during peak periods. The Bhira pumped-storageproject (which will concentrate generation by the existing station into 3 hoursper day) is one project option meeting this requirement. Alternatives are a smallcoal-fired station or an open-cycle gas turbine. Simulations of the operations ofthe Western Region power system through FY2000 show that Bhira is the cheapestoption (Annex 5.0, Table 3): present-valued to FY94 (when the station would becommissioned), Bhira offers a cumulative cost advantage over the coal alternativeof Rs. 1452 million (US$ 85 million) and over the open-cycle gas turbine of Rs.943 (US$ 55 million). Assessed over the whole of the station's 25-year operatinglifetime, Bhira's cost advantages are respectively Rs. 5392 million (US$ 316million) and Rs. 3779 million (US$ 222 million),
5.06 Trombay Combined-Cycle Project. The inclusion of the 180 MW combinedcycle project in the least-cost program for the Western Region is justified bythe cost advantage it offers compared with alternative options for additionalbase load generation. Although generation from Trombay delivered into the Bombaymetropolitan area will cost slightly more than generation from a pithead coal-fired station (Rs 0.79/kWh versus Rs 0.76tkWh), Trombay is much cheaper thangeneration from a coal-fired station close to Bombay (Rs 0.91 kWh), (Annex 5.0,Table 4). Moreover, an important factor in Trombay's favor is that it can be,commissioned 2 years earlier (during 1994) than could either of the coal-fireaalternatives. Considered over the lifetime of the station, this gives Trombay a
111 In fact, a reduction in off-peak and load would improve the economicsof Bhira by reducing the station's cost of pumping.
12; The fuel costs of Trombay will be about 52 paise per kWh, whereasthose of a load-center coal station are about 70 paise per kWh.
32
cost advantage over a pithead'\station, present-valued to FY93, of approximatelyRs 1190 million (US$ 70 uillion) and over a load-center station of approximatelyRe 2140 million (US$ i26 million).
5.07 TEC's "firm" supply of gas at Trombay is sufficient to fuel a 410 MWcombined cycle project. This capacity could be reached with the addition of asubsequent combined-cysle project of 230 MV. In the meantime it is economic, andadvantageous environmentally to proceed with the installation of the proposed 180MW project. It is estimated that installing 410 MW in one phase would delaycommencement of the project by at least two years. The phased approach thusenables 180 MV of combined cycle capacity to be commissioned sooner. Theeconomies of scale of a single 410 MH project compared with two phases are small:about US$30 million (152 of the investment costs), and less than 12 of theoperating costs. These economies are outweighed by the value of advancingincremental supply (approximately US$55 million each year 13/). Hence the phasedapproach is economically preferable. Moreover, it is not clear that a 410 MWproject, or a second phase 230 MW, would receive the necessary environmentalclearances. Compared with the proposed 180 MW project, the 230 MW and 410 MWprojects each entail diverting an additional 0.9 million m3/day of gas from theTrombay thermal units. This.would increase coal burning in these units by800,000 tons/year, and increase particulate emissions from the power station by afurther 10 tons per day. Although the Trombay Units 5 and 6 were cleared (12years ago) to burn coal, background pollution levels in Bombay were then muchlower. It is now not clear that the MPCB would agree to either the 410 MWproject, or a second phase of 230 MW. During negotiations, TEC confirmed thatthey will examine the technical and economic feasibility of installing anadditional 230 MW combined cycle project when they next require to installadditional base load generating capacity. In the event these feasibilities areestablished, TEC further confirmed that they would seek the necessary approvalsand clearances from GOM, CEA and DOP.
Program Analysis
5.08 The program analysis considers the FY90-FY2000 time-slice of theWestern Regiokh development program. This period will include the constructionand first few years operation of the Bhira pumped7storage and Trombay combined-cycle stations, their associated transmission and the additional flue gasdesulpburization facilities on the existing Trombay station.
5.09 Program Costs. Capital and,operating costs of the program time-slice are summarized in Annex 5.0, Tables 5 and 9. Financi-al costs have beenconverted to economic terms by excludinig taxes and duties and by applying an SCFof 0.8 to residual local costs. Investments in generation cannot usually berelated to particular investm~nts in transmission and distribution,. Becauase ofthis,.these Investments have been imputed at a rate of 602 of generationinvestments. New coal-fired stations are assumed to consume 0.61 kg/kWh of coaland 10 ml'IkWh of oil. The economic costs of coal and oil are assumed to be Rs
13/ 180 KW net of losses of 132 for 6000 hours at Re. 1.031kWh - Rs.1.58/kVh (para. 5.12) less fuel and 0 & . costs of Rs. 0.55/kwh (Anntex5.Q, Table 4).
33
36O/tonne and Re 2.7/litre. New gas-fired stations are assumed to consume0.23m3/kVh of gas and the economic cost of gas is estimated to be Rs 2,200 perthousand m3 . The cost of pumping in the Bhira pumped-storage station has beenestimated as Rs 0.57/kWh. This is based on the fuel costs of a load-center coalstation (which would be the cheapest source of additional off-peak energy) withallowances for 52 transmission losses and a 152 efficiency lose in pumping.
5.10 Program Benefits. Benefits that will be derived from the WesternRegion development program mostly will be in the form of additional electricityconsumption. Additional benefits may be realized through reducing supply costsduring off-peak periods and through improving supply quality. However, theseadditional benefits are likely to be comparatively small and so have not beenincluded in the analysis. Incremental consumption has been valued assuming thatby FY93 - the first year of benefits from the program time-slice - the averagetariff level in the Western Region will reach Rs. 0.89/kWh (in FY90 prices) andthat thereafter, the tariff will remain constant in real terms. The correspondingrate of economic benefit is assumed to be Rs. 0.71/kWh (Annex 5.0, Table 6).
5.11 Present excess demand (para. 5.02) indicates that consumerswillingness-to-pay for public electricity exceeds existing tariff levels.Incremental revenues therefore reflect only a portion of consumers' benefits andonly a small portion of benefits when tariffs are relatively low, as in India.Determining whether total benefits exceed marginal supply costs thereforerequires examination of consumers' willingness-to-pay.
5.12 Consumers' willingness-to-pay is related to the costs of privatesupply, or to the costs of doing without electricity if private supply is eitherinfeasible or financially unattractive. This analysis conservatively assumes thatonly half of consumers would be willing to pay the higher costs of private supplyand that no one need go without electricity in the event public supply isunavailable. Rates at which consumer accrues have been estimated from theeconomic savings afforded by access to public electricity compared with thehigher costs of private supply. The latter have been estimated from an updatedreview, conducted jointly with CEA, of the costs of private generation andirrigation using diesel pumps (Annex 5.0, Table 6). The average rate of economicbenefit is estimated to be Rs. 0.871kMh. Adding this to the economic benefit ofincremental revenues gives a total economic benefit estimated to be Re. l.58/kWh(about US 9 cents/kWh).
Program Rates of Return
5.13 Estimated rates of return of the FY90 to FY2000 time-slice of theWestern Region development program ares
(i) 72 counting as benefits only the economic value of incrementalrevenues; and
(ii) 251 when allowance is made for associated consumer surplus.
With a 122 discount factor, the Net Present Value (NPV) of the program time-slice (including the allowance for consumer surplus) is estimated to be Rs.
34
159,076 aillions, equlvalent to approximately US$ 9357 millions (Amnex 5.0, Table7).
5.14 Sonsitivity analyses show the program time-slice could withstand costincressee of approximately 502 or reductions in benefits of about 352 before somerectniguration of the progrm would be required for it to remain economic (Annex5.0, Table 7). Similarly, the program time-slice could withstand anImpli ntatlon delay of pore than 4 years and remain economic; how long inpractice would depend on the extent of associated cost increases. In the eventsome reconfiguration of the program became desirable, the deimand and least-costanalyses (paros 5.05 - 5.07) provide assurance that the Bhira and Trombay powerstations would not be preferred candidates for deferral.
Project Anayes
5.15 Mhira Mydro Station and Ihira-Dharavi Transmission. The estimatedrate of return of these project components is 262 and their net present value(WV -- with a 122 discount factor) is estimated to be Rs. 1,770 million(equivalent to US$107 million). Capital and operating costs of the projectcomponents, expressed in economic terms, are summarised in Annex 5.0, Table 8.Generation by Shira will displace a portion of TiC's purchases from MSEB duringea& periods. Supplies thereby released will be used by MS4B to meet additional
peak demand In ksharashtre, but will require Increases in MSEB's peaktrasmisoeon and distribution capacity. These associated investments have beenallowed for In the some way as in the program analysis (par\a 5.09). Pumpingcosts haee been included at Rs. 0.S7/kVh (pars 5.09). As Bhira will only providefirm supply during peak pertods, this generation (net, 203 GWh p.a.) has beenvalued at the full cost of alternative supply - Rs 2.451kVh (Annex 5.0, Table 6).Additional seasonal energy that will be provided by the station (net, 23 Glip.a.) ad tes avings in losses facilitated by the Bhira-Dharavi transmissionline (89 GJh p.a.) have been valued at the average rate used in the programanalysis - Rs l.5B/kh (para 5.12).
546 trombabs Combined-Cycle and Flue Gas Desulphurization'. The estimatedrate Of return Of these project c omont is 272 and th"ir NPV (with a 12Xdiscount factor) Is estimated to ba is 2,792 million (equivalent to US$164
\ million). Capital and oprating costs are again sumuarized in Annex 5.0, Table8. The Trambay combined-cycle station is expected to operate on base\load and tosupply 1026 G0h p.a.. iTe flue gas desulplurization (POD) equipment to beinstalled In the existing Trombay station will ensure that emissions from Trombayemain within pemissible limits when coal is substituted for the gas diverted to
the combned-cycle station. The POD equipment will not significantly affectgeneration from the Trombay thermal units and neither will the increase in coalburnig change tho etation's Costs of generation. Energy provided by thecomblned-icyul station will be used to meet incremental demands from TEC's directcoasiuiro and from the consumers of BStS and BEST, which, TEC supply in bulk. Theadditiol supplies will also reduce TBC's purchases of energy from MSEB, whichwill enable == to Increase supplies to,its own consumers. Estimations haveagain ado allowance for associated Investments in transmission and distribution(para 5.09). Iucrgaenteal supplies have been valued at the average rate used inthe program onalysib (p=ra 5.12).
35
VI. AGREEM$NTS AND RECOMMENDATION
Agreements Reached between IBRD and GOI and TEC
6.0i GOI has:
(a) Reaffirmed the availability of adequate supplies of fuel for TEC'sTrombay Thermal Power Plant (para. 3.25); and,
(b) Agreed to cause GOM to:
(i) extend before June 30, 1991, TEC's license to at least up toSeptember 15, 2010, the maturity date of the proposed IBRD loan(para. 2.03);
(ii) not to take any actions, including delimiting TEC's area ofsupply, that would adversely affect TEC's operationalperformance and financial position (para. 2.04); and,
(iii) continue to allow TEC the current practice of collectingcertain special reserves as are permissible under theElectricity (Supply) Act (para. 4.06).
6.02 TEC agreed to:
(a) Furnish by July 31 of each year, its audited annual accountsincluding a copy of its combined accounts (para. 2.14j;
(b) The security arrangements for the proposed loan (para. 3.20);
(c) Limit their long-term borrowings so that their long-term debt toequity ratio will not exceed 2.0 at any given time (para. 4.06); and,
(d) Provide their financial projections by December of each year coveringtheir current and next four financial years projected performance(para. 4.06).
6.03 The following would be conditions of effectiveness of the proposedIBRD Loant
(a) Creation of an equitable mortgage in a form satisfactory to IBRD(para. 3.21);
(b) Execution of a Power of Attorney in favor of IBRD to enable IBRD atits discretion to convert the mortgage to an English form (para.3.21);
(c) Receipt by TEC of all environmental clearances from the GOI and GOMas shall be necessary for the construction of the Trombay CC Scheme(para. 3.28); and
(d) All conditions precedent to disbugs t of the NC Loan bave beenfulfilled (para. 3.09).
Agreements Reached between IFC and TIC
6.04 The terms and conditions of the Inestmet Agreet between IPC andTEC are consistent with the above.
Recommendation
6.05 On the basis of the project justification ad the agreeoutoreached, the proposed project is suitable for an ISUD loan of US$98 million andIFC loas of US$30 million and Yen 4,600 million to the Tuta Ulectric Companies.
a/ Constrolnod by opply capaclty. N ootlato8 arc avotlable on tho ontont of aupproosod dmnd In FY02.I/ *osr*, ratos aro ovoCrta*cd sO 1961/62 data rOt loct supply rotelr then domand.C/ Total final dmand -for onorn pluo tranomialon -and dictribution lOoo.
Estimeted by CEA.
Source: Thirtoontt Eloctria Posor Survey of India, CEA, Doembor 1987, plus Bank cotinatos.
g-
, .~~~~~~~~0. .- 9 .~~~~~~~~H~
38 '
38 . . .Annex 0
Page 2 of 2
INDIA
PRIVATE POWER UTILITIES YROJECT I
ELECTRICITY SUPPLY AND DEMAND
ALL-INDIAs ENERGY CONSUMPTION WY MAIN CONSUMER CATEGORY
Actual (2) Estimated (2)
Consumer Category FY82 FY88 FY89 FY95 FY2000
1. Domestic 11.6 14.7 15.3 19.4 23.6
2. Pub¢ic Lighting 0.9 0.9 1.1 1.3 1.5
3. Public Water 2.3 1.8 1.9 2.2 2.5
4. Agriculture' 16.9 23.8 24.1 28.1 iz.o
5. Industry 57.7 48.8 47.5 39.1 30.6
6. Traction 2.8 2.5 2.5 2.4 2.4
7. Commercial cl 7.8 7.5 7.6 7.5 7.4
Total 100.0 100.0. 100.0 100.0
8/ Estimated by CEA.b/ Estimated by Bank.c/ Includes'consumption by other miscellaneous 'ategories of consumers.
Source: Thirteenth Electric Power Survey of India, CEA, December 1987.
a Fuel Adjustment harge before/after the rGevisia (the difference was
mrged in the Baskic ergy Charge).
b Anticipated.
\Source: MSEB and TEC
40 1'
PRIVATE POMER UTILITIES PECT I
Prvio Lanms ad Credits to Indin Poer Seetor (as of Warch 31. 1990OIRMoulnt *n uS3 miIIon)
' proval Closing LOn Amuntflosi: iIboora 1 Date Dls Aount Dijgjr Status
1. India First DVC - Bokao - Konar 23 4/50 2/S6 18.5 16.7 Coplete2. India Second OCC - faithon - Panchot 72 1/53 6/58 19.5 10.5 Cooplete3. Tata Trombay Power 106 11/54 9/66 16.2 13.9 Complete4. Tata Second Ttambay 164 5/57 9/66 9.8 9.7 Cosplete5. India Third OYC - Ourgapur 203 7/58 6/65 25.0 22.0 Complete6. India Koyna Pwei 223 4/5 4/65 25.0 18.7 Complete7. India Power TransRission 416 6/65 12/70 70.0 50.0 Coaplete8. India Second Kothagudem Power 417 6/65 12/70 14.0 13.8 Complete9. Tata mird Trombay Thermal Power 1549 4/78 12/84 105.0 .0 Complete10. India Ramagundam Thermal Power () 1648 1/79 6/87 50.0 45.6 Complete11. India FaraRka Thermal Power ( 1887 6/80 6/89 2S.0 2.5 Complete12. India Secofd Ramagundam Thermal Power () 2076 12/81 6I90 280.0 A/ 256.413. India Third Rural Electrification 2165 6/82 6/88 304.5 295.5 Complete14. India Upper Indravati Hydro 2278 5/83 6/94 156.4 0.315. India Central Power Transmission (*) 2283 5183 3/90 250.7 77.616. India Indira Sarovar 2416 5/84 6/92 17.4 4.917. India Second Farakka Theral Power (*) 2442 6/84 12/91 300.8 97.318. Tata Fourth Trombay Thermal 2452 6/84 6/90 135.4 118.919. India Chandrapur Thermal Power 2544 5185 12/92 300.0 126.020. India Rihand Pmer Transmission (M) 2555 5/85 12/89 250.0 165.121. India Kerala State Poter 2582 6/85 9/91 176.0 23.222. India Combined Cycle () 2674 4/86 12/91 485.0 343.923. India Karnataka Power 2827 6/87 12/95 330.0 21.724. India National Capital Power Supply (a) 2844 6/8 6/95 485.0 120.925. India Talcher Thermal Power (*) 284 6/87 3/96 375.0 30.226. India Second Karnataka Power 2938 5/88 12/96 260.0 20.927. India Uttar Pradesh Poter 2957 6/88 1296 350.0 26.628. India Nathpa Jhakri Power 3024 3/89 12/97 485.0 35.029. India Naharashtra Power 3096 6/89 12/96 400.0 20.0
Total 5,719.2 2,092.8(Total Loans for TKPC Projects) (2,501.5)
it Out of original loan amount of US$300 million,US$20 million s cancelled.
IDA roits
1. India Fourth OVC - Ourgapur 19 2/62 12/69 21.9 19.9 Complete2. India Second 1 Power 24 8/62 9/70 21.1 21.1 Complete3. India Kothag & Power 37 5/63 12/68 24.1 24.1 Coaplete4. India Se uipment 9 6/66 6/74 26.6 26.3 SCoplete5. India Second r Transmission 2 2 4/71 3/77 75.0 72.9 Complete6. India Third Power TransMssion 37 3/73 9/78 85.0 85.0 Complete7. India Rural Electrificatio 572 /75 1/ao 57.0 57.0 Complete8. India Fourth Pouer Transmission 604 1/76 6/83 150.0 149.9 Complete9. India Singraull Thermal Power (') 685 3/77 6/84 150.0 150.0 Complete10. India Korb& Thermal Power () 793 4/78 3/86 200.0 199.9 Complete11. India Ramagundao Thermal Poaer (*) 874 1/79 6/87 200.0 200.0 Complete12. India Second Rural Electrificatlon 911 5/79 3/84 175.0 171.7 Complete13. India Second Singrauli Theriial Power () 1027 5/80 3/89 300.0 292.8 Complete14. India Farakka Thermal Power (*) 1053 6/8C 12/ 225.0 25.0 Complete15. India Second Korba Ther=al Pow*r (l) 1172 7/81 1289 400.0 370.3 Complete16. India Upper Indravati Hydro 1356 5/89 6/91 170.0 114.017. India Indira Sarovar SF020 5184 6192 13.0 0.718. India Indira Sarovar 1613 5/86 6/92 13.2 0.0
Total 2 306.9 2.180.6(Total Credits for NTP'Projects) (1 24150)
(*) NTPC Projects
P-RWaTE POWE UTLMES PRJEC 0 T.
~~~~~~W MM
CE~Q IO I II EU"~- De ad A 1
AC(A=4
i ,*~~~~~~~~~~~~~~~~~~~~~~~~~~~~~~~ X~~~~~~~~~oya m -diat cl=2 22tV as ; ;i t Ef
g~~~~~~~~~~~~~~~~~~~M _=(A m*R
=Tcmw*~~~~~~~
*a §ac - tL X rsact - f
LE.. o
AW~~~~~~~~~~~~~ W.1
42
Annex 3.0Page 1 of 3
A. D-eails of er ts- Anc lator me
1. Essential and Service Industries : Nil
2. tontinuous Process Industries andTextile Industries 10%
3. Other Industries 15%
i Gu1aKA
After May 1988 power supply to rural loads is available only from 12-24hours generally.
1. Single and 2 shigt industries not to work ietween 1400-2200 hours.
2.i Staggering of weekly offs for HT consumrs. X
3. M4ini Steel Plants to draw \power, from 2200 hours to 1400 hours.
"Source: VWi Annual Report 19~88-89.
43
Annex 3.0Page 2 of 3
C. ExIstinr-and in
. iStnCaaiya o. Marffch 3C 1
Nwubore of Units x HU
1. Koyna 4 x 65; 4 x 73; 4 x 80 8802. Tillari 603. Koyna DPH 2 x 20 404. Eldari 3 x 7.5 22.55. Vir 2 x 4.5 96. Bhatgar 167. Radhanagari 4 x 1.2 4.88. Vaitarna 609. Vttairna-Dam toe 1 x 1.5 1.5
10. Tat. Electric Cos. Bhira - 6 x 22 )* lBhivpAri - 6 x 12 ) 276
* Unlikely to be cou!tissioned fully by 1994-95 and thus peaking deficits
will further increase.
:~~~~~~~~
45
Page 1 of 10
PRIVATE POWER UTILITIES PIOJECT_I
TATA ELECTRIC COMPANIES
Project Description
A. hhira Pumnned Storage Scheme
1. The 'Ohira Pumped Storage Scheme' would form the extension to theexisting six-unit 132 HW conventional hydro power plant (HPP) which drawswater from the Mulshi reservoir lake across the Kula River. Mula River joinsthe Bhima River which in turn meets the Krishna River and flows eastward,through the States of Karnataka and Andra Pradesh, to the Bay of Bengal.Through intakes on the Mulshi Lake the water flow is diverted westward toBhira hydro power scheme located at the western foot of the Western Chats, totake advantage of the steep terrain drop. The Bhira Hydro Power Schemeconsists of the Mulshi dam, two approach channels, two tunnels, Bhira powerhouse, downstream pond and Bhira Tailrace Hydro Power Project. Except for thelatter which is owned and operated by the HSEB, the other structures are ownedand operated by TEC. The Mulshi dam is situated about 95 km southeast ofBombay and about 40 km east of Pune. The Bbira power station is,situated 22km west of Kolad which is on the National Highway No. 17, from bmbay to Goa.
2. The original Bhira hydro power project, built from 1921 to 1927 when itwas commissioned by TEC, consists of a masonry gravity dam 50.6 m high and anungated spillway.' The dam is horizontally arched and the combined length atthe crest is 1,555 m. Approach channels and the intake works are followed bythe headrace tunnel 4,335 m long with a cross sectionwl area of 13 m2 andrated capacity of 34 m3/s. The tunnel terminatas at the surge shaft fromwhich three galleries take off, feeding the six perqstocks located along theelopes bt the Western Ghats. Each penstock is 15 nm in diameter for 1,144 mafter which bifurcates into penstocks 0.9 m in diameter for the last 620 m.'Thus a total of tw6lve penstocks enter the Bhira power house. There are twopelton turbines of about 11 MW each driving a generator. The power house hadinitially five units of I7T.5 KW each'(total capacity: 87.5MW) with provisionfor a sixth unit. Later the generators were upgr4ded and the sixth init wasadded.
3. The Mulshi dam is thus 63 years old. After elperiencing the seismicshock of Decemer 11, 1967 (known as the Koyna earthquake), it has not shown
Pumped storage is a method of energy storage in which electricalenergy produced during low-demand petiods is used to pump wFterinto an elevation from which water is released during high-demandperiods to supply high-value energy. A pumped storage HPPproduces power during peak-load periods by using water previously
pu^ped from a lower ieservoir to an upper reservoir duringloff-peak periods.' '
'l____,___ ,_
46
\~~~~~~~~~~~~~~~~~~~n \ eAne 3.Page 2 of 10
any problems. As advised iy GOM, and as a matter of routine the stability ofthe dam is being surveilled in the context of. the latest Indian Standards.Large diameter core samples of dam masonry have been recently tested at theMaharashtra Engineering Research Institute in Nasik. The average tensile andcomprehensive strength values measured are considered suitable. Stabilityanalysis of the dam, carried out by TCE, concluded that the dam is safe underall loading conditions and that the maximum tensile and comprehensive stressesare well within the actual strength of the masonry. The final results of theanalysis will be sent to the Irrigation Department of GOM for their review andopinion. The dam was inspected in 1989 and the inspection form issued by GO0Irrigation Department concluded that the dam is in good condition and it iswell maintained by TEC. A copy of the Certificate of Inspection is includedin the Project File (Annex 6.0).
4. Mulshi Lake live storage is estimated at 523 million m3, with areservoir surface area of about 41.5 km2. The discharging capacity of thespillway is 1,926 m3/s at maximum water level of 606.1 m.
5. An approach channel has been cut in the lake bed for conveying water atlow lake levels to the tunnel intakes. An auxiliary approach channel existsfor utilizing part of the storage in the event of emergenpies such as adelayed monsoon season. Both channels have stop log gates and can convey148.5 m3/s at minimum reservoir level of 59Q.1 m; both are unlined at present.
6. The origiral tunnel, 4,335 m long with a cross sectional area of 13.0 m2and rated capacity of 34 m3/s (equivalent to about 120 MW generationcapacity), was lined in about 9% of its length. Lining and rock fallsobstructed it gradually, forcing TEC to construct first an auxiliary reservoirat a location called Dongerwadi and later a \new headrace tunnel, including anew apTroach channel, intake works, surge shaft, valve house and connectionsto the penstocks, because the critical power supply situation of the TECsystem made it impossible to stop the' plant for the period required to carrythe repair works. The new tunnel was completed in 1965 and the originaltunnel has been in disuse since then and is not in good condition. Itsrehabilitation is part of the proposed project'.
7. The new tunnel is 4,530 m long, including 405.9 m in surface steelconduit. It is 4.25 m in diameter with 1.52 m level bottom and a crosssectional area of about 14.2 m2. It is concrete-lined throughout its lengthand is connected to the original twelve penstocks. Its rated capacity is 54.4m3/s which would cater to a station capacity of 192 M!4. An additional stoplog gate is located downstream of the off-take channel feeding the new tunnel.
8. Presently the total nominal installed capacity ts 132 MW formed by six,units of 22 MW each. The maximum output' capacity of the plant is 148 KW. Itsaverage annual generation capability is about 850 GWh. Water from Bhira isevacuated to;Kundalika River. The plant production is evacuated from theswitchyard to the Rhopoli HPP and to a substation in Panvel through a \10 kVsystem about 55. k long. The Bhira hydropower scheme is in good condition andis well operated and maintained.
\ -
47
Annex 3.1 \Page 3 of 1O
9.. 'The capacity of the Bhira Tailrace Hydro Power Project is 80 MW (2 x 40MW). The discharges from Bhira are diverted by a masonry weir into a lineddiversion channel with a capacity of 90 m3/s down to a pickup pond impoundedby an earth dam across the Kundalika River. The live storage capacity of thispond is 1.54 million m3. Through a tunnel, water from this pond is conductedto a forebay with a live storage capacity of 1.76 milliom m3, just upstream ofthe tail race power house.
10. The proposed Bhira PS Scheme would utilize the hydraulic structures ofthe existing Bhira HPP, some of'which would be modified, $.proved orrehabilitated to better its hydraulic and structural characteristics requiredfor the existing and proposed pumped storage projects. The pumped storagescheme would utilize the Mulshi Lake as upper reservoir and the pickup pond ofthe tail race project as the lower pond.
11. The major works to be carried out are summarized in the followingparagraphs.
a. Power Plant Civil Works. Rehabilitation of the main and auxiliaryapproach channels including removal of silt, rehabilitation of channel slopes,reQairs to the concrete linings. These works would more than double thecartying capacity of the channels at minimum\drawdown level. Rehabilitationof intake works in the original and new tunnels would include repairs andalterations as necessary to trash screens, gates, gate guides, sill, stoplogsand other items. Hydraulic model studies are being carried out to identifythe scope of the modifications. 'A
b. Head Race Hydro System. (i) Original Tunnel. Work would consist of,cleaning, trimming of existing rock surface, concrete lining for its entirelength, Carrying capacity of the tunnel would be increased to enablegeneration of l50INW for exclusive operation of the existing Bhira HPP. X(ii) New-Tunnel. The existing simple surge shaft would be modified to cbntainthe up and down surges within limits of the turbino operation. A concreteslab would be built at-the bottom of the shaft which would convert singlesurge shaft into an orifice surge shaft. (iii) Galleries. A new valve housewould be constructed at the Fallery No. 4 of the new tunnel at Dongerwadi toaccommodate 3.7 m diameter butterfly valve and accessories on the new penstockto suit the operating conditions of the pump-turbine. (iv) Penstock. A newsurface penstock of high tensile steel (ASTM 517, Gr de F) between the newvalve house at Dongerwadi and the beginning oZ the piessure shaft on theupstream side of the proposed power house would be built. This penstock wouldbe approximately 1,480 m long with\varying diameters of 3,7 m, 3.5 m and 3.3m.\ (v) Pressur'e Shaft. An inclined pressure shaft 180 n long,,\3.3 m indiameter and lined with high tensile strength steel (ASTM 517, Grade F) wouldbe built between the end of the penstock and power house.
c. Power House. A 20 m x 20 m shaft power house oval in shape, toaccommodate the 150 MW pump-turbine and generator-motor and other equipment \would be built to the east of the existing power house.
48
\ ~~~~~~~~~~~~Annex_3.Page 4 of 10
d. Tail pace Structures. (i) Tail Race unnel. A concrete lined.tunnel of3.9 m diameter, 70 m long would be built at the exit of the new power house.The\tunnel would be followed by a tail race channel. Trash screens, gates,stoplogs, hydraulic hoist, gate house and auxiliary equipment would also beprocured and installed at the' end section of the tunnel. (ii) Forebay. Aforebay, leading to the existing pond of the tail race project, would beconstructed immediately downstream of the new tail race channel.
e. Mechanical and Electrical Eaugpment. One 150 KW reversible Francis pumpturbine and one 180 MVA generator-motor, both at nominal ratings, withassociated mechanical and electrical systems and auxiliaries would be procuredand installed at the new power house. One 13.8/220 kV, 180 MVA step-uptransformer would also be procured and installed at the net4 switchyard whichwould be constructed on the west side of the new power house.
12. Geology and ToiographR. Extensive geological and topographical surveysand drill holes (20 diamond drill holes with an appjoximate total depth of2,800 m) have shown that the geology of the area and the topographic featuresare favorable for constructing the proposed Bhira PS Scheme. Adequatemeasures will be taken to determine safe charges for blasting and blastingpattern to protect existing structures.
B. Expansion of the Bhira^Dharavi Transmission System
13. With the installation of the 150 MW Bhira PS Scheme, the eflisting four110 kV transmission lines would not be sufficient t9 evacuate tlb totalgenerated power. Furthermore, it is computed that by uprating thetransmission system to 220 kV, the losses in the TEC transmission systeivwouldbe reduced by about 32 MW tt the generation mode (during the peak hours) and16 KW at the pumping mode; total annual energy savings are computed to beabout 89 GWh. It is therefore proposed to built a 220 kV, double circuittransmission line with twin 0.2 sq.in copper equivalent ACSR conductors perphase. A 220 kV\switchyard would be erected at Bhira, with the provision fortwo 220 kV feeders to which the new double circuit line would be connected.At the Dharavi end of the system, an undergroundt cable would be buried underthe existing streets to avoid resettlement problems because of theconcentrated habitations around the substation, and two 220 kV feeders wouldbe built for the connection of the double circuit line. I
14' The line would be erected along the right of way of t'he existing singlecircuit 110 kV lines. The route length of the new transmission line is 110km. The other technical parameters are summarized as follows:
- Ruling span :300 m- Number of insulators per string: 14 A
15. Two 220 kV feeder bays consisting of circuit breakers, isolating4witches, grounding switches, current transformers, potential transformers,
49
\ . ~~~~~~~~Annex 3.1Page 5 of 10
associated protection systems, etc. would be added to Bhira and Dharaviswitchyards, respectively. The recommended scheme for the 220 kV switchyard atBhtra is breaker and half scheme. This scheme would provide high reliabilityand adequate flexibily f4r future expansion. The other technical parametersare summarized 4s follows:
- Highest syst" voltage : 245 kV- Short\circuit rating :40 kA for 3 sec.- Power frequency withstand voltage : 460 kV- Rating of bus breakers:
- Dharavi : 2000 A- Bhira : 2500 A
- Insulation Level- - for 220 kV :1050 kV
- for 110 kV 550 kV
16. A three-winding Autotransformer with delta connected tertiary would beinstalled at Bhira to interconnect the 220,' 110 and 22 kV netwdrks. Its othertechnical p&rameters are summarized as follows:
- Rating : 220/110/22 kV; 125/125/35 ?VA- Tap.changing : Off circuit taps with ±10% range in steps
of 2.5% on 220 kV winding- Insulation Level
- 220 kV : 1050 kV- 110 kV : 550 kV
- Type of earthing : Star winding grounded through resistance
17. To ensure reliable communication, system operation, protection and datatransmission from Ehira, a fibre bptic communication system (composite fibreoptic groundwire system) would be installed between Bhira and Dhar#vi anainterconnected with the already planned fibre optic systeip of the TEC grid.
C. Gas Ba.ed Combined Cycle Scheme at Trombav TPP(Trombay 7)i
18. The proposed Gas Based CC Scheme (Trombay 7th Unit) w?uld comprise a gasturbine generator (GT) of 120 MW, and a \heat recovery steam generator (HRSG),
l a steam turbine and a generator (STO) of 60 MW. Thus the total-installedcapacity of the scheme would be 180 MW. The 120 KW GT\ would use natural gasas the main fuel. A diesel generator of 3 MW capacity, burning diesel oil,would also be provided to supply power for start-up purpose under black-outconditions. When the CC Scheme would be commissioned, the oldest thr'ee unitsof Trombay (3x62.5 KW - 187.5\ MW) would be shut down; the existing threegenerators which were repaired/rehabilitated during the late 1970s would beoperated as synchronous condensers, to alleviate the voltage drops in theBombay area.
19. IOsal jldCanacity. The Committee of Experts, set up by the Governmentof Maharashtra and including representatives from the Central Electricity \Authority, following frequent system shutdowns (the most recent being in
50k ;
Annex 3.1Page 6 of 10
August 1989), recommended the installation of ' gas turbine generator, withfacility for quick starting \as being .ssential for the metropolitan Bombay.The GT part of the proposed CC Scheme would serve as an emergency source ofpower supply for the essential load of Bombay city, which has been estimatedat 120 MW. An unfired HRSG, using the exhaust gases of the GT unit, wouldproduce enough steam to operate a steam turbine generator of about 69 MWcapacity. Hence the capacity of the CC Scheme would be 180 MW. GT uknits upto ratings of about 150 MW have been commercially proven. These units can'achieve a thermal effic'.ency of about 30-32 percent on the simple cycle mode.Combined with a waste heat recovery steam generator unit, an overallefficiency of about 45-50 percent 7can be obtained. Although the proposed CCScheme would be operated as a base load station, the daily load pattern of'thepower grid would determine the actual generation from the scheme. The plantcapacity utilization has been'considered as 6,000 kWh/kW and the availabilityof the plant is estimated at about 90 percent. V
20. Configati. Taking into account the performance of gas turbine unitsof 130-150 MW and of the steam cycle equipment and investment and 0 & N costs,a configuration of 1 GT + 1 HRS? + 1 STG has been adopted.
21. Location and Land. Trombay TPP is situated on the north-eastern part ofBombay city near the Kurla railway station of Central Railway, at a sea coastsite. Trombay is also well linked by road. Heavy equipment tpuld betransported by barges, which would be beached at the power plant site duringhigh tide conditions, when draft of over one meter would be available. The gCScheme would be installed adjacent to Unit 6 (500 MW) on the western side ofthe steam turbine-generator building. An area totalling 22,800 m2 (80m x285m) would be required for the CT unit, HRSG and turbo-generator unit,generator transformer yard and switchyard. The area available west of Unit 6,which measures 48,000 (150m x 320m) is adequate. The proposed site isgenerally level, requiring only limited amount of land development which wouldinclude a certain amount of filling in low laying partsX From geo-technica4investigations carried out for Unit 6, weathered basalt rock of about 2 metersthickness, was encountered from depths between 10 to 12 meters. Below this,sound rock was encountered. Pilipg is envisaged-for all buildings and majorequipment foundations. i
22. Cooling Water Supply and Discharge. Trombay, being a sea coast site,,sea water is used for cooling the steam turbine condensers of Units 1-6.Units 1, 2 and 3 presently draw sea water each using two pumps located at ihejetty. Units 1 and 2 are connected by a 1,800 mm diameter cement lined pipe,fed by fouripumps each with a flow rate of 4,860 cubic metrs per hour. Thecooling water requiremepts of the CC Scheme is estimated at 14,500 cubicmeters per hour includiiig auxiliary requirements aid would be supplied fromthe existing three pumps of Units l and 2; the remaining pump would be for
LL standby service. These pumps are in good working condition. Studies made bythe Central Water and Power Research Station at the time of engineer¶ng of.init 6, confirmed that recirculation would not take place under all conditionsof tide. Presently, Units 1, 2 and 3 discharge the used c6ndenser waterthrough the discharge channel located near the ittake structure, compared tothe discharge points of Units 5 and 6 and the,proposed CC Scheme. Discharge
51
Annex 3.1Page 7 of 10 -
from the latter would be substantially less compared to that of Units 1, 2 and3, on account of lesser steam turbine capacity and higher overall efficiency.Hence no recirculation effect is anticipated. The existing units areoperating without any adverse effect on marine life.
23. Make Up Water Supply. Raw water for the make-up of the steam generatorwould be supplied by Municipal'Corporation of Greater Bombay. Presently 9,700cubic meters per day are sanctioned by the corporation and drawn by TEC. Therequirement of the CC Scheme is estinate4 at about 400 cubic meters per day;while Units 1, 2 and 3 presently consume 2,000 cubic meter per day. Thereforethe requ.rements of the CC Scheme would be supplied from the existing rawwater allocation for the Trombay TPP.
24. Demineralised Water. The total capacity of the'demineralised waterplants of Units 5 and 6 is 3,240 m3/d at 45 m3/h rate, with one standbystream, while the combined requirements of these units is 21400 m3/d. Thedemirkeralised water requirement of the CC Scheme, which is estimated at 336m3/d at 14 ml/h rate would thus be provided by the existing plants.
25. Aviation Clearance. The 275 m tall chimney of Unit 6 was'cleared by theAviation Authorities, The CC Scheme would have a bypass stack/HRSG stack ofabout 45 meters, which is well within the above limit.
26. Fuel Gas Supply. the require*ent of gas for the 180 MW CC Scheme for anaverage daily generatioA of 3 GWh (1,080 GWh per annum) is 0.53 m3/d (average)based on a heat rate of 1,748 kcal/kWh, density 0.82 kg/Nm3 and calorificvalue 12,300 keal/ke2.
27. Evacuation of Power. There are four 110 kV and three 200 kVtransmussion lines from Trombay to Chembur, Parel, BARC, Carnac, Dharavi andKalwa substations. Local distribution to tndustries located nearby Trom1iay ismade with 22 kV lines. The total firm transmission/distribution capacity ofall these lines is about 2,300 MVA and is thus adequate for evacuatinggeneration of 1,330 MW Trombay Units 4, 5 and 6 and the proposed CC Scheme3.
28. Staff and Staff Col2nv. A nearby housing colony'has been constructed byTEC for the operation and maintenance staff of Trombay TPP. This is beingcontinuously developed by TEC depend ng on requirements. After de-commissioning of Units 1, 2 and 3, adequate staff would be available for the0 & M of the CC Scheme. '
' 2 Gas supply for the Trombay TPP is reviewed in para. 3.22.
3 Trombay Unit 4 150 KWTrombay,Unit 5:--- 500 MW
\ Trombay Unit 6: 500 MWProposed CC Scheme: 180 MWTotal: 1330 MW
:! -.
52
3. 1~ ~~.
Pagp 8 of 10
29. Technical Features. (a) The GT would essentially comprise: - a gasturbine with a multistage axial compressor and a turbine; combustors would bemounted on the compressor discharge casing; - an a4cessory module in whichlubricating oil system, starting motor, hydraulic system, etc. would bemounted; - an inlet system, with a high efficiency filter to remove saltcrystals in the inlet air and an air intake silencer to supress the noise inthe intake air system; an exhaust system which would allow the exhaust gasesescape into tie atmosphere either through a bypass stack or through HRSG, withexhaust silencers, ducts, and dampers; and, - a generator vhich would bedriven by the GT directly at 3,000 rpm. The generator would be enclosed toreduce the noise levels to acceptable levels. The CT and auxiliaries would beprotected with Halon 1301 fire protection systems. The OT would be startedeither by a starting motor or by operating the generator as a converter fedsynchronous motor in conjunctdon with a static frequency control system. Adiesel generating set of 3 KW capacity would also be provided to supply thegas turbine start-up and auxiliary power requirement during complete black-outs. (b) The HRSG would be double pressure (high and low pressure levels),unfired, horizontal/vertical (to be optimized during the engineering) gas flowtype with self supporting stack. A condensate pre-heater would be provided toabsorb the available heat energy of the exhaust gases from the (GT to the,,ma#imum extent. A constant pressure deaerator would be installed for feedwater beating and deaeration of HRSG feed water. (c) Steam from HRSG would besupplied to a condensing type steam turbine through main steam piping. Theturbine control system would be of Wlectro-hydraulic type with a hydro-mechanical system as a backup. The steam turbine would be complete with lubeoil system, hydraulic control system, safety and protections, gland sealingsteam system and jacking oil system. The turbine would also be provided with asurface type condenser fixed below the turbine exhaust. Two 100% mechanical
I vacuum pumps would be provided for the evacuation of the air from the'condenser. (d) The generator would have a nominal 71°.5 MVA rating at 0.85lagging power factor (60MNW). It would deliver power at 11 or 13.8 kV, 3-phase, 50 Hz. The star point of the generator winding would be connected toearth through a transformer having the secondary shunted by a resistance. Thegenerator would be air or hydrogen cooled; the coolers *ould be adequatelysized so that with one cooler section out of circuit for maintenance, the \generator can carry two-third of the rated load continuously without exceedingthe premissible temperature rise. Air or hydrogen would be cooled in watercooled heat exchangers with cooling water wh4ch in turn will be cooled in air.The excitation system would be either brushless or static type and would haveautomatic voltage regulator capable of maintaining stability under transientconditions.. (e) The power from the scheme would be evacuated through a 11 or13.8/230 kV step-up transformer which would be connected to the existing 270ky outdoor switchyard of Units 5 and 6 (the switchya d would need to beextended). The windings of the transformer would beMconnected in delta on lowvoltage and star on high voltage side, suitableX for solid grounding. Thetransformer would have ONAN/ONAF/OFAF type of cooling and would be providedwith ±5% off-circuit taps in equal steps of 2.5%. The high voltage terminalswould be connected to the 220 kV switchyard by overhead lines and the lowvoltage termiials would be connected to the generator terminals throughisolated phase bus-ducts. Lightning arrestors would be provided at 220 kV
l~~~~~~~~~~~~~~~~~~~
53
.~~~~~~~~~~~~~~~~~~~~~~~3 .
Page 9 of 10
terminals of the transformer. (f) Auxiliary systems would comprise the fue1(gas and diesel oil) supply, auxiliary cooling water, condensed cooling water,demineralised water, service water, potable water, fire alarm and protection,air conditioning and ventilation, control and monitoring, compressed air,power station electrical supply, plant direct current, illumination,communication, safety earthing and lightning protection, emergency powersupply and black start, etc. systems.
D. Expansion of the Flte Gas Desulphurization (FGif Unit at TrombaX Unit 5
30. laharashtra Pollution Control Board (MPCB) has stipulated the followingrequirements, while giving its cleerance for the installation of Unit 6: (i)UYnit 5 shall be provided'with an FGD plant with a minimum removal efficiencyi Qf 90% for sulphur dioxide; and, (ii) the total sulphur dioxide emission fromTrombay TPP shall not exceed 15 tons per day after the installation of Unit 6.Keeping in view MPCB's stipulations, TEC installed a pilot FGD plant to treat25% of flue gases (equivalent to 125 KW) from Unit 5; this plant has been-operating successfully since its commissioning in MqLrch'1988. Taking intoaccount, the limited amount of gas allocated for Trombay and the savings infuel cost following a charXge over to coal from LSHS and/or gas, the FGD unitwould be expanded up to 50%4.
31. The existing FGD unit u'ses the Seawater Process developed by Flakt,Norway, and was built by TEC based on the know-how obtained from Flakt., Fluegases from the existing ID fan discharge plant are conveyed to a concretescribber using a booster fan. Inside the scrubber the gases flow countercurrent to seawater. Sulphur dioxide is absorbed due to the natural alkanilityof the sea water and clean flue gases leave the top of the scrubber atapproptimately 40C. They are then mixed with part of the raw gases in a reheatmixer. The reheated gases at 570C exit through the existing 152 m tall stackof Unit 5. Seawater required for absorbtion is provided from Unit 5 condensercooling water system seal well, by a siphon system to a distribution chamber.It is then pumped to the top of the scrubber. Acidic liquor from the scrubberflows by gravity into a mixing chamber located near the seal well, where itmixes with excess seawater again drawn from the seal well and then overflowsinto the aeration basin. In order to bring the quality of this effluent
E 4 In May 1988, prior to obtaining satisfactory oper&tional resultsof the Flakt Seawater FOD technology, TEC had TCE carry aneconomic comparison between Flakt Seawater System and the ammoniaprocess (the latter process uses ammonia liquor for scrubbing of-flue gas and the know-how is provided by Krupp-Koppers, FederalRepublic 'of Gertany; ammonia sulphate is a byproduct produced as asale4ble fertilizer). TCE's conclusion was that the seawater andammonia systems would be comparable in net annual operating ceestif ammonia was made available to TEC with a subsidized price asapplicable to fertilizer units. Following the satisfactoryoperating performance of the.initiWl seawater based stream, TECopted for its expansion. The Bank agrees with this decision. *
54
Page 10 of 10
within the permissible limits, the effluent is aerated by supplying iir withthe help of aeration fans and aeration gri4. The treated effluent is thendischarged to the sea. The design basis for the installation of the proposedFOD stream is:
- Flue gas quantity i : 44,420 Nm3/h- Maximum flue gas temperature : 153°C- Sulphur content in coal : 0.35%- Coal firing rate : 200 t/h- Suphur dioxide removal efficiency : 85% minimum- Particulate content of raw flue gas : 157 mg/Nm3
32. However, in order to have gases leaving the stack at highertemperatures, resulting in higher plume rise and less condensation of acidicwater in ducts and stack, the clean gases exiting the scrubber would be heatedto 454C by using the heat content of the raw flue gas to reheat the cleangases from the scrubber by installing a regenerative heat exchanger. The rawgas, after being cooled in the regenerative heat exchanger, would be conveyedto the scrubber by using a booster fan. The existing pipeline to transferscrubber liquor from the scrubber to the mixing chamber of the aeration basinwould be adequate for the iiicreased flow rate. The major process andoperating parameters for the proposed FGD stream are:
- Seawater flow to scrubber : 2,100 m3/h--- Seawater flow into aeration basin : 8,500 m3/h- Quality of treated effluents ' : To meet the requirements
of Indian Standard 2490- Seawater temperature at inlet of scrubber : 43VC- Clean gas temperature at scrubber outlet : 45sC- Electric power of the streams (installed) : 3,000 kV
i~~~~~~~ -,
55
Anrm 3.2\
Page 1 of 3
INDIA
PRIVATE POMER UTILITIES PROJECT I (TATAIELECTRIC COOPANIES TEC). ., . A _ _.. .. .,,._,............._._.,,a,,,_,_................................................,____,,
Project Cost Summary! ...................
Project Coqpon2nts Local Forefgn Total Local Forefgn Totat, ~~~~................................... ......................... . .......................... ......... .................. __ _.................__
i ------Re. mtLtion --------- ------SS miltion ---
1. 159 Ku Pumped Storage Scheme at Bihra…. - … ........
* Preliminary Works 32 0 32 1.9 0.0 1.9Civil Works 142 28 170 8.3 1.6 10.0
PRIVATE POWER UTILITIES PROJECT I........ !................
FMMRM19' AR_AIOTS
-1- - .IS millns)(Use a, of
ICB LCB Other ZI.A. TotaL Cost
Contract tIU Contract 18 Cntrat- IBRD Contract Contract ISRProject El1ant Value Firnc Value Finne Valuei Finance Value Value Firm=_c.b......................., ..... ..... .... . .... . ..... ..... ..... ..... .....
Civil tork,- Penstock end Pressure Shaft September 90 October 90 January 91 March 91 May 91
-Other Civil Works Septaber 90 October 90 January 91 Narch 91 NWay 91
* Equlpment- Pump Turbine and Genrrator-notor,
including control equipment October 9- January 91 March 91 aoy 91 Junm 91
-Generator trwtsforaar October 90 January 91 March 91 May 91 June 91- Bus Duwt December 90 February 91 Aperl 91 Jurn 91 August 91
- Other Equlpment Deceaber 90 february 91 Aprit 91 Juia 91 August 91
- services-- Engineering and Supervision October 89 (A) December 89 (A) April 90 CA) Gay 90
J. ShireOPharavi 220 kV Transmission System...........................................
- C vil borks- Equipment- Towers and Accessories- woembar 90 Oecesk2r 90 FebrUarY 91 April 91 JuMa 91* Cond4ctors November 90 Decemer 90 February 91 April 91 Juna 9t
- Busbars; Insulators; ICTO November 90 December 90 February 91 April 91 Juna 91
Feeder-gays at Oharavi November 90 December 90 February 91 Ap4er 91 Junie 9Fibre Optic Corsamicationm December 90 January 91 March 91 May 91 July 91
* 2POkV Cabe - Detember 90 Janary 91 March9t May91 July91* Other Equipmentservices- Engineerirn and Supervision (B)
C. 180 NW Combined Cycle Schem at Tr --y............................ ..............
Civil Works*Equipment
-aS Turbineeaet Revry Steam Gen.-Stem Turbine4eneratorAuxiliarfes September 90 Decembpr 90 warch 91 Nay 91 July 91* Control and lnstruntatien Apr11 91 June 91 Augut 91 October 91 Decear 91Oies Gener tor Set Decesber 90 January 91 Nareh 91 Key 91 July 91other Mechnicat Equipment Aprfl 91 June 91 August 91 October 91 DOeosber 91- Transformers April 91 Jiue 91 August " October 91 December 91O Bus Ducts April 91 June 91 August 91 October 91 Deceer 91- Other Electrical Equpmsnt April 91 June 91 August 91 October 91 December 91
- EngIneerfng and Suervsion (B)
0. Expans0on of FGD Scrufber Unftat Troebs Unit 5
Ci vil Works- Equipment
- Regenerative Neat Exchanger Noveober 90 February 91 April 91 June 91 July 91- Booster Fan November 90 Februery 91 Aprl 91 June 91 July 91- other Equipment December 90 January 91 )arch 91 "ay 91 July 91Services* Basic Engineering (Knew-Now)
and supervision SepteU*. 90
(A) ltplemented.(B) Corsultants selected.
./ ~ ~ ~ ~ ~ ~ ~ ~ ~ ~ ~ ~ ~ ~ ~ ~ ~ ~ ~ ~ ~~~0
INDIA
PRIVATE POE UTILITIES PROJECT I. ...................... .........
.,. The Bhira PS Scheme involves upgrading and expansion of existingfacilities. The I4ulshL Lake reservoir (40 1bj?) will serve as a bea" pond forthe project, w$ile the pickup pond can be conveniently used to store water forthe pump storage unit (as the taLl pond).\ There will be no Lncreased overflow(water lose domwntream) at either the Bhira Dam or from.the pickup pond as aresult of this project, thus this project will not adversely effect downstr4#AMwater usors. The existing units at Mhira (6 x 25 1W and 1 x 23 NW '173 1()use 40.5 m3/sec of water for full load operations, while the pr'oposed project"will use 40 *O/secK for generation (150 NW) and 30 ui'sec during puipping.During the generation cycle, the maximum drawdown of the reservoir as a resultof this project will not exceed approximately 10 cm. (assuig $ousofgeneration). However, over the 24 hour generation/pumpcye there wii.l be nochange inm tihe water level1 of the reservoir (or the pickup pond) as a result ofthis projec. -
2. Given the projects planned use of existing facilities * the constructionon existing rights-of-way, and the marSinal change in water level of thereservoir and pickup pond during the 24 hour.generation/pui* cycle, theenvironmental impacts associated with this project are minimal. As requiredby the GOI * TEC has prepared a proforma eu rootal saasssmet for thLsprojects, which has already received necessary GOX and GON nivirnmentalapprovals.
3. In order to bring the additional poer from Ihira to Dhiravi (Bombay), adistance ofa~bout 100 km, the existing 110 kV transmission lines will beupgraded to a double circuLt.220 kV line using.the existing right-of-way. Anumber-of visual inVpectlons were made of the existing right-of-'way atlocations demed to be potentially sensitive from en Qn1ir 8 al standpoint(e.g. at the western piatku near area -of forestriy res . in the suburbs ofBombay, etc.). In all cases, tan environmental impacts associated with thetransmlcsson line will be mithimal. GOI and GOr onvironi2utal approvals arenot reqsilred for this project given the use of the exis'ting rLght-of-way. Atthe Dhersin end, the litn will be connected to the substation by anunderground cable, whlch would be buried undpr the eistiang streets.
69
-Amnex 3.9Page 2 of 3
4. 'The proposed combined cycle plant will be lcated at TEC's Trombay TPPwhich currently has 3 units of 62.5 NW (Units 1, l and 3), 1 unit of 150 IW(Unit 4) and 2 unlts of 500 MW (Units 5 -ad 6). Total capacity at Trombay iscurrently 1337.5 NW, but this would be reduced to 1330-19W following the start-'Up of the proposed combined cycle schem (180 KW) with the simultaneousshutdown and decommissioning of Units 1, 2 and 3 (187.5 KW).
5. TgC has completed a proforma environmental overview for this projectwhich has recently been forwarded to the Environment Department,- Government ofIndia (GOI? for review and approval. The major air emissions of concern ftomthe combined cycle plant are NOx. TEC proposes to design the plant such thatthe NOx concentration in the stack emissions wil2 not exceed 50 ppm, wellwithin the GOI and GO NOx standards. The 50 ppm concentration figures isalso within the Bank stack emissions limlt of 86 nanograms of NOx per joule ofheat input. TEC is in the process of completing plume dispersion modelling todetermine the optimum stack height for achieving necessary plume mixing tocomply with ambient NOx alr quality requirements of tho 1ISPCB end the Bankguidelines for 100 micrograms/ei3 . The option of using a single stack asopposed to the 2 stacks Lnitially proposed, is under finalization. The singlestack layout would Improve energy efficiency by about 3%.
6. With regard to water pollution concerns, the demineralUzed waterrequirements will be provided by Trombay's existing water treatment plant andany effluents from this plant are treated to acceptable levels prior todischarge. Cooling water will be taken from Trombay's existing coollng waterpump house and, after use, discharged Lnto the coolLng water discharge channelcurrently used by Tro Ibays existing unlts (Unlts 1-6). Nodellinn studles bythe Central Water and Power Research Station (CluES) in Pune, ax well as datafrom water quality monitoring programs, indLc*te that the existing coolingwater discharge is about 51C above ambient water temperature at the dischargepoint (a GOI, and GO and Bank requirement). For the proposed 180 KW combinedcycle plant, the steam turbine will be rated at 60W. . SLice 187.5 KW (3 x62.5 KU) will be decommLissioned on start-up of the combined cycle plant, therewill in fact be a reduction in cooling water requirements and hence in coolingwater discharges to the marlne environment.
Flue GasnDemuinuzation.
7. Currently Trombay's Unit 5 (500 KW) has a flue gas desulphurizatLon(FGD) system on one of the four flue gas streams from t1e boiler. Thissystem, which has been operating successfully for almos 2 yearsl is based onthe Seawater Process developed by A/S Norsk ViLfefabrlkk. The systemconsistently removed in excess of 854 of the SOx (approximately 6 TPD) fromthe flt e gas stream. I
70
Annex 3.9Page 3 of 3
8. In order to increase the use of coal as a primary fuel In Unit S andremain within the NSPCB daily SOx limit for the entire Trombay operation of 15TPD, an additional FGD module on the second flue gas stream from Unit 5'sboiler will be installed. The proposed FGD module will be identical to theexisting seawater based system, wit an SOx removal efficiency of 85%. TotalSOx removal when the two FGD modules are in operation will be approximately 12TPD. This will allow'TEC increased flexibility regarding the use of coal, thecheapest fuel, while eisuring Trombay's operation remain within KSPCB's SOxlimits.
9. The seawater effluent from the existing FGD system is treated to ensurethat the pH on discharge to the ocean is between 6 and 9 (a GOI, MON and Bankrequirement). With installation of the new PGD module, additional seawatertreatment capacity will be constructed, again to ensure that the pH of thedischarge is between 6 and 9.,
VNDIA
PRIVATE POR UTILIES PROECT ITATA ELECTRIC Cl6b°IUES
bon sol In GMGM 70_ 1 7 788 7 8 7 0 9 OM 001 194 1,0e 2 e4 L0 _TorXif DVfforonco, Re/h3 0.012 0.006 0.011 0.029 0.041 0.01 -0.178 0.212 -0.248 -0.257 -0.272Sonofit to conmrov No U -80 -4B -6 -214 -824 420 1520 1972 2874 25 24CneJloo to TECConumro -a -428 445 -1401 -9 406 2214 2 802 O8 -. ISProject Z (grooc) 80.40
oQ
., a .a~~~~~~~~~~~~~~~~~~~~~~~~~~
77 Annex 4.0Page 7 of 8
MAIN ASSUMPTIONS FOR THE FINANCIAL PROJECTIONS
Project Completion 'by 3/31/95. Startup from FY96, except for some generationfrom the CC unit on open cycle from FY95.
Sales Volume: Energy sold to BEST increasing at 4.3% pa; direct industrialcustomers at 2.5% pa; railways at 1.0% pa. Energy sold to BSES calculated asthe difference between its requirements, increasing at 8.5% pa, and its ownnet generation from the planned 500 MW station at Dahanu, starting in FY96.
TEC's Own Generation: Units 1-2-3, rated capacity 180 MW, to be relegated tostandby status only, with zero generation, from FY95 as the new CC unit comesin. Units 5 and 6 generating 3,000 GWh p.a. (68.5% load factor) plus theoff-peak energy consumed by the planned pumped storage units at Bhira fromFY96 and Bhivpuri from FY99. The Combined Cycle also operating at 68.5% LF.Sensitivity test done for 60% LF.
Purchased Power: The difference between sales and own generation is purchasedfrom MSEB.
Fuel Mix: Oil at 640,000 t pa; gas at 2.5 million m3/day in FY91 and FY92,declining to 2.0 in FY93 and FY94 and to 1.5 Mm3/d thereafter; the balance ofthe calorific requirement for the total generation provided by coal.
Fuel Prices increasing at 8% pa from the actual current level in the base case.Sensitivity tests done for 0 % and 13% pa increases.
MSEB's tariffs paid by TEC increasing at 10% pa from the level to which theywere just raised in May 1990 (the demand charge increased from 35 to 100Rs/kVA per month and the energy charge from 1.16 to 1.32 Rs/kWh). Sensitivitytests done for O and 13% pa increases together with fuel prices (if fuelcosts increase, tariffs will have to follow).
Other Operatina Costs, i.e. wages, maintenance etc., escalated at 8% p.a, inthe base case.
TEC's tariffs are calculated in accordance with the provisions of the Act.
Depreciation is taken at 3.6% p.a.
Interest at the actual rates per the respective loan agreements.
Exchange rate Rs/$: Consistent with the IBRD projections, the Rs is assumedto devalue vs. the $, 10% in each of FY91 and FY92 and 3.8% p.a. thereafter.Sensitivity test is done for devaluation remaining at 10% p.a. after FY92.
Reserves:
Contingency Reserve and Investment Allowance Reserve as providpd by theAct. The other special appropriations were allowed by the state ofMaharashtr4 ad hoc. The application of these reserves by TEC has not beenaudited by the State since 1984.
Debt Redemption Reserve is taken at the difference between depreciation andprincipal repayments due each year.
Annex 4.0
78 ' Page 8 of 8
Project Cost Reserve charged when it does not result in a tariff increasein the year charged, up to a cumulative amount of Rs 580 million sanctionedby the State.
Deferred Tax Reserve charged similarly at Rs 50 M each year. This is tocover the capital gains (arising from the different depreciation ratesunder the Act and for income tax) that shareholders would have to pay inthe event the State bought out TEC. The funds raised through this reservemust be Invested in specified Government securities.
Annex 5.0. Tab11 1
-IDIA
PRIVATE-PER UTLITIES PROJECT I
Economic Analysis
!estrn Region: A¢tlI and Projected PoEor and Enemy DOmand
-- Avormo AveroaoActuol Growth Projectod Growth
FY88 JYJkI P.D.)E!-- (P~~~~~~~revisional) (W p.o.)4( ..
1. LO (W)
!Gujo,O g/f 1,824 2,881 8.8 2,978 0,88 7.8
UDhAY Pradoh 1,10? 2,178 11.9 2,453 7,808 10.4
Maharaohtro y/ 2,290 4,890 7.8 6,208 18,006 8.7
Total ll 9.529 8.8 10o.07 268.70 8.8
Maximum Lood Ablo -_To So Mo 5,611 6,786 7.1 9,918 28,618 10.1
On Doto for FY829oefloot consumption rather than poser and mnoray demands. No date are ovallablo on tho oxtont ofunoet load or the amount of unserved energy.
f Actua- data for FY89 ore not yet avealable from CEA.c Including Dodro and toagr Novell.
Including Gea, Oman and Diu
Source: Thirteenth Electric Power Survey of India, CEA, December 1987, updated by CEA, April 1990, plus Bank estimates.
Annex 5.0. Table 2
INDIA
PRIVATE POWER UTILITIES PROECT I
Economic AmaIeis
Wootorn RoAton: EloctricitV Conoeumtion By Consumer CotoDory
ActuoI Avoragq Groth Projoctiono Avorago Growth
FT2 FYO0 112/f8| FY88 bl aL20ZX FY81420wh) (s5) {~(h) ( i 2- ()X(a) t% S ..
o/ DMfforomcoo sth figures for onorgy oval lobilIty In Tablo I refloct technicol ond non-tochnical loo1ss.F/ AoaI dto for FY99 aor not yt oval lablo frm CEA. '-3
&08: Thi rteonh Elsctric Powr Suroy of India, CEA, 0occ2bor 1987, updatod by CEA, April 990.
| v t YY .rba . f.U. fat> tig_ .Sr/_ -vlf .S wi vvi{ .W.J£f _ >> .X1:a _ZEr :Sx. sv_E w s _ _ _ _ ,__
81 Annex 5.0. Table 3
IUDIA
PRIVATE POUER UTILITIES PROJECT I
Least-Cost Analysis
I. Comparative Anallsis Of System CostWith Uhira And Alternatives
II. CoMPariSon Of Generation Cost From TrambgyWith Alternative Base Load Options
1. Trombay - Met Generation 1080 GlWh per annum
Re Per kWth Notes
a. Capacity Charge 0.23 Re 10,5901kW, 25-year lifetimeb. Fuel 0.52 0.207m 3 JkW, Rs 2.5l2Im3c. O&S 0.03 2.52 total capital costd. Transmission - None requirede. T&D Losses 0.01 12
Total 0.79
2. Load-Center Coal Station - Net Generation 1080 Glb per annum
Ru perklWh Notes
a. Capital Charge 0.41 Rs 19,4601W, 25-year lifetimeb. Fuel 0.37 0.59 kg/kWh, Ru 630 per tonnec. Oil Support 0.03 10 mlIkWlh, Rs 2.7 per litred. 0&11 0.07 As l(c)e. Transmission 0.02 52 station costf. TiD Losses 0.01 12
Total 0.91
3. Pit-Head Coal Station - Net Generation 1080 GO per anum
Rs per kWih Notes
a. Capital Charge 0.41 AS 2(a)b. Fuel 0.11 0.59 kglkWclh, Ru 190 per tonnec. Oil Support 0.03 As 2(c)d. OtW 0.07 As l(c)e. Transmission 0.12 302 station costf. TiD Losses 0.02 32
Total' 0.76
d . Annex S.0. Table 6
INDIA
PRIVATE POWE UTILITIES PROJECT- I
Program Analysis: Proaroam Coot. and Benefits
tRuoeJ MII on) (00) (Rugeoo Mi Mlon)TRANSMISSIONAN
GENERATION DISTRIBUTION IneremsenaI, ___________________ ___________ . Revonuo end
.1 / _ Cooti1sl CoZs Capitol Total Incrcentot Inerwento I Conoumr_ 3I Hydro OaN Fuel Cotot O0 Coost SuPnl3 Rovenues Surolus
The economic value of consumers' villingness-toepay for publicelectricity for irrigation is estimated as the electricity rate whichequates' the economic costs of diesel and electric irrigation pmping.
Estimated Costs of Diesel and Electric Pumpin
Electric Diesel
IMotor/Engine Size (H.P.) 5.0 a/ 7.0Pump Lifetime (years) 15.0 10.0Pump Capital Cost (Rs) 4,440 11,365Annual Charge (Rs) 652 2,011OUM Costs (Rs) I 1,017 2,857Costs of Diesel Fuel (Rs/br) b/ - 8.8Annual Diesel Costs (Us) 7,000Cost of Electricity (piiseikVh) XXX -
Annual Electricity Cost (Rs) 2,984(mX) C -
Total Annual Cost 1,699 + 2,984(XX) 11.868
Electricity rate at which electric and diesel pumping costs the seams
a/ 1 H.P. - 0.746 W.bJ Assuming an economic price of high speed diesel of Rs 3.5 per litre,
consumption of 2.5 litros per hour and operation for 800 hoursper year.,
c/ 2,984 - 5 xO0.746 x #09.
.~~~~~~~~~~~~~.
85
Annex 5.0, Table 6 (contd.)Page 2 of 3
INDIA
PRIVATE POWER UTILITIES PROJECT I
Estimation of Consumer Surplus
II. OTHER CONSUMERS
Consumers' willingness-to-pay for public electricity is related tothe additional financial costs that would be incurred through privatesupply. Correspondingly, the economic value of this willingness-to-pay isrelated to the economic costs of private supply, which are estimated below.
Estimsted Costs of Autoaen ration
~- Cost per kW of Capac ty (Rs)50 kW Machine 200-400 kWVMachine
a/ C.I.F. price, plus handling and installation.bI Assuming a 15-year life and 12? discount rate.N (tAssuming an ecouoi cost of high speed diesel of Re 3.5 per litre
-, id m specific of 0.4 lItre 4r-kWh and 0,32 litre per kWhrespecti-ieiy in the 50 kV--and Z0O-4G- kV iischines. _ -
-1 CE's estimate of the average load factor of p¶ivate gener4tors.
II| y .( ) I86
Annek 5.0, Table 6 (contd.)Page 3 of 3
INDIA
PRIVATE&POWER UTILITIES PROJECT I
Estimation of Consumer Surplus
III. AVERAGE RATE OF CONSUNER SURPLtiS
To the economic value of the average tariff rates for eachconsumer category has been added half the additional economic costs ofprivate supply. This conservatively assumes that the price elasticity ofdemand is unit', i.e. that demand would-cont7ract in proportion to theadd4itional cost of private- supply., In practice, price elasticit.es at lowlevels of electricity consumption usually are well below unity, Implyingthat more than half of consumers would pay the additional costs of privatesuppiy. Rates of surplus for each consumer category have been wvightedinto an overall average using expected consumption shares.
-Analysis has focussed on the FY91 to F~'2000 time-slice ofinvestments, including only those projects that would be' Azplementedfully dur4ng the period. Construction periods-assumed are:coal-fired stations -5 years; hydro stations.- 8 years; andgas-fired stations -3 years.
-Station capital cost~s (in economic terms and January 1990 prices)are estimated to be: coal stations - Rse 13.146 million/I(W (bated onTalcher); hydro stations R s 10.365 million?II (based on NathpaJhakri); and gas stations -Rs 6.0 million/MW (based on Trombay).
-Associated transmission and distribution investments assumed to beequivalent to 602 investments in generation.
-Annual operating ~nd maintenance costs are assumed,ast coal-f ired_anmd gas-fir-ed stations - 2.5? of station capital costs; hydrostations - tl? of station capital costs; -ad trmnsmission\anddistribution - 1? of capital costs.
-Average fuel'consumptions of new stations are assumed as:coal stations - 0.61 kg/kWh of coal and- 10 mlIkWh of oil; and gasstations - 0.23 m3IkWh (an average of open-cycle and combined-cycleconsumption rates).
-Economic fuel costs are assumed as:'coal - Rs 360 per tonne (anaverage of costs at pithead and load center stations); oil - Rs 2.7Per litre;, and gap - Rs 2,2C0P per thousand in3 . For pumped-storageprojects, fuel costs-are based on coal at Rs 520 per tonne (the costat a load center station).
-Annual *eneration by new stations is assumed asi,coal - 1,000 hrs infirst yeaLr, 3,500 hrs in second year, and 6,150 hrs per y4arthereafter; gas - 6,000 hr. per year; hydro - 2,600 hr. per,year,and pumiped-storage (excludiug Bhira) 1,2200 hrs per year.
Consumption by station auxiliary equipment is assumed as': coal - lOZ.of gross generation;, gas - 2? of gross generation; an\d hydro - 12.
-Transmission .mnd'\ distribution losses are assumed as 20? in FY90K ~declining to 15? by FY2000.
90
P T PE UILITIES PRJECT I
Doguments in ProMect File
*1. Feasibility Report for Gas Turbine Combined Cycle Power Plant, TataConsultvng Engineers, Bangalore, November 1988.
2. Feasibility Report - 180 MW Combined Cycle Power Plant at TrombayThermal Generating Station, Tata Consulting Engineers, Bangalore,December 1989.


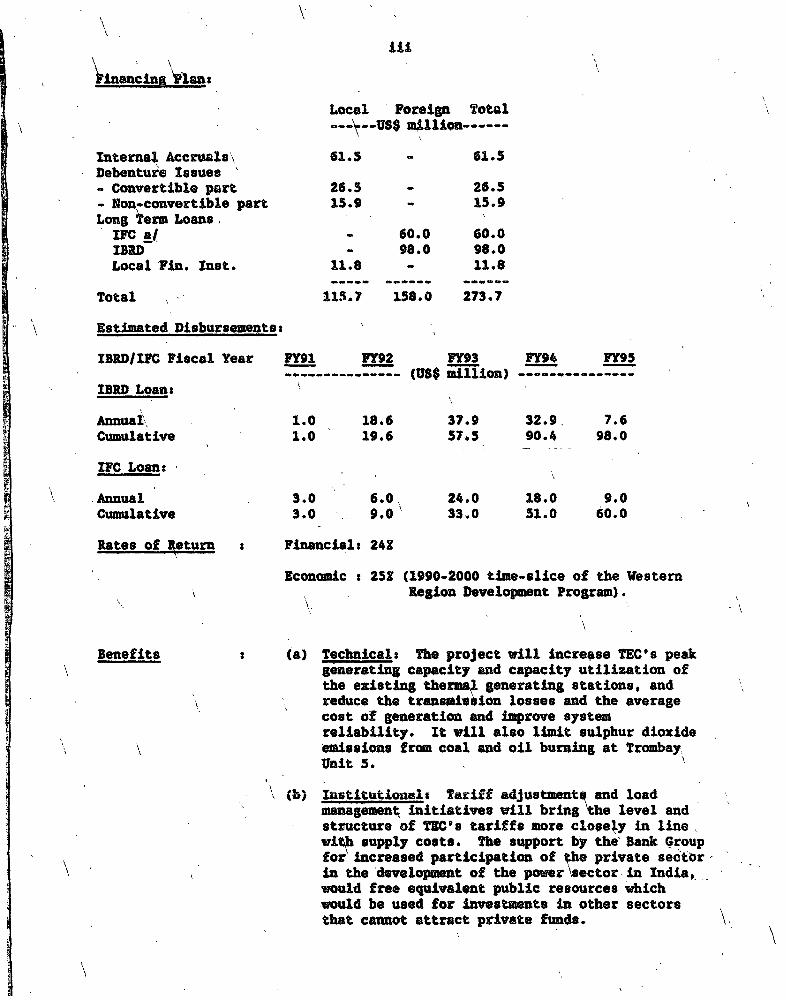


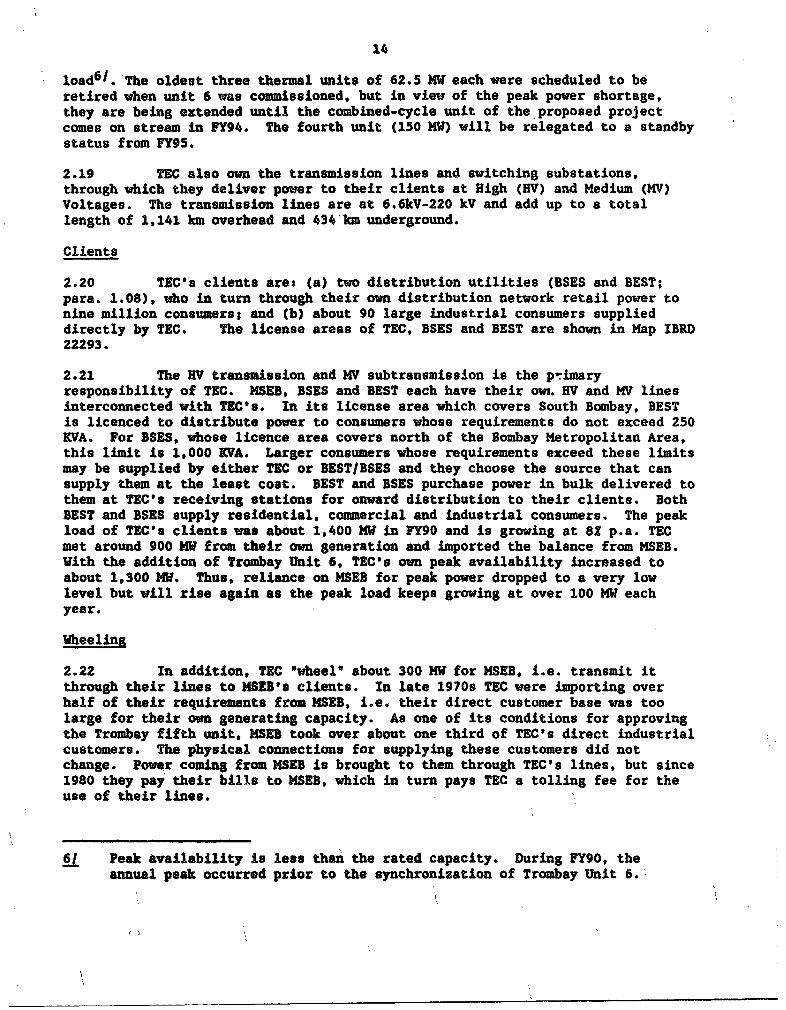


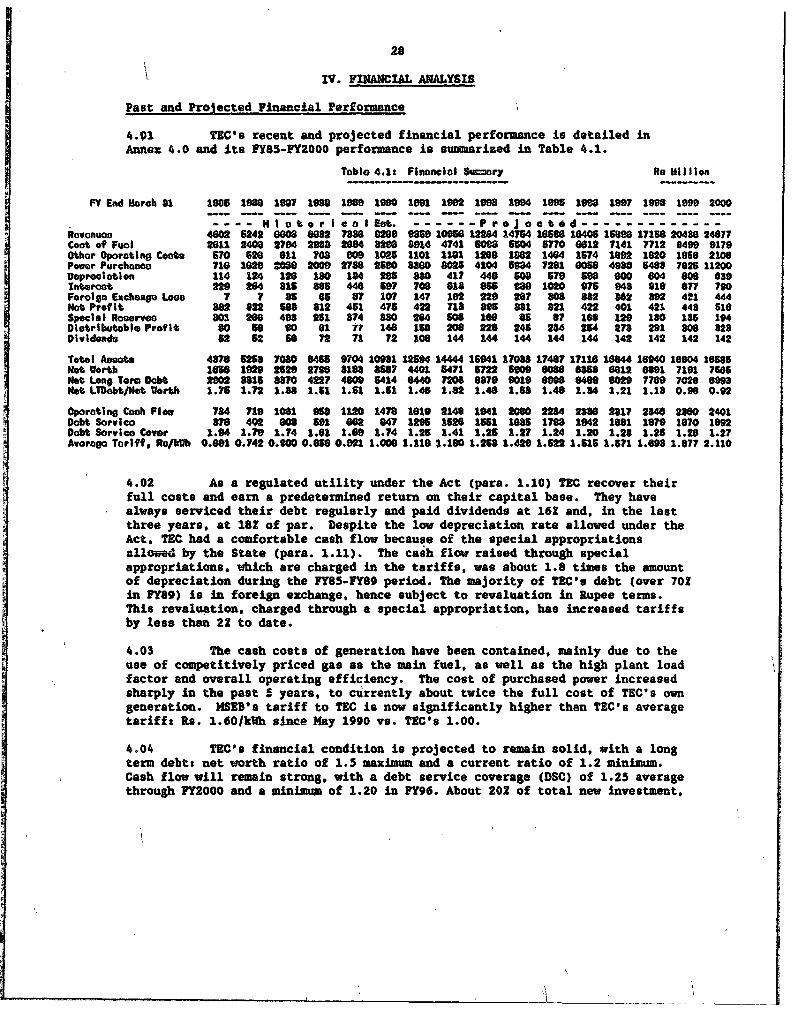


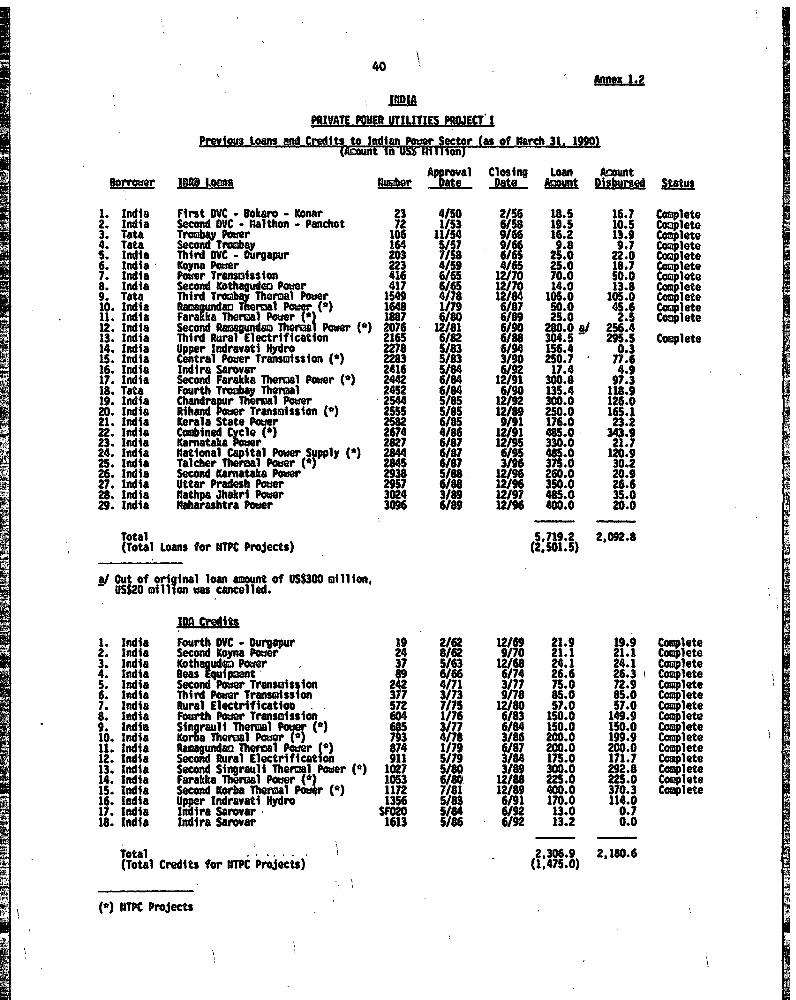


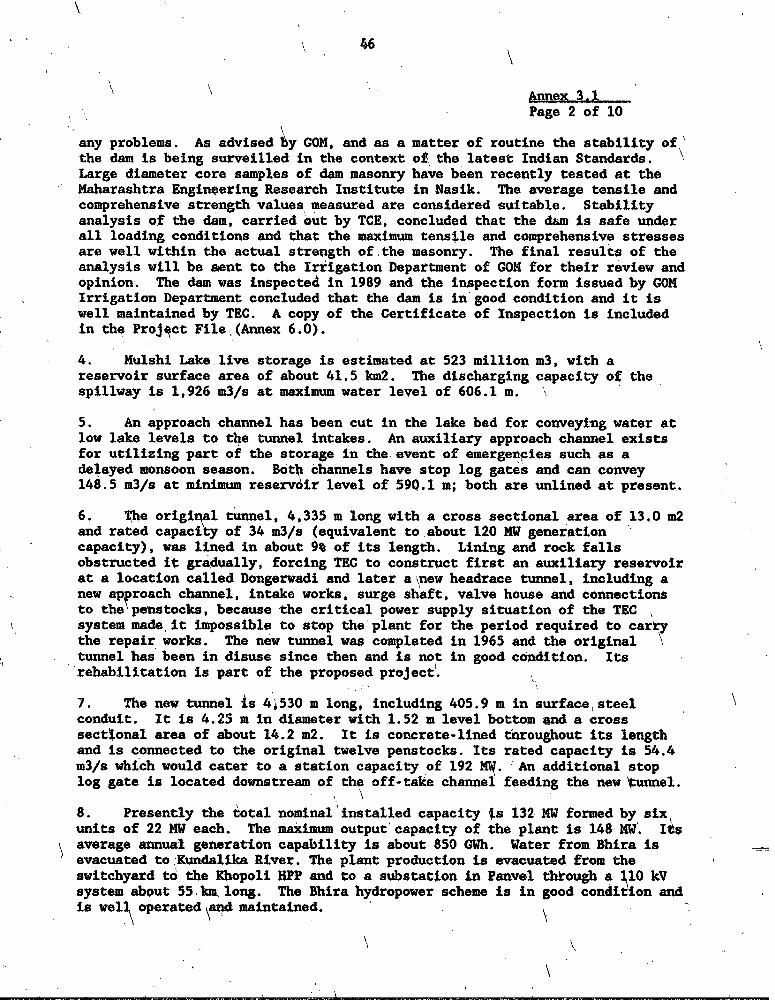


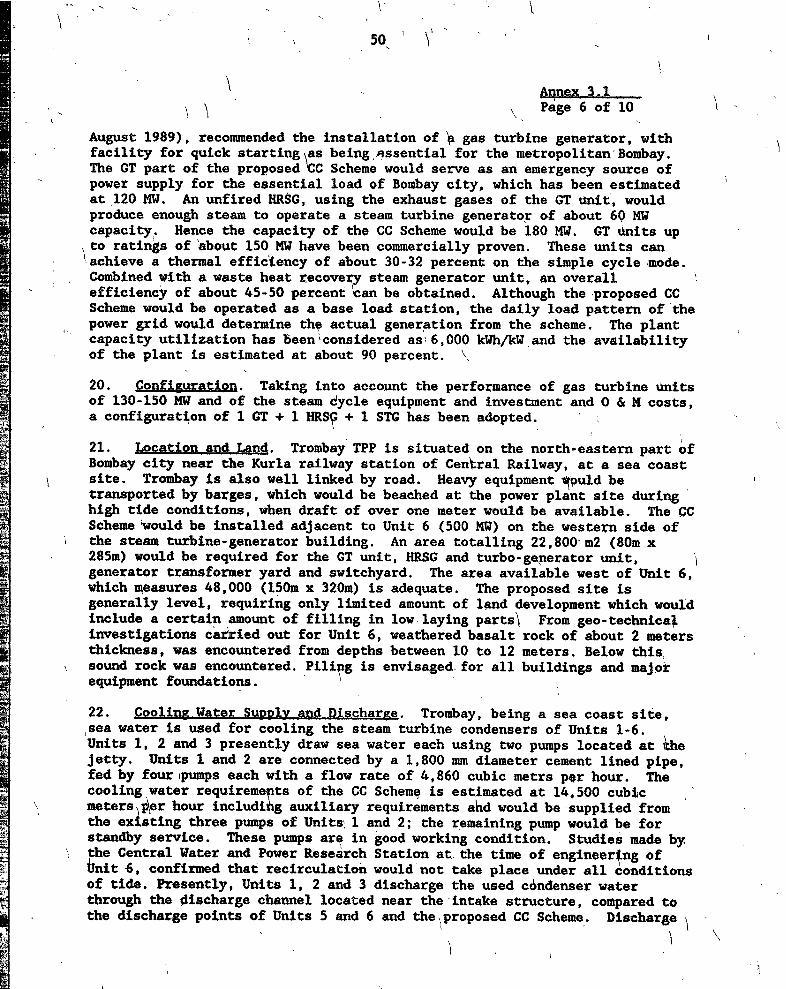


![Accumulo Summit 2015: Using Fluo to incrementally process data in Accumulo [API]](https://static.documents.pub/doc/80x56/55a5e4af1a28ab28368b480e/accumulo-summit-2015-using-fluo-to-incrementally-process-data-in-accumulo-api.jpg)


