PRACTICAL GUIDELINES for Analyzing Public Expenditure at the Sub-National Level Workshop edition Public Disclosure Authorized Public Disclosure Authorized Public Disclosure Authorized Public Disclosure Authorized Public Disclosure Authorized Public Disclosure Authorized Public Disclosure Authorized Public Disclosure Authorized Public Disclosure Authorized Public Disclosure Authorized
Transcript
PRACTICAL GUIDELINESfor
Analyzing Public Expenditureat the Sub-National Level
Workshop edition
Pub
lic D
iscl
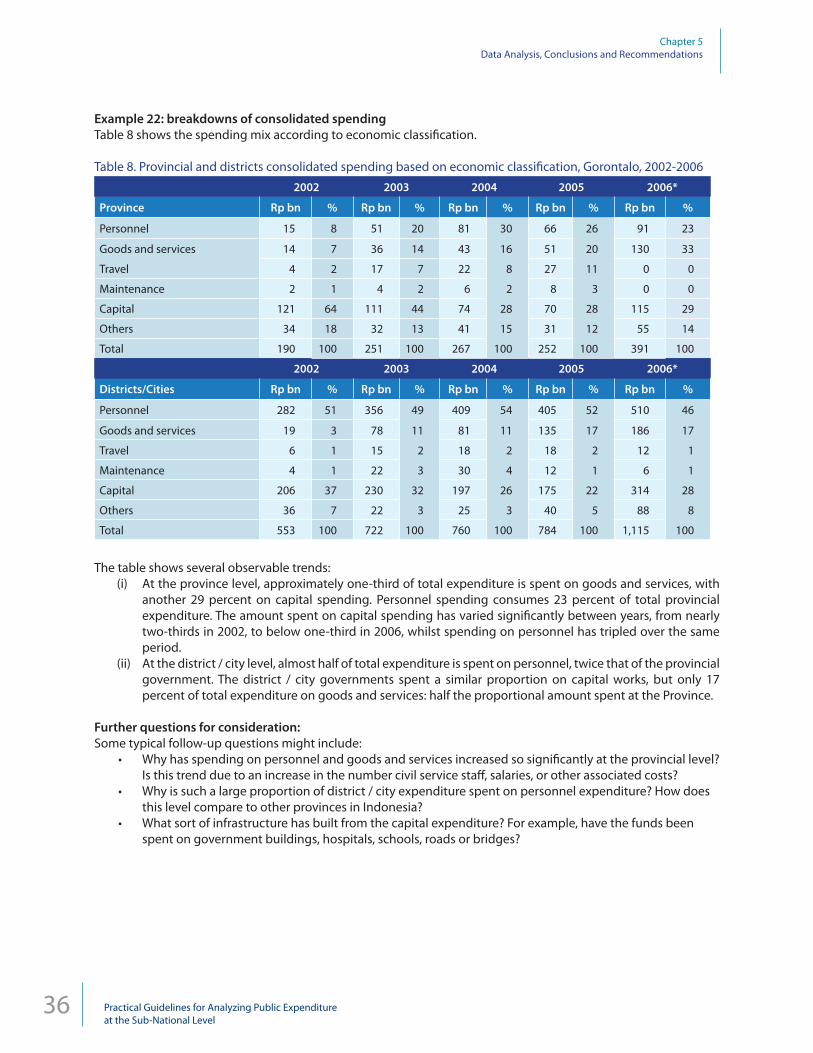
osur
e A
utho
rized
Pub
lic D
iscl
osur
e A
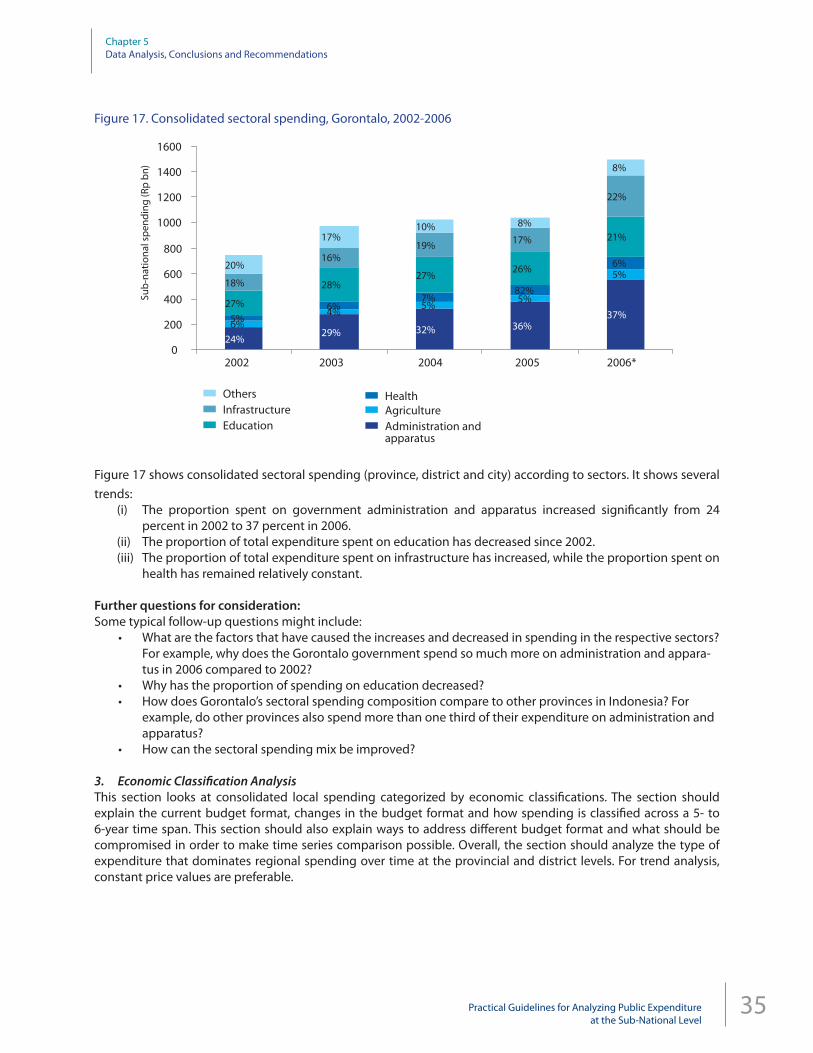
utho
rized
Pub
lic D
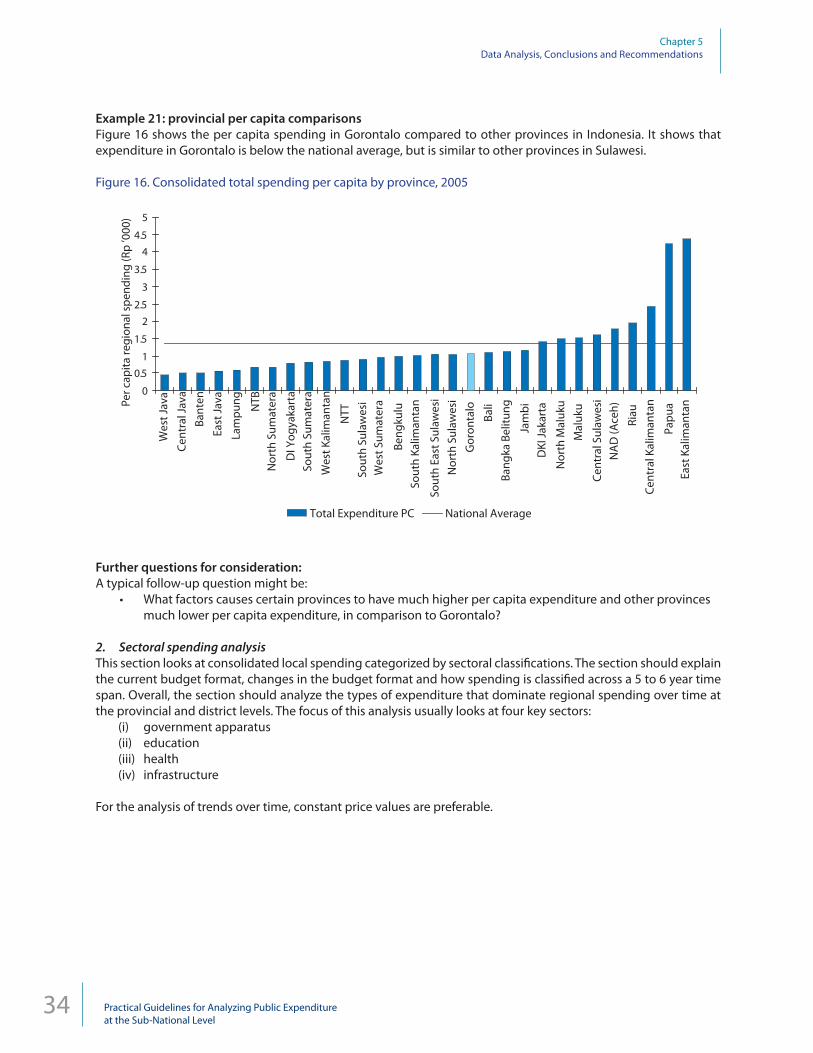
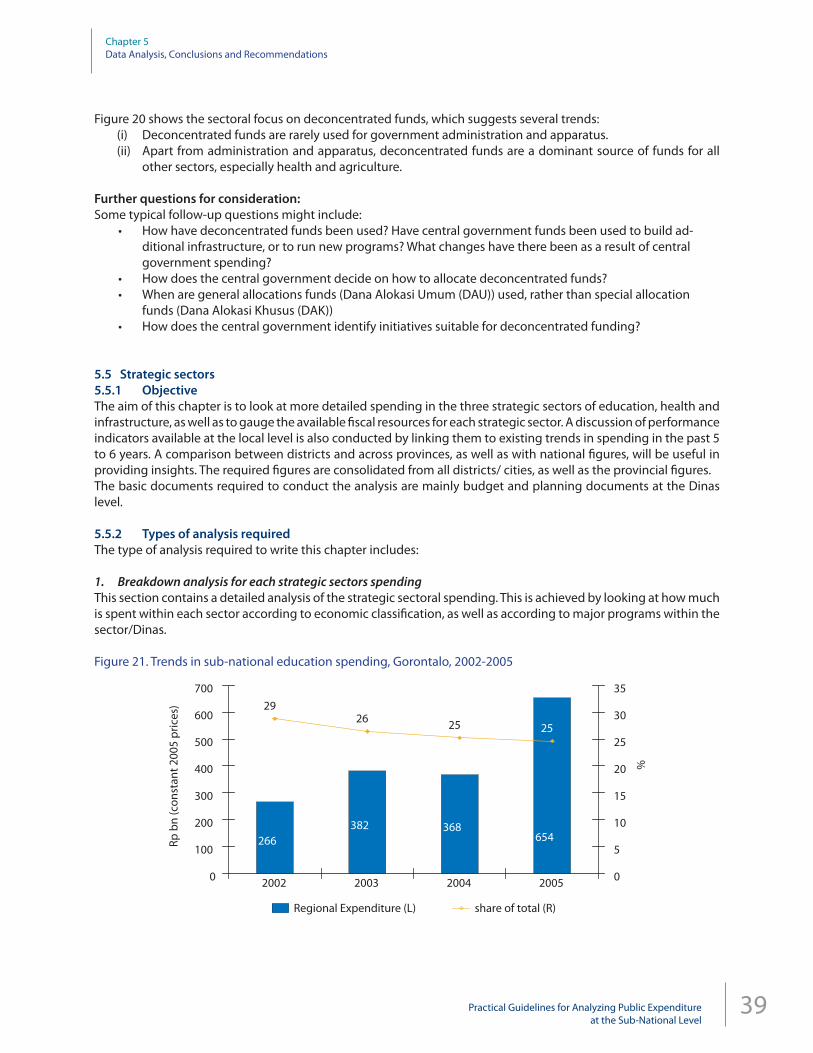
iscl
osur
e A
utho
rized
Pub
lic D
iscl
osur
e A
utho
rized
Pub
lic D
iscl
osur
e A
utho
rized
Pub
lic D
iscl
osur
e A
utho
rized
Pub
lic D
iscl
osur
e A
utho
rized
Pub
lic D
iscl
osur
e A
utho
rized
Pub
lic D
iscl
osur
e A
utho
rized
Pub
lic D
iscl
osur
e A
utho
rized
wb20439
Typewritten Text
wb20439
Typewritten Text
wb20439
Typewritten Text
wb20439
Typewritten Text
49691
The WORLD BANK OFFICE JAKARTAIndonesia Stock Exchange Building, Tower II/12-13th Fl.Jl. Jend. Sudirman Kav. 52-53Jakarta 12910Tel: (6221) 5299-3000Fax: (6221) 5299-3111
The WORLD BANKThe World Bank1818 H Street N.W.Washington, D.C. 20433 USATel: (202) 458-1876Fax: (202) 522-1557/1560Email : [email protected] : www.worldbank.org
Printed in May 2010
Table of Contents
Glossary of Terms iiChapter 1. Introducing Public Expenditure Analysis 11.1 What is Public Expenditure Analysis (PEA)? 11.2 Why is the PEA useful? 11.3 Who will use the PEA? 21.4 What is included in the PEA? 2
Chapter 2. Doing a Public Expenditure Analysis 52.1 Writing the research proposal 52.2 Collecting the data 52.3 Entering the data into a formal that is useful for analysis 62.4 Analyzing the data, formulating conclusions and recommendations 62.5 Writing the report 6
Chapter 3. Research Proposal 7
Chapter 4. Data Collection and Preparation for Analysis 94.1 Collecting data 94.2 Preparing the data for analysis 10
Chapter 5. Data Analysis, Conclusions and Recommendations 135.1 Overview chapter 135.2 Planning and budgeting chapter 205.3 Revenue chapter 215.4 Expenditure chapter 325.5 Strategic sectors 39
Chapter 6. Writing the PEA Report 436.1 Know your audience 436.2 Common mistakes in report writing 436.3 Consistent format, clear structure 446.4 Writing the PEA report as a team 456.5 Further references 456.6 Extra tips : some lessons learned 45
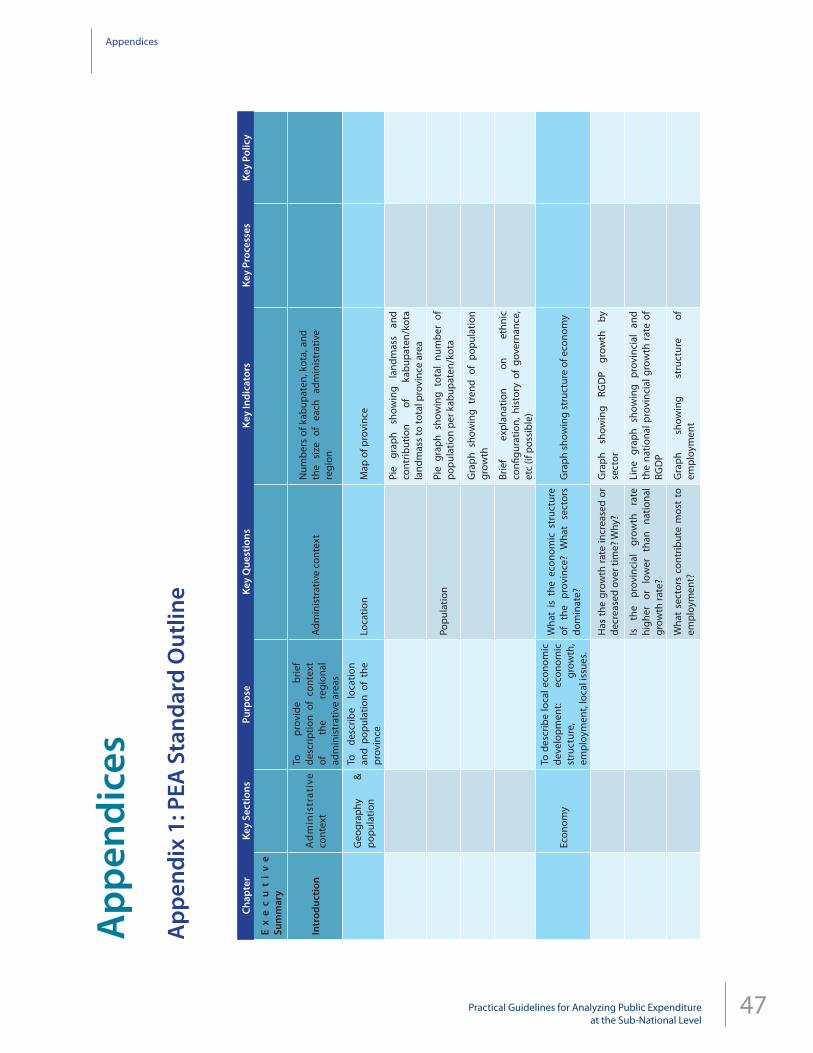
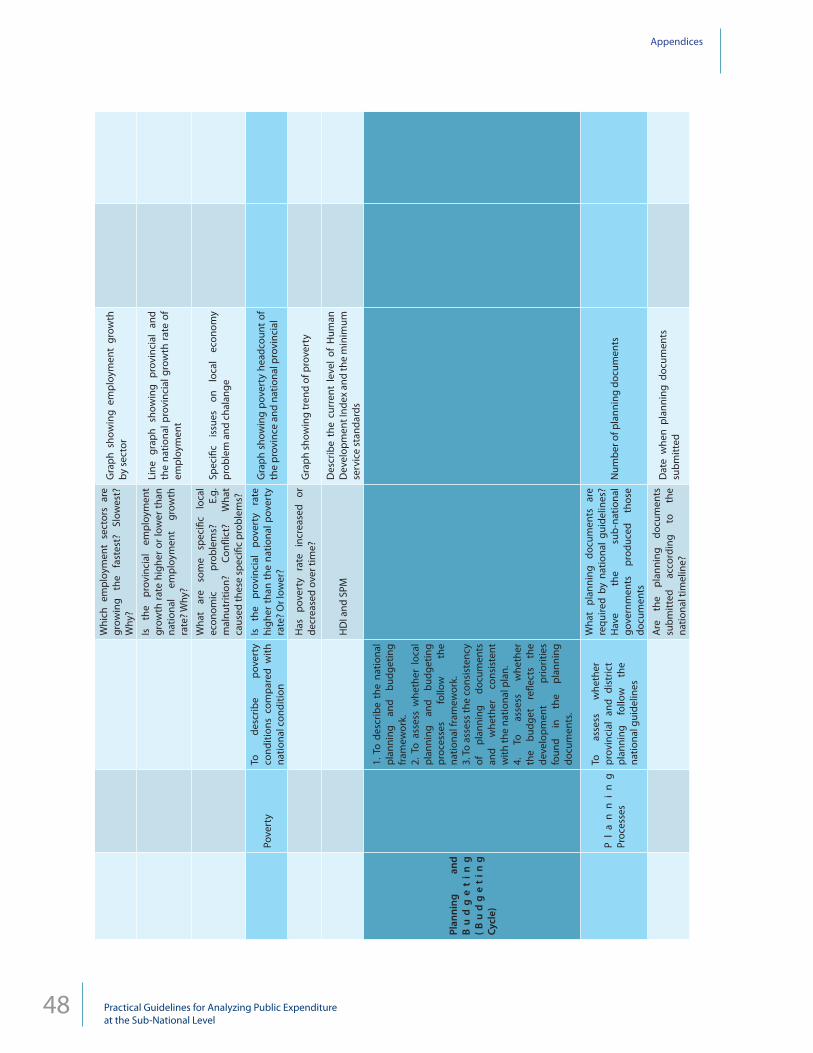
APPENDICESAppendix 1: PEA Standard Outline 47Appendix 2: Data Requirements 65
ii Practical Guidelines for Analyzing Public Expenditureat the Sub-National Level
Glossary
APBD Regional Government Budget (Anggaran Pendapatan dan Belanja Daerah)APBN State Budget (Anggaran Pendapatan Belanja Nasional) Bappeda Regional Development Planning Agency (Badan Perencanaan Pembangunan Daerah)Bappenas National Development Planning Agency (Badan Perencanaan Pembangunan Nasional)Bawasda Regional Monitoring Agency (Badan Pengawasan Daerah)
BKD Regional Civil Service Agency (Badan Kepegawaian Daerah)BKN State Civil Service Agency (Badan Kepegawaian Negara) BMT Budget Master Table BPHTB Land and building transfer fee (Bea Perolehan Hak atas Tanah dan Bangunan)BPS Central Bureau of Statistics (Badan Pusat Statistik) BPS-SK Financial statistics from Central Bureau of Statistics (Statistik Keuangan Badan Pusat Statistik)Bupati District Head CPI Consumer Price IndexCSO Civil Society Organization DAK Special Allocation Fund (Dana Alokasi Khusus)D&L Damage and LossDAU General Allocation Fund (Dana Alokasi Umum)Desa VillageDinas Local Technical Agency OfficeDPRD Provincial House of Representatives (regional parliament) (Dewan Perwakilan Rakyat Daerah)GDP Gross Domestic ProductGER Gross Enrollment RateGoI Government of IndonesiaGRDP Gross Regional Domestic ProductHDI Human Development IndexKabupaten District (regency)Kecamatan SubdistrictKelurahan Urban villageKepmen Ministerial Decree (Keputusan Menteri)Keppres Presidential Decision (Keputusan Presiden)Km KilometerKota City (urban district)LG Local GovernmentMDG Millennium Development GoalMoF Ministry of FinanceMoHA Ministry of Home AffairsMoNE Ministry of National EducationMSS Minimum Service StandardNGO Non-Governmental OrganizationNR Natural Resources O&M Operations and MaintenancePAD Own-Source Revenue (Pendapatan Asli Daerah)PBB Land and Building Tax (Pajak Bumi dan Bangunan)PDAM Local Water Supply Utility (Perusahaan Daerah Air Minum)Perpu Regulation in Lieu of Law (Peraturan Pemerintah Penggati Undang-Undang)Perda Regional Regulation (Peraturan Daerah)
iiiPractical Guidelines for Analyzing Public Expenditureat the Sub-National Level
PFM Public Financial Management Podes BPS Village Potential Survey (Potensi Desa)Polindes Village Maternity Center (Pos Persalinan Desa)Puskesmas Community Health Center at Sub-district Level (Pusat Kesehatan Masyarakat)Posyandu Integrated Health Service Unit (Pusat Pelayanan Terpadu)Pustu Sub-community Health Center (Puskesmas Pembantu)Regional Budget Consolidated Budget consisting of Central Government Budget (Deconcentrated), Provincial Budget and District Budget.Renstra Ministry/Agency Medium-Term Strategic Plan (Rencana Strategis) RGDP Regional GDPRKPD Regional Government Work Plan (Rencana Kerja Pemerintah Daerah)RPJMD Regional Medium-Term Development Plan (rencana Pembangunan Jangka Menengah Daerah) Sakernas Labor Force Survey (Survei Tenaga Kerja Nasional) SDO Subsidy for Autonomous Region (Subsidi untuk Daerah Otonom)SIKD Regional Finance Information System (Sistem Informasi Keuangan Daerah)SKPD Regional Government’s Working Unit (Satuan Kerja Pemerintah Daerah)SME Small/Medium EnterpriseSTR Student Teacher RatioSub-National Budget Consolidated Budget consisting of Provincial and District Budgets, but excluding Central Government.Susenas BPS National Socio-Economic Survey (Survei Sosial Ekonomi Nasional)TKD Regional Performance Bonus (Tunjangan Kinerja Daerah)WB World Bank
1Practical Guidelines for Analyzing Public Expenditureat the Sub-National Level
Chapter 1Introducing Public Expenditure Analysis
Chapter 1Introducing Public Expenditure Analysis
1.1 What is Public Expenditure Analysis (PEA)Public expenditure analysis (or PEA) is a method of analyzing how governments allocate and manage their financial resources. The purpose of doing the analysis is to provide recommendations on how governments can manage public finances more efficiently and effectively in the future.
1.2 Why is the PEA useful?All governments have limited resources. This means there is a need to carefully decide how those financial resources will be allocated in order to achieve the maximum public benefits. However, in order to make these decisions, governments need accurate and timely information and analysis in order to answer key questions, such as:
1. How much money does the government have to spend? Where does the revenue come from? What is the potential, if any, for increasing the government’s financing envelope?
2. What has the government spent its resources on previously?3. What sort of public services have been provided with the current budget? Which sectors have good
service provision and which sectors need improvement?4. Who are the main beneficiaries of government spending? For example, is it the rich or the poor? Women
or men? Rural or urban areas? Are the benefits spread evenly? Do the beneficiaries have equal access to services? Are there disadvantaged strata of the population who need special attention?
5. Have the services provided resulted in better human development outcomes for the population? For instance, have literacy rates, education levels, morbidity rates, life expectancy etc. improved?
6. How effective is the current planning and budgeting framework and process? Is the budget approved on time? Are the funds available in a timely manner? Are the planning priorities reflected in the budget?
7. What is the capacity of the civil service in public financial management? Are there areas that could be improved? If so, through what means could improvements be made?
The answers to questions such as these will help governments to identify priorities that need to be tackled through government spending and help them make informed decisions on how best to allocate funds.
1.3 Who will use the PEA?Many widely differing groups of people will find PEA of use:
Local Government (executive branch)The executive branch of the government, as the party responsible for initially setting the development priorities and allocating budget to meet development objectives, can use the analysis to help it in the allocating process. If
2 Practical Guidelines for Analyzing Public Expenditureat the Sub-National Level
Chapter 1Introducing Public Expenditure Analysis
the PEA is conducted on a regular basis (e.g. annually or every two years), it can also be used as a monitoring tool to evaluate whether development targets have been met. The PEA report also identifies capacity development needs, providing a platform for various programs to support local governments.
Local Government (legislative branch)The legislature is responsible for approving both the medium-term expenditure plan (RPJMD) and the budget (APBD). Therefore, it needs analysis to help in the evaluation of the submitted budget, especially to establish whether it is in accordance with the development objectives and priorities identified in the RPJMD. The PEA can also serve as a monitoring tool for the legislature in evaluating the performance of the executive. .
Central GovernmentThe PEA report provides a foundation for the central government (GoI) to observe how local governments have spent their money and the extent to which local governments have implemented regulations and followed guidelines laid down in the regional finance and autonomy sectors.
LobbyistsIndividuals and organizations (for example, CBOs and CSOs) with specific interests and advocacy aims can use the PEA to help them in their advocacy and lobbying work. Advocacy policies are developed based on sound analytical work and the PEA serve as one source for this analytical work.
Researchers and AcademicsResearchers can also use the PEA methodology as a framework for their own research. It is a method for analyzing how governments allocate their resources and can supplement their existing research. PEA reports can also be used as an information source for researchers and students interested in sub-national public finance issues.
Other Donors and Local Government ProgramsOther donors and local government programs can use the capacity development needs identified in the PEA report as a basis to assist them in developing their own programs.
Private SectorEntities from the private sector already with investments, or interested in investing in a certain province or kabupaten/kota, can use the PEA to increase their knowledge of the locality. The PEA is a source of general information on economic structure, sources of revenue, the local government’s spending priorities, and public service delivery successes and challenges. The PEA also reflects local government’s capacity, as well as the level of transparency in its activities.
PublicPublishing a PEA is one important way for governments to be transparent with regard to their use of public resources. A PEA presents financial information compiled from long and often complex budget documents in a format that is far easy to understand. Furthermore, a PEA contains a clear analysis of spending trends that the public can then use to hold politicians and governments accountable for their promises and responsibilities.
1.4 What is included in the PEA?PEA is a dynamic methodology that should be regularly revised to meet the needs of the users (section 1.3). However, as a minimum, any PEA should include all of the following:
Chapter 1: OverviewThis chapter should introduce the reader to the geographic area researched. It should include information about its history, geography, population, government structure, economic structure and trends on important macroeconomic indicators, such as poverty level, growth rate, employment levels, human development index (HDI) and minimum service standards (MSS).
3Practical Guidelines for Analyzing Public Expenditureat the Sub-National Level
Chapter 1Introducing Public Expenditure Analysis
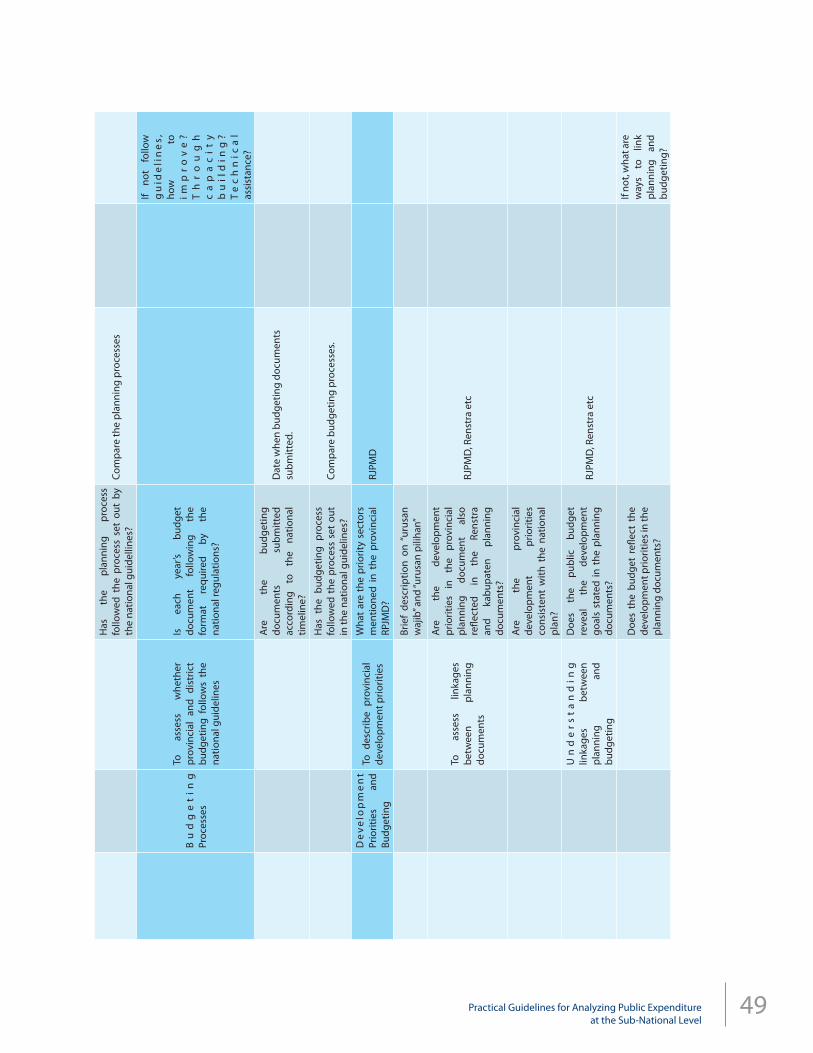
Chapter 2: Planning and BudgetingThis chapter should provide the reader with an overview of the planning and budgeting process at the national level and how the regional level contributes to the national framework. The analysis should include analysis on whether the sub-national government is following the national framework. Furthermore, the chapter should establish the level of consistency between planning documents (RPJMD, Renstra, RKPD etc) and whether the priorities set in those planning documents are reflected in the budget.
Chapter 3: Revenue The purpose of this chapter is to provide a comprehensive picture of revenue at the sub-national level. This includes calculating the total revenue envelope, including an analysis of revenue-source trends. For example, does the sub-national government derive its revenue predominantly from own-sourced revenue (PAD) or transfers from central government? This chapter also includes calculations of the deficits and surpluses of the sub-national government, and its financing policy. Finally, this chapter includes analysis of how the sub-national government records its revenue and financing, and whether there are discrepancies.
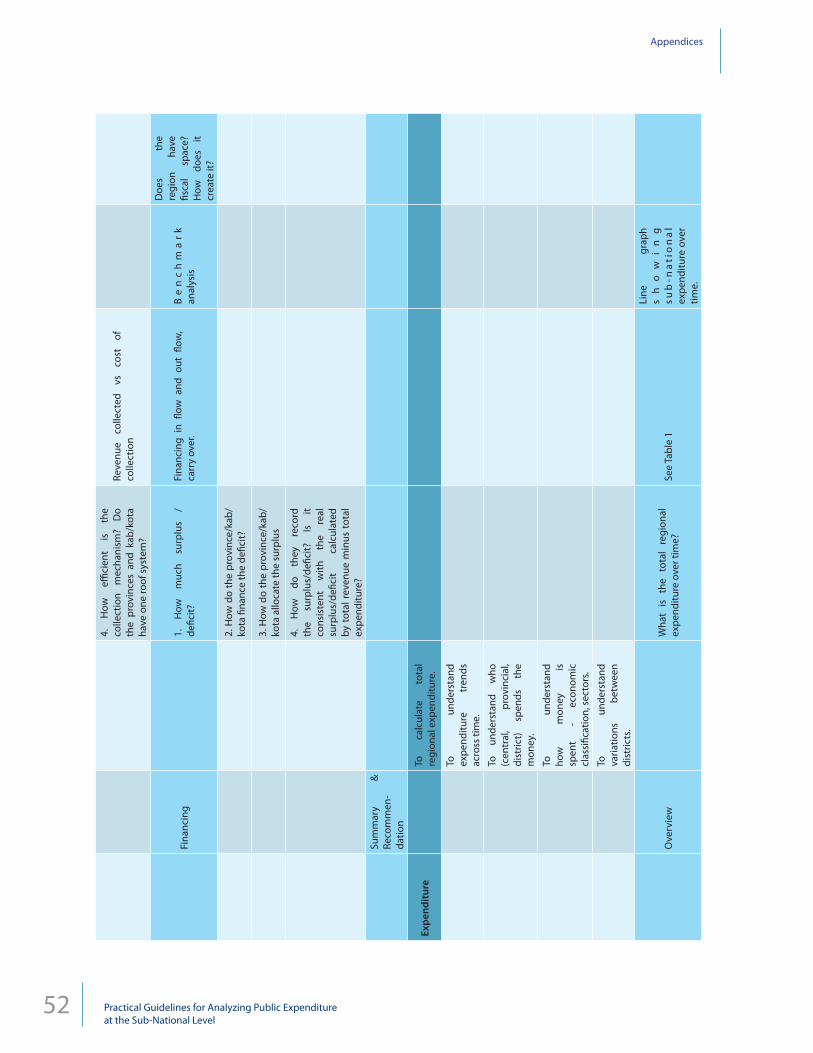
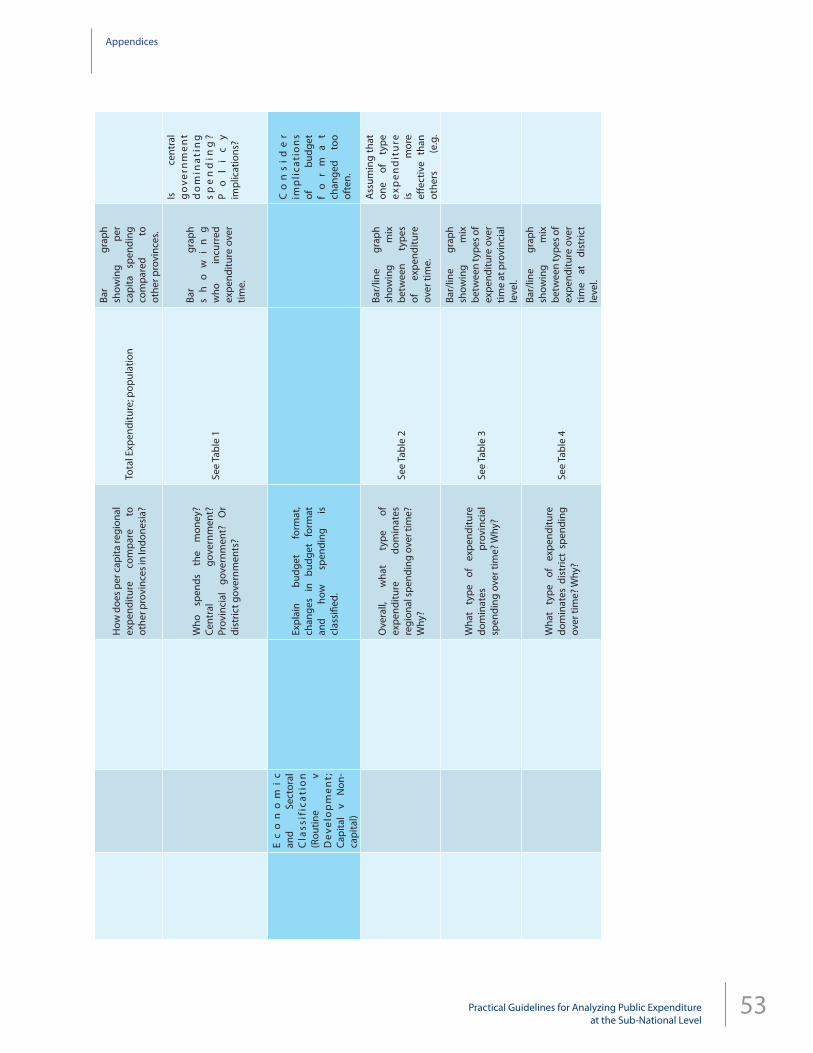
Chapter 4: Expenditure The purpose of this chapter is to provide a comprehensive picture of expenditure at the sub-national level. This includes calculating total expenditure and analyzing spending trends across time, sector, economic classification and by which level of government (province, kabupaten/kota or central governments). This chapter also looks at ability of the sub-government to absorb its budget by analyzing realization rates. The purpose of this chapter is to provide recommendations on how governments can improve the effectiveness and efficiency of public spending.
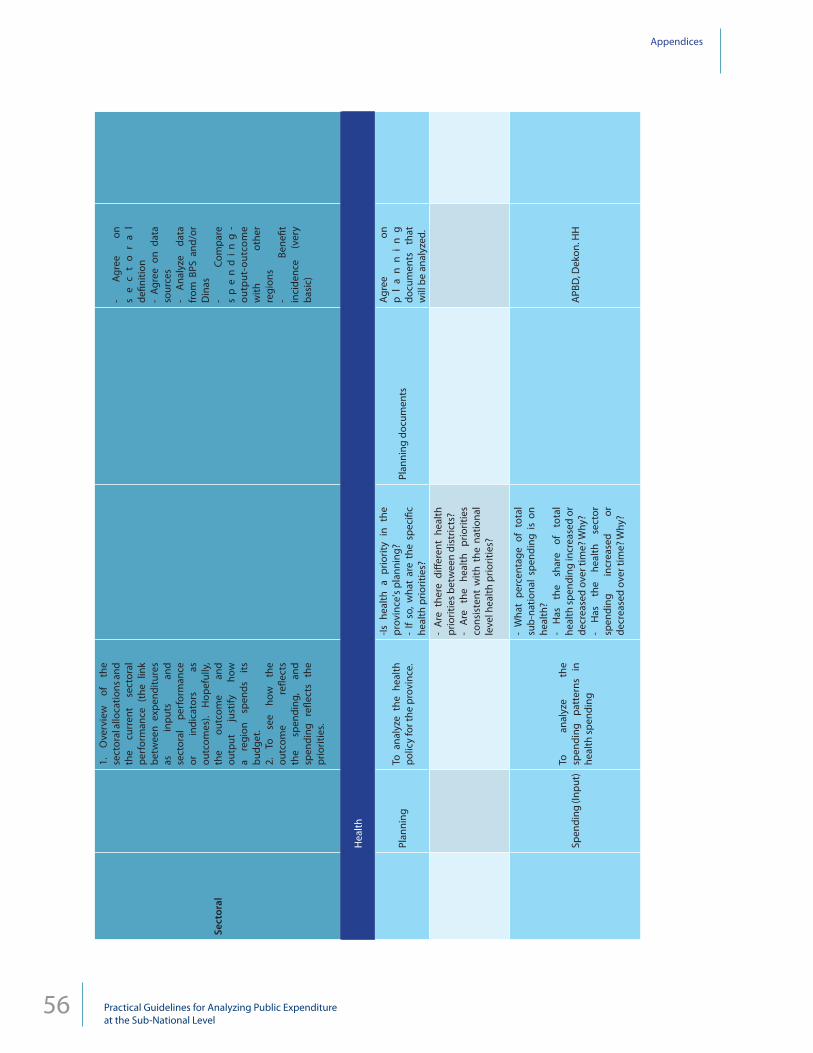
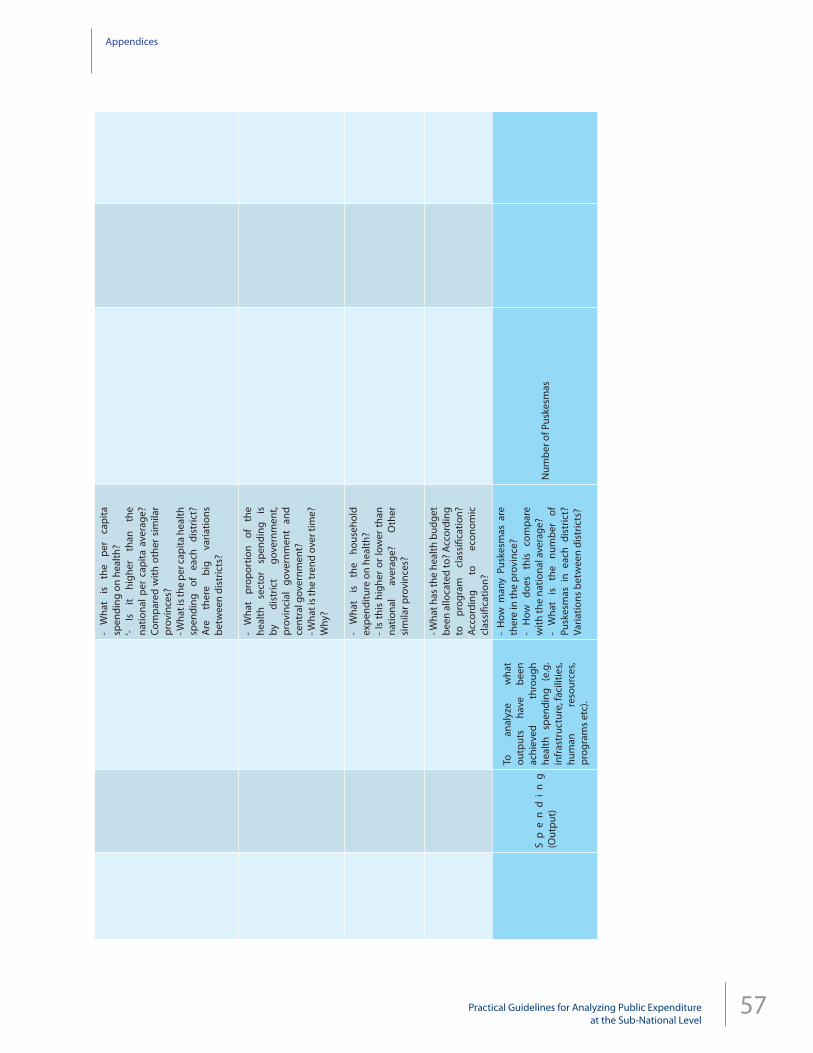
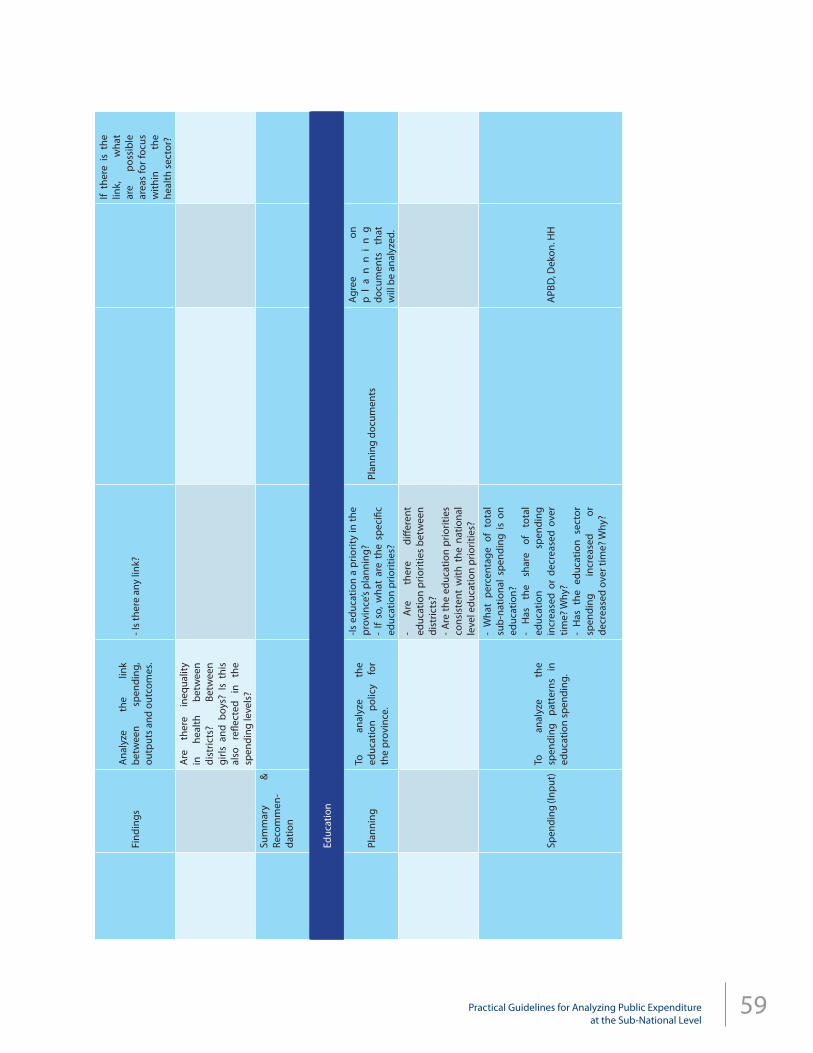
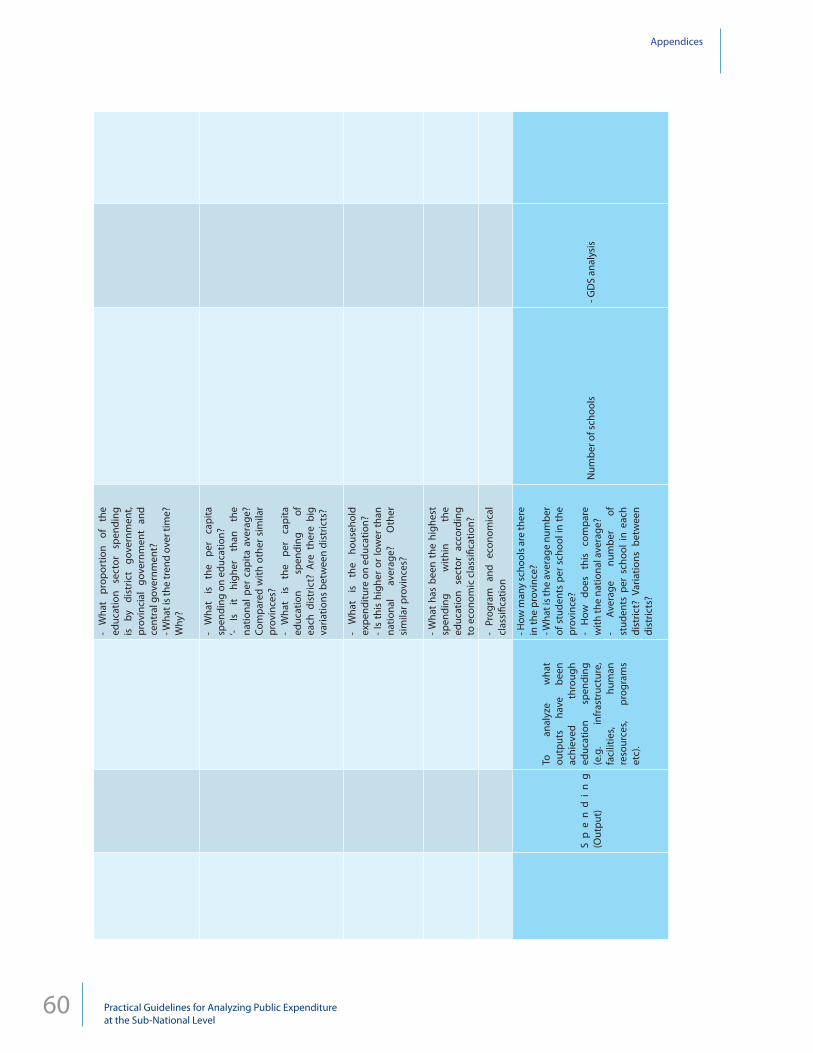
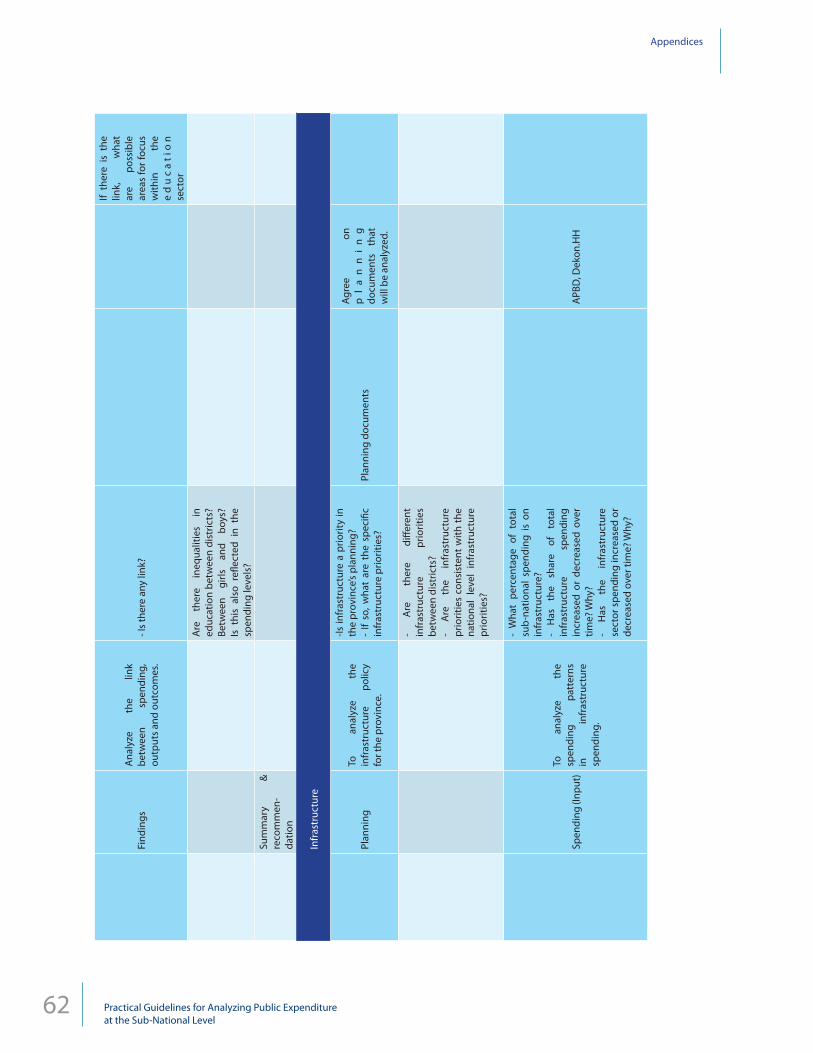
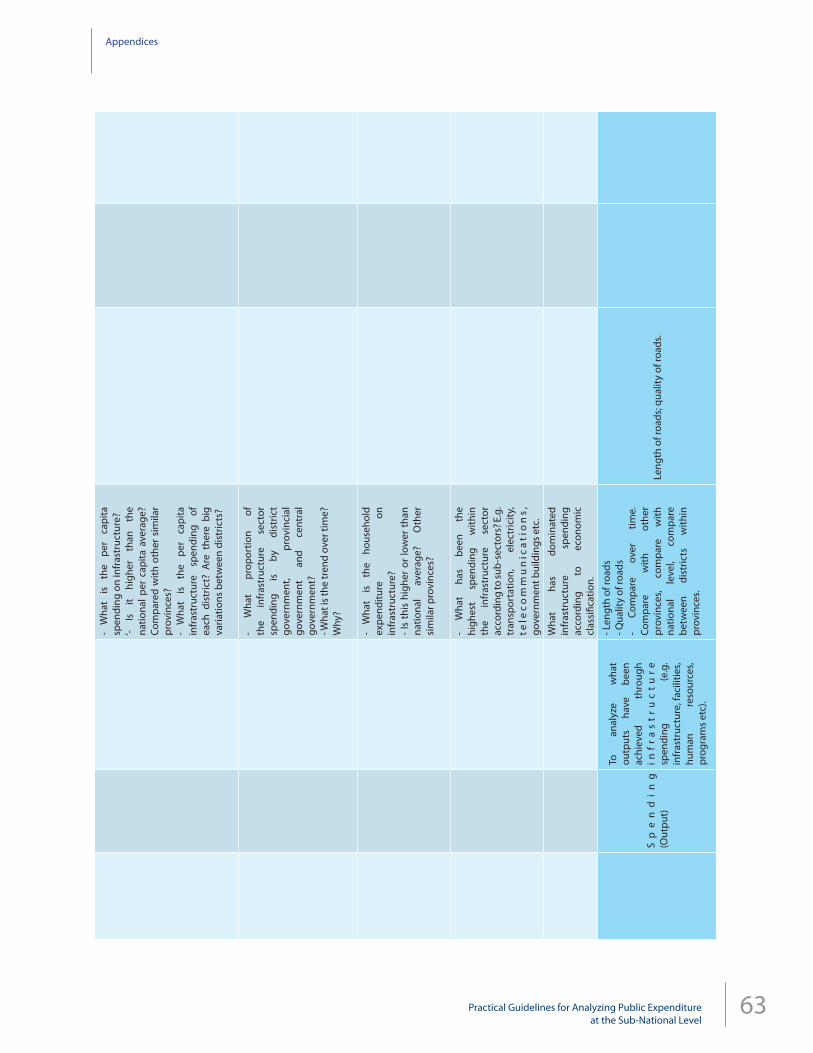
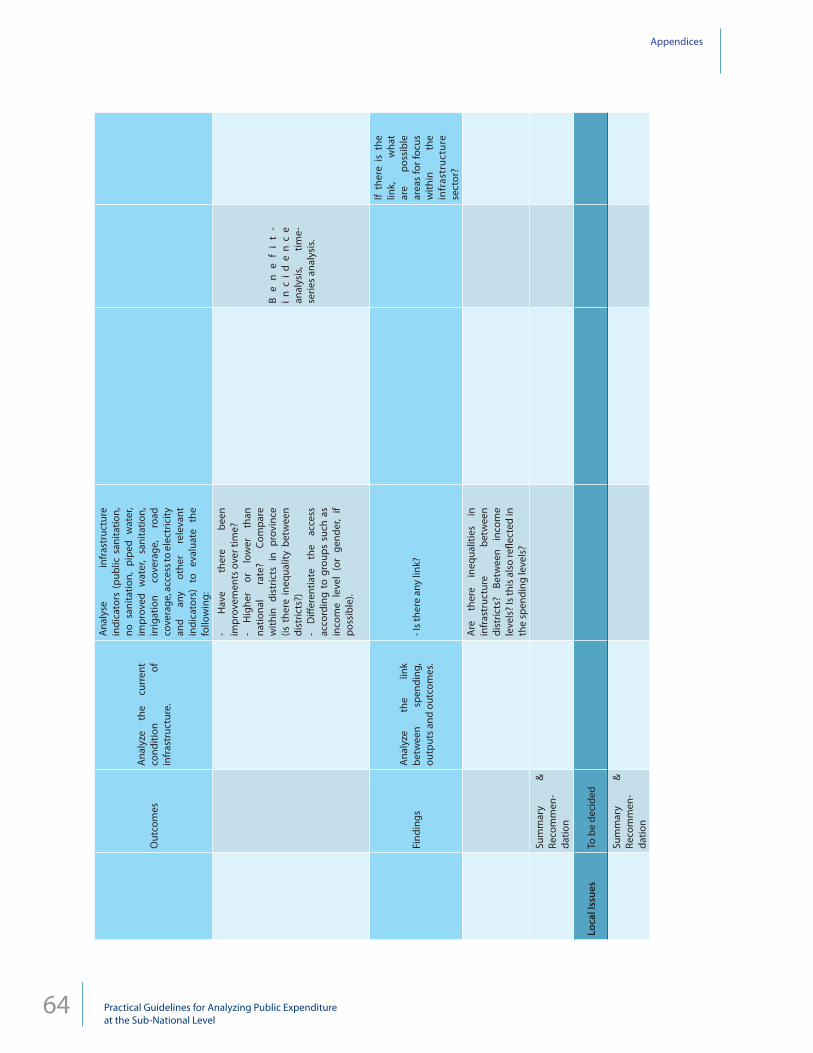
Chapter 5: Strategic Sectors: Education, Health and Infrastructure The purpose of this chapter is to provide sharper analysis of those sectors most important for public service delivery: health, education and infrastructure. For each of these three sectors, this chapter analyzes spending and compares it with what the spending has achieved, both in terms of outputs such as staff, buildings and services, and also whether the spending has achieved an improvement in outcomes. For example, has health spending increased? If so, has this resulted in improved services (access, quality etc) and, if better services have been delivered, has this resulted in lower illness or mortality rates. Recommendations from this analysis may include identifying priority areas of health or education that the government should target, or how the government can improve its spending within a specific sector (e.g. more funds should be allocated to maintaining existing infrastructure rather than building new infrastructure).
Attached in Appendix 1 is the PEA Minimum Standard Outline that provides the key chapters, sections and questions that all PEAs must include.
5Practical Guidelines for Analyzing Public Expenditureat the Sub-National Level
Chapter 2Doing a Public Expenditure Analysis
Chapter 2Doing a Public Expenditure Analysis
The following briefly describes the main steps in conducting a PEA:
2.1 Writing the Research ProposalBefore starting any research activities, it is important to have a comprehensive research proposal. The purpose of the research proposal is to set out what the research will be about, why it is important, who will do it, who are the target audiences, and the timing and scope of the research. This preparatory step is important in avoiding undertaking irrelevant work and, if working in a team, ensuring that there is a common understanding between team members. This step is important because defining the scope of research also defines the scope of data that will need to be collected. Chapter 3 provides further guidance on writing a research proposal.
2.2 Collecting the DataOnce the proposal is completed, the researcher (or research team) can start the data collection. This is one of the most crucial stages of the research, as the quality of research is directly correlated to data quality. There are four important characteristics of data quality: data should be detailed, comparable, accurate and timely.
The more detailed the data the better the analysis. If data are very broad and general, the researcher will experience difficulties in finding explanations for trends and drawing conclusions. In order to make comparisons across time, or with different kabupaten/kota, the data used must be comparable. For example, if the expenditure in the agriculture sector for kabupaten 1 includes fisheries but does not include fisheries in kabupaten 2, this means the agriculture information is not comparable unless the fisheries information is removed from kabupaten 1. It is important that the researcher examine the data carefully to ensure that they are comparable. Accuracy of data is also important, although this may not always be within the control of the researcher and may depend on the methodology used by those who responsible for primary data collection (e.g. BPS). For example, there are often many different versions of the APBD (pre-audit, post-audit, etc) and it is important that the data used are the most accurate available. There are two aspects to whether data are timely: first, conclusions on public finance can only be based on data from multiple years. A general rule of thumb is that data must be collected over a minimum of five years. The longer timeframe the data are available the better the analysis and its conclusions. Furthermore, in order for the research to be relevant, the most recent data are required.
Gaining access to financial information is not always a smooth process and the researcher will need to be creative in finding different ways of ensuring that data collected are complete. Furthermore, the researcher may find inconsistent data from difference sources and will need to make judgments on which source is more appropriate (based on the principles of detailed, comparable, accurate and timely). Chapter 4, Section 4.1 will provide further guidance on the process of data collection.
6 Practical Guidelines for Analyzing Public Expenditureat the Sub-National Level
Chapter 2Doing a Public Expenditure Analysis
2.3 Entering the data into a format that is useful for analysisRaw data (for example, found in the APBD or RPJMD) are often in a format unsuitable for analysis. Some common problems include: a) the data are only available in hardcopy; b) the data are not comparable because the budget format has changed; and c) the sectoral and economic classifications vary between governments. Therefore, in order to ensure consistency in the usage of data across the analysis, it is essential that data are entered into a format that allows the information to be compared and analyzed. This may include entering the information into a common table. This manual includes a suggested master table that all budget information should be entered into prior to analysis. Chapter 4, Section 4.2 provides further guidance on entering data into a format that is useful for analysis.
2.4 Analyzing the data, formulating conclusions and recommendationsOnce data collection has been completed and the data entered into one location and format, the researcher(s) are ready to conduct the analysis. While Chapter 5 sets out a variety of methodologies needed to analyze the data in order to write a PEA report, below are some broad suggested steps for conducting the data analysis:
(a) Based on the available data, what trends can be seen? Has the indicator remained steady, increased or decreased?
(b) Why has the trend happened? Is there a reason for the trend? Components (a) and (b) form the conclusion of the analysis?
(c) Based on the reason explaining the trend, is there something that the government can do to improve the situation? This becomes the recommendations.
Overall, the hallmark of good analysis is that the trends, conclusions and recommendations are linked to each other, and that these in turn stem from the available data. Further guidance on analyzing data is found in Chapter 5
2.5 Writing the reportBased on the analysis and conclusions drawn in Step 4, the researcher(s) will consolidate the most important research and messages into a final written report. While strong analysis based on quality data is essential for the integrity and validity of the conclusions and recommendations, a well-written concise report is the medium by which the main messages are delivered to its audience. There are several characteristics to a well-written report: a) It has a clear and consistent structure. This manual has provided a general structure (see Section 1.4) that which most PEA reports to date have followed. While researchers should be free to add additional relevant material in order to make comparisons with other PEA research, this manual recommends that researchers remain faithful to the overall structure; b) all content included in the PEA report is relevant to its overall message; and c) sentences should be concise and free of jargon. Chapter 6 provides further guidance on writing a PEA report.
7Practical Guidelines for Analyzing Public Expenditureat the Sub-National Level
Chapter 3Research Proposal
Chapter 3Research Proposal
Before starting data collection or conducting any analysis, it is important to have a comprehensive research proposal. The purpose of the research proposal is to set out what the research will be about, why it is important, who will do it, who are the target audiences, and the timing and scope of the research. This preparatory step is important in avoiding undertaking irrelevant work and, if working in a team, ensuring that there is a common understanding between team members. As a minimum, a PEA research proposal needs to cover the following:
Background: What circumstances have led to the need for a PEA? Has anyone asked for the PEA? If so, who?
Purpose of research: Outline what the PEA is trying to achieve. As mentioned in section 1, the main purpose of the PEA is to provide recommendations to government on how budgets can be allocated more effectively. Are there supplementary goals that the PEA is trying to achieve? For example, is it trying to build the capacity of team members to work in a team? Is it trying to collect budget and planning documents for university libraries or a database?
Key audience: Identify who this research is primarily intended to reach and how the audience(s) is expected to use the research.
Scope of research: This should include identifying the key research questions that need to be answered; an agreed time frame that this research will cover (e.g. years and data needed); geographic scope of the research (e.g. how many kabupaten/kota will the PEA cover?); content scope of research (e.g. type of data required); an overview of the report structure, although this may change over time depending on the data collected and analysis conducted so the structure should remain flexible; and discuss generally the type of conclusions and recommendations expected.
Timing: Provide a Gantt chart on the timing of the research, including key milestones (data collection completed, first draft completed etc).
Research team – roles and responsibilities: This section will describe the research team composition and expected roles of team members. This section is not relevant if there will only be one researcher. Some suggested roles include:
Team Leader: Responsible for ensuring that all team members understand their respective roles and responsibilities and are working as a team towards reaching a common goal.
8 Practical Guidelines for Analyzing Public Expenditureat the Sub-National Level
Chapter 3Research Proposal
Some tasks include:- Ensuring that the research proposal is complete and agreed upon by the team and related parties.- Overseeing the timely completion of tasks by each member of the research team. - Requesting (in reality, chasing) team members to submit their analysis and written material. - Compiling and collating each chapter written by different team members. - Editing all written materials. This task includes editing for consistency, style of language, structure/flow and
logical progression between chapters, sections and sub-sections, and between sentences throughout the entire report.
Researcher: This person will be responsible for conducting the portion of the research assigned to him/her by the team leader. This includes collecting data, analyzing the data and writing the relevant sections or chapters of the report. The researcher should also ensure that her/his work is consistent with the rest of the team, so that when the team puts together the final draft, the analysis is of similar structure, content and quality. The proposal should assign specific responsibilities to each researcher.
Research Assistant: the researcher may choose to take on a research assistant to help her/him with any aspects of the research.
The number of senior researchers and research assistants needed for a PEA team depends on the scope of research (time frame, geography etc).
9Practical Guidelines for Analyzing Public Expenditureat the Sub-National Level
Chapter 4Data Collection and Preparation for Analysis
Chapter 4Data Collection and Preparation for Analysis
4.1 Collecting data The purpose of this section is to explain to the researcher the data collection steps (what needs to be collected and from which sources), what issues the researcher may encounter and how these issues may be overcome.
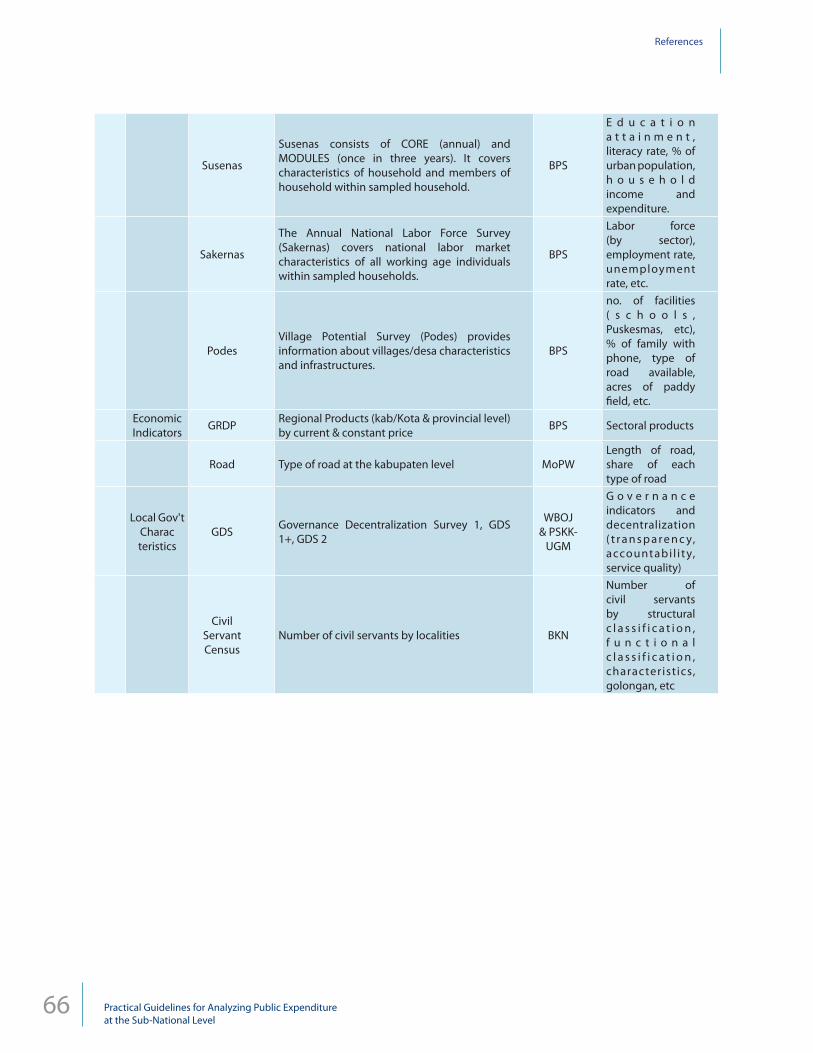
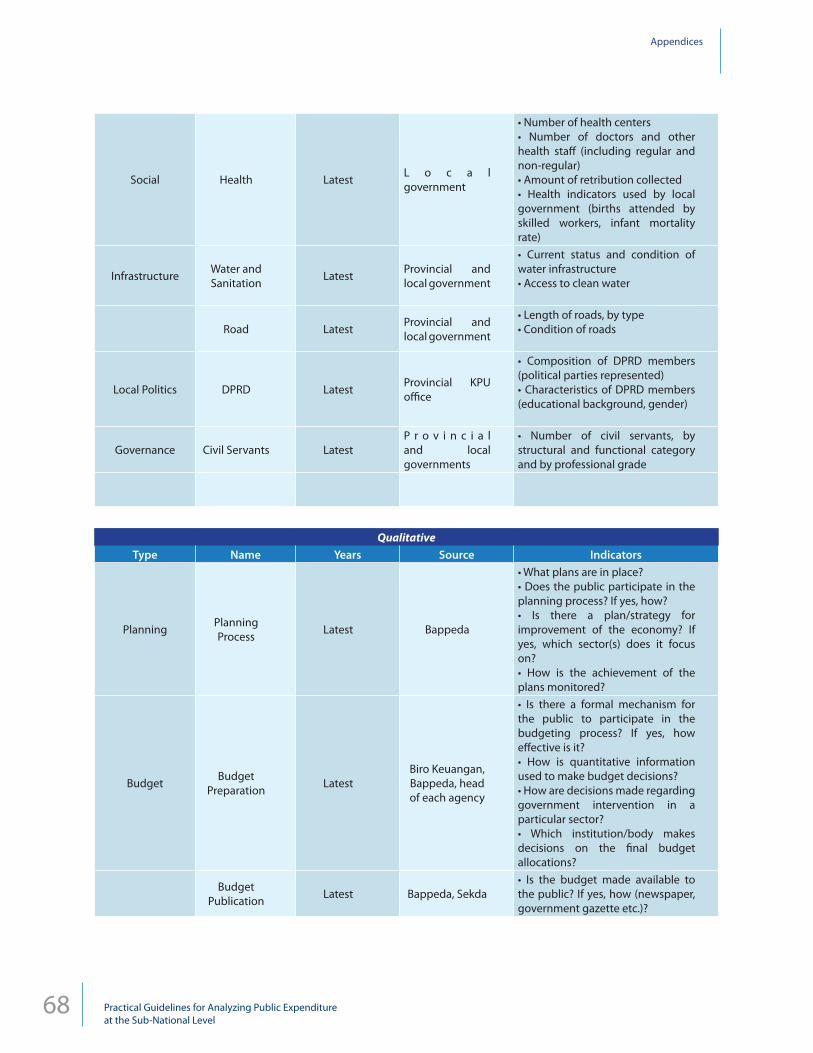
4.1.1 Data requirementsIn order to complete a PEA, both quantitative and qualitative data are required. As discussed in Chapter 2, the more detailed and complete the data the better the analysis will be. For a full list of minimum data requirements, refer to Appendix 2. This section will provide a general overview of the data needed and their sources.
Quantitative data:• Fiscal data: Data include APBN, APBD, DAU, DAK, borrowing, local taxes, revenue-sharing, and PAD. • Non-fiscal data: Data include population data; poverty rates; employment rates; education indicators such as
the number of schools, teachers, students; enrollment rates; health indicators such as the number of staff and health centers; infrastructure indicators such as the length of roads, water and sanitation facilities available; the composition of DPRD; and the composition of civil servants.
Qualitative data:• Planning process: Are the pre-requisite plans in place? Is planning participatory? How are the plans monitored?• Budgeting process: What is the level of public participation in the budgeting process? Is quantitative
information used to make budget decisions? How are budget decisions made in specific sectors? Is the budget made available to the public? Which unit is responsible for disbursement? Has a local treasury been established? What are the payment mechanisms? Has performance budgeting been introduced? How is budget performance monitored?
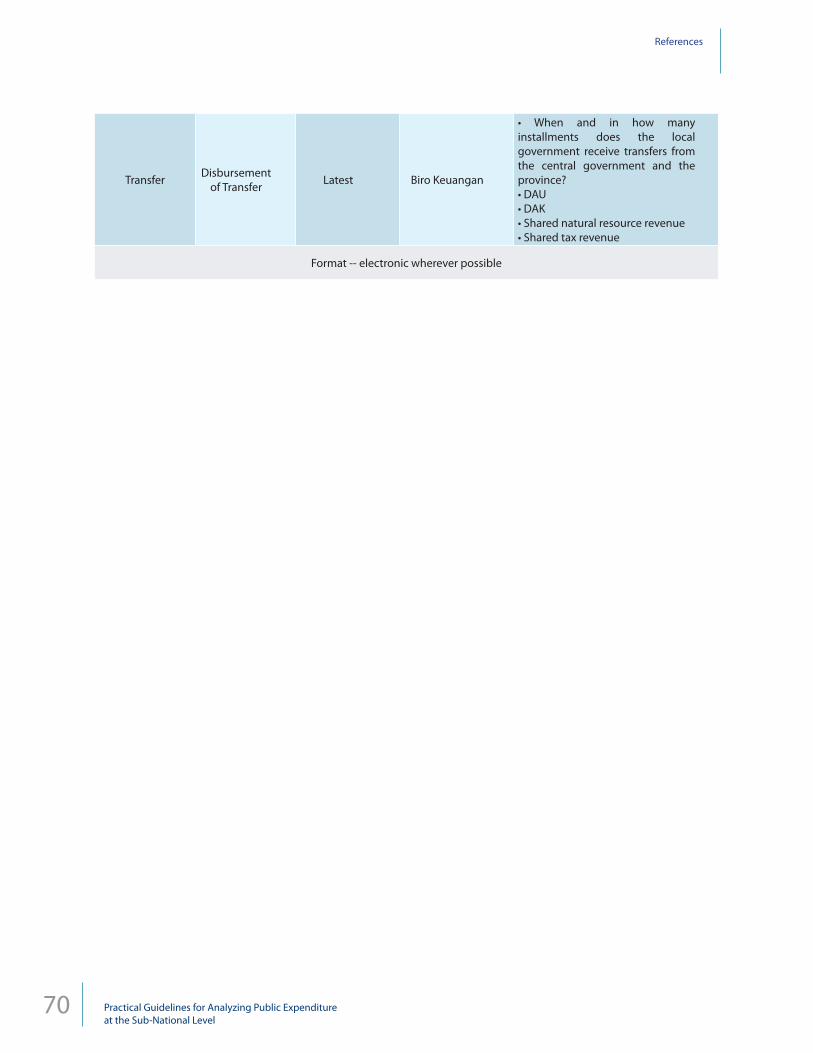
• Transfers: How many installment transfers does the local government receive from the central government and how timely are they?
Data sources:Data may be collected from a variety of sources (and these may be inconsistent), but below is a suggested list of sources:
• Ministry of Finance• Central Bureau of Statistics (BPS)• Ministries of Public Works, Health and Education• State Civil Servant Agency (Badan Kepegawaian Negara, or BKN)• Provincial governments (Finance Agency, Planning Agency, Health Agency, Education Agency, Public Works
Agency)• Relevant agencies of the kabupaten/kota governments• World Bank and United Nations
For a full list of minimum data requirements and sources, refer to Appendix 2.
10 Practical Guidelines for Analyzing Public Expenditureat the Sub-National Level
Chapter 4Data Collection and Preparation for Analysis
4.1.2 Data collection issuesDuring the process of collecting data from government agencies and other sources, the researcher may encounter many obstacles. This section outlines some common issues faced by researchers and suggests some solutions in overcoming those issues. This is not an exhaustive list of the potential issues and it will ultimately be up to researchers to find their own solutions.
1. No access to data. Researchers will often encounter obstacles in gaining access to data. Even where the provincial government has provided the requisite authorization papers, researchers will eventually run into sub-national government or agencies that are reluctant to make documents available.
Suggested solution 1: Discuss the issue with the researchers’ contacts in the government or donor agencies (if they are financing your research). For example, if the research is part of a larger donor-funded program, the program may have a program management committee or similar with representatives of the government sitting on this committee. This committee or related donor agencies (such as the World Bank) may be able to provide additional papers directly addressed to the particular government/agency reluctant to provide data access.
Suggested solution 2: If solution 1 does not work, ask the researchers’ contacts in the government or donors to intervene directly. For example, the program management committee or related donor may be able to contact the government agency directly themselves. They may be able to gain access to higher authorities at that particular region or, if possible, a representative of the committee may be able to accompany the researcher to the government agency themselves.
Suggested solution 3: Find other sources for that particular data. Options include using close substitutes as proxies or using similar data from central (Jakarta) sources.
2. Data from different sourcesData may be collected from sources that are inconsistent (i.e. showing different numbers) and it is possible that the data may differ significantly. For instance, the population data from sub-national BPS and Bappeda often contain large variations.
Suggested solution: Gather more information on the different data, especially on the definitions, objectives, how the data are collected and the data availability. Based on these considerations the researcher can then decide which data are more accurate and relevant.
4.2 Preparing the data for analysisThis section will discuss important aspects of preparing the data for analysis. First, this involves deciding on data characteristics prior to commencing analysis. In particular, it will discuss why it is important to reach agreement on the data and the analysis. Second, this chapter will explain the data table, what it aims to do and how to fill it out.
4.2.1 Agreeing on data sources, scope and analysisThe aim of agreeing on data sources is to use a consistent data set throughout the analysis. This is especially important in cases where analysis in different sections is carried out by different researchers. The following issues need to be agreed:
11Practical Guidelines for Analyzing Public Expenditureat the Sub-National Level
Chapter 4Data Collection and Preparation for Analysis
Source of data: central government versus sub-national governmentsData can come from two sources: central government or sub-national governments. For example, the Ministry of Finance keeps sub-national government fiscal data in a database called the Sistem Informasi Keuangan Daerah (SIKD) and is more easily accessible through the SIKD web site. If the researchers are from the regions, they may have direct access to the fiscal data from sub-national governments. There are advantages and disadvantages from both sources.
The advantage of central government sourced data is that the data are available for all regions and therefore comparable across provinces (and across kabupaten/kota). However, since the data are manually entered into the SIKD, they may be subject to human input error. Alternatively, data collected directly from sub-national governments may be more accurate. However, if the researcher has access to post-audited reports these may also contain more detailed information. If this information is available, it can be used for intra-regional comparisons (e.g. between provincial and kabupaten/kota governments within the same province) but should not be used for inter-regional analysis (e.g. between provinces or between kabupaten/kota in different provinces). This difference between central government and sub-national government sources applies to fiscal data, as well as some other quantitative output and outcome indicators. The research team needs to agree which set of data will be used in the entire PEA analysis.
Source of population data:Population data are available from many sources ranging from the central BPS, regional BPS (provincial capitals) and different agencies within sub-national governments. Agreement on the data used is important because these data will generate per capita figures. As discussed in 3.1.3, where inconsistencies exist between different data sources it is for the researcher to decide which data set to use based on information concerning methodology, data availability, the definition of the data set etc.
Time span:As discussed in the proposal stage, the time span for analysis needs to be agreed upon from the outset. As discussed in Chapter 1, the longer the time span, the better the analysis. However, there are significant limitations in data availability. For example, provinces established after decentralization, will not have data prior to 2000. Ideally, the minimum time span is five years. Also, where possible, the same years should be used for all data. One limitation is that the most recent years for outcome indicators (Susenas, Sakernas, health and education indicators) are often not available, so they may be of different time spans to the fiscal data (when more recent data are readily available). This is a limitation, but it remains important that the PEA analysis uses at least five years of data.
Consumer Price Index (CPI):The research team needs to agree on the CPI because all nominal fiscal data must be converted to real figures (i.e. constant price figures) to take into account inflation. If the regional CPI is unavailable, agreement must be reached on which CPI figure to use as a proxy. Furthermore, researchers must agree on the base year for the real figures. Usually, the base year is the earliest (or oldest) year in the dataset. However, in order for the analysis to be forward looking, the authors recommend that researchers use the latest (i.e. most recent) year as the base year. The advantage of doing so is that when comparing trend figures and cross-section figures (which are the latest) the numbers will be consistent and comparable. This has proved to be most effective when the report is written by a team of researchers who work independently most of the time.
4.2.2 The Budget Master Table (BMT)Once agreement has been reached on data sources, the CPI and the time span, and the data collection has been completed, the next step is to input the data into a format that makes it accessible for analysis. As discussed in the research proposal section, the data must be comparable. Therefore, the raw data must be re-formatted so that the figures are comparable across years, geographic areas, sectors and economic classifications. There are two significant limitations in comparability. First, budget formats have changed several times during the past decade. Second, different governments may structure their government departments in different ways. For example, the scope of responsibilities for the Public Works Dinas may differ between districts.
12 Practical Guidelines for Analyzing Public Expenditureat the Sub-National Level
Chapter 4Data Collection and Preparation for Analysis
To help researchers re-structure the fiscal data into a comparable format, this manual is accompanied by a CD containing an Excel file called the “Budget Master Table” (hereafter referred to as the BMT). The BMT uses a format into which all fiscal data should be entered prior to any analysis. The objective of the BMT is to consolidate all sub-national governments’ budget information into one location in a clear and consistent format, irrespective of different economic or sectoral classifications. Having all fiscal data in one source is particularly crucial if research is conducted by a team, as it will ensure that different researchers will use consistent figures in their respective analyses.
The BMT Excel spreadsheet consists of four sections:1. Read me: This section provides all the information regarding the data used in the BMT. This section also
provides population and regional CPI data that is used to generate real and per capita figures.2. Regional budget: This section covers the budgets from the provincial government and all the kabupaten/kota
within the province. It covers the planned and realization figures for the time span agreed upon. 3. Central budget/deconcentrated spending: This section covers the central spending (deconcentrated funds)
allocated to the province. Due to data limitations, the available data are usually the realization figures and broken down by sector.
4. Consolidated figures: This section provides the consolidated budget figures in nominal, real, and per capita forms.
The BMT is created by manually entering the data from the collected budget reports from the sub-national government. Each cell consists of relevant items from the budget reports. At some point, assumptions/estimates can be made to any information that does not have a direct relation to the budget report. For example, if we convert prices into real prices, there should be a clear reference to which inflation factor has been used and which year is the base year. The important point is to document any assumptions or estimates so that this information is kept for future reference.
Documents in CD: Example of Master table (see master_gPEA_final.xls), Exercise (see master_gPEA_exercise.xls)
13Practical Guidelines for Analyzing Public Expenditureat the Sub-National Level
Chapter 5Data Analysis, Conclusions and Recommendations
Chapter 5Data Analysis, Conclusions and Recommendations
This chapter discusses what types of analysis are required to write the PEA report. This includes identifying which charts are useful for each chapter and explaining which data are required to conduct the analysis and create the graphs. It also considers the types of conclusion that can be drawn from the analysis. This chapter is broken down into sections based on the minimum chapters expected in a PEA report, which include:
2. Planning and budgeting • Development priorities analysis • Planning and budgeting linkages • Good practice for planning and budgeting • Participative development planning and budgeting • Regulatory framework analysis
4. Expenditure • Overall spending picture • Sectoral spending analysis • Economic Classification Analysis • Local spending variation analysis • Central government spending analysis
5. Strategic Sectors (education, health and infrastructure) • Analysis of spending by strategic sectors • Performance analysis for each strategic sector
14 Practical Guidelines for Analyzing Public Expenditureat the Sub-National Level
Chapter 5Data Analysis, Conclusions and Recommendations
5.1 Overview chapter5.1.1 ObjectiveThe objective of this chapter in the PEA is to provide a general demographic background of the province, with a focus on social and economic analyses. If the researchers and/or sub-national government raise issues that are specific to the province (considered “local issues”) then these should also be introduced in this chapter.
5.1.2 Type of analysisIn this section, the following topics would usually be discussed:
1. Regional economic analysisa. Economic growthb. Structure of the economyc. Inflation
2. Regional demographic analysis a. Population and employment structureb. Unemployment
3. Poverty analysis a. Poverty ratesb. Human Development Index
4. Regional economic analysisThe regional economic analysis should look at the general macroeconomic conditions of the province, particularly in comparison with other provinces and the overall Indonesian position. There are three main elements to the economic analysis: economic growth, structure of the economy and inflation.
a. Economic growth (regional gross domestic product (RGDP) growth, RGDP per capita).The objective is to understand the size of the provincial/district economy as well as the rate at which the sub national economy has grown, especially in comparison to other provinces, districts in Indonesia and with the national average. Source of data: Regional Statistical Office and the Regional Planning Agency.
Example 1: making provincial comparisonThe next bar graph is an example of how the size of the regional economy can be presented. It shows per capita RGDP at the Gorontalo province, in comparison with the other provinces in Sulawesi, in eastern Indonesia and across Indonesia. The graph suggests two trends: 1) Gorontalo has a very small economy, as measured by the per capita RGDP, compared to other provinces in Indonesia; and 2) While the Gorontalo economy has grown between 2000-2006, this follows a general trend across Indonesia. Per capita real RGDP is the preferred indicator because when using total RGDP the population is excluded, yet it contributes to the making of RGDP.
15Practical Guidelines for Analyzing Public Expenditureat the Sub-National Level
Chapter 5Data Analysis, Conclusions and Recommendations
Figure 1. Economic growth in Gorontalo, comparison with provincial and national level, 2000-2005
The above line graph shows the real economic growth, as measured by change in RGDP of Gorontalo between 1994 and 2005, compared to other provinces. The graph suggests that until 2005 Gorontalo grew faster than the average of other provinces in Sulawesi, eastern Indonesia and nationally. In 2005, however, eastern Indonesia’s growth rate suddenly rose to over nine percent (up from less than one percent in 2004), and overtook Gorontalo province’s growth rate.
16 Practical Guidelines for Analyzing Public Expenditureat the Sub-National Level
Chapter 5Data Analysis, Conclusions and Recommendations
Further issues to investigate:The key next step after identifying trends is to investigate why these trends may have happened. Some typical follow-up questions might include:
• What has been causing the per capita RGDP to increase in Gorontalo and generally across all provinces in Indonesia?
• What are drivers of Gorontalo’s economic growth?• Why did eastern Indonesian provinces suddenly experience such significant growth in 2005?
b. Structure of the economy (sectoral RGDP, sectoral per capita RGDP)The purpose is to analyze which sectors drive the sub-national (provincial or distric / city) economy. This analysis can compare one province/distric/city across time or compare against different sub-national governments. Source of data: Regional Statistics Agency and Planning Agency.
Example 2: sectoral contributionsThe example in Figure 2 shows which sectors contribute to the sub-national economy. The pie graph below shows that agriculture represents the largest sector for Nias Islands (consisting of two districs), followed by trade, restaurants and hotels. The Islands have very little activity in the manufacturing, mining and electricity, gas and water sectors (combined 4.5 percent).
Figure 2. Sectoral composition for GRDP in Nias islands, 2005
Trade,Restaurant, &
Hotel22.1%
Transport & Communication
6.9%
Financial Services5.5%
Mining and Quarrying
2.3%
Electricity,Gas, & Water
0.4%
Construction7.9%
ManufacturingIndustry
1.8%
Agriculture43.0%
Services10.1%
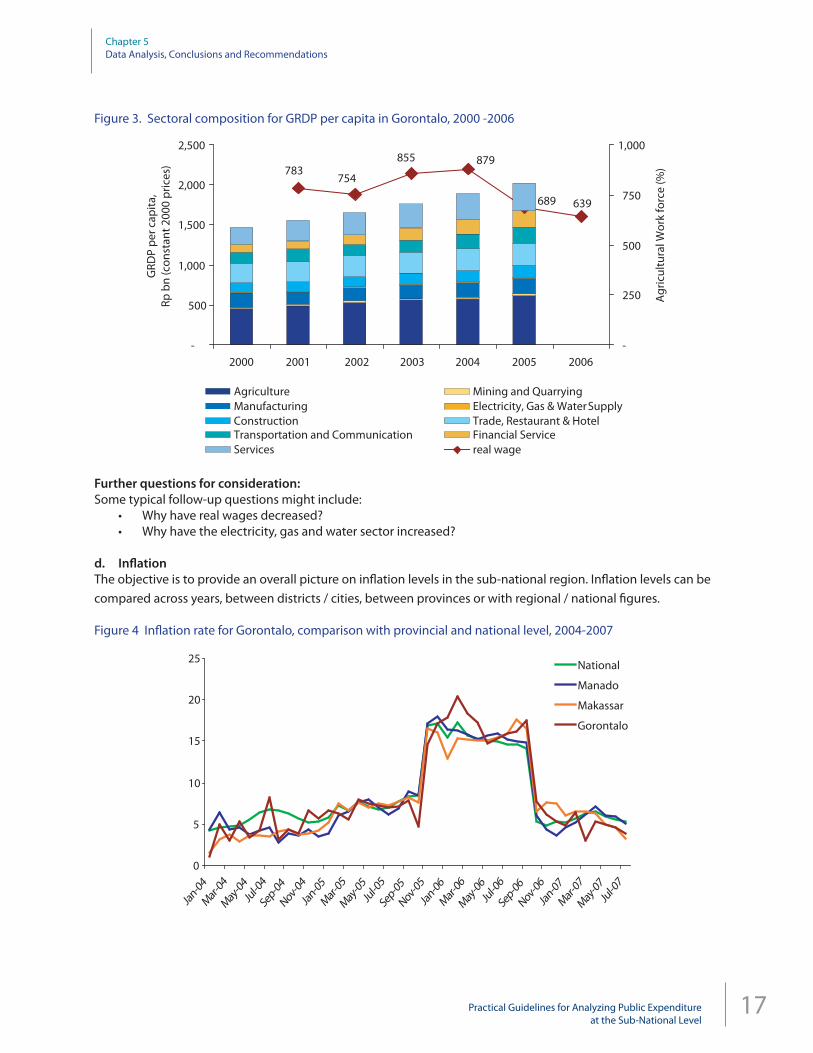
Figure 3 shows the per capita RGDP of Gorontalo between 2000 and 2005, in comparison to real wages. The graph shows several trends: 1)
(i) Agriculture forms a significant portion of Gorontalo’s per capita RGDP throughout all years.(ii) The overall sectoral composition of RGDP has remained fairly consistent although the percentage of RGDP
from electricity, water and gas has increased.(iii) Although per capita RGDP has increased, real wages have decreased in 2005 and 2006.
17Practical Guidelines for Analyzing Public Expenditureat the Sub-National Level
Chapter 5Data Analysis, Conclusions and Recommendations
Figure 3. Sectoral composition for GRDP per capita in Gorontalo, 2000 -2006
639689
879855
754783
-
500
1,000
1,500
2,000
2,500
2000 2001 2002 2003 2004 2005 2006
GRD
P pe
r cap
ita,
Rp b
n (c
onst
ant 2
000
pric
es)
-
250
500
750
1,000
Agriculture Mining and QuarryingManufacturing Electricity, Gas & Water SupplyConstruction Trade, Restaurant & HotelTransportation and Communication Financial ServiceServices real wage
Agr
icul
tura
l Wor
k fo
rce
(%)
Further questions for consideration:Some typical follow-up questions might include:
• Why have real wages decreased?• Why have the electricity, gas and water sector increased?
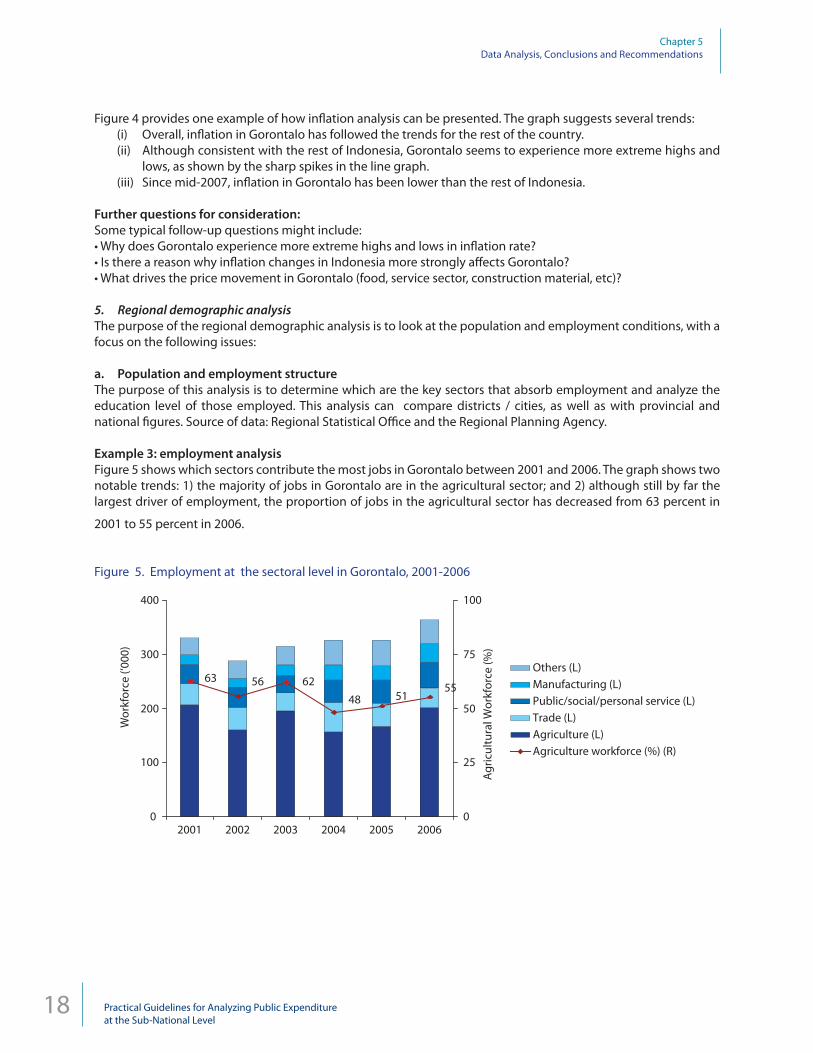
d. Inflation The objective is to provide an overall picture on inflation levels in the sub-national region. Inflation levels can be compared across years, between districts / cities, between provinces or with regional / national figures.
Figure 4 Inflation rate for Gorontalo, comparison with provincial and national level, 2004-2007
0
5
10
15
20
25
Jan-04
Mar-04
May-04
Jul-0
4
Sep-04
Nov-04
Jan-05
Mar-05
May-05
Jul-0
5
Sep-05
Nov-05
Jan-06
Mar-06
May-06
Jul-0
6
Sep-06
Nov-06
Jan-07
Mar-07
May-07
Jul-0
7
National
Manado
Makassar
Gorontalo
18 Practical Guidelines for Analyzing Public Expenditureat the Sub-National Level
Chapter 5Data Analysis, Conclusions and Recommendations
Figure 4 provides one example of how inflation analysis can be presented. The graph suggests several trends:(i) Overall, inflation in Gorontalo has followed the trends for the rest of the country. (ii) Although consistent with the rest of Indonesia, Gorontalo seems to experience more extreme highs and
lows, as shown by the sharp spikes in the line graph. (iii) Since mid-2007, inflation in Gorontalo has been lower than the rest of Indonesia.
Further questions for consideration:Some typical follow-up questions might include:• Why does Gorontalo experience more extreme highs and lows in inflation rate?• Is there a reason why inflation changes in Indonesia more strongly affects Gorontalo?• What drives the price movement in Gorontalo (food, service sector, construction material, etc)?
5. Regional demographic analysis The purpose of the regional demographic analysis is to look at the population and employment conditions, with a focus on the following issues:
a. Population and employment structure The purpose of this analysis is to determine which are the key sectors that absorb employment and analyze the education level of those employed. This analysis can compare districts / cities, as well as with provincial and national figures. Source of data: Regional Statistical Office and the Regional Planning Agency.
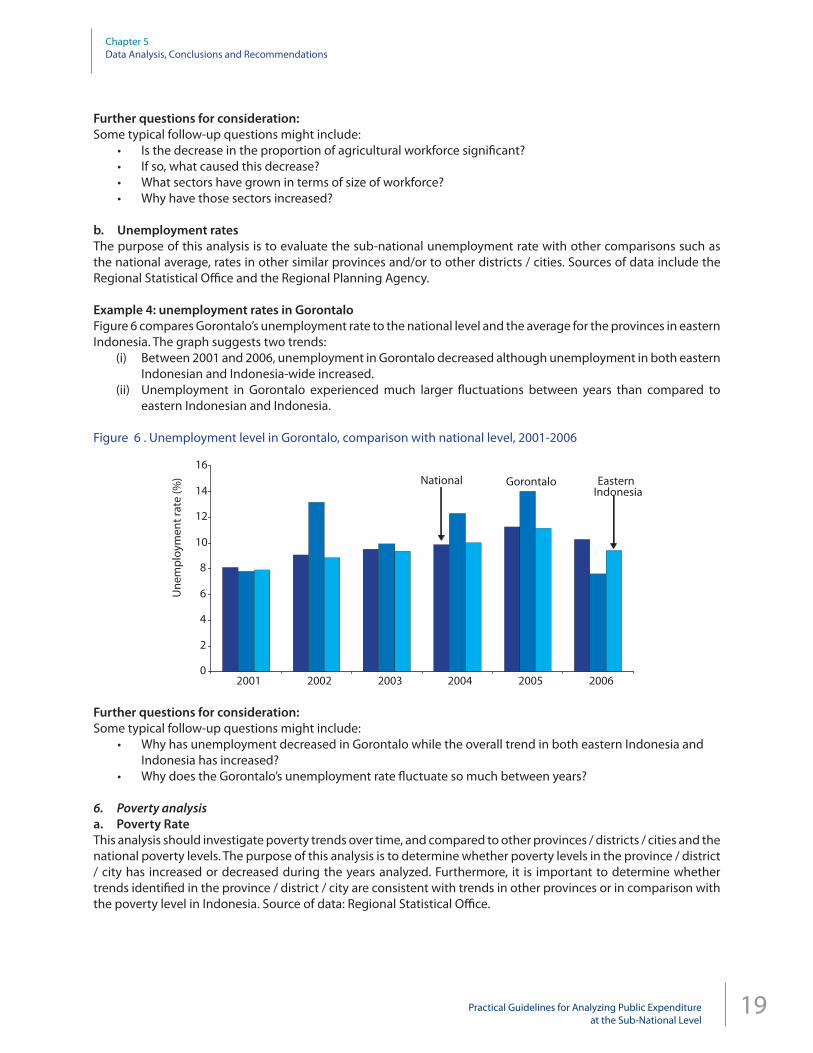
Example 3: employment analysisFigure 5 shows which sectors contribute the most jobs in Gorontalo between 2001 and 2006. The graph shows two notable trends: 1) the majority of jobs in Gorontalo are in the agricultural sector; and 2) although still by far the largest driver of employment, the proportion of jobs in the agricultural sector has decreased from 63 percent in
2001 to 55 percent in 2006.
Figure 5. Employment at the sectoral level in Gorontalo, 2001-2006
555148
625663
0
100
200
300
400
2001 2002 2003 2004 2005 2006
Agr
icul
tura
l Wor
kfor
ce (%
)
0
25
50
75
100
Others (L)Manufacturing (L)Public/social/personal service (L)Trade (L)Agriculture (L)Agriculture workforce (%) (R)
Wor
kfor
ce (’
000)
19Practical Guidelines for Analyzing Public Expenditureat the Sub-National Level
Chapter 5Data Analysis, Conclusions and Recommendations
Further questions for consideration:Some typical follow-up questions might include:
• Is the decrease in the proportion of agricultural workforce significant?• If so, what caused this decrease?• What sectors have grown in terms of size of workforce?• Why have those sectors increased?
b. Unemployment ratesThe purpose of this analysis is to evaluate the sub-national unemployment rate with other comparisons such as the national average, rates in other similar provinces and/or to other districts / cities. Sources of data include the Regional Statistical Office and the Regional Planning Agency.
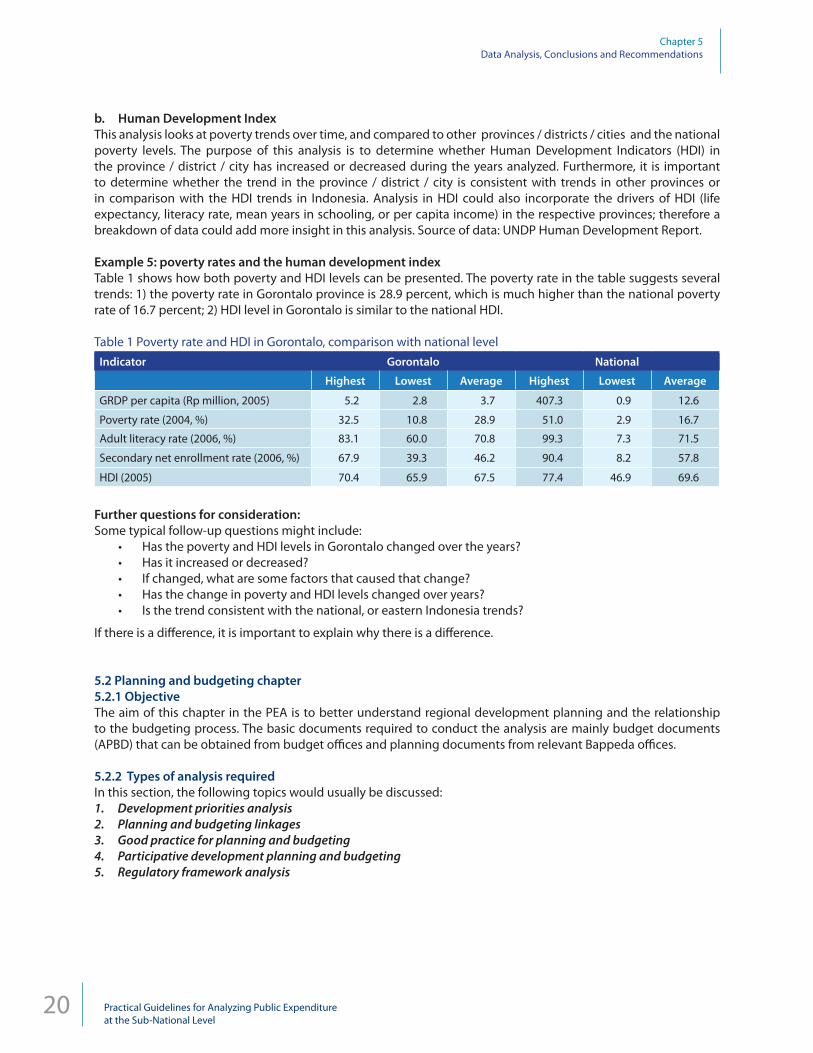
Example 4: unemployment rates in GorontaloFigure 6 compares Gorontalo’s unemployment rate to the national level and the average for the provinces in eastern Indonesia. The graph suggests two trends:
(i) Between 2001 and 2006, unemployment in Gorontalo decreased although unemployment in both eastern Indonesian and Indonesia-wide increased.
(ii) Unemployment in Gorontalo experienced much larger fluctuations between years than compared to eastern Indonesian and Indonesia.
Figure 6 . Unemployment level in Gorontalo, comparison with national level, 2001-2006
National Gorontalo EasternIndonesia
0
2
4
6
8
10
12
14
16
2001 2002 2003 2004 2005 2006
Une
mpl
oym
ent r
ate
(%)
Further questions for consideration:Some typical follow-up questions might include:
• Why has unemployment decreased in Gorontalo while the overall trend in both eastern Indonesia and Indonesia has increased?
• Why does the Gorontalo’s unemployment rate fluctuate so much between years?
6. Poverty analysis a. Poverty RateThis analysis should investigate poverty trends over time, and compared to other provinces / districts / cities and the national poverty levels. The purpose of this analysis is to determine whether poverty levels in the province / district / city has increased or decreased during the years analyzed. Furthermore, it is important to determine whether trends identified in the province / district / city are consistent with trends in other provinces or in comparison with the poverty level in Indonesia. Source of data: Regional Statistical Office.
20 Practical Guidelines for Analyzing Public Expenditureat the Sub-National Level
Chapter 5Data Analysis, Conclusions and Recommendations
b. Human Development IndexThis analysis looks at poverty trends over time, and compared to other provinces / districts / cities and the national poverty levels. The purpose of this analysis is to determine whether Human Development Indicators (HDI) in the province / district / city has increased or decreased during the years analyzed. Furthermore, it is important to determine whether the trend in the province / district / city is consistent with trends in other provinces or in comparison with the HDI trends in Indonesia. Analysis in HDI could also incorporate the drivers of HDI (life expectancy, literacy rate, mean years in schooling, or per capita income) in the respective provinces; therefore a breakdown of data could add more insight in this analysis. Source of data: UNDP Human Development Report.
Example 5: poverty rates and the human development indexTable 1 shows how both poverty and HDI levels can be presented. The poverty rate in the table suggests several trends: 1) the poverty rate in Gorontalo province is 28.9 percent, which is much higher than the national poverty rate of 16.7 percent; 2) HDI level in Gorontalo is similar to the national HDI.
Table 1 Poverty rate and HDI in Gorontalo, comparison with national levelIndicator Gorontalo National
Further questions for consideration:Some typical follow-up questions might include:
• Has the poverty and HDI levels in Gorontalo changed over the years?• Has it increased or decreased?• If changed, what are some factors that caused that change?• Has the change in poverty and HDI levels changed over years?• Is the trend consistent with the national, or eastern Indonesia trends?
If there is a difference, it is important to explain why there is a difference.
5.2 Planning and budgeting chapter5.2.1 ObjectiveThe aim of this chapter in the PEA is to better understand regional development planning and the relationship to the budgeting process. The basic documents required to conduct the analysis are mainly budget documents (APBD) that can be obtained from budget offices and planning documents from relevant Bappeda offices.
5.2.2 Types of analysis requiredIn this section, the following topics would usually be discussed:1. Development priorities analysis 2. Planning and budgeting linkages3. Good practice for planning and budgeting 4. Participative development planning and budgeting5. Regulatory framework analysis
21Practical Guidelines for Analyzing Public Expenditureat the Sub-National Level
Chapter 5Data Analysis, Conclusions and Recommendations
1. Development priorities analysis In order to describe provincial development priorities, this section requires a discussion of the priority sectors mentioned in the provincial RPJMD (Regional Medium-Term Development Plan), a brief description of main function (urusan wajib) and optional function (urusan pilihan) of sub-national governments, as well as an assessment of the level of linkages and synchronization between various planning documents.
2. Planning and budgeting linkagesThis section looks at the function of the budget as a tool of development planning and how it is used in establishing development priorities. It assesses whether the existing budget (APBD) is really linked to the planning documents and whether the budget contains the development goals as stated in the planning documents.
3. Good practice for planning and budgeting This section reviews whether the existing planning and budgeting documents have taken into account Medium-Term Expenditure Framework (MTEF) and Performance-Based Budgeting (PBB) principles. It aims to establish how well the concepts of MTEF and PBB are applied in the current budget system.
4. Participative development planning and budgetingHere, we look at how well the region has applied a participative process in development planning, the benefits and drawbacks of using such process.
5. Regulatory framework analysisThis section examines whether the process of planning and budgeting has been conducted according to existing regulations and has occurred within the required timeframe.
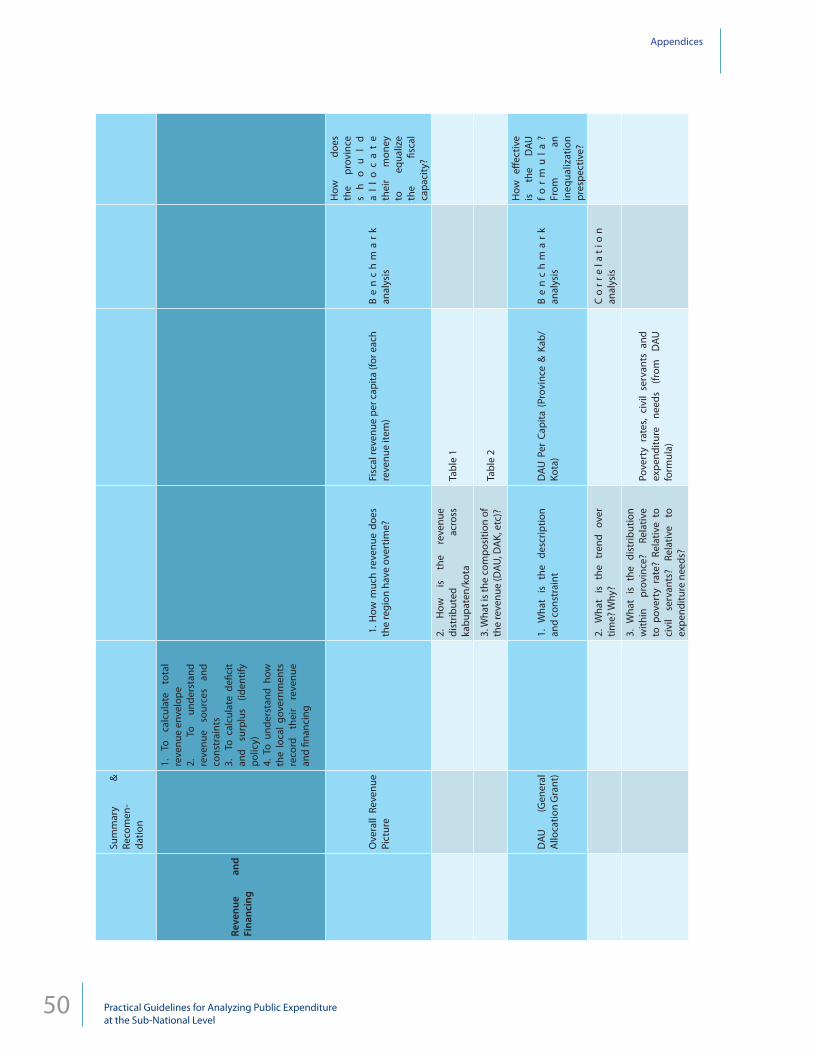
5.3 Revenue chapter5.3.1 ObjectiveThe aim of this chapter is to understand the total financing envelope that is available to the region and the sources of that revenue, including the extent to which this comes from national or local governments. As such, the required figures are consolidated from all relevant districts / cities, the provincial government and Central government (deconcentrated funds and other assistance (tugas pembantuan)). The basic documents required to conduct the analysis are mainly budget documents (APBD) obtained from the budget offices or Bappeda.
5.3.2 Types of analysis requiredIn this section, the following topics would usually be discussed in order to provide a comprehensive analysis of sub-national revenue:
1. Overall revenue pictureThe purpose of this analysis is to provide a consolidated picture of the general revenue trends in the province. This analysis must include revenue data from both the provincial and district / city governments.
2. Detailed revenue analysisThe second section provides a more detailed analysis of the main sources of revenue (DAU, DAK, Shared Revenue and own-source revenue (PAD)). This includes for each type of revenue: trends over time, whether derived by provincial or district / city governments; and what factors cause each type of revenue to increase or decrease.
3. Financing analysisThis section aims to understand the level of surplus/deficit that the sub-national government has; and how the provincial / district / city government(s) finances the deficit or allocates the surplus; as well as how the accounts are recorded in the APBD.
22 Practical Guidelines for Analyzing Public Expenditureat the Sub-National Level
Chapter 5Data Analysis, Conclusions and Recommendations
5.3.3 Overall revenue pictureThe purpose of this analysis is to provide an overall picture of how much consolidated revenue the region receives. Part of this general analysis is to compare the province’s consolidated revenue with other comparable provinces in Indonesia, and with the Indonesian average. Key aspects of this analysis should include:
• Trends over time: has total revenue increased or decreased over time? Why? How does the trend com-pare to other provinces in Indonesia or the Indonesian average? To compare with other provinces, the analysis must use per capita figures.
• Level of government: which level of government receives the sub-national revenue? Provincial govern-ment or district / city governments? Has this changed over time?
• Distribution across districts / cities: which district / city receives the highest levels of revenue? Which receives the lowest level of revenue? Why? To compare between districts / cities, the analysis must use per capita figures.
• Composition of revenue: what are the main sources of revenue – DAU, DAK, Shared Revenue, PAD? Has the composition of revenue changed over time?
Example 6: trends across time
Figure 7 is an example of a time series graph that shows the revenue trends across time in Gorontalo.
Figure 7. Fiscal resources per capita in Gorontalo, 1998-2006
0200400600800
1,0001,2001,4001,6001,800
1998
Own Source RevenueShared Nat Resources(Development) Presidential Grants/INPRESDAKOther Revenue
1999 2000 2001 2002 2003 2004 2005 2006*
Shared TaxesAutonomous Region Subsidy/SDODAUOther Balancing Fund
Rp ’0
00
The graph suggests several observable trends:(i) Since 2001, Gorontalo’s per capita revenue has increased steadily. (ii) Since 2001, the sources of revenue have changed significantly. The majority of the revenue is from fiscal
balancing funds, which comprises of DAU, DAK and Shared Revenue.(iii) The majority of the increase in revenue is from the balancing funds, which was the main tool used by
the central government to transfer fiscal management to local governments, as a part of Indonesia’s decentralization reforms.
23Practical Guidelines for Analyzing Public Expenditureat the Sub-National Level
Chapter 5Data Analysis, Conclusions and Recommendations
Further questions for consideration:Some typical follow-up questions might include:
• Why has per capita revenue increased?• Is the growth in Gorontalo’s revenue higher or lower than revenue growth in other provinces in Indone-
sia? Why might this be?• What recommendations might help sub-national governments to increase revenue?
Example 7: composition of revenue
Table 2. Fiscal revenue composition in Gorontalo and consolidated districts, 2002-20062002 2003 2004 2005 2006*
Table 2 presents revenue in Gorontalo by year and by composition, and separated between the provincial Government and its district / city governments. The table shows several observable trends:
(i) Between 2002 and 2006, provincial revenue and district / city revenue almost doubled.(ii) The vast majority of the revenue at both the provincial and district / city level, is from DAU.(iii) At the district / city level, DAK has increased by almost 600 percent from 2002 to 2006.(iv) Very little revenue is from PAD, which means the province predominantly relies on transfers from central
government.
24 Practical Guidelines for Analyzing Public Expenditureat the Sub-National Level
Chapter 5Data Analysis, Conclusions and Recommendations
Further questions for consideration:Some typical follow-up questions might include:
• Why has the above trends happened?• How does revenue growth in Gorontalo compare with other provincial / district / city governments in
Indonesia?• What factors affect the increase in DAK and DAU?• Are these factors different in Gorontalo compared to other local governments in Indonesia?
Example 8: revenue composition by district / city
Figure 8. Fiscal revenue composition in Gorontalo and individual districts, 2005
0
200
400
600
800
1,000
1,200
1,400
Gorontalo Bone Bolango Boalemo Pohuwato Kota Gorontalo
Own Source Revenue Shared Tax RevenueShared Natural Resource Revenue DAUDAK Shared Tax Revenue and Assistance from Prov.Adjustment Fund Other Revenue
Rp’0
00
The above graph compares the revenue composition in the district / city governments in Gorontalo. The graph suggests several trends:
(i) All district / city governments in Gorontalo derive most of their revenue from DAU.(ii) Several districts, including Bone Bolango, Baolemo and Pohuwato, received significant DAK transfers
compared with the remaining two districts.(iii) Kota Gorontalo has the highest level of PAD.
Further questions for consideration:Some typical follow-up questions might include:
• Why did the three districts receive higher levels of DAK compared to Kota Gorontalo or Kabupaten Gorontalo?
• Why does Kota Gorontalo has such a high level of PAD compared to the districts in Gorontalo?
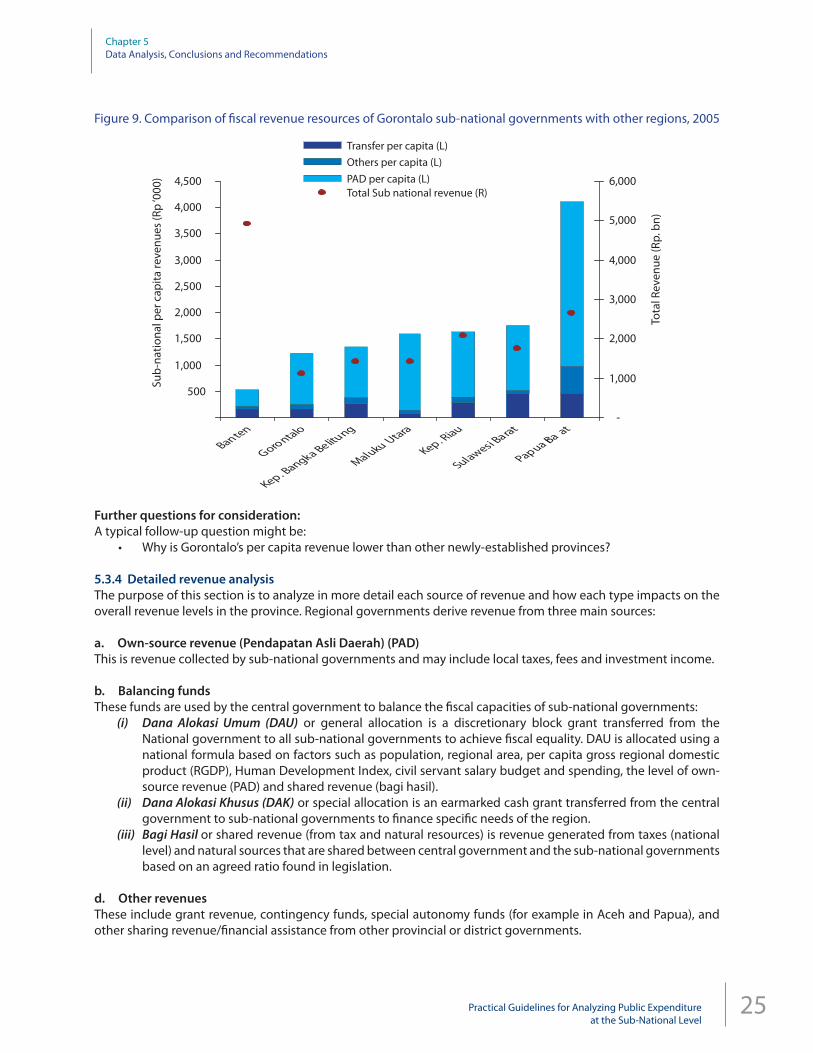
Example 9: comparison with other sub-national governmentsFigure 9 compares the per capita consolidated sub-national revenue in Gorontalo with other provinces in Indonesia. The other provinces selected are all provinces that were established in 1999, as part of Indonesia’s decentralization reforms. The graph shows that Gorontalo’s fiscal capacity is one of the weakest, amongst the newly-established provinces.
25Practical Guidelines for Analyzing Public Expenditureat the Sub-National Level
Chapter 5Data Analysis, Conclusions and Recommendations
Figure 9. Comparison of fiscal revenue resources of Gorontalo sub-national governments with other regions, 2005
500
1,000
1,500
2,000
2,500
3,000
3,500
4,000
4,500
aBtn
neoG
r noat ol
eK.p
aB ng akB
le i utgn
aMul
ukU
at ra
K pe. R ai u
uS l wase i B
rata
aPup
a B r ata
-
1,000
2,000
3,000
4,000
5,000
6,000
Transfer per capita (L)Others per capita (L)PAD per capita (L)Total Sub national revenue (R)
Sub-
natio
nal p
er c
apita
reve
nues
(Rp
‘000
)
Tota
l Rev
enue
(Rp.
bn)
Further questions for consideration:A typical follow-up question might be:
• Why is Gorontalo’s per capita revenue lower than other newly-established provinces?
5.3.4 Detailed revenue analysisThe purpose of this section is to analyze in more detail each source of revenue and how each type impacts on the overall revenue levels in the province. Regional governments derive revenue from three main sources:
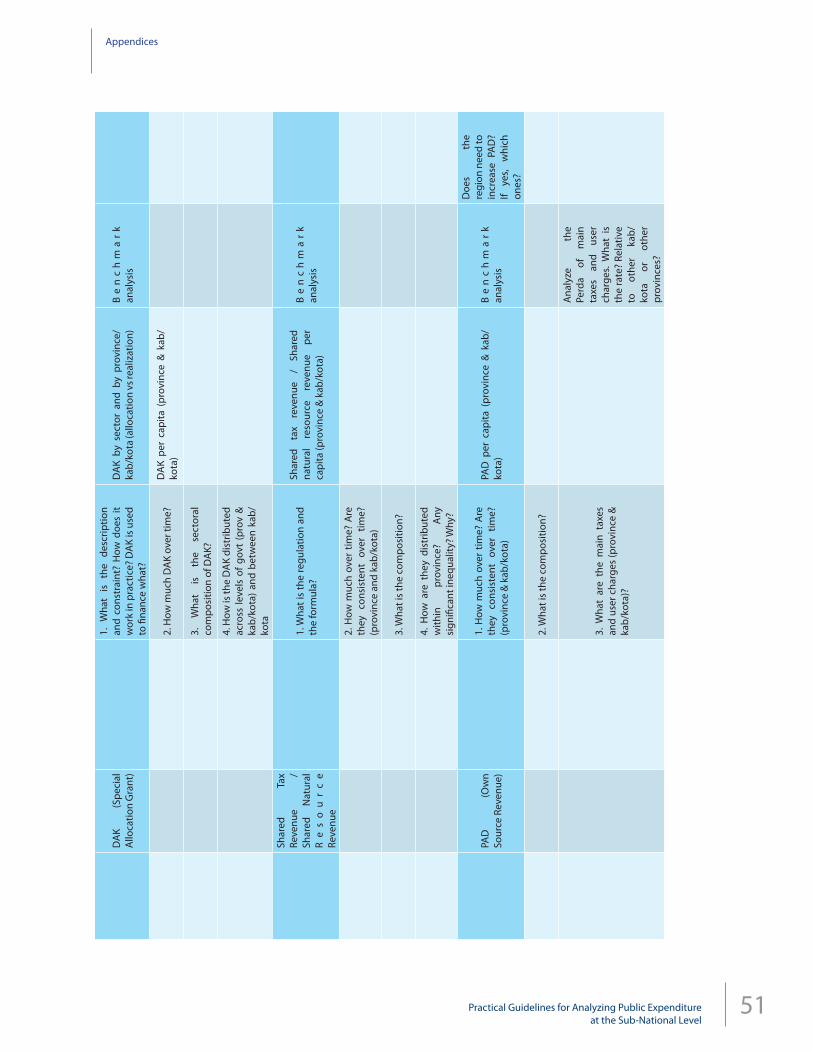
a. Own-source revenue (Pendapatan Asli Daerah) (PAD)This is revenue collected by sub-national governments and may include local taxes, fees and investment income.
b. Balancing funds These funds are used by the central government to balance the fiscal capacities of sub-national governments:
(i) Dana Alokasi Umum (DAU) or general allocation is a discretionary block grant transferred from the National government to all sub-national governments to achieve fiscal equality. DAU is allocated using a national formula based on factors such as population, regional area, per capita gross regional domestic product (RGDP), Human Development Index, civil servant salary budget and spending, the level of own-source revenue (PAD) and shared revenue (bagi hasil).
(ii) Dana Alokasi Khusus (DAK) or special allocation is an earmarked cash grant transferred from the central government to sub-national governments to finance specific needs of the region.
(iii) Bagi Hasil or shared revenue (from tax and natural resources) is revenue generated from taxes (national level) and natural sources that are shared between central government and the sub-national governments based on an agreed ratio found in legislation.
d. Other revenuesThese include grant revenue, contingency funds, special autonomy funds (for example in Aceh and Papua), and other sharing revenue/financial assistance from other provincial or district governments.
26 Practical Guidelines for Analyzing Public Expenditureat the Sub-National Level
Chapter 5Data Analysis, Conclusions and Recommendations
For each type of revenue, this section should also examine the following issues:• Trends over time: has total revenue increased or decreased over time? Why might this be? How does the
trend compare to other provinces in Indonesia or the Indonesian average? To compare with other prov-inces, the analysis must use per capita figures.
• Level of government: which level of government receives the sub-national revenue? Provincial govern-ment or district / city governments? Has this changed over time?
• Distribution across district / city: which district / city receives the highest levels of revenue? Which receives the lowest level of revenue? Why is there a difference? To compare between district / city, the analysis must use per capita figures.
• Planned v realized revenues: did the sub-national government realized the revenue it had planned to collect?
• Composition of revenue: for each type of revenue, what are the main factors that cause the increase or decrease of that revenue? How does the trend compare to other provinces in Indonesia?
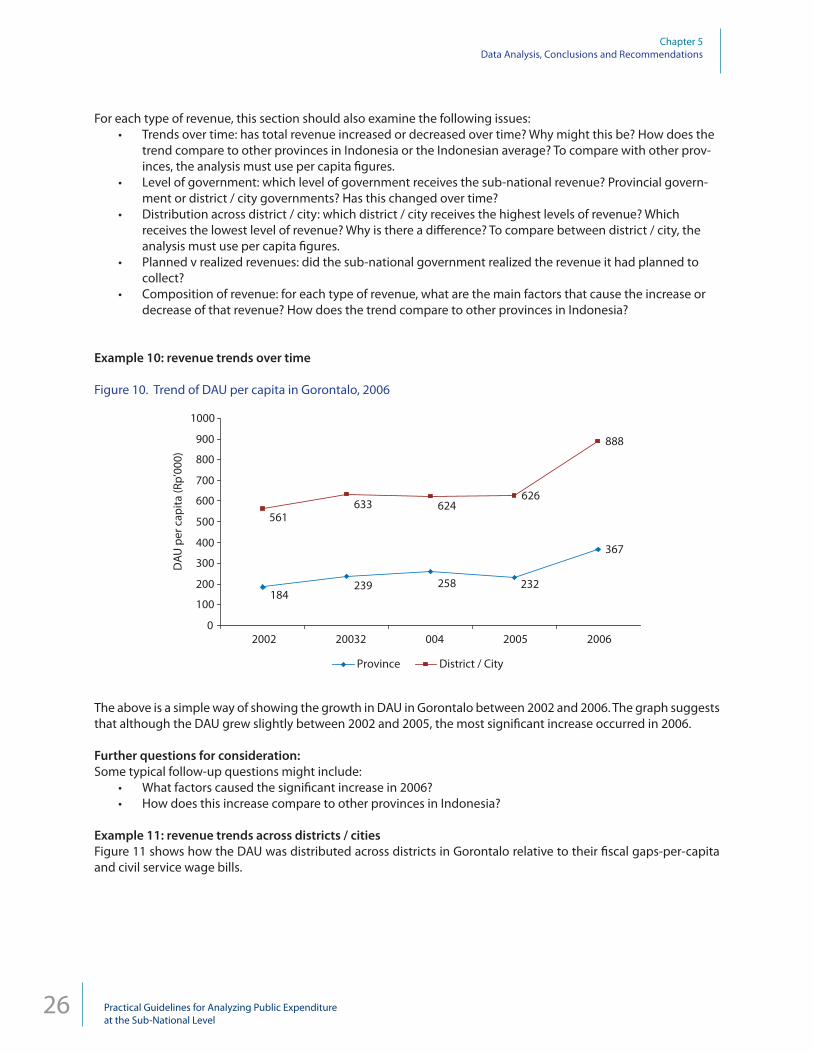
Example 10: revenue trends over time
Figure 10. Trend of DAU per capita in Gorontalo, 2006
367
626
888
232258239184
561633 624
0
100
200
300
400
500
600
700
800
900
1000
2002 20032 004 2005 2006
Province District / City
DAU
per
cap
ita (R
p’00
0)
The above is a simple way of showing the growth in DAU in Gorontalo between 2002 and 2006. The graph suggests that although the DAU grew slightly between 2002 and 2005, the most significant increase occurred in 2006.
Further questions for consideration:Some typical follow-up questions might include:
• What factors caused the significant increase in 2006?• How does this increase compare to other provinces in Indonesia?
Example 11: revenue trends across districts / citiesFigure 11 shows how the DAU was distributed across districts in Gorontalo relative to their fiscal gaps-per-capita and civil service wage bills.
27Practical Guidelines for Analyzing Public Expenditureat the Sub-National Level
Chapter 5Data Analysis, Conclusions and Recommendations
Figure 11. Distribution of DAU per capita in Gorontalo sub-national governments, relative to fiscal gap and wage bill
0.0
0.5
1.0
1.5
2.0
2.5
3.0
Gorontalo Boalemo Bone Bolango Kota Gorontalo Pohuwato00.20.40.60.81.01.21.41.61.82.0
DAU 2005 PC DAU 2006 PC Wage Bill PC Fiscal Gap PC
Rp m
illio
n
Rp m
illio
n
This figure suggests that the DAU allocation seems to be correlated with the size of a district’s wage bill. However, in some cases (for example, Kabupaten Pohuwato) the fiscal gap component compensates for a low wage bill. Fiscal gap is the difference between the expenditure needs of the district and the fiscal capacity of the district.
Further questions for consideration:A typical follow-up question might be:
• What are the factors that influence the size of the fiscal gap? For example, in Gorontalo, the fiscal gap in Kabupten Pohuwato is high because the district government provides services to a large land area; and because the cost of construction is high.
Example 12: DAK allocation by sectorFigure 12 shows the sectoral focus on DAK allocations. It suggests that in 2006, the majority of DAK was allocated to education, health and roads.
Figure 12. DAK allocations by sector in Gorontalo, 2006
Education23%
Health23%
Government4%
Agriculture10%
Fisheries5%
Roads24%
Water supply and sanitation
5%
Irrigation5%
Environment1%
28 Practical Guidelines for Analyzing Public Expenditureat the Sub-National Level
Chapter 5Data Analysis, Conclusions and Recommendations
Further questions for consideration:A typical follow-up question might be:
• What was the DAK used to finance (eg classrooms, health facilities, training, road infrastructure)?
One or two examples of DAK activities from district or provincial government should be provided.
The above table shows that Gorontalo exceeded its expectations and collected more shared tax revenue than expected, but generally did not meet expectations on non-tax shared revenue (natural resources). However, in 2004 and 2005, the district / city governments collected significantly more non-tax shared revenue than planned.
Further questions for consideration:A typical follow-up question might be:
• Why were some estimates of planned revenue under-estimated and others over-estimated?
29Practical Guidelines for Analyzing Public Expenditureat the Sub-National Level
Chapter 5Data Analysis, Conclusions and Recommendations
The above table, showing the composition of own-source revenue, suggests several trends:(i) Between 2002 and 2006, own-source revenue increased slightly, but still only represents a very small
percentage of total sub-national revenue.(ii) The provincial government collects a similar amount of own-source revenue as the district / city
governments. (iii) At the province level, the majority of own-source revenue is derived from taxes. In contrast, at the district
/ city level, over half of the own source revenue is from user charges.
Further questions for consideration:Some typical follow-up questions might include:
• What has caused the slight increase in PAD? How does the growth in PAD in this province compare to other provinces in Indonesia?
• Why are the majority of taxes collected by the province, not the district / city governments? What is the legal basis for collecting those taxes? Can the tax collection be improved by becoming more efficient or effective?
• What taxes/user charges are most commonly found in the province?• What types of services are the district / city governments providing in which they are collecting revenue?
How can the district / city government increase its own-source revenue?
Example 15: comparison of PAD across districts and cities
Figure 13. Own-source revenue per capita, district comparison, Gorontalo, 2005
0
20
40
60
80
100
120
140
160
Bone Bolango Gorontalo Boalemo Pohuwato Province Kota Gorontalo
Own-source revenue per capita
Rp’0
00
The above graph shows the level of own-source revenue collected by the sub-national governments in Gorontalo and suggests that Kota Gorontalo has a significantly higher level of PAD than other districts and the provincial government.
Further questions for consideration:A typical follow-up question might be:
• Why is PAD highest in Kota Gorontalo?
An explanation should be provided, such as: This may be because Kota Gorontalo is a city with a larger population and more economic activity than its rural districts, from which the government can impose user charges for a variety of services such as health services, rubbish collection, registration of motor vehicles, renting space in markets etc.
30 Practical Guidelines for Analyzing Public Expenditureat the Sub-National Level
Chapter 5Data Analysis, Conclusions and Recommendations
Example 16: comparison of taxes and user charges between districts
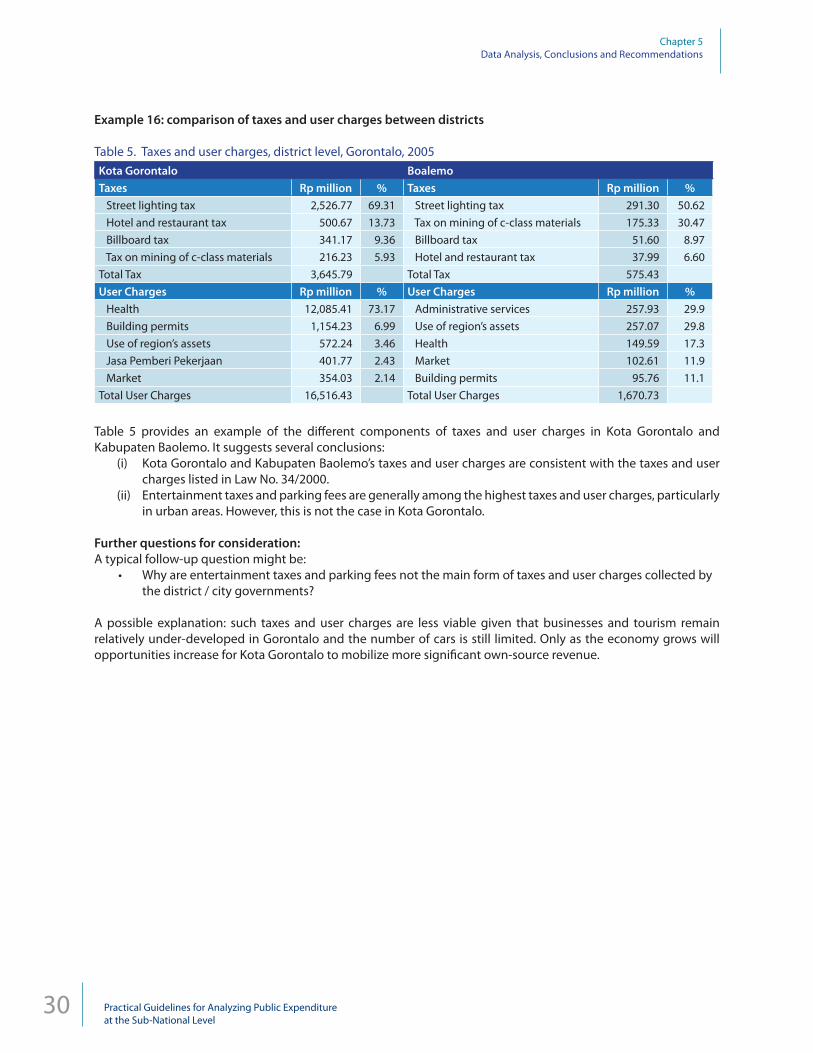
Table 5. Taxes and user charges, district level, Gorontalo, 2005Kota Gorontalo Boalemo Taxes Rp million % Taxes Rp million % Street lighting tax 2,526.77 69.31 Street lighting tax 291.30 50.62 Hotel and restaurant tax 500.67 13.73 Tax on mining of c-class materials 175.33 30.47 Billboard tax 341.17 9.36 Billboard tax 51.60 8.97 Tax on mining of c-class materials 216.23 5.93 Hotel and restaurant tax 37.99 6.60Total Tax 3,645.79 Total Tax 575.43 User Charges Rp million % User Charges Rp million % Health 12,085.41 73.17 Administrative services 257.93 29.9 Building permits 1,154.23 6.99 Use of region’s assets 257.07 29.8 Use of region’s assets 572.24 3.46 Health 149.59 17.3 Jasa Pemberi Pekerjaan 401.77 2.43 Market 102.61 11.9 Market 354.03 2.14 Building permits 95.76 11.1Total User Charges 16,516.43 Total User Charges 1,670.73
Table 5 provides an example of the different components of taxes and user charges in Kota Gorontalo and Kabupaten Baolemo. It suggests several conclusions:
(i) Kota Gorontalo and Kabupaten Baolemo’s taxes and user charges are consistent with the taxes and user charges listed in Law No. 34/2000.
(ii) Entertainment taxes and parking fees are generally among the highest taxes and user charges, particularly in urban areas. However, this is not the case in Kota Gorontalo.
Further questions for consideration:A typical follow-up question might be:
• Why are entertainment taxes and parking fees not the main form of taxes and user charges collected by the district / city governments?
A possible explanation: such taxes and user charges are less viable given that businesses and tourism remain relatively under-developed in Gorontalo and the number of cars is still limited. Only as the economy grows will opportunities increase for Kota Gorontalo to mobilize more significant own-source revenue.
31Practical Guidelines for Analyzing Public Expenditureat the Sub-National Level
Chapter 5Data Analysis, Conclusions and Recommendations
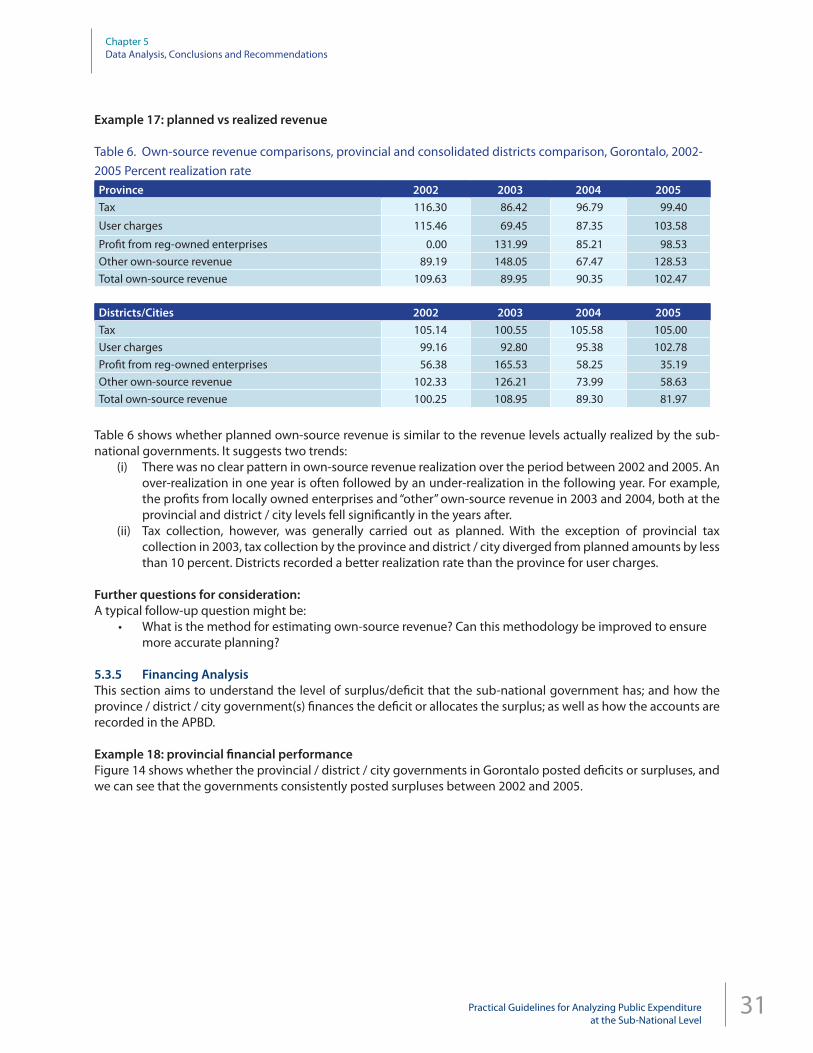
Table 6 shows whether planned own-source revenue is similar to the revenue levels actually realized by the sub-national governments. It suggests two trends:
(i) There was no clear pattern in own-source revenue realization over the period between 2002 and 2005. An over-realization in one year is often followed by an under-realization in the following year. For example, the profits from locally owned enterprises and “other” own-source revenue in 2003 and 2004, both at the provincial and district / city levels fell significantly in the years after.
(ii) Tax collection, however, was generally carried out as planned. With the exception of provincial tax collection in 2003, tax collection by the province and district / city diverged from planned amounts by less than 10 percent. Districts recorded a better realization rate than the province for user charges.
Further questions for consideration:A typical follow-up question might be:
• What is the method for estimating own-source revenue? Can this methodology be improved to ensure more accurate planning?
5.3.5 Financing AnalysisThis section aims to understand the level of surplus/deficit that the sub-national government has; and how the province / district / city government(s) finances the deficit or allocates the surplus; as well as how the accounts are recorded in the APBD.
Example 18: provincial financial performanceFigure 14 shows whether the provincial / district / city governments in Gorontalo posted deficits or surpluses, and we can see that the governments consistently posted surpluses between 2002 and 2005.
32 Practical Guidelines for Analyzing Public Expenditureat the Sub-National Level
Chapter 5Data Analysis, Conclusions and Recommendations
Figure 14. Surpluses and deficits, comparison among sub-national governments, Gorontalo, 2002-2005
-10
-5
0
5
10
15
2002 2003 2004 2005
Province Kota Gorontalo Bone Bolango Kab. Gorontalo Pohuwato Boalemo
% o
f tot
al e
xpen
ditu
re
Further questions for consideration:A typical follow-up question might be:
• What does the district / city generally do with the surplus? For example, does it invest the surplus or ac-cumulate it in the reserves?
Example 19: reporting of carryoversTable 7 shows the data reported in the financing section of the APBD as stipulated in Kepmendagri No. 29/2002.
Table 7 Carry-overs, comparison among sub-national governments, Gorontalo, 2006
Province Kota Gorontalo Bone Bolango Kab.
Gorontalo Pohuwato
Carry-over to 2006 10.16 12.25 0.49 4.30 14.17
Carry-over budgeted in 2006 6.49 12.25 - 4.30 14.17
Difference 3.67 - 0.49 - -
The table shows that in general, financing reports are poorly documented and carry-overs are inconsistently reported. For example, carry-overs reported in one budget year are often inconsistent with carry-overs budgeted in the following year. This poor reporting not only creates errors in the budget plans for the following year, but also increases the risk of budget malfeasance.
5.4 Expenditure chapter5.4.1 ObjectiveThe aim of this chapter is to understand how sub-national governments spend their budgets, how expenditure trends across time, how much money each level of government (central, provincial, district / city) spends in the province, as well as how money is spent across different economic classifications and sectors. The required figures are consolidated from all relevant district / city, as well as the provincial figures.
33Practical Guidelines for Analyzing Public Expenditureat the Sub-National Level
Chapter 5Data Analysis, Conclusions and Recommendations
The basic documents required to conduct the analysis are mainly budget documents (APBD) obtained from the budget offices or Bappeda.
5.4.2 Types of analysis requiredIn this section, the following topics would usually be discussed:
1. Overall spending picture 2. Sectoral spending analysis 3. Economic Classification Analysis 4. Local spending variation analysis5. Central government spending analysis
1. Overall spending picture This section aims to illustrate trends in total regional expenditure over time and how per capita regional expenditure varies across district / city, as well as comparing them with other provinces in Indonesia. An understanding of which level of government spends most money (central government, provincial or district / city) is also important.
Example 20: trends across time and between levels of government.Figure 15 shows the growth in expenditure in Gorontalo and to which level of government the funds are allocated.
Figure 15. Total spending, provincial level and consolidated districts, Gorontalo, 2002-2006
-
500
1,000
1,500
2,000
2,500
3,000
3,500
4,000
2002 2003 2004 2005 2006*0
100
200
300
400
500
600
700
District / City (L) Province (L)Deconcentrated (L) National Total (R)
Regional
expenditure (Rp bn)
Nat
iona
l exp
endi
ture
(Rp
trill
ion)
This figure suggests two trends:(i) Since 2002, expenditure in Gorontalo has increased significantly. Gorontalo’s sub-national spending,
which includes provincial and district level spending, has increased by more than 100 percent since 2002.(ii) The increase is more significant when central government deconcentrated spending is included in
consolidated regional spending. In the period between 2002 and 2006, deconcentrated spending grew almost tenfold and its contribution towards Gorontalo’s consolidated regional spending increased from 24 percent in 2002 to an estimated 60 percent in 2006.
Further questions for consideration:Some typical follow-up questions might include:
• What has caused the growth in deconcentrated spending? Why is it preferred to other forms of inter-governmental transfers?
• Is the growth and dominance in deconcentrated spending in Gorontalo consistent with the trend in other provinces in Indonesia?
34 Practical Guidelines for Analyzing Public Expenditureat the Sub-National Level
Chapter 5Data Analysis, Conclusions and Recommendations
Example 21: provincial per capita comparisonsFigure 16 shows the per capita spending in Gorontalo compared to other provinces in Indonesia. It shows that expenditure in Gorontalo is below the national average, but is similar to other provinces in Sulawesi.
Figure 16. Consolidated total spending per capita by province, 2005
0
0.51
1.5
22.5
3
3.5
44.5
5
Wes
t Jav
a
Cent
ral J
ava
Bant
en
East
Java
Lam
pung NTB
Nor
th S
umat
era
DI Y
ogya
kart
aSo
uth
Sum
ater
a
Wes
t Kal
iman
tan
NTT
Sout
h Su
law
esi
Wes
t Sum
ater
a
Beng
kulu
Sout
h Ka
liman
tan
Sout
h Ea
st S
ulaw
esi
Gor
onta
lo
Bali
Bang
ka B
elitu
ng
Jam
biD
KI Ja
kart
a
Nor
th M
aluk
uM
aluk
u
Cent
ral S
ulaw
esi
NA
D (A
ceh)
Riau
Cent
ral K
alim
anta
n
Papu
aEa
st K
alim
anta
n
Total Expenditure PC National Average
Per c
apita
regi
onal
spe
ndin
g (R
p ’0
00)
Nor
th S
ulaw
esi
Further questions for consideration:A typical follow-up question might be:
• What factors causes certain provinces to have much higher per capita expenditure and other provinces much lower per capita expenditure, in comparison to Gorontalo?
2. Sectoral spending analysis This section looks at consolidated local spending categorized by sectoral classifications. The section should explain the current budget format, changes in the budget format and how spending is classified across a 5 to 6 year time span. Overall, the section should analyze the types of expenditure that dominate regional spending over time at the provincial and district levels. The focus of this analysis usually looks at four key sectors:
(i) government apparatus(ii) education(iii) health(iv) infrastructure
For the analysis of trends over time, constant price values are preferable.
35Practical Guidelines for Analyzing Public Expenditureat the Sub-National Level
Chapter 5Data Analysis, Conclusions and Recommendations
Figure 17 shows consolidated sectoral spending (province, district and city) according to sectors. It shows several trends:
(i) The proportion spent on government administration and apparatus increased significantly from 24 percent in 2002 to 37 percent in 2006.
(ii) The proportion of total expenditure spent on education has decreased since 2002.(iii) The proportion of total expenditure spent on infrastructure has increased, while the proportion spent on
health has remained relatively constant.
Further questions for consideration:Some typical follow-up questions might include:
• What are the factors that have caused the increases and decreased in spending in the respective sectors? For example, why does the Gorontalo government spend so much more on administration and appara-tus in 2006 compared to 2002?
• Why has the proportion of spending on education decreased?• How does Gorontalo’s sectoral spending composition compare to other provinces in Indonesia? For
example, do other provinces also spend more than one third of their expenditure on administration and apparatus?
• How can the sectoral spending mix be improved?
3. Economic Classification Analysis This section looks at consolidated local spending categorized by economic classifications. The section should explain the current budget format, changes in the budget format and how spending is classified across a 5- to 6-year time span. This section should also explain ways to address different budget format and what should be compromised in order to make time series comparison possible. Overall, the section should analyze the type of expenditure that dominates regional spending over time at the provincial and district levels. For trend analysis, constant price values are preferable.
36 Practical Guidelines for Analyzing Public Expenditureat the Sub-National Level
Chapter 5Data Analysis, Conclusions and Recommendations
Example 22: breakdowns of consolidated spendingTable 8 shows the spending mix according to economic classification.
Table 8. Provincial and districts consolidated spending based on economic classification, Gorontalo, 2002-2006
2002 2003 2004 2005 2006*
Province Rp bn % Rp bn % Rp bn % Rp bn % Rp bn %
Personnel 15 8 51 20 81 30 66 26 91 23
Goods and services 14 7 36 14 43 16 51 20 130 33
Travel 4 2 17 7 22 8 27 11 0 0
Maintenance 2 1 4 2 6 2 8 3 0 0
Capital 121 64 111 44 74 28 70 28 115 29
Others 34 18 32 13 41 15 31 12 55 14
Total 190 100 251 100 267 100 252 100 391 100
2002 2003 2004 2005 2006*
Districts/Cities Rp bn % Rp bn % Rp bn % Rp bn % Rp bn %
Personnel 282 51 356 49 409 54 405 52 510 46
Goods and services 19 3 78 11 81 11 135 17 186 17
Travel 6 1 15 2 18 2 18 2 12 1
Maintenance 4 1 22 3 30 4 12 1 6 1
Capital 206 37 230 32 197 26 175 22 314 28
Others 36 7 22 3 25 3 40 5 88 8
Total 553 100 722 100 760 100 784 100 1,115 100
The table shows several observable trends:(i) At the province level, approximately one-third of total expenditure is spent on goods and services, with
another 29 percent on capital spending. Personnel spending consumes 23 percent of total provincial expenditure. The amount spent on capital spending has varied significantly between years, from nearly two-thirds in 2002, to below one-third in 2006, whilst spending on personnel has tripled over the same period.
(ii) At the district / city level, almost half of total expenditure is spent on personnel, twice that of the provincial government. The district / city governments spent a similar proportion on capital works, but only 17 percent of total expenditure on goods and services: half the proportional amount spent at the Province.
Further questions for consideration:Some typical follow-up questions might include:
• Why has spending on personnel and goods and services increased so significantly at the provincial level? Is this trend due to an increase in the number civil service staff, salaries, or other associated costs?
• Why is such a large proportion of district / city expenditure spent on personnel expenditure? How does this level compare to other provinces in Indonesia?
• What sort of infrastructure has built from the capital expenditure? For example, have the funds been spent on government buildings, hospitals, schools, roads or bridges?
37Practical Guidelines for Analyzing Public Expenditureat the Sub-National Level
Chapter 5Data Analysis, Conclusions and Recommendations
4. Local spending variation analysisIn this section comparisons across districts are analyzed. District-level comparison provides useful information on overall spending levels and the spending mix. For instance, this may cover the level of per capita spending, the level of capital expenditure, and the level of sectoral or economic classification spending. Some key questions to investigate further would include:
• which districts have the highest level of per capita spending? • which districts have the highest level of per capita education / health / infrastructure / personnel spend-
ing?
Where possible, use graphs to illustrate where there are differences, such as Figure 18 below.
Example 23: district expenditure comparisonsFigure 18 compares the per capita spending of the different districts and cities in Maluku province. It shows that the per capita expenditure in Kabupaten Maluku Tenggara Barat is twice the size of that in Kota Ambon.
Figure 18. Central government deconcentrated spending per capita by province, 2005
0
500
1,000
1,500
2,000
2,500
3,000
3,500
4,000
4,500
Rp ‘0
00
Per Capita Expenditure Per Capita Revenue
Kab. M. Ten Bar
Kab. Kep. Aru
Kab. SBT Kab. SBB Kota Ambon
Kab. M. Tengah
Kab. BuruKab. M. Tenggara
Source: SIKD, MoF (2009)Note: Figures are World Bank estimates
Further questions for consideration:A typical follow-up question might be:
• Why do certain districts have much higher per capita revenue than other districts and Kota Ambon?
A possible explanation: newly established district generally have higher levels of per capita revenue. This may be due to the costs required in establishing the government structure (personnel and infrastructure). Comparisons with other newly established district would then be useful.
5. Central government spending analysisIn this section an analysis of spending by the central government at the provincial / district / city level is conducted with a focus on three key sectors, namely health, education and infrastructure. Such spending includes deconcentrated and Tugas Pembantuan (TP) funds. To some degree, central government spending also requires some cost sharing or additional financing from the APBD, which should be explained.
38 Practical Guidelines for Analyzing Public Expenditureat the Sub-National Level
Chapter 5Data Analysis, Conclusions and Recommendations
Example 24: comparison with other Indonesian provincesFigure 19 shows that in comparison to other provinces, Gorontalo has received a relatively high level of deconcentrated spending from the central government.
Figure 19: Central government deconcentrated spending per capita by province, 2005
-
50
1,00
1,50
2,00
2,50
3,00
3,50
Bante
n
W
est Ja
va
Central J
ava
Ea
st Ja
vaRiau
Lam
pung
National
avera
geNTB
South
Sum
atera
Bali
Jam
bi
Bangka
Belitung
NTT
Bengkulu
Goronta
lo
Pap
ua
Dec
once
ntra
ted
spen
ding
pe
r cap
ita (R
p’00
0)
North Su
mat
era
South
Sulaw
esi
West
Kalim
anta
n
South
Kalim
anta
n
DI Yogya
karta
South
East
Sulaw
esi
Central S
ulawesi
East
Kalim
anta
n
North Su
lawesi
NAD (Ace
h)
Central K
alim
anta
n
North M
aluku
Malu
ku
West
Sum
atera
Further questions for consideration:A typical follow-up question might be:
• Why did Gorontalo receive such a high level of deconcentrated spending?
Example 25: central government spending
Figure 20 Central government spending on decentralized sectors, province and districts, 2005
0
100
200
300
400
500
600
700
Agriculture Health Administrationand apparatus
InfrastructurO thersE ducation
Rp b
n
Province District / City Deconcentrated Spending
39Practical Guidelines for Analyzing Public Expenditureat the Sub-National Level
Chapter 5Data Analysis, Conclusions and Recommendations
Figure 20 shows the sectoral focus on deconcentrated funds, which suggests several trends:(i) Deconcentrated funds are rarely used for government administration and apparatus.(ii) Apart from administration and apparatus, deconcentrated funds are a dominant source of funds for all
other sectors, especially health and agriculture.
Further questions for consideration:Some typical follow-up questions might include:
• How have deconcentrated funds been used? Have central government funds been used to build ad-ditional infrastructure, or to run new programs? What changes have there been as a result of central government spending?
• How does the central government decide on how to allocate deconcentrated funds?• When are general allocations funds (Dana Alokasi Umum (DAU)) used, rather than special allocation
funds (Dana Alokasi Khusus (DAK))• How does the central government identify initiatives suitable for deconcentrated funding?
5.5 Strategic sectors5.5.1 ObjectiveThe aim of this chapter is to look at more detailed spending in the three strategic sectors of education, health and infrastructure, as well as to gauge the available fiscal resources for each strategic sector. A discussion of performance indicators available at the local level is also conducted by linking them to existing trends in spending in the past 5 to 6 years. A comparison between districts and across provinces, as well as with national figures, will be useful in providing insights. The required figures are consolidated from all districts/ cities, as well as the provincial figures.The basic documents required to conduct the analysis are mainly budget and planning documents at the Dinas level.
5.5.2 Types of analysis requiredThe type of analysis required to write this chapter includes:
1. Breakdown analysis for each strategic sectors spendingThis section contains a detailed analysis of the strategic sectoral spending. This is achieved by looking at how much is spent within each sector according to economic classification, as well as according to major programs within the sector/Dinas.
Figure 21. Trends in sub-national education spending, Gorontalo, 2002-2005
266382 368
654
2926
2525
0
100
200
300
400
500
600
700
2002 2003 2004 2005
Rp
bn
(con
stan
t 200
5 pr
ices
)
0
5
10
15
20
25
30
35
Regional Expenditure (L) share of total (R)
%
40 Practical Guidelines for Analyzing Public Expenditureat the Sub-National Level
Chapter 5Data Analysis, Conclusions and Recommendations
Figure 21 shows that although total education spending has increased significantly, the proportion of total expenditure spent on education has actually decreased from 29 percent in 2002 to 25 percent in 2005.
Further questions for consideration:Some typical follow-up questions might include:
• What types of programs did the increased budget focus on? For example, did the increased funding go towards improving the quality of teaching, or improving access to education, or improving literacy rates?
• How does the level of education spending in Gorontalo compare to other provinces in Indonesia?
Example 27: comparisons with other provincesFigure 22 shows Gorontalo’s sub-national education spending (district and provincial) in comparison with other provinces in Indonesia. Overall, education spending in Gorontalo is higher than average. This applies whether comparing education expenditure as a share of total spending or per capita spending.
Figure 22. Sub-national education spending per student enrolled in primary and secondary school by province, 2005
500
1,000
1,500
2,000
2,500
3,000
%
0
5
10
15
20
25
30
35
40
Sub-national education expenditure (per student enrolled in primary and secondary school (L)
Share of sub-national education expenditure (R)
Rp ‘0
00
Jaw
a Ba
rat
Jaw
a Te
ngah
Bant
en
Jaw
a Ti
mur
Lam
pung
NTB
Sum
ater
aUta
ra
DI Y
ogya
kart
a
Sum
ater
a Se
lata
n
Kalim
anta
n Ba
rat
NTT
Sula
wes
i Sel
atan
Sum
ater
a Ba
rat
Beng
kulu
Kalim
anta
n Se
lata
n
Sula
wes
i Ten
ggar
a
Sula
wes
i Ten
ggar
a
Gor
onta
lo
Bali
Bang
ka B
elitu
ng
Jam
bi
DKI
Jaka
rta
Mal
uku
Uta
ra
Mal
uku
Papu
a Ba
rat
NA
D (A
ceh)
Riau
Kalim
anta
n Te
ngah
Papu
a
Kalim
anta
n tim
ur
Sula
wes
i Bar
at
Sula
wes
i Uta
raKe
p. R
iau
Nat
iona
l
In 2005, Gorontalo’s sub-national spending per school-aged student enrolled in primary and secondary schools was Rp 1.3 million per capita, Rp 311,000 higher than the national average of Rp 990,000. Meanwhile, Gorontalo’s district and provincial governments spent 27 percent of their total expenditure on education, 2 percentage points higher than the national average.
Example 28: availability of resources for educationTable 9 shows the total fiscal resources made available to the education sector by the different levels of government (district / city, province and central governments).
41Practical Guidelines for Analyzing Public Expenditureat the Sub-National Level
Chapter 5Data Analysis, Conclusions and Recommendations
Table 9. Available fiscal resources for education, province + districts + deconcentrated, 2002-20052002 2003 2004 2005
Rp bn % Rp bn % Rp bn % Rp bn %
Province expenditure 6.3 2 14.1 4 11.7 3 13.9 2
District expenditure 191.2 72 257.1 67 264.9 72 252.9 39
Nominal total regional education expenditures 218.9 326.8 334.3 654.1
Growth real total regional education expenditures 30.3 -3.9 43.8
Education expenditure (% of total regional) 28.80 26.43 25.22 24.64
This table suggested several trends:(i) Between 2002 and 2004, the majority of the education budget was spent by the district / city government.(i) In 2005, however, deconcentrated expenditure became the largest proportion of total education spending.(ii) Although education expenditure increased in 2003 (in real terms), it actually fell slightly in 2004 (3.9
percent) but increased significantly again in 2005 (43.8 percent).
Further questions for consideration:Some typical follow-up questions might include:
• Why did deconcentrated expenditure increase so significantly in 2005? What was the change in govern-ment policy that precipitated this growth?
• Why did real education spending decrease in 2004 but increased in 2003 and 2005? Which factors caused this fluctuation in spending allocations? What new programs were added in 2003 and 2005 to merit the increase in expenditure?
Figure 23. Economic classification of education spending, Gorontalo, 2005
Districts/cities
1 % 11 %
2 %
86 %
Travel, maintenance,and otherCapital
Goods and services
Personnel
Province
Travel, maintenance,and otherCapital
Goods and services
Personnel
7 %
25 %
31 %
37 %
42 Practical Guidelines for Analyzing Public Expenditureat the Sub-National Level
Chapter 5Data Analysis, Conclusions and Recommendations
Figure 23 shows that the spending mix at district level differs to the education spending mix at the provincial level:(i) At the district level, all but 3 percent of total education expenditure is spent on either personnel or capital.
This suggests that the majority of funds are spent on teachers or infrastructure (such as schools). It also highlights that very little funding is spent on the maintenance of schools and classrooms.
(ii) In contrast, the provincial government spends a significant proportion of its education budget on goods and services and also a small portion on travel and maintenance.
Further questions for consideration:After analyzing APBD documents further, some typical follow-up questions might include:
• What types of personnel did the district government hire, and for what purpose?• How was capital works spending used, and how much of this was used on maintenance?• What are the identified priorities of the education sector in the province and does the budget allocation
reflect a focus on these priorities?
2. Performance analysis for each strategic sectorThis section contains comparisons between spending on strategic sectors over time (5 to 6 years ideally) with changes in performance indicators specifically identified for each sector. These can be based on inputs, outputs or outcomes. The following indicators are examples of those used in the education, health and infrastructure sectors:
Suggested indicators for education:• Educational attainment by year of birth • Access to public primary education by income group • Trends in net and gross enrollment rates for primary and secondary education• Student/teacher ratio, student/classroom ratio, average year of schooling
Suggested indicators for health:• Health services utilization • Public health facility utilization by income groups• Access to healthcare services by income group• Per capita monthly out-of-pocket health spending• Morbidity rate• Doctor/population ratio
Suggested indicators for infrastructure:• Irrigation coverage and access to road infrastructure• Access to safe water and electricity • Quality of sanitation, clean water and sanitation• Quality and quantity of road infrastructure
Each performance indicator may be analyzed according to improvements (or deteriorations) over time, comparisons between districts / cities / provinces, and comparisons with national averages.
Chapter 6
43Practical Guidelines for Analyzing Public Expenditureat the Sub-National Level
Chapter 6Writing the PEA Report
Chapter 6Writing the PEA Report
Based on experience, there are some common errors that many writers make. This chapter aims to provide some guidance on how writers can avoid those common mistakes.
6.1 Know your audienceIn writing a PEA report, not only is it important to remember that the report is intended to be read by a diverse audience, but also that the core audience consists of key policy-makers at the central and local levels. Policy-makers typically receive a great many reports, some of which may be very thick and filled with lengthy explanations. It is important to remember that the reader a) may not have time to read because of other time demands; b) may have many other tasks to complete; and c) may not have in-depth knowledge of the topic of the report or of technical jargon. We observe that many reports remain unread because they are too thick, contain overly complicated explanations, or because the material is not presented in an interesting format. A PEA report should avoid these shortcomings.
6.2 Common mistakes in report writing As mentioned above, PEA reports should avoid common shortcomings in government reports. To do so, here are some ways to avoid common mistakes:
Keep it short! PEA reports must be concise and to the point. Avoid repetition and complicated or roundabout language. Use precise, unambiguous terms.
Include a glossary: This is necessary to help those with a non-technical background to understand the acronyms and abbreviations that apppear in the text.
Avoid jargon and long sentences: Use simple, specific, precise sentences. Avoid particularly lengthy sentences. If the sentence is longer than three lines then it is too long. Use words that people without a finance or economics background will understand.
Only include relevant material: Analysis should be objective, relevant and specific.
Link paragraphs: Paragraphs should be logically ordered, and maintain a clear flow.
Keep to one idea per paragraph: Sentences in each paragraph should also be logically ordered and clearly inter-connected. A controlling idea for each paragraph will help to guide effective use of words and maintain a clear flow between sentences.
Use graphs and tables: A picture speaks a thousand words. Where possible, explain your analysis with a graph or a table
Reference clearly : If the materials from other sources are used, reference clearly. In addition to data from government department, these include other academics, reports, ets. Do not plagiarize.
44 Practical Guidelines for Analyzing Public Expenditureat the Sub-National Level
Chapter 6Writing the PEA Report
A final checklist : Once the PEA is finished, every section should be reread and the following questions asked:
- Are all important findings covered?- Do the contents follow logically from the team’s findings? Are there contradictory findings that need to be
explained specifically? - Are there overlapping explanations that need to be tidied up?- Are there points of substance that have not been clearly articulated?
6.3 Consistent format, clear structureOne of the simplest errors researchers make is using an inconsistent report format. The minimum PEA outline found in Section 1.4 and Appendix 1 refer to the content of the body of the report. This section, however, refers to how the report is formatted. For example, are headings consistent? Are graphs and tables labelled in an easy to read manner? Is there a table of contents page? Is there a list of tables and graphs? Is there a list of references? Below are some simple tips with formatting your report.
• Every chapter needs a title typed in the same font with the same size of letters.
• To assist the reader, structure each chapter into sections and sub-sections as required. Each section and sub-section must include a heading that uses a consistent font. The hierarchy should be presented clearly, for instance by using capital letters, italics, underlining or bold for section and sub-section titles. This hierarchy should be reproduced in the table of contents.
• Tables, graphs and images must be enumerated clearly and consistently. Each table, graph and image must also have a title typed in a font distinct from the body text.
• Tables, graphs and images must cite the relevant data source.
• As each chapter focuses on a specific thematic area, report recommendations are best written per chapter as the final section of each chapter
ChecklistBelow is a checklist that all PEA reports should include:
1. Cover 2. Title page
Includes report title; names of members of research team; the organizations that commissioned the report; the draft status (e.g. first draft, second draft, final draft), and the date of completion/submission.
3. Table of Contents4. Lists of tables5. List of graphs6. List of images7. List of annexes
[Table of contents, list of tables, lists of graphs, list of images and list of annexes should be accurate with clear layout (including indentation) and include page numbers]
8. Glossary 9. Contents of report (body)
45Practical Guidelines for Analyzing Public Expenditureat the Sub-National Level
Chapter 6Writing the PEA Report
As suggested in this Manual, a report may contain the following chapters:i. Overview 1. Section 1 a. Sub-section 1 b. Sub-section 2
2. Section 2ii. Planning and Budgetingiii. Revenueiv. Spendingv. Sectoral Chapter
10. References11. Annexes
6.4 Writing the PEA report as a teamPEA reports are often written by a team with different members of the team responsible for writing different sections of the report. Although this sharing of work means more data can be collected and analyzed, it also runs the risk that each researcher will write with different writing styles and use different formats. From the outset, the team should agree upon the font, font size, line spacing, spacing between sections and sub-sections, and other details pertaining to report formatting. While each member of the team is responsible for ensuring that each person’s work is consistent with the overall report, the team leader is responsible for editing the report to ensure consistency across the work of the different researchers.
6.5 Further referencesThe websites below provide further guidance on report writing:
University of South Australia, Report Writing (cited June 17, 2008), http://www.roma.unisa.edu.au/07118/language/reports.htm
The International Development Research Centre, Writing A Research Report (cited June 17, 2008), http://www.idrc.ca/en/ev-56466-201-1-DO_TOPIC.html
6.6 Extra tips: some lessons learnedBased on the experience of researchers conducting PEA, we have compiled some additional tips and tricks that will help the researcher write a better PEA report. The following illustrate some of the common problems that arise in PEA reports:
Always ask “why”?The most common trap that researchers fall into when writing a PEA report is that while they describe the trend very well they forget to follow up that description with an explanation of why the trend occurred. For example, if the trend shows that per capita revenue increased between 1999 and 2005, then the question is why has this happened? Is this caused by an increase in DAU, DAK or PAD? If caused by DAU, why has the DAU increased? Has the fiscal capacity increased? Or has the PAD increased? If so, then why? Has the tax collection been more efficient? Or are more businesses registered and therefore there is more registration tax?
The above example shows that simply explaining that the PAD has increased is insufficient. When writing, always try to think from the readers’ perspective. In the above example, the audience will automatically ask: why has the
46 Practical Guidelines for Analyzing Public Expenditureat the Sub-National Level
Chapter 6Writing the PEA Report
PAD increased? The audience will expect to find a policy or behavioral reason that explains the trend. For example, was there a new type of PAD allowed by regulation? Or has the sub-national government put more attention on collecting local taxes? If there is a trend, there is generally a reason explaining why this trend occurred and a good researcher will always ask “why”.
Go beyond the minimum:This manual has discussed at length how to fulfill the minimum requirements for a PEA. In addition to meeting the minimum standard, researchers are encouraged to include research ideas of their own that will contribute to the overall quality of the research and the recommendations. The PEA structure is dynamic and researchers should not feel restricted to the methodologies and indicators proscribed by this manual. Some ways of going beyond the minimum include:
• Collecting more data: The researcher should feel free to collect more data than that set out in Appendix 2. This may include adding new outcome indicators in health, education and infrastructure, increasing the data time span (i.e. 10 years is better than five), or obtaining more detailed APBD information by sourcing more detailed expenditure reports from the relevant Dinas. All of these will help to improve the depth of the PEA analysis considerably.
• Using other methodologies: Chapter 4 outlines some suggested methodologies for analyzing data. Researchers should not be constrained to using only those methodologies found in Chapter 4.
• Analyzing other sectors: The PEA has a focus on public service delivery so the sectoral focus is inevitably on the education, health and infrastructure sectors. However, researchers should feel free to identify other sectors of particular interest to the government or the researcher him/herself. For example, agriculture and fisheries are often important sectors to some provinces, and this may be another sector of interest in the PEA.
In all instances, researchers may face data limitations and must be mindful that to do meaningful analysis and draw sensible conclusions the data still need to be detailed, accurate, comparable and timely.
Rounding:One final minor although important tip is that when presenting analysis try to round numbers to a level that the reader will find easy to read while detailed enough to remain meaningful. For example, the per capita revenue for a province is Rp 95,698 in kabupaten 1, but and Rp 98,374 for kabupaten 2. In this instance, rounding is not required because all numbers are needed to show the difference between kabupaten 1 and 2. However, if the comparison is the total revenue for kabupaten 1 is Rp 128,476,890,346.00, while the total revenue for kabupaten 2 is Rp 130,900,087,756.00, then the numbers should be rounded to the nearest billion rupiah to become Rp 128 billion and Rp 131 billion, respectively. Another rounding method is to use decimals. In the second example, the rounded numbers become Rp 128.48 billion and Rp 130.9 billion, respectively. In both methods, the numbers are much easier to read and comprehend. It is up to the researcher how she or he chooses to round, but the researcher should be vigilant about consistency in rounding.
47Practical Guidelines for Analyzing Public Expenditureat the Sub-National Level
Appendices
App
endi
ces
App
endi
x 1:
PEA
Sta
ndar
d O
utlin
e
Chap
ter
Key
Sect
ions
Purp
ose
Key
Que
stio
nsKe
y In
dica
tors
Key
Proc
esse
sKe
y Po
licy
Ex
ec
ut
iv
e Su
mm
ary
Intr
oduc
tion
Ad
min
istr
ativ
e co
ntex
t
To
prov
ide
brie
f de
scrip
tion
of c
onte
xt
of
the
regi
onal
ad
min
istr
ativ
e ar
eas
Adm
inis
trat
ive
cont
ext
Num
bers
of k
abup
aten
, kot
a, a
nd
the
size
of
each
adm
inis
trat
ive
regi
on
Geo
grap
hy
&
popu
latio
n
To
desc
ribe
loca
tion
and
popu
latio
n of
the
pr
ovin
ceLo
catio
nM
ap o
f pro
vinc
e
Pie
grap
h sh
owin
g la
ndm
ass
and
cont
ribut
ion
of
kabu
pate
n/ko
ta
land
mas
s to
tota
l pro
vinc
e ar
ea
Popu
latio
nPi
e gr
aph
show
ing
tota
l nu
mbe
r of
po
pula
tion
per k
abup
aten
/kot
a
Gra
ph s
how
ing
tren
d of
pop
ulat
ion
grow
th
Brie
f ex
plan
atio
n on
et
hnic
co
nfigu
ratio
n, h
isto
ry o
f go
vern
ance
, et
c (if
pos
sibl
e)
Econ
omy
To d
escr
ibe
loca
l eco
nom
ic
deve
lopm
ent:
econ
omic
st
ruct
ure,
gr
owth
, em
ploy
men
t, lo
cal i
ssue
s.
Wha
t is
the
eco
nom
ic s
truc
ture
of
th
e pr
ovin
ce?
Wha
t se
ctor
s do
min
ate?
Gra
ph s
how
ing
stru
ctur
e of
eco
nom
y
Has
the
gro
wth
rate
incr
ease
d or
de
crea
sed
over
tim
e? W
hy?
Gra
ph
show
ing
RGD
P gr
owth
by
se
ctor
Is
the
prov
inci
al
grow
th
rate
hi
gher
or
lo
wer
th
an
natio
nal
grow
th ra
te?
Line
gra
ph s
how
ing
prov
inci
al a
nd
the
natio
nal p
rovi
ncia
l gro
wth
rat
e of
RG
DP
Wha
t se
ctor
s co
ntrib
ute
mos
t to
em
ploy
men
t?G
raph
sh
owin
g st
ruct
ure
of
empl
oym
ent
48 Practical Guidelines for Analyzing Public Expenditureat the Sub-National Level
Appendices
Whi
ch e
mpl
oym
ent
sect
ors
are
grow
ing
the
fast
est?
Sl
owes
t?
Why
?
Gra
ph s
how
ing
empl
oym
ent
grow
th
by s
ecto
r
Is
the
prov
inci
al
empl
oym
ent
grow
th ra
te h
ighe
r or l
ower
than
na
tiona
l em
ploy
men
t gr
owth
ra
te? W
hy?
Line
gra
ph s
how
ing
prov
inci
al a
nd
the
natio
nal p
rovi
ncia
l gro
wth
rat
e of
em
ploy
men
t
Wha
t ar
e so
me
spec
ific
loca
l ec
onom
ic
prob
lem
s?
E.g.
m
alnu
triti
on?
Confl
ict?
W
hat
caus
ed th
ese
spec
ific
prob
lem
s?
Spec
ific
issu
es
on
loca
l ec
onom
y pr
oble
m a
nd c
hala
nge
Pove
rty
To
desc
ribe
pove
rty
cond
ition
s co
mpa
red
with
na
tiona
l con
ditio
n
Is
the
prov
inci
al
pove
rty
rate
hi
gher
tha
n th
e na
tiona
l pov
erty
ra
te?
Or l
ower
?
Gra
ph s
how
ing
pove
rty
head
coun
t of
th
e pr
ovin
ce a
nd n
atio
nal p
rovi
ncia
l
Has
po
vert
y ra
te
incr
ease
d or
de
crea
sed
over
tim
e?G
raph
sho
win
g tr
end
of p
rove
rty
HD
I and
SPM
Des
crib
e th
e cu
rren
t le
vel
of H
uman
D
evel
opm
ent I
ndex
and
the
min
imum
se
rvic
e st
anda
rds
Plan
ning
an
d B
ud
ge
tin
g (B
ud
ge
tin
g Cy
cle)
1. T
o de
scrib
e th
e na
tiona
l pl
anni
ng
and
budg
etin
g fr
amew
ork.
2. T
o as
sess
whe
ther
loc
al
plan
ning
an
d bu
dget
ing
proc
esse
s fo
llow
th
e na
tiona
l fra
mew
ork.
3. T
o as
sess
the
cons
iste
ncy
of
plan
ning
do
cum
ents
an
d w
heth
er
cons
iste
nt
with
the
natio
nal p
lan.
4.
To
asse
ss
whe
ther
th
e bu
dget
re
flect
s th
e de
velo
pmen
t pr
iorit
ies
foun
d in
th
e pl
anni
ng
docu
men
ts.
Pl
an
ni
ng
Proc
esse
s
To
asse
ss
whe
ther
pr
ovin
cial
and
dis
tric
t pl
anni
ng
follo
w
the
natio
nal g
uide
lines
Wha
t pl
anni
ng
docu
men
ts
are
requ
ired
by n
atio
nal
guid
elin
es?
Hav
e th
e su
b-na
tiona
l go
vern
men
ts
prod
uced
th
ose
docu
men
ts
Num
ber o
f pla
nnin
g do
cum
ents
Are
th
e pl
anni
ng
docu
men
ts
subm
itted
ac
cord
ing
to
the
natio
nal t
imel
ine?
Dat
e w
hen
plan
ning
doc
umen
ts
subm
itted
49Practical Guidelines for Analyzing Public Expenditureat the Sub-National Level
Has
th
e pl
anni
ng
proc
ess
follo
wed
the
pro
cess
set
out
by
the
natio
nal g
uide
lline
s?Co
mpa
re th
e pl
anni
ng p
roce
sses
Bu
dg
et
ing
Proc
esse
s
To
asse
ss
whe
ther
pr
ovin
cial
and
dis
tric
t bu
dget
ing
follo
ws
the
natio
nal g
uide
lines
Is
each
ye
ar’s
budg
et
docu
men
t fo
llow
ing
the
form
at
requ
ired
by
the
natio
nal r
egul
atio
ns?
If no
t fo
llow
g
uid
eli
ne
s,
how
to
im
pr
ov
e?
Th
ro
ug
h c
ap
ac
it
y b
uil
din
g?
Te
ch
nic
al
assi
stan
ce?
Are
th
e bu
dget
ing
docu
men
ts
subm
itted
ac
cord
ing
to
the
natio
nal
timel
ine?
Dat
e w
hen
budg
etin
g do
cum
ents
su
bmitt
ed.
Has
the
bud
getin
g pr
oces
s fo
llow
ed t
he p
roce
ss s
et o
ut
in th
e na
tiona
l gui
delin
es?
Com
pare
bud
getin
g pr
oces
ses.
De
velo
pm
en
t Pr
iorit
ies
and
Budg
etin
g
To d
escr
ibe
prov
inci
al
deve
lopm
ent p
riorit
ies
Wha
t ar
e th
e pr
iorit
y se
ctor
s m
entio
ned
in t
he p
rovi
ncia
l RP
JMD
?RJ
PMD
Brie
f de
scrip
tion
on “
urus
an
waj
ib” a
nd “u
rusa
n pi
lihan
”
To
asse
ss
linka
ges
betw
een
plan
ning
do
cum
ents
Are
th
e de
velo
pmen
t pr
iorit
ies
in
the
prov
inci
al
plan
ning
do
cum
ent
also
re
flect
ed
in
the
Rens
tra
and
kabu
pate
n pl
anni
ng
docu
men
ts?
RJPM
D, R
enst
ra e
tc
Are
th
e pr
ovin
cial
de
velo
pmen
t pr
iorit
ies
cons
iste
nt w
ith t
he n
atio
nal
plan
?
Un
de
rs
ta
nd
ing
linka
ges
betw
een
plan
ning
an
d bu
dget
ing
Doe
s th
e pu
blic
bu
dget
re
veal
th
e de
velo
pmen
t go
als
stat
ed in
the
pla
nnin
g do
cum
ents
?
RJPM
D, R
enst
ra e
tc
Doe
s th
e bu
dget
refl
ect
the
deve
lopm
ent p
riorit
ies i
n th
e pl
anni
ng d
ocum
ents
?
If no
t, w
hat a
re
way
s to
lin
k pl
anni
ng
and
budg
etin
g?
50 Practical Guidelines for Analyzing Public Expenditureat the Sub-National Level
Appendices
Sum
mar
y &
Re
com
en-
datio
n
Reve
nue
and
Fina
ncin
g
1.
To
calc
ulat
e to
tal
reve
nue
enve
lope
2.
To
un
ders
tand
re
venu
e so
urce
s an
d co
nstr
aint
s3.
To
cal
cula
te d
efici
t an
d su
rplu
s (id
entif
y po
licy)
4. T
o un
ders
tand
how
th
e lo
cal g
over
nmen
ts
reco
rd
thei
r re
venu
e an
d fin
anci
ng
Ove
rall
Reve
nue
Pict
ure
1. H
ow m
uch
reve
nue
does
th
e re
gion
hav
e ov
ertim
e?
Fisc
al re
venu
e pe
r cap
ita (f
or e
ach
reve
nue
item
)B
en
ch
ma
rk
anal
ysis
How
do
es
the
prov
ince
s
ho
ul
d a
ll
oc
at
e th
eir
mon
ey
to
equa
lize
the
fisca
l ca
paci
ty?
2.
How
is
th
e re
venu
e di
strib
uted
ac
ross
ka
bupa
ten/
kota
Tabl
e 1
3. W
hat i
s th
e co
mpo
sitio
n of
th
e re
venu
e (D
AU, D
AK,
etc
)?Ta
ble
2
DAU
(G
ener
al
Allo
catio
n G
rant
)
1. W
hat
is
the
desc
riptio
n an
d co
nstr
aint
DAU
Per
Cap
ita (
Prov
ince
& K
ab/
Kota
)B
en
ch
ma
rk
anal
ysis
How
effe
ctiv
e is
th
e D
AU
fo
rm
ula
? Fr
om
an
ineq
ualiz
atio
n pr
espe
ctiv
e?
2. W
hat
is
the
tren
d ov
er
time?
Why
?C
orr
ela
tio
n an
alys
is
3. W
hat
is t
he d
istr
ibut
ion
with
in
prov
ince
? Re
lativ
e to
pov
erty
rat
e? R
elat
ive
to
civi
l se
rvan
ts?
Rela
tive
to
expe
nditu
re n
eeds
?
Pove
rty
rate
s, ci
vil
serv
ants
and
ex
pend
iture
ne
eds
(from
D
AU
form
ula)
51Practical Guidelines for Analyzing Public Expenditureat the Sub-National Level
Appendices
DA
K (S
peci
al
Allo
catio
n G
rant
)
1. W
hat
is
the
desc
riptio
n an
d co
nstr
aint
? H
ow d
oes
it w
ork
in p
ract
ice?
DA
K is
use
d to
fina
nce
wha
t?
DA
K by
sec
tor
and
by p
rovi
nce/
kab/
kota
(allo
catio
n vs
real
izat
ion)
Be
nc
hm
ar
k an
alys
is
2. H
ow m
uch
DA
K ov
er ti
me?
DA
K pe
r ca
pita
(pr
ovin
ce &
kab
/ko
ta)
3.
Wha
t is
th
e se
ctor
al
com
posi
tion
of D
AK?
4. H
ow is
the
DA
K di
strib
uted
ac
ross
leve
ls o
f go
vt (
prov
&
kab/
kota
) and
bet
wee
n ka
b/ko
ta
Shar
ed
Tax
Reve
nue
/ Sh
ared
N
atur
al
Re
so
ur
ce
Reve
nue
1.
Wha
t is
the
regu
latio
n an
d th
e fo
rmul
a?
Shar
ed
tax
reve
nue
/ Sh
ared
na
tura
l re
sour
ce
reve
nue
per
capi
ta (p
rovi
nce
& k
ab/k
ota)
Be
nc
hm
ar
k an
alys
is
2. H
ow m
uch
over
tim
e? A
re
they
con
sist
ent
over
tim
e?
(pro
vinc
e an
d ka
b/ko
ta)
3. W
hat i
s th
e co
mpo
sitio
n?
4. H
ow a
re t
hey
dist
ribut
ed
with
in
prov
ince
? A
ny
sign
ifica
nt in
equa
lity?
Why
?
PAD
(O
wn
Sour
ce R
even
ue)
1.
How
muc
h ov
er t
ime?
Are
th
ey c
onsi
sten
t ov
er t
ime?
(p
rovi
nce
& k
ab/k
ota)
PAD
per
cap
ita (
prov
ince
& k
ab/
kota
)B
en
ch
ma
rk
anal
ysis
Doe
s th
e re
gion
nee
d to
in
crea
se P
AD
? If
yes,
whi
ch
ones
?
2. W
hat i
s th
e co
mpo
sitio
n?
3. W
hat
are
the
mai
n ta
xes
and
user
cha
rges
(pro
vinc
e &
ka
b/ko
ta)?
Ana
lyze
th
e Pe
rda
of
mai
n ta
xes
and
user
ch
arge
s. W
hat
is
the
rate
? Re
lativ
e to
ot
her
kab/
kota
or
ot
her
prov
ince
s?
52 Practical Guidelines for Analyzing Public Expenditureat the Sub-National Level
Appendices
4.
How
effi
cien
t is
th
e co
llect
ion
mec
hani
sm?
Do
the
prov
ince
s an
d ka
b/ko
ta
have
one
roof
sys
tem
?
Reve
nue
colle
cted
vs
co
st
of
colle
ctio
n
Fina
ncin
g
1.
How
m
uch
surp
lus
/ de
ficit?
Fina
ncin
g in
flow
and
out
flow
, ca
rry
over
.B
en
ch
ma
rk
anal
ysis
Doe
s th
e re
gion
ha
ve
fisca
l sp
ace?
H
ow
does
it
crea
te it
?
2. H
ow d
o th
e pr
ovin
ce/k
ab/
kota
fina
nce
the
defic
it?
3. H
ow d
o th
e pr
ovin
ce/k
ab/
kota
allo
cate
the
surp
lus
4.
How
do
th
ey
reco
rd
the
surp
lus/
defic
it?
Is
it co
nsis
tent
w
ith
the
real
su
rplu
s/de
ficit
calc
ulat
ed
by t
otal
rev
enue
min
us t
otal
ex
pend
iture
?
Sum
mar
y &
Re
com
men
-da
tion
Expe
nditu
reTo
ca
lcul
ate
tota
l re
gion
al e
xpen
ditu
re.
To
unde
rsta
nd
expe
nditu
re
tren
ds
acro
ss ti
me.
To
unde
rsta
nd
who
(c
entr
al,
prov
inci
al,
dist
rict)
sp
ends
th
e m
oney
.
To
unde
rsta
nd
how
m
oney
is
sp
ent
- ec
onom
ic
clas
sific
atio
n, s
ecto
rs.
To
unde
rsta
nd
varia
tions
be
twee
n di
stric
ts.
Ove
rvie
w
Wha
t is
th
e to
tal
regi
onal
ex
pend
iture
ove
r tim
e?
Se
e Ta
ble
1
Line
gr
aph
sh
ow
in
g su
b-n
ati
on
al
expe
nditu
re o
ver
time.
53Practical Guidelines for Analyzing Public Expenditureat the Sub-National Level
Appendices
How
doe
s per
cap
ita re
gion
al
expe
nditu
re
com
pare
to
ot
her p
rovi
nces
in In
done
sia?
Tota
l Exp
endi
ture
; pop
ulat
ion
Bar
grap
h sh
owin
g pe
r ca
pita
sp
endi
ng
com
pare
d to
ot
her p
rovi
nces
.
Who
sp
ends
th
e m
oney
? Ce
ntra
l go
vern
men
t?
Prov
inci
al
gove
rnm
ent?
O
r di
stric
t gov
ernm
ents
?
See
Tabl
e 1
Bar
grap
h s
ho
wi
ng
who
in
curr
ed
expe
nditu
re o
ver
time.
Is
cent
ral
go
vern
men
t d
om
ina
tin
g s
pe
nd
ing
? P
ol
ic
y im
plic
atio
ns?
Ec
on
om
ic
and
Sect
oral
C
lass
ific
atio
n (R
outin
e v
Dev
elo
pm
ent;
Ca
pita
l v
Non
-ca
pita
l)
Expl
ain
budg
et
form
at,
chan
ges
in
budg
et
form
at
and
how
sp
endi
ng
is
clas
sifie
d.
Co
ns
ide
r im
pli
cati
on
s of
bu
dget
f
or
ma
t ch
ange
d to
o of
ten.
Ove
rall,
w
hat
type
of
ex
pend
iture
do
min
ates
re
gion
al sp
endi
ng o
ver t
ime?
W
hy?
See
Tabl
e 2
Bar/
line
grap
h sh
owin
g m
ix
betw
een
type
s of
ex
pend
iture
ov
er ti
me.
Ass
umin
g th
at
one
of
type
ex
pen
dit
ure
is
m
ore
effec
tive
than
ot
hers
(e
.g.
Wha
t ty
pe
of
expe
nditu
re
dom
inat
es
prov
inci
al
spen
ding
ove
r tim
e? W
hy?
See
Tabl
e 3
Bar/
line
grap
h sh
owin
g m
ix
betw
een
type
s of
expe
nditu
re o
ver
time
at p
rovi
ncia
l le
vel.
Wha
t ty
pe
of
expe
nditu
re
dom
inat
es d
istr
ict
spen
ding
ov
er ti
me?
Why
?Se
e Ta
ble
4
Bar/
line
grap
h sh
owin
g m
ix
betw
een
type
s of
expe
nditu
re o
ver
time
at
dist
rict
leve
l.
54 Practical Guidelines for Analyzing Public Expenditureat the Sub-National Level
Appendices
Sect
oral
Whi
ch
sect
ors
have
do
min
ated
sp
endi
ng
over
tim
e? W
hy?
See
Tabl
e 5
Gra
ph
show
ing
se
ct
or
al
dis
trib
uti
on
over
co
mpa
ring
seve
ral y
ears
.
Has
a
su
ffic
ien
t po
rtio
n of
the
bu
dget
be
en
allo
cate
d to
ke
y se
rvic
e se
ctor
s su
ch
as
educ
atio
n,
heal
th
and
infr
astr
uctu
re?
[As
su
me
s th
at
serv
ice
deliv
ery
has
a st
rong
co
rre
lati
on
with
am
ount
of
bu
dget
al
loca
ted
to
thos
e se
ctor
s]
At
prov
inci
al l
evel
, wha
t ar
e th
e m
ost
impo
rtan
t se
ctor
s?
Why
?Se
e Ta
ble
6
Gra
ph
show
ing
se
ct
or
al
dis
trib
uti
on
over
co
mpa
ring
seve
ral y
ears
.
At
dist
rict
leve
l, w
hat
are
the
mos
t im
port
ant
sect
ors?
W
hy?
See
Tabl
e 7
Gra
ph
show
ing
se
ct
or
al
dis
trib
uti
on
over
co
mpa
ring
seve
ral y
ears
.
In
the
mos
t im
port
ant
sect
ors
- he
alth
, ed
ucat
ion
and
infr
astr
uctu
re
- w
hich
do
min
ates
spen
ding
(cen
tral
, pr
ovin
cial
or d
istr
icts
)? W
hy?
See
Tabl
e 8
Tabl
e 8
Is
cent
ral
go
vern
men
t d
om
ina
tin
g s
pe
nd
ing
? P
ol
ic
y im
plic
atio
ns?
Spen
ding
by
D
istr
ict
Whi
ch
dist
ricts
ha
ve
the
high
est
leve
l of
per
cap
ita
spen
ding
? Why
?Se
e Ta
ble
9
Bar
grap
h c
om
pa
rin
g ex
pend
iture
by
di
ffere
nt d
istr
icts
Is th
ere
stro
ng
ine
qu
ali
ty
be
tw
ee
n di
stric
ts?
If so
, w
hy?
Can
this
be
im
prov
ed?
How
?
Whi
ch
dist
ricts
ha
ve
the
high
est
leve
l of
per
cap
ita
educ
atio
n sp
endi
ng? W
hy?
See
Tabl
e 9
Bar
grap
h c
om
pa
rin
g e
du
ca
ti
on
expe
nditu
re
by
diffe
rent
dis
tric
ts
55Practical Guidelines for Analyzing Public Expenditureat the Sub-National Level
Appendices
Whi
ch d
istr
icts
hav
e hi
ghes
t le
vel
of
heal
th
spen
ding
? W
hy?
See
Tabl
e 9
Bar
grap
h c
om
pa
rin
g h
ea
lt
h ex
pend
iture
by
di
ffere
nt d
istr
icts
Whi
ch d
istr
icts
hav
e hi
ghes
t le
vel
of
infr
astr
uctu
re
spen
ding
? Why
?Se
e Ta
ble
9
Bar
grap
h c
om
pa
rin
g in
fras
tru
ctu
re
expe
nditu
re
by
diffe
rent
dis
tric
ts
Plan
ned
vers
us
Real
izat
ion
Wha
t is t
he o
vera
ll re
aliz
atio
n ra
te?
Has
gov
ernm
ent
been
ab
le t
o sp
end
its b
udge
t? I
f no
t, w
hy?
Tota
l rea
lizat
ion
rate
.
Has
th
e g
ove
rnm
ent
man
aged
to
sp
end
thei
r a
llo
ca
te
d fu
nds?
If
not,
why
?
Wha
t is
the
rea
lizat
ion
tren
d fo
r ec
onom
ic c
lass
ifica
tion?
Ex
plai
n re
ason
s fo
r un
der-
real
izat
ion
and
over
-sp
endi
ng.
See
Tabl
e 10
Tabl
e sh
owin
g re
ali
za
tio
n pe
rcen
tage
.
Wha
t is
the
rea
lizat
ion
tren
d fo
r se
ctor
s? E
xpla
in r
easo
ns
for
unde
r-re
aliz
atio
n an
d ov
er-s
pend
ing.
See
Tabl
e 11
Tabl
e sh
owin
g re
ali
za
tio
n pe
rcen
tage
.
Find
ings
Who
do
es
the
bulk
of
th
e sp
endi
ng?
Polic
y im
plic
atio
ns?
Wha
t ty
pes
of
spen
ding
do
min
ate
expe
nditu
re?
Polic
y im
plic
atio
ns?
Wha
t se
ctor
s do
min
ate
spen
ding
? Po
licy
impl
icat
ions
?
Are
the
re h
igh
ineq
ualit
ies
betw
een
dist
ricts
? Po
licy
impl
icat
ions
?
Hav
e go
vern
men
ts g
ener
ally
m
et
budg
et
targ
ets
(real
izat
ion
rate
s)?
Polic
y im
plic
atio
ns?
Sum
mar
y &
re
com
men
-da
tion
56 Practical Guidelines for Analyzing Public Expenditureat the Sub-National Level
Appendices
Sect
oral
1.
Ove
rvie
w
of
the
sect
oral
allo
catio
ns a
nd
the
curr
ent
sect
oral
pe
rfor
man
ce (
the
link
betw
een
expe
nditu
res
as
inpu
ts
and
sect
oral
pe
rfor
man
ce
or
indi
cato
rs
as
outc
omes
). H
opef
ully
, th
e ou
tcom
e an
d ou
tput
ju
stify
ho
w
a re
gion
sp
ends
its
bu
dget
. 2.
To
se
e ho
w
the
outc
ome
refle
cts
the
spen
ding
, an
d sp
endi
ng
refle
cts
the
prio
ritie
s.
- Ag
ree
on
se
ct
or
al
defin
ition
- Ag
ree
on d
ata
sour
ces
- A
naly
ze
data
fr
om B
PS a
nd/o
r D
inas
- Co
mpa
re
sp
en
din
g-
outp
ut-o
utco
me
with
ot
her
regi
ons
- Be
nefit
in
cide
nce
(ver
y ba
sic)
Hea
lth
Plan
ning
To a
naly
ze t
he h
ealth
po
licy
for t
he p
rovi
nce.
-Is h
ealth
a p
riorit
y in
the
pr
ovin
ce's
plan
ning
?-
If so
, wha
t ar
e th
e sp
ecifi
c he
alth
prio
ritie
s?
Plan
ning
doc
umen
ts
Agre
e on
p
la
nn
in
g do
cum
ents
th
at
will
be
anal
yzed
.
- A
re t
here
diff
eren
t he
alth
pr
iorit
ies
betw
een
dist
ricts
?-
Are
th
e he
alth
pr
iorit
ies
cons
iste
nt w
ith t
he n
atio
nal
leve
l hea
lth p
riorit
ies?
Spen
ding
(Inp
ut)
To
anal
yze
the
spen
ding
pa
tter
ns
in
heal
th s
pend
ing
- W
hat
perc
enta
ge o
f to
tal
sub-
natio
nal
spen
ding
is
on
heal
th?
- H
as
the
shar
e of
to
tal
heal
th sp
endi
ng in
crea
sed
or
decr
ease
d ov
er ti
me?
Why
?-
Has
th
e he
alth
se
ctor
sp
endi
ng
incr
ease
d or
de
crea
sed
over
tim
e? W
hy?
APB
D, D
ekon
. HH
57Practical Guidelines for Analyzing Public Expenditureat the Sub-National Level
Appendices
- W
hat
is
the
per
capi
ta
spen
ding
on
heal
th?
‘- Is
it
high
er
than
th
e na
tiona
l per
cap
ita a
vera
ge?
Com
pare
d w
ith o
ther
sim
ilar
prov
ince
s?- W
hat i
s the
per
cap
ita h
ealth
sp
endi
ng
of
each
di
stric
t?
Are
th
ere
big
varia
tions
be
twee
n di
stric
ts?
- W
hat
prop
ortio
n of
th
e he
alth
se
ctor
sp
endi
ng
is
by
dist
rict
gove
rnm
ent,
prov
inci
al g
over
nmen
t an
d ce
ntra
l gov
ernm
ent?
- Wha
t is t
he tr
end
over
tim
e?
Why
?
- W
hat
is
the
hous
ehol
d ex
pend
iture
on
heal
th?
- Is
this
hig
her
or lo
wer
tha
n na
tiona
l av
erag
e?
Oth
er
sim
ilar p
rovi
nces
?
- Wha
t has
the
heal
th b
udge
t be
en a
lloca
ted
to?
Acco
rdin
g to
pr
ogra
m
clas
sific
atio
n?
Acco
rdin
g to
ec
onom
ic
clas
sific
atio
n?
Sp
en
di
ng
(Out
put)
To
anal
yze
wha
t ou
tput
s ha
ve
been
ac
hiev
ed
thro
ugh
heal
th
spen
ding
(e
.g.
infr
astr
uctu
re, f
acili
ties,
hum
an
reso
urce
s, pr
ogra
ms
etc)
.
- H
ow m
any
Pusk
esm
as a
re
ther
e in
the
prov
ince
?-
How
do
es
this
co
mpa
re
with
the
natio
nal a
vera
ge?
- W
hat
is
the
num
ber
of
Pusk
esm
as i
n ea
ch d
istr
ict?
Va
riatio
ns b
etw
een
dist
ricts
?
Num
ber o
f Pus
kesm
as
58 Practical Guidelines for Analyzing Public Expenditureat the Sub-National Level
Appendices
- H
ow
man
y do
ctor
s an
d m
idw
ive
are
ther
e pe
r 10,
000
peop
le?
Per k
m2?
- H
ow
does
th
is
com
pare
w
ith th
e na
tiona
l rat
io?
- Co
mpa
re b
etw
een
dist
ricts
in
the
pro
vinc
e? A
re t
he b
ig
varia
tions
bew
een
dist
ricts
? Be
twee
n ur
ban
and
rura
l?
Num
ber o
f hea
lth w
orke
rs
- Ra
tio o
f birt
hs a
tten
ded
by
heal
thca
re w
orke
r
Out
com
esA
naly
ze
the
curr
ent
cond
ition
of h
ealth
Som
e ge
nera
l in
dica
tors
: M
orbi
dity
ra
tes/
child
nu
triti
on/in
fant
m
orta
lity
for
the
prov
ince
? Be
twee
n di
stric
ts?
Com
pare
w
ith
natio
nal r
ate
Mor
bidi
ty
rate
, ch
ild
nutr
ition
, in
fant
mor
talit
y.
- Im
mun
izat
ion
rate
fo
r pr
ovin
ce?
For
each
dis
tric
t?
Com
pare
with
nat
iona
l rat
e?Im
mun
izat
ion
rate
Hea
lth
serv
ices
ut
iliza
tion:
se
lf tr
eatm
ent,
com
pare
d w
ith h
ealth
clin
ics
etc.
Hea
lth s
ervi
ces
utili
zatio
n ra
te.
Wha
t is
the
util
izat
ion
rate
of
pu
blic
he
alth
fa
cilit
ies?
Co
mpa
red
with
na
tiona
l av
erag
e?
Oth
er
sim
ilar
prov
ince
s?Co
mpa
re
utili
zatio
n ra
tes
betw
een
dist
ricts
? Var
iatio
n?
Publ
ic h
ealth
ser
vice
s ut
iliza
tion
rate
.
Be
ne
fi
t-
in
ci
de
nc
e an
alys
is
Util
izat
ion
rate
s of
pu
blic
he
alth
fac
ilitie
s ac
cord
ing
to
inco
me
leve
ls.
Publ
ic h
ealth
ser
vice
s ut
iliza
tion
rate
.
Be
ne
fi
t-
in
ci
de
nc
e an
alys
is
Util
izat
ion
rate
s of
pu
blic
he
alth
fac
ilitie
s ac
cord
ing
to
gend
er?
Any
oth
er o
utco
mes
e.g
. HIV
ra
tes
etc.
59Practical Guidelines for Analyzing Public Expenditureat the Sub-National Level
Find
ings
Ana
lyze
th
e lin
k be
twee
n sp
endi
ng,
outp
uts
and
outc
omes
.- I
s th
ere
any
link?
If th
ere
is t
he
link,
w
hat
are
poss
ible
ar
eas
for f
ocus
w
ithin
th
e he
alth
sec
tor?
Are
th
ere
ineq
ualit
y in
he
alth
be
twee
n di
stric
ts?
Betw
een
girls
and
boy
s? I
s th
is
also
re
flect
ed
in
the
spen
ding
leve
ls?
Sum
mar
y &
Re
com
men
-da
tion
Educ
atio
n
Plan
ning
To
anal
yze
the
educ
atio
n po
licy
for
the
prov
ince
.
-Is e
duca
tion
a pr
iorit
y in
the
prov
ince
’s pl
anni
ng?
- If
so, w
hat
are
the
spec
ific
educ
atio
n pr
iorit
ies?
Plan
ning
doc
umen
ts
Agre
e on
p
la
nn
in
g do
cum
ents
th
at
will
be
anal
yzed
.
- A
re
ther
e di
ffere
nt
educ
atio
n pr
iorit
ies
betw
een
dist
ricts
?- A
re th
e ed
ucat
ion
prio
ritie
s co
nsis
tent
with
the
nat
iona
l le
vel e
duca
tion
prio
ritie
s?
Spen
ding
(Inp
ut)
To
anal
yze
the
spen
ding
pa
tter
ns
in
educ
atio
n sp
endi
ng.
- W
hat
perc
enta
ge o
f to
tal
sub-
natio
nal
spen
ding
is
on
educ
atio
n?-
Has
th
e sh
are
of
tota
l ed
ucat
ion
spen
ding
in
crea
sed
or d
ecre
ased
ove
r tim
e? W
hy?
- H
as t
he e
duca
tion
sect
or
spen
ding
in
crea
sed
or
decr
ease
d ov
er ti
me?
Why
?
APB
D, D
ekon
. HH
60 Practical Guidelines for Analyzing Public Expenditureat the Sub-National Level
Appendices
- W
hat
prop
ortio
n of
th
e ed
ucat
ion
sect
or
spen
ding
is
by
di
stric
t go
vern
men
t, pr
ovin
cial
gov
ernm
ent
and
cent
ral g
over
nmen
t?- W
hat i
s the
tren
d ov
er ti
me?
W
hy?
- W
hat
is
the
per
capi
ta
spen
ding
on
educ
atio
n?‘-
Is
it hi
gher
th
an
the
natio
nal p
er c
apita
ave
rage
? Co
mpa
red
with
oth
er s
imila
r pr
ovin
ces?
- W
hat
is
the
per
capi
ta
educ
atio
n sp
endi
ng
of
each
dis
tric
t? A
re t
here
big
va
riatio
ns b
etw
een
dist
ricts
?
- W
hat
is
the
hous
ehol
d ex
pend
iture
on
educ
atio
n?- I
s th
is h
ighe
r or
low
er t
han
natio
nal
aver
age?
O
ther
si
mila
r pro
vinc
es?
- Wha
t ha
s be
en t
he h
ighe
st
spen
ding
w
ithin
th
e
educ
atio
n se
ctor
acc
ordi
ng
to e
cono
mic
cla
ssifi
catio
n?
- Pr
ogra
m a
nd e
cono
mic
al
clas
sific
atio
n
Sp
en
di
ng
(Out
put)
To
anal
yze
wha
t ou
tput
s ha
ve
been
ac
hiev
ed
thro
ugh
educ
atio
n sp
endi
ng
(e.g
. in
fras
truc
ture
, fa
cilit
ies,
hum
an
reso
urce
s, pr
ogra
ms
etc)
.
- How
man
y sc
hool
s are
ther
e in
the
prov
ince
?- W
hat i
s the
ave
rage
num
ber
of s
tude
nts
per s
choo
l in
the
prov
ince
?-
How
do
es
this
co
mpa
re
with
the
natio
nal a
vera
ge?
- Av
erag
e nu
mbe
r of
st
uden
ts p
er s
choo
l in
eac
h di
stric
t? V
aria
tions
bet
wee
n di
stric
ts?
Num
ber o
f sch
ools
- GD
S an
alys
is
61Practical Guidelines for Analyzing Public Expenditureat the Sub-National Level
Appendices
- Wha
t is t
he st
uden
t-te
ache
r-ra
tio (
STR)
for
the
pro
vinc
e?
Com
pare
with
nat
iona
l STR
.-
Wha
t is
the
STR
for
eac
h di
stric
t?
Varia
tion
betw
een
dist
ricts
? Why
?
Num
ber o
f tea
cher
s
- Wha
t is t
he le
vel o
f tea
cher
s’ qu
alifi
catio
ns?
Teac
hers
’ qua
lifica
tion
- Wha
t is
the
leve
l of t
each
er
abse
ntee
ism
?Te
ache
rs’ a
tten
danc
e
- W
hat
is t
he c
ondi
tion
of
clas
sroo
ms
in th
e pr
ovin
ce?
- Co
mpa
re
with
na
tiona
l av
erag
e? C
ompa
re b
etw
een
dist
ricts
in p
rovi
nce?
Cond
ition
of c
lass
room
s
Ther
e m
ay b
e ot
her
outp
uts.
E.g.
tex
t bo
oks,
dist
ance
to
scho
ols
etc.
Text
boo
ks,
dist
ance
to
scho
ols
etc.
- W
hat
is
the
gros
s en
rollm
ent
rate
(G
ER)
at
prim
ary
scho
ol l
evel
? Ju
nior
se
cond
ary
scho
ol
leve
l?
Seni
or s
econ
dary
leve
l?-
How
doe
s it
com
pare
with
th
e na
tiona
l ave
rage
?-
Com
pare
the
GER
for
eac
h di
stric
t.-
Com
pare
enr
ollm
ent
rate
s by
gen
der?
Is
ther
e a
corr
elat
ion
betw
een
dist
ance
to
scho
ol
and
enro
llmen
t rat
e?
- U
sage
of
pu
blic
sc
hool
fa
cilit
ies
by in
com
e le
vel?
Be
ne
fi
t-
inc
ide
nc
e an
alys
is
- U
sage
of
pu
blic
sc
hool
fa
cilit
ies
by g
ende
r?
Be
ne
fi
t-
inc
ide
nc
e an
alys
is
Any
oth
er o
utco
mes
.
62 Practical Guidelines for Analyzing Public Expenditureat the Sub-National Level
Appendices
Find
ings
Ana
lyze
th
e lin
k be
twee
n sp
endi
ng,
outp
uts
and
outc
omes
.- I
s th
ere
any
link?
If th
ere
is t
he
link,
w
hat
are
poss
ible
ar
eas
for f
ocus
w
ithin
th
e e
du
ca
tio
n se
ctor
Are
th
ere
ineq
ualit
ies
in
educ
atio
n be
twee
n di
stric
ts?
Betw
een
girls
an
d bo
ys?
Is t
his
also
refl
ecte
d in
the
sp
endi
ng le
vels
?
Sum
mar
y &
re
com
men
-da
tion
Infr
astr
uctu
re
Plan
ning
To
anal
yze
the
infr
astr
uctu
re
polic
y fo
r the
pro
vinc
e.
-Is in
fras
truc
ture
a p
riorit
y in
th
e pr
ovin
ce’s
plan
ning
?-
If so
, wha
t ar
e th
e sp
ecifi
c in
fras
truc
ture
prio
ritie
s?Pl
anni
ng d
ocum
ents
Agre
e on
p
la
nn
in
g do
cum
ents
th
at
will
be
anal
yzed
.
- A
re
ther
e di
ffere
nt
infr
astr
uctu
re
prio
ritie
s be
twee
n di
stric
ts?
- A
re
the
infr
astr
uctu
re
prio
ritie
s co
nsis
tent
with
the
na
tiona
l le
vel
infr
astr
uctu
re
prio
ritie
s?
Spen
ding
(Inp
ut)
To
anal
yze
the
spen
ding
pa
tter
ns
in
infr
astr
uctu
re
spen
ding
.
- W
hat
perc
enta
ge o
f to
tal
sub-
natio
nal
spen
ding
is
on
infr
astr
uctu
re?
- H
as
the
shar
e of
to
tal
infr
astr
uctu
re
spen
ding
in
crea
sed
or d
ecre
ased
ove
r tim
e? W
hy?
- H
as
the
infr
astr
uctu
re
sect
or s
pend
ing
incr
ease
d or
de
crea
sed
over
tim
e? W
hy?
APB
D, D
ekon
.HH
63Practical Guidelines for Analyzing Public Expenditureat the Sub-National Level
Appendices
- W
hat
is
the
per
capi
ta
spen
ding
on
infr
astr
uctu
re?
‘- Is
it
high
er
than
th
e na
tiona
l per
cap
ita a
vera
ge?
Com
pare
d w
ith o
ther
sim
ilar
prov
ince
s?-
Wha
t is
th
e pe
r ca
pita
in
fras
truc
ture
sp
endi
ng
of
each
dis
tric
t? A
re t
here
big
va
riatio
ns b
etw
een
dist
ricts
?
- W
hat
prop
ortio
n of
th
e in
fras
truc
ture
se
ctor
sp
endi
ng
is
by
dist
rict
gove
rnm
ent,
prov
inci
al
gove
rnm
ent
and
cent
ral
gove
rnm
ent?
- Wha
t is t
he tr
end
over
tim
e?
Why
?
- W
hat
is
the
hous
ehol
d ex
pend
iture
on
in
fras
truc
ture
?- I
s th
is h
ighe
r or
low
er t
han
natio
nal
aver
age?
O
ther
si
mila
r pro
vinc
es?
- W
hat
has
been
th
e hi
ghes
t sp
endi
ng
with
in
the
infr
astr
uctu
re
sect
or
acco
rdin
g to
sub-
sect
ors?
E.g
. tr
ansp
orta
tion,
el
ectr
icity
, te
lec
om
mu
nic
ati
on
s,
gove
rnm
ent b
uild
ings
etc
.
Wha
t ha
s do
min
ated
in
fras
truc
ture
sp
endi
ng
acco
rdin
g to
ec
onom
ic
clas
sific
atio
n.
Sp
en
di
ng
(Out
put)
To
anal
yze
wha
t ou
tput
s ha
ve
been
ac
hiev
ed
thro
ugh
infr
as
tr
uc
tu
re
spen
ding
(e
.g.
infr
astr
uctu
re, f
acili
ties,
hum
an
reso
urce
s, pr
ogra
ms
etc)
.
- Len
gth
of ro
ads
- Qua
lity
of ro
ads
- Co
mpa
re
over
tim
e.
Com
pare
w
ith
othe
r pr
ovin
ces,
com
pare
w
ith
natio
nal
leve
l, co
mpa
re
betw
een
dist
ricts
w
ithin
pr
ovin
ces.
Leng
th o
f roa
ds; q
ualit
y of
road
s.
64 Practical Guidelines for Analyzing Public Expenditureat the Sub-National Level
Appendices
Out
com
esA
naly
ze
the
curr
ent
cond
ition
of
in
fras
truc
ture
.
Ana
lyse
in
fras
truc
ture
in
dica
tors
(pu
blic
san
itatio
n,
no s
anita
tion,
pip
ed w
ater
, im
prov
ed w
ater
, sa
nita
tion,
irr
igat
ion
cove
rage
, ro
ad
cove
rage
, acc
ess t
o el
ectr
icity
an
d an
y ot
her
rele
vant
in
dica
tors
) to
ev
alua
te
the
follo
win
g:
- H
ave
ther
e be
en
impr
ovem
ents
ove
r tim
e?-
Hig
her
or
low
er
than
na
tiona
l ra
te?
Com
pare
w
ithin
dis
tric
ts i
n pr
ovin
ce
(is t
here
ineq
ualit
y be
twee
n di
stric
ts?)
- D
iffer
entia
te
the
acce
ss
acco
rdin
g to
gro
ups
such
as
inco
me
leve
l (o
r ge
nder
, if
poss
ible
).
Be
ne
fi
t-
in
ci
de
nc
e an
alys
is,
time-
serie
s an
alys
is.
Find
ings
Ana
lyze
th
e lin
k be
twee
n sp
endi
ng,
outp
uts
and
outc
omes
.- I
s th
ere
any
link?
If th
ere
is t
he
link,
w
hat
are
poss
ible
ar
eas
for f
ocus
w
ithin
th
e in
fras
truc
ture
se
ctor
?
Are
th
ere
ineq
ualit
ies
in
infr
astr
uctu
re
betw
een
dist
ricts
? Be
twee
n in
com
e le
vels
? Is
this
als
o re
flect
ed in
th
e sp
endi
ng le
vels
?
Sum
mar
y &
Re
com
men
-da
tion
Loca
l Iss
ues
To b
e de
cide
d
Sum
mar
y &
Re
com
men
-da
tion
65Practical Guidelines for Analyzing Public Expenditureat the Sub-National Level
Appendices
Appendix 2: Data RequirementsThe objective of this section is to provide researchers with data requirements (both quantitative and qualitative) and some advice on where to obtain the data. The following also includes some advice on time-span of data, but this depends on the scope of the research. As discussed earlier, we recommend collecting data over at least five years, the general rule being that the more data the better the quality of analysis.
Data can be collected at both the national and sub-national levels. Where there are two sources for the same data (for example, APBD), the researcher needs to decide, at the outset, which source will be used for analysis. Each data source has its own advantages and disadvantages. See Section 4.2.1 for guidance on the appropriateness of each source.
1. National Sources: Ministry of Finance (MoF); Statistics Bureau (BPS); No Type Name Description Source Indicators
1 Fiscal APBN National expenditure (provincial level) by routine and development. MoF
Deconcentrated and assistance task Expenditure
APBD
Regional budget (Kab/Kota & provincial level) consists of revenue (by items), routine exp (by bagian and econ. class), and development exp (by sectors).(Makuda format), Public and apparatus spending (Kepmendagri 29 format); or Direct and indirect spending (Permendagri 13 format)
BPS ; MoF
Revenue, routine, development
DAU DAU allocation and basic data used for DAU calculation (Kab/Kota & provincial level) MoF
DAU allocation, p o p u l a t i o n , p o v e r t y incidence, area, IHBG, etc.
DAK DAK Dana Reboisasi and DAK Non Dana Reboisasi (Kab/Kota & provincial level) MoF
DAK allocation ( infrastructure, health, education sectors)
Borrowing Data on local government borrowing and arrears MoF
Realized loan, o u t s t a n d i n g amount of loan, total arrears
Local Taxes Revenue Sharing
Data on local taxes and levies MoF Taxes, levies
Revenue Sharing
Tax and non-tax revenue sharing for local governments MoF
PBB, BPTHB, PPh, SDA allocations by type and region
2 Non Fiscal
Social Indicators
Population Census or other
population data from
BPS
National population census, conducted once in ten years or other annual population data from BPS
BPS Population
66 Practical Guidelines for Analyzing Public Expenditureat the Sub-National Level
References
Susenas
Susenas consists of CORE (annual) and MODULES (once in three years). It covers characteristics of household and members of household within sampled household.
BPS
E d u c a t i o n a t t a i n m e n t , literacy rate, % of urban population, h o u s e h o l d income and expenditure.
Sakernas
The Annual National Labor Force Survey (Sakernas) covers national labor market characteristics of all working age individuals within sampled households.
BPS
Labor force (by sector), employment rate, unemployment rate, etc.
PodesVillage Potential Survey (Podes) provides information about villages/desa characteristics and infrastructures.
BPS
no. of facilities ( s c h o o l s , Puskesmas, etc), % of family with phone, type of road available, acres of paddy field, etc.
G o v e r n a n c e indicators and decentralization ( t r a n s p a r e n c y, accountabi l i ty, service quality)
Civil Servant Census
Number of civil servants by localities BKN
Number of civil servants by structural c l a s s i f i c a t i o n , f u n c t i o n a l c l a s s i f i c a t i o n , characterist ics, golongan, etc
67Practical Guidelines for Analyzing Public Expenditureat the Sub-National Level
Appendices
2. Data from Sub-National Source : Quantitative
Type Name Years Source Indicators
Mandatory Indicators Population Latest Regional BPS To create per capita value
Regional CPI Latest Regional BPS To create real value
Fiscal APBD Latest
P r o v i n c i a l and local g o v e r n m e n t s financial reports ( p r e f e r a b l y audited financial reports)
Most detailed available breakdown of• Revenue• Expenditure
- Routine & Development (Makuda format)- Public & Apparatus (Kepmendagri 29 Format)- Direct & Indirect (Permendagri 13 Format)- Detailed expenditures on health facilities and schools, by type
• Financing (new budget format)
Fiscal Borrowing Latest Provincial and local government
• Level of debt• Loans by source (central government, bank etc).
FiscalShared natural
resource revenue
Latest P r o v i n c i a l government
• Criteria used for allocation shared revenue for oil, gas and forestry to kab/Kota• Amounts allocated to each kab/kota
Social Population Latest L o c a l government
• Local government’s estimate of total population• Local BPS office estimate of population
Social Poverty Latest L o c a l government
• Local government’s estimate of poverty• Local BPS office estimate of poverty
Social Education Latest L o c a l government
• Number of schools, by type• Number of students• Number of teachers (including regular and non-regular)• Amount of retribution collected• Education indicators used by local government (literacy rate, enrollment rate, education attainment, etc)
68 Practical Guidelines for Analyzing Public Expenditureat the Sub-National Level
Appendices
Social Health Latest L o c a l government
• Number of health centers• Number of doctors and other health staff (including regular and non-regular)• Amount of retribution collected• Health indicators used by local government (births attended by skilled workers, infant mortality rate)
Infrastructure Water and Sanitation Latest Provincial and
local government
• Current status and condition of water infrastructure• Access to clean water
Road Latest Provincial and local government
• Length of roads, by type• Condition of roads
Local Politics DPRD Latest Provincial KPU office
• Composition of DPRD members (political parties represented)• Characteristics of DPRD members (educational background, gender)
Governance Civil Servants LatestP r o v i n c i a l and local governments
• Number of civil servants, by structural and functional category and by professional grade
QualitativeType Name Years Source Indicators
Planning Planning Process Latest Bappeda
• What plans are in place?• Does the public participate in the planning process? If yes, how?• Is there a plan/strategy for improvement of the economy? If yes, which sector(s) does it focus on?• How is the achievement of the plans monitored?
Budget Budget Preparation Latest
Biro Keuangan, Bappeda, head of each agency
• Is there a formal mechanism for the public to participate in the budgeting process? If yes, how effective is it?• How is quantitative information used to make budget decisions?• How are decisions made regarding government intervention in a particular sector?• Which institution/body makes decisions on the final budget allocations?
Budget Publication Latest Bappeda, Sekda
• Is the budget made available to the public? If yes, how (newspaper, government gazette etc.)?
69Practical Guidelines for Analyzing Public Expenditureat the Sub-National Level
Appendices
Budget Latest Biro Keuangan, Bappeda
• Which unit is responsible for disbursement?• Has the local treasury (BUD) been established?• What are the payment mechanisms (SPP)?• Are there problems in with cash management? If yes, which?• Has the budget been revised during the fiscal year?
Performance Budgeting Latest Bappeda
• Has performance budgeting been introduced yet?• If yes, how is performance monitored?
70 Practical Guidelines for Analyzing Public Expenditureat the Sub-National Level
References
Transfer Disbursement of Transfer Latest Biro Keuangan
• When and in how many installments does the local government receive transfers from the central government and the province?• DAU• DAK• Shared natural resource revenue• Shared tax revenue
Format -- electronic wherever possible
71Practical Guidelines for Analyzing Public Expenditureat the Sub-National Level
References
References
Aran, Meltem (2007). Note on “Pro-Poor Targeting and the Effectiveness of Indonesia’s Fuel Subsidy Reallocation Programs”. Jakarta. Indonesia
Ghozali, Abbas. “Analisis Sejarah Kebijakan, Penyelenggaraan, dan Kondisi Pendidikan Dasar serta Implikasinya pada Pendidikan Dasar Gratis”. Makalah individual untuk studi Pendidikan Gratis yang diselenggarakan oleh BAPPENAS. Jakarta. Indonesia.
Pemerintah Daerah Kabupaten Belu (2004). Rencana Strategis Kabupaten Belu 2004-2008
Pemerintah Daerah Kabupaten Belu (2004). Rencana Strategis Dinas Pendidikan Kabupaten Belu Periode 2004-2008
Pemerintah Daerah Kabupaten Minahasa (2003). Rencana Stratejik Dinas Pendidikan dan Kebudayaan Kabupaten Minahasa Tahun 2003-2007
Pemerintah Daerah Kabupaten Timor Tengah Selatan (2004). Rencana Strategis Kabupaten Timor Tengah Selatan 2004-2008
Pemerintah Daerah Kabupaten Timor Tengah Selatan (2005). Rencana Strategis Dinas Pendidikan dan Kebudayaan Kabupaten Timor Tengah Selatan Tahun 2005-2009
Pemerintah Daerah Kota Binjai. Peraturan Walikota Binjai nomor 050-6525 tahun 2005 tentang Rencana Pembangunan Jangka Menengah Daerah Kota Binjai 2006-2010.
Pemerintah Daerah Kota Magelang (2005). Peraturan Daerah nomor 9 tahun 2005 tentang Rencana Pembangunan Jangka Menengah Kota Magelang Tahun 2005-2010.
Pemerintah Daerah Kota Manado (2005). Peraturan Daerah nomor 04 tahun 2005 tentang Rencana Pembangunan Jangka Menengah Daerah Kota Manado 2005-2010.
Pemerintah Daerah Kota Manado (2005). Matriks Program Lima Tahunan (RPJMD dan Renstra SKPD). Dinas Pendidikan Kota Manado
Pemerintah Indonesia (2007). Peraturan Pemerintah Republik Indonesia nomor 38 tahun 2007 tentang Pembagian Urusan Pemerintahan antara Pemerintah, Pemerintahan Daerah Provinsi, dan Pemerintahan Daerah Kabupaten.
Pemerintah Indonesia (2005). Peraturan Pemerintah Republik Indonesia nomor 19 tahun 2005 tentang Standar Nasional Pendidikan.
Pemerintah Indonesia (2005). Undang-Undang Republik Indonesia nomor 14 tahun 2005 tentang Guru dan Dosen.
Pemerintah Indonesia (2003). Undang-Undang Republik Indonesia nomor 20 tahun 2003 tentang Sistem Pendidikan Nasional.
Pemerintah Indonesia (2002). Keputusan Menteri Dalam Negeri nomor 29 tahun 2002 tentang Pedoman Pengurusan, Pertanggungjawaban dan Pengawasan Keuangan dan Belanja Daerah, Pelaksanaan Tata Usaha Keuangan Daerah dan Penyusunan Perhitungan Anggaran Pendapatan dan Belanja Daerah.