s_ V -9 t , M/ ' ('I Document of The World Bank FOR OFFICIAL USE ONLY MICROFICHE COPY Report No. 9810-PH Report No. 9810-PH Type: (SAR) SOPHER, J./ X80458 / D-8059/ AS2IE STAFF APPRAISAL REPORT PHILIPPINES RURAL ELECTRIFICATION REVITALIZATION PROJECT DECEMBER 23, 1991 Industryand Energy OperationsDivision Country DepartmentI East Asia and Pacific RegionalOffice This document has a restricted ditrbution andmay be used by rdpients ouly in the performance of their ofici duties. Its contents may so otherwise be dilosed witout Wodd Bank autfioIze.om Public Disclosure Authorized Public Disclosure Authorized Public Disclosure Authorized Public Disclosure Authorized Public Disclosure Authorized Public Disclosure Authorized Public Disclosure Authorized Public Disclosure Authorized Public Disclosure Authorized Public Disclosure Authorized Public Disclosure Authorized Public Disclosure Authorized
Industry and Energy Operations DivisionCountry Department IEast Asia and Pacific Regional Office
This document has a restricted ditrbution and may be used by rdpients ouly in the performance oftheir ofici duties. Its contents may so otherwise be dilosed witout Wodd Bank autfioIze.om
COA = Commission on AuditsDENR = Department of Environment and Natural ResourcesECC - Energy Coordinating CouncilICB = International Competitive BiddingLCB = Local Competitive BiddingLIB = Limited International BiddingLRMC = Long Run Marginal CostMERALCO = Manila Electric CompanyNEA = National Electrification AdministrationNEC-TS = National Electrification Comnunission - Technical StaffNEDA = National Economic Development AuthorityNPC = National Power CorporetionNRECA = National Rural Electnic Cooperative Assn. (U.S.A.)OECF Overseas Economicr Development Fund (Japan)PCB = Polychlorinated BiphenylsPER = Project Evaluation ReportPIP - Performance Improvement ProgramREC = Rural Electric CooperativeREMP = Rural Electrification Master PlanSOP = Statement of Operating PolicyUSAID - United States Agency for Intemational Development
NEA's Fiscal Year - January 1 to December 31
FOR OFFICIAL USE ONLYPHILIPPINES
Rural Electrificaton Revitalization Project
LOAN AND PROJECr SUMMARY
Borrower. National Electrification Administration (NEA)
Guarantor. Republic of the Philippines
Beneficiaries: About 54 Rural Electric Cooperatives (REC) spread nationwide
Amount: US$91.3 million equivalent
Lending Terms: Repayable over 20 years, including five years of grace, at the Bank'sstandard variable interest rate.
Relending Terms: NEA would relend the Peso equivalent to the RECs on terms andconditions established periodically for the sector (currently, twentyyears, including three years of grace, at 12% per annum interest).
Project Objectives: The proposed project aims at: (i) enhancing NEA's effectiveness as thecore agency for the sector through its use of sound processes for prior-itizing investments, supervising the implementation of schemes, and fi-nancing the RECs; (ii) encouraging needed reforms among the RECsthrough the judicious application of conditionality, (iii) improving thereliability of electricity supply in rural areas by financing a portion ofNEA's 1992-95 investment program; and (iv) providing technical assis-tance and training for NEA and the RECs.
ProjectDescription: The proposed project consists of: (a) an institutional development com-
ponent that includes mainly (i) technical assistance and training to beprovided under the proposed project, and (ii) NEA's application ofdiscipline to itself through the use of systematic investment and financ-ing strategies, and to the RECs through conditionality attached to itsfuture loans; and (b) an investment component that consists of specificsubprojects from NEA's 1992-93 investment program, including:(i) core system rehabilitation, (ii) distribution system extensions to ca-pture productive loads as well as residential connections, and (iii) sys-tem improvements, aiming to improve the reliability of service.
Beneflts: The main benefit of the proposed project would be the improvement inthe quality of life in rural areas through the widespread availability ofelectricity for productive and household uses, with women being prima-ry beneficiaries. This should, in turn, facilitate a broadening of eco-nomic opportunity in provincial towns and rural areas in agriculture andsmall scale industry.
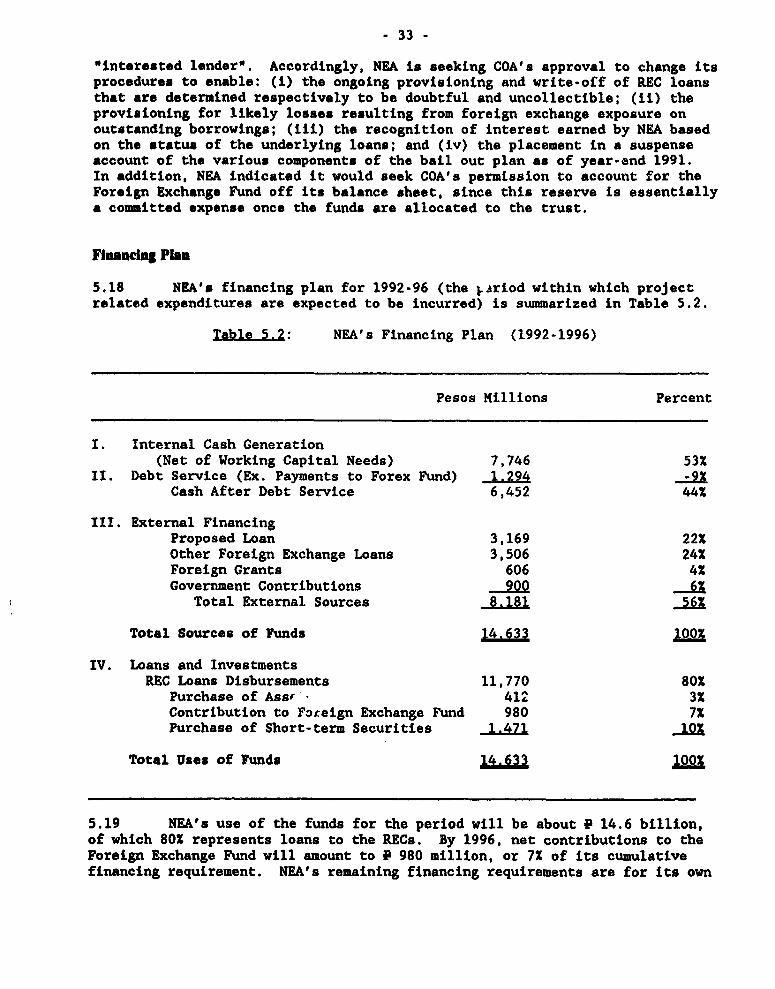
This document has a restricted distribution and may be used by recipients only in the performanceof their oflicla7 c ties. Its contents may not otherwise be disclosed without World Bank authorization.
- ii -
Risks: The proposed project is ambitious, and may exceed the capacity of theRECs to meet implementation schedules or furnish counterpart funds.The project was designed to enable the dropping of subprojects shouldany REC's absoiption capacity be exceeded.
S. FINANCE AND TARIFFS ................................-.....- 27 -A. National Electrification Administration ..- 27 -B. Rural Electric Cooperatives ..- 36 -C REC Tari .- 38--
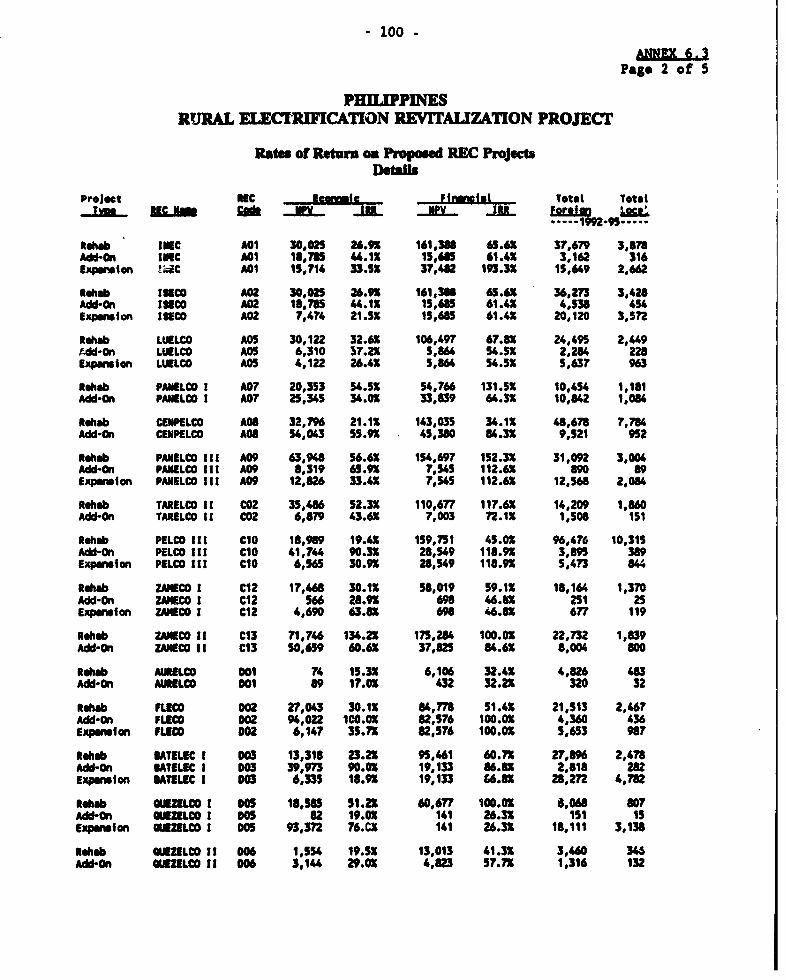
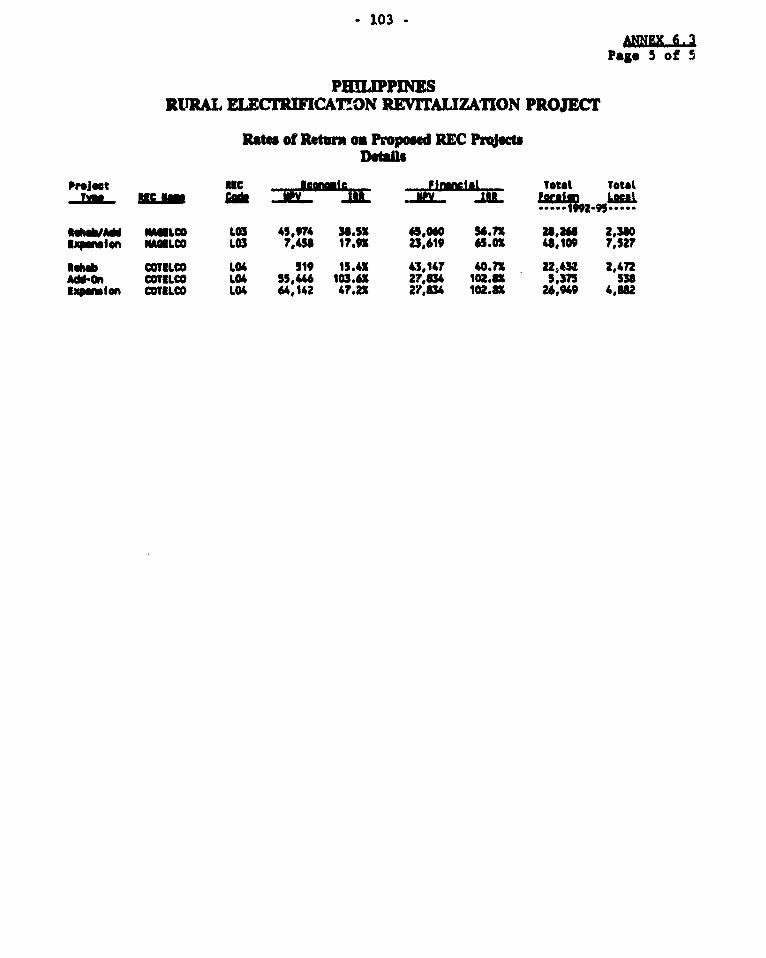
6. PROJEC EJUSTIFICATION ........................................... -41 -A. Economic Evaluation of REC Investment Programs .- 41 -B. Rates of Return on REC Investment Programs .- 42-
7. AGREEMENIS TO BE REAC-HED AND RECOMMENDAfTON .43 -A. Agreements to be Reached .343B. Recomnmendation ............ 44 -
Annexes
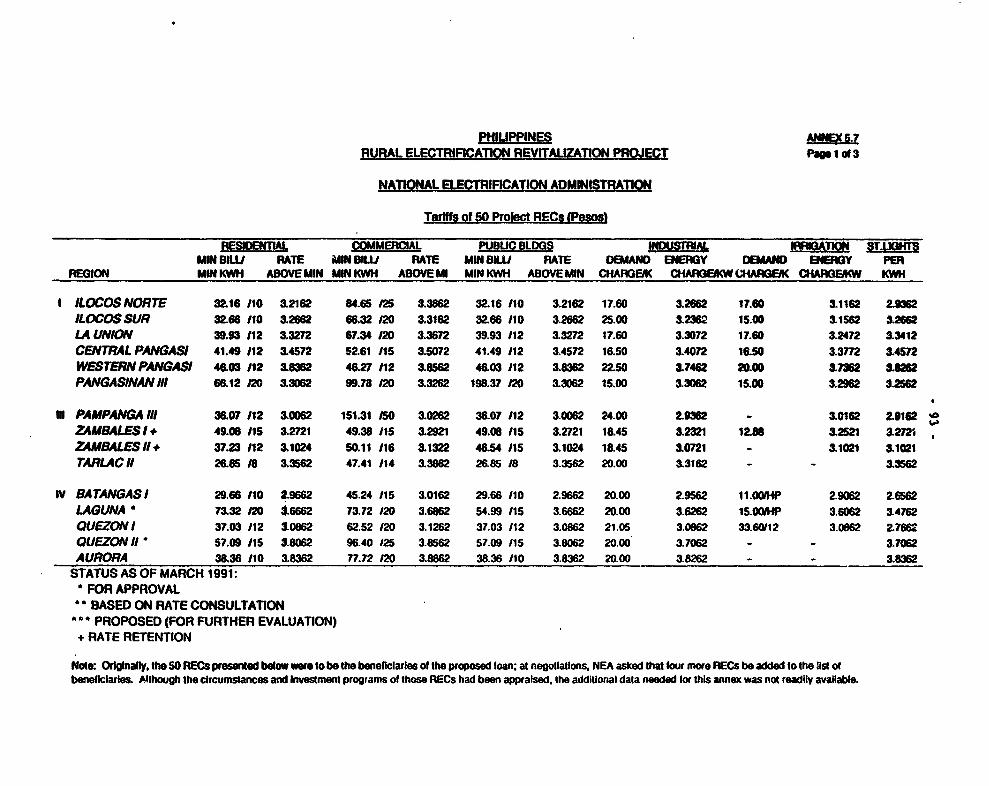
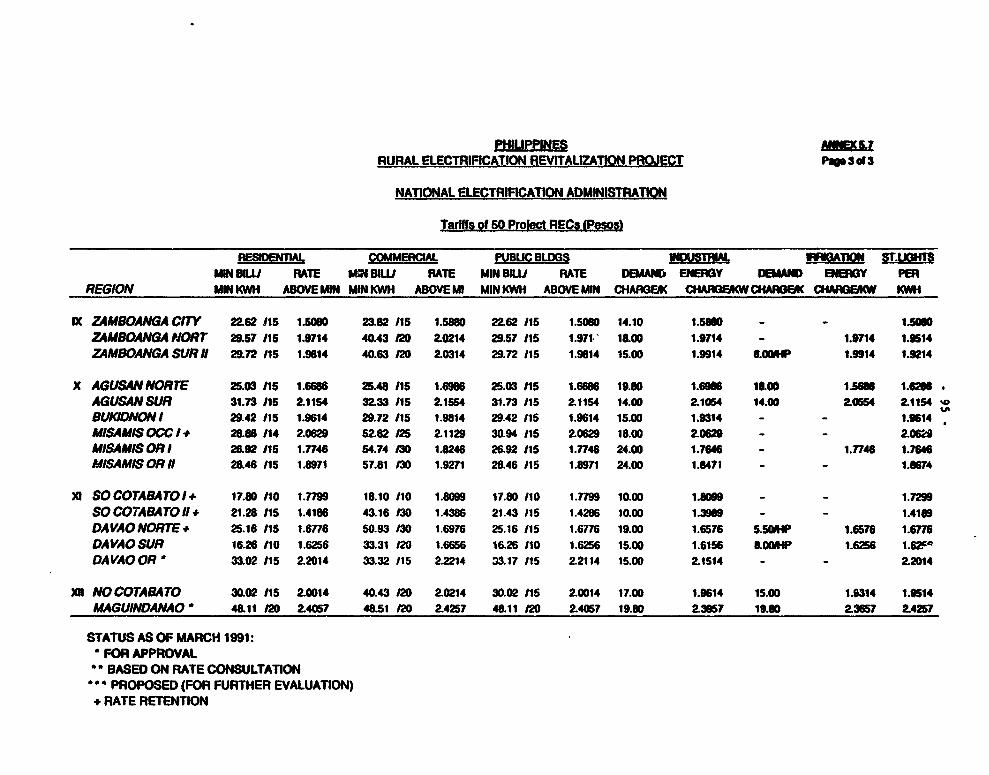
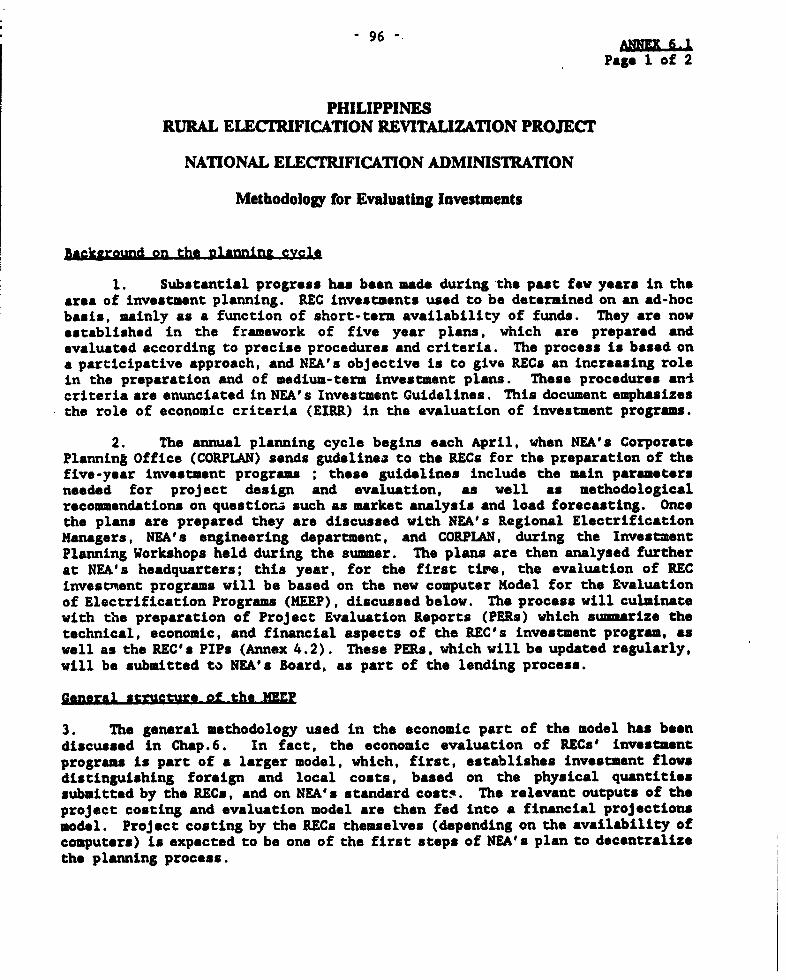
1.1 NEAr Statement of Operating Policy (without annexes)2.1 Current Organization Chart2.2 Transitional Organization Chart2.3 Staffing Profile (Feb. 1991)3.1 Annual Formation of RECs3.2 REC Sales and Customers 1981-19903.3 Recent Trends and Forecasts of Sales and Customers for 50 Project RECs4.1 Project Description4.2 Outline of Evaluation Reports4.3 Project Cost Estimates4.4 Procurement Arrangements4.5 Disbursement Schedule4.6 Implementation Schedule4.7 Generic Performance Improvement Programs4.8 Schedule of Supervision Activities and Missions5.1 Histozical Balance Sheet (1986-90)5.2 Historical Income Statement (1986-90)5.3 Fnancial Implications of the Bail Out Plan5.4 Financial Projections (1991-2000)5.5 Assumptions to Financial Projections5.6 REC Bulk Supply Costs and Retail Rates (1985-90)5.7 Tariffs of 50 Project RECs6.1 Methodology for Evaluating Investments6.2 Long Run Marginal Cost of Bulk Supply6.3 Rates of Return of Proposed REC Projects7.1 List of Documents in Project File
Map
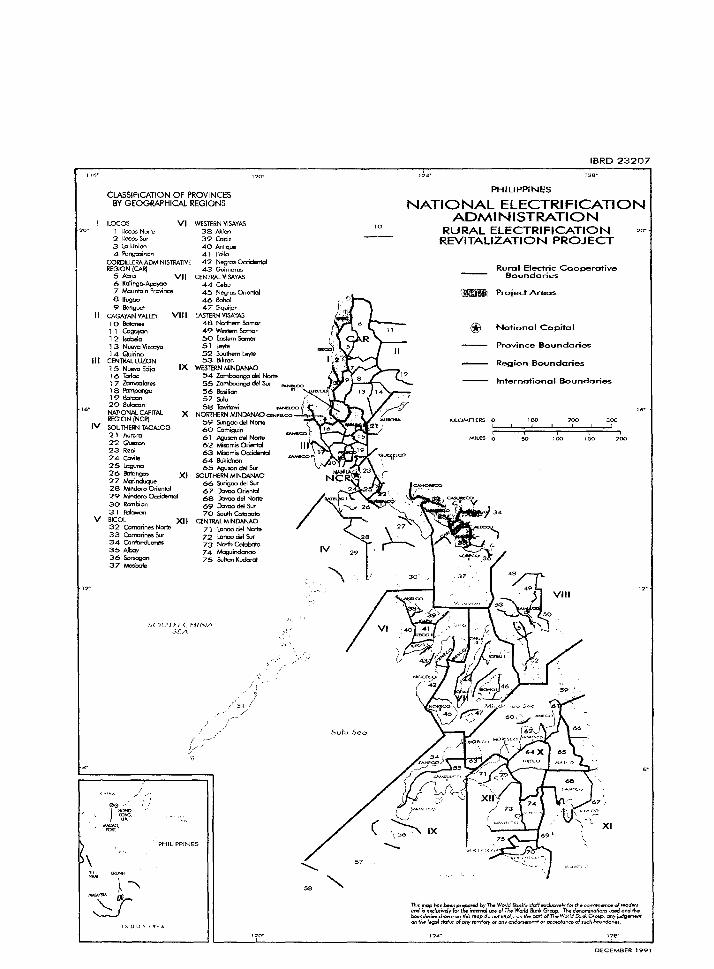
IBRD 23207 - Service Areas of RECs Included in the Proposed Project
1. THE RURAL ELEC:IRFICATION SECTOR
A. Background
1.1 The Philippine rural electrification program was launched in 1960.It gainod momentum in 1969 when the National Electrification Administration(NEA) was established to serve as the core institution for the sector. In1971, when the first Rural Electric Cooperative (REC) was energized, variousinvestor owned distribution companies were serving about 170,000 consumerslocated outside the major cities; by late 1990, the number of provincial elec-tricity consumers had surpassed 3 million, or about 50% of potential connec-tions. The vast majority of connections (about 90%) are residential consum-ers, many paying about P 100/month to consume about 40 kWh/month or less. In1990, about 1,296 cities and towns and 21,051 barangays (93% and 60% of thetotals, respectively) were electrified.
Sector Structure
1.2 The Government institutions serving the rural electrification sectorinclude: (i) NEA, which is responsible for formulating and implementing sectorpolicies and for financing distribution investments for the nation's 120 RECs,and (ii) the National Power Corporation (NPC), which is responsible for allbut very modest generation facilities and most transmission systems nation-wide, and wholesales power to the RECs and other distributors. Distributionfor provincial urban centers and most rural areas is provided by the 120 mem-ber-owned RECs. The Manila Electric Company (MERALCO), an investor-ownedcompany, distributes electricity to rural areas surrounding Metro Manila. NEAreports to the Department of Environment and Natural Resources (DENR), and hasdirect links with the other major energy sector institutions through its seaton the Energy Coordinating Council (ECC).
Historlcal Context
1.3 From the early 1970s until about 1983, international bilateral aswell as multilateial funding sources provided substantial finance for ruralelectrification (about US$20-30 million per year)to NEA. Foremost among thesesources was the United States Agency for International Development (USAID),which provided much of the impetus behind the formation of the cooperativesystem and considerable finance for some of the early projects. Japan's Over-seas Economic Cooperation Fund (OECF) was also a major financier of the pro-gram during the early period. At that time, Government policy emphasized in-creasing the number of connections, regardless of the economic merits of mak-ing the investments. Because NEA was lending long term at below market rates,it met its operating expenses not from revenues but from excess capital andsubsidies. Moreover, as NEA's policies were designed to keep electricityrates down, the RECs deemphasized maintenance and training in favor of new in-vestments, for which funds were freely available. As long as funds for cap-ital investment continued flowing abundantly, the system seemed to be healthy.
-2-
1.4 In mid 1983, forwign funding for the rural electrification programabruptly r^n dry. By 1984, NEA's loan releases to the RECs dropped to aboutUS$2-4 million per year. At that point, the serious institutional weaknessesof NEA and the RECs became evident, and their functional and financial capa-btlities deteriorated steadily thereafter.
1.5 NEA's review conducted in 1988 indicated that a large propirtion ofRECs faced serious operational and financial problems. Only 22 RECs were con-sidered to be well managed and financially viable (A rating); for another 24,financial viability was considered within reach if they made some operstfonaland coxiercial adjustments (B rating). Of the remaining 71, some 40 neededsubstantial remedial action (C rating) and the remaining 31 were consideredeither beyond rescue, or salvageable only with great difficulty (D rating).REC distribution losses averaged 251 (technical losses averaged about 171 andnon-technical, about 8X), but were in some cases as high as 45-501. Theft ofelectricity remained common, and maintenance was inadequate throughout the RECsystem. The Government's past emphasis on expanston of electrification with-out sufficient regard for cost, combined with its use of the RECs to implementcostly and economically unjustifiable alternative generation and rural devel-opment programs, had left many RECs with precarious financial prospects.Generally, the burdens of past mistakes weakened the RECs' prospects for im-proving their financial health. In many cases, the RECa' financial problemscould be directly related to managerial weaknesses and interference by highlypoliticized Boards in their internal affairs. Even if the RECs as a groupcould have been provided with financial relief, some 25-30 among them facedlimited future prospects on account of franchise areas that are inherently toocostly to serve.
1.6 Throughout its history, NEA performed poorly as both a lender and aprovider of technical support to the RECs. It has been unable to implementprograms for the RECs' operational and financial improvement, largely becauseits already scanty technical staff has been spread too thin. NEA's financialcondition is poor; in 1987-1989, its collection efficiency averaged only 36X.In late 1990, NEA had on its books some P 4.3 billion (about US$150 million)in loans to finance uneconomic mini-hydro and dendro thermal investments, andan undetermined smaller amount of loans for social programs for which it hashad negligible prospects for repayment. Overall, NEA had questionable pros-pects for repaying some P 11.4 billion (about US$407 million) of past loansraised from foreign lenders and from the Government.
1.7 NEA's weaknesses derived from (i) the past emphasis on expansionwithout adequate regard for the financial viability of the RECs; (ii) heavyinvestments in ill-conceived alternative generation projects; (iii) numerousamendments to its charter to broaden its responsibilities; and (iv) a tech-nical capacity that was too thin to support the breadth of those activities.These problems led to a lack of clarity regarding NEA's role, and its conse-quent lack of direction. This lack of a clear focus inhibited NEA from actingas an effective core agency for the sector.
-3
B. Integrated Progam ibr Sector Revitalization
1.8 In February 1989, the Bank conducted a detailed review of the ruralelectrification sector. The findings are given in a report entitled An Znta.,rAeed PraM to Revitalize the Sectgr (Report No. 8016-PH; November 9,1989). The study found that, because of their depth and breadth, the sector'sproblems cannot be addressed piecemeal; rather, an integrated program thataddresses the issues comprehensively should be implemented in systematic fash-ion. The report made the following broad recommendations:
(a) per'Atlongl LficleicS. The RSCs need to implement integrated mea-sures to remedy: (i) excessive system losses; (ii) inadequate main-tenance and unsatisfactory commercial practices; (iii) deterioratedcore systems; and (iv) obsolescent managerial and technical skills.
(b) Invastment Stratgg.. NEA and the RECs need to develop a strategythat focusoe, in the medium term, on investments for: (i) rehabili-tation with infill connections, &nd (ii) expansio-n in selected areasof hlgh consumer density close to existing networks.
(c) jrlcLg. NEA should adjust the RECs' pricing formula to include:(i) incentives to control operating costs, (ii) funds for futureinvestment, and (iiI) incentives for efficient consumption patterns.
(d) Restructuring of the RECs. NEA should encourage RECs willing toimplement operating, investment, and pricing reforms by assistingthem to: (i) depoliticize their boards through the addition of non-elected members of known professional competence, and (ii) restruc-ture their finances by rescheduling or canceling loans that aredeemed not to be repayable.
(e) Restructurlng of NEA. NEA needs to reorient itself to the role oflnterested lender. As such, it needs to streamline its activitiesby dropping a number of functions that are not directly related toelectricity distribution in rural areas, while strengthening func-tions that relate to programming, formulation, and administration ofloans and direct engineering services that enable the RECs to imple-ment investment projects. On the financial side, NEA needs to:(i) get relief from past loans and other liabilities that it lacksthe capacity to repay; and (ii) implement a workable strategy forfinancing the RECs that includes pricing of new loans at levels ade-quate to cover costs (including provisioning against potential for-eign exchange risks), and application of appropriate conditionality.
C Recent Remedial Activities
1.9 Shortly after presentation of the Sector Study ze the Government,NEA's managesmnt took the lead in trying to implement its provisions. Theorganizational restructuring of NEA and the RECs, as well as the redefinitionof their interrelationships, can only be formally accomplished through anamendment to N8A's charter. NEA has already prepared a draft of an acceptable
-4-
new charter and is currently seeking sponsorship for the bill in both housesof Congress. Meanwhile, the Government and NEA have already begun implement-ing many of the key recommendations of the Sector Study:
(a) The Covernment has agreed to a financi_l restructuring plan, underwhich it would relieve NEA of responsibility for P 11.4 billion inquestionable loans (para. 1.6) over the next two years (pare. 5.6).
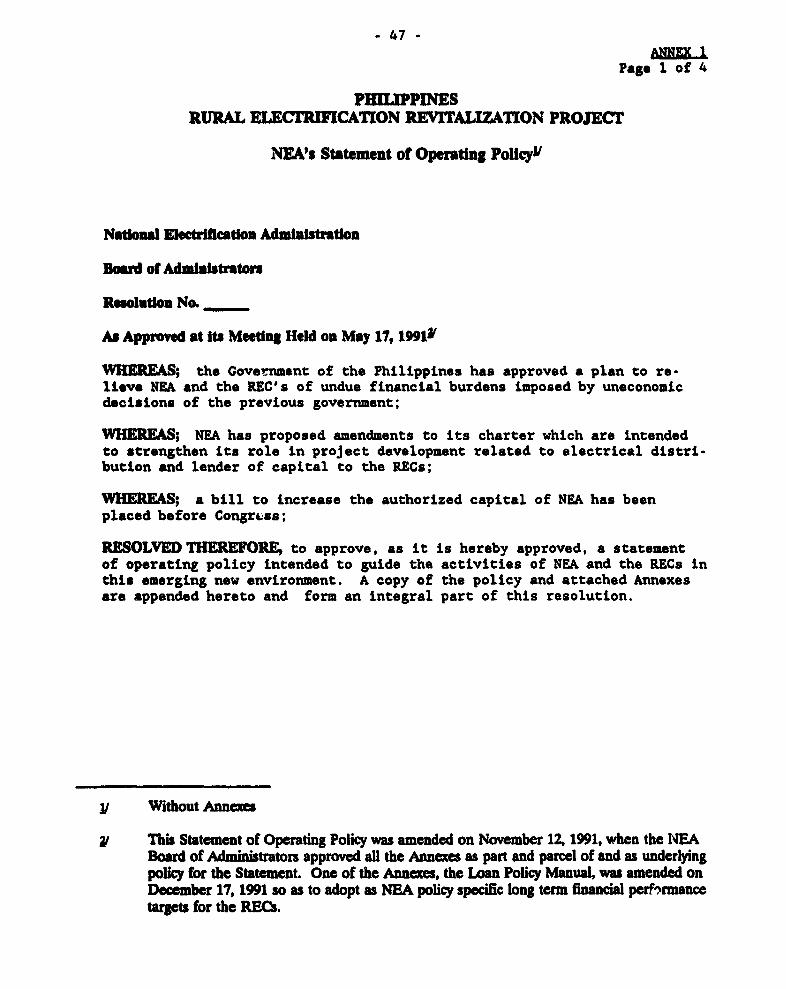
(b) In November 1991, NEA's Board approved a Statement of OperatingPolicy (SOP) (Annex 1.1), which addresses the main policy issues tobe covered formally in the amended charter. The SOP indicates Interall& NEA's intent to confine its activities to lending and servicesrelated to electricity distribution in rural areas, and to use con-ditionality as the primary means of developing discipline among theRECs. The SOP has attached: (i) a draft new charter for NEA; (ii) aFinancing Strategy for the sector; (iii) a Loan Policy Manual togovern NEA's lending operations; (iv) generic Performance Im-provement Programs (PIP), from which operational conditionalityattached to future loans to the RECs can be derived; (v) guidelinesfor formulating and evaluating REC investments; and (vi) a scheduleof fees to be charged for support services not directly related toNEA's loan generation activities. In addition, the SOP refers tothe development of a Tariff Policy Hanual, which will detail NEA'spolicies with regard to the RECs' electricity rates. The annexes tothe SOP were finalized and presented to the November 1991 meeting ofthe NEA Board1l. At negotiations of the proposed loan, NEA agreedthat it will not amend, abridge, or repeal the SOP, any annex there-to, or the Tariff Policy Manual, without prior consultation with theBank. NEA Board adoption of the Tariff Policy Manual would be acondition of effectiveness of the proposed loan.
(c) NEA has made progress toward depoliticization of the RECs by chang-ing managers and reorganizing Boards to the extent allowed under itspresent charter. NEA has already appointed General Managers forabout 54 RECs in the past two years; and in about 12 of those cases,NEA has reduced the Boards to advisory status.
(') While some of the NEA appointees have been more effective than oth-ers, the operational and financial performance of the RECs has beensteadily improving during this period. For example, aggregate sys-tem losses have declined from 25X in 1988 to 21X by the end of 1990;during the same time, collection efficiency improved from 88X in1988 to 901 by the end of 1990. And the most significant improve-ment has been recorded at RECs being managed by NEA appointees.
(e) In late 1990, NEA's Board adopted an electricity pricing formula forthe RECs that includes a provision for self financing of investment.Since then, it has successfully persuaded about 100 RECs to intro-duce substantial tariff increases. NEA expects the remainder to
I/ The Loan Policy Manual was amended in December 1991 to include accept-able long term financial performance targets for the RECs (para. 5.30).
- 5 -
increase their tariffs to the extent required for financial viabili-ty within the next few months.
(f) NEA has developed an investment program for 1991-95, composed of in-vestments with a minimum economic rate of return of 15X. That ih-vestment program forms the basis of the proposed project. The pro-pos.d loan would finance the justifiable investments for some 54 ofthe 120 RECs; NvA expects to finance the justifiablo investments ofthe remaining 50-55 viable RECs with funding from OECF and USAID.
(g) NEA has completed the development of generic PIPs (Dara. 4.24) andhas already begun tailoring them for specific RECs in cornectionvith the evaluation of futuie loans to those RECs.
(h) NEA has recognized tnat it will face a major logistic problem as aresult of the expected substantial growth in the amount of materialsand equipment it wi:l be procuring on behalf of the RFC3. It has,therefore, asked the Bank's agreement to finance from the EnergySector Prc'ect (Loan 3165-PH) technical assistance to develop sys-tems and pzocedures for materials handling at its central and Re-giona] warehouses. Iucing the diagnostic phase of that consultancy,NEA would determine whether it will need assistaniice for implementingthe systems to be develojed (para. 4.19).
1.10 In conjunction with the revitalization program, NEA and the RECsneed substantial resources for institutional development. In particular, theyneed equipment, tools, fixtures, computers, and training. To accommodate theurgency of this requirement, a US$5.3 million institutional development com-ponent was included in the Energy Sector Project. Also, USAID provided NEAwith a US$4.6 million technical assistance grant Inter alla for: (i) the firstphase of a Rural Electrification Master Plan (REMP); (ii) upgrades to theaccounting at NEA and about 43 RECs; and (iii) the development of systems andprocedures for operations and maintenance, commercial practices, and pricingfor those same RECs. Consultants being financed by the USAID gra were mobi-lized in June 1990. Under the proposed project, USAID is plannirg co financethe extension of that technical assistance (para. 4.9) so that the remainir.gRECs may also benefit from similar institutional development efforts.
D. Bank Strategy
1.11 The progress made by the Government and NEA in recent months set thefoundation for the full scale implementation of the revitalization program.Through its agreement to the financial restructuring or NEA, the Governmentsignalled its commitment that this sector needs to be served by healthy insti-tutions. The conditions attached by the Government to that restructuring aredesigned to institutionalize NEA's new role as an Interested lender. NEA hasinvested considerable effo.t in developing the tools to become more effective(i) as a lender to the RECs, and (ii) as the agent for instilling operationaland financial discipline among its borrowers. Thus, the Bank's objective forthe sector is to support with finance, conditionality, and technical assis-tance, the measures needed to ensure that rural households and enterprises can
-6 -
*njoy grid supplied *lectric service of high quality at reasonable cost. Inparticular, the Bank should focus on supporting; (a) economically Justifled
znvg#utmnrA, which hove been formulated and developed according to a soundplanning methodology; (b) the continued institutAonal devylogment of NEA andthe & Z[, through appropriate technical assistance and training; (c) the de-velgoomnt of greater go.rationa1 and financial discioline amon the RECs,through tho use of tailored PIPs as conditionality to NEA's loans; and(d) K tionalii of SEC irGlL, through the implementation of a soundpolicy framework provided in the Tariff Policy Manual.
Previous Balnk Involvement In the Sector
1.12 The Bank's only previous loan to NEA (Loan 1547-PH; US$60 million;1978) financed mainly electricity distribution investments that were initiatedduring 1980-82. The project was completed in 1983, and an audit was prepared(PPAR No. P-5372; June 1985). The project largely met its objectives; how-ever, (i) some start up difficulties in procurement were encountered, and(ii) the RECs' financial performance was uneven. In 1989, a US$22.2 millioncomponent of the Energy Sector Project (Loan 3165-PH) was allocated to NEA tosupport rural electrification investments. NEA has performed well so far,experiencing only minor procurement delays at the outset; however, projectconstruction has only just begun. Also, because the Government wan the Bor-rower under the Energy Sector Project and NEA received its allocation from theproceeds under a Subsidiary Loan Agreement, NEA has encountered problems withthe operation of the Special Account. The proposed project will benefit con-siderably from the effort spent under the Energy Sector Project to developprocurement documents; this should mitigate some of the early delays and inef-ficiencies related to procurement. The recent REC tariff increases combinedwith the PIPs should address the RECs' uneven financial performance. Finally,since NEA will be the Borrower of the propoied loan, it can manage the SpecialAccount as needed.
E. Rationale for Bank Involvement
1.13 Through the Rural Electrification Sector Study, the Bank helpeddevelop a comprehensive, integrated program to address the issues facing thesector. Moreover, when the study's findings were discussed with all relevantagencies of the Government in September 1989, the Bank helped in developing aconsensus that the program needs to be implemented broadly and comprehensive-ly. In the past eighteen months, the Bank has offered guidance and technicalsupport for NEA's efforts to implement the program. The proposed project af-fords the Bank the opportunity to continue its close involvement with imple-mentation of the program by supporting it financially. Moreover, because ofthe Bonk's unique understanding of the issues, it is positioned to strike abalance between the divergent interests of the Government's electric power,plannUig and finance establishments. Finally, the proposed project will af-ford tne Bank the opportunity to continue providing high level technical ad-vice for all phases of the revitalization program.
- 7 -
2. THE BORROWER
A. Background
2.1 The Borrower of the proposed loan will be NEA. The loan proceedswill be onlent to finance investment programs of about 54a of the 120 RECscurrently under NEA's jurisdiction.
2.2 NEA's charter (Republic Act No. 6038; June 1969) gives it two pri-mary responsibilities. First, NEA is the core agency for implementing theGovernment's rural electrification policy. Second, it is responsible forproviding support to the RECs in realizing their electrification objectives.To meet these responsibilities NEA performs two functions: (i) financing ofinvestments in electricity distribution networks in provincial towns and vil-lages and rural areas; and (ii) providing technical. assistance and operatingguidelines to the RECs. Over the years, NEA was given a number of other rolesand granted additional powers through a series of amendments to its charter.Among these secondary responsibilities are: (i) supervision of the RECs' tech-nical and managerial activities; (ii) regulation of the RECs' electricitycharges; (iii) execution of the Government's alternative generation policy;and (iv) implementation of certain social programs un-elated to electrifica-tion. The NEA charter also provided for the organization of RECs to constructand operate electricity distribution networks throughout the country'.
2.3 NEA's past poor performance has primarily been attributable to:(i) a loss of institutional focus, resulting from the wide rar.ge of NEA's man-dated activities; (ii) constrained resources, resulting from the Government's
V Originally, 50 RECs were slated to receive financing from the proposedloan; four RECs with small investment programs were added at negotia-tions (Bohol I, Cebu II, Tarlac I and Iloilo I). While their investmentprograms and circumstances had been appraised, some of the data neededfor this appraisal report, specific to those RECs, was not readilyavailable.
jv The RECs are organized as non-stock, non-profit membership corporationsto distribute electric power in designated and predominantly rural fran-chise areas, where they essentially act as regulated monopolies. TheRECs are granted the general powers of a corporation and the memberselect a Board of Directors,for periods of between 2 and 4 years, to ex-ercise those powers. The Officers of the RECs are drawn from the Board.Directors can be elected to an unlimited number of terms. The Directorsalso appoint a General Manager to be responsible for executing the poli-cies set by the Board. All households and enterprises within the fran-chise's jurisdiction are eligible to become members of the REC. Memberscontribute a one time statutory established fee of P 5. These membershipfees represent the REC's paid-in capital.
-8-
decision that NEA should borrow foreign exchange and onlend pesos at highlyconcessional rates; and (iii) overwhelmed staff, as a result of having toperform many tasks that did not build on resident experience and often exceed-ed their technical capabilities. These problems were articulated in theBank's rural electrification sector study.
B. NEA's Role
2.4 Following discussion of the sector study, the Government decided toreorient NEA towards its original responsibilities while reducing the scope ofits other activities. The Government felt that the RECs could, ln extremls,obtain technical support from other sources; however, no other institutioncould lend to the RECs, generally weak institutions delivering essentialthough capital intensive services. Thus, NEA neads to reorganize to play therole of "interested lender" (para 1.8). This reorganization will require thatNEA (i) upgrade its lending activities; (ii) shed other activities that do notrelate directly to lending or provide support for the RECs capacity to deliverelectricity service; and (iii) charge fees for services that are not endemiccomponents of loan origination or administration. This reorganization will beformalized through Congressional approval of an amendment to its charter; inthe meantime, the SOP establishes the framework for this new role.
2.5 Currently, NEA provides the RECs with a number of services that arenot directly related to loan formulation or administration, but which aredeemed essential to the RECs' capacity to function effectively. Foremostamong these are (i) procurement, (ii) materials handling, and (iii) projectengineering. The procurement function is currently being strengthened througha consultancy being financed by USAID, while the materials handling functionwill be strengthened with technical assistance being financed by the Bankunder the Energy Sector Project (para. 4.19). NEA's retention of consul-tants, according to terms of reference and procurement procedures acceptableto the Bank, to provide technical assistance effort in the area of materialshandling is a condition of effectiveness of the proposed loan. NEA's projectengineering service is considered adequate, given the present scope of itsactivities.
C. Organization and Management
2.6 NEA is a wholly Government owned corporation. NEA's powers andresponsibilities are exercised by the Chairman and four other individuals ap-pointed to the Board of Administrators by the President of the Philippines.Board members are appointed for six year terms. They meet periodically (usual-ly monthly) to establish the policies for NEA and to set its overall direc-tion. Responsibility for NEA's day-to-day management is left to the Adminis-trator, who serves as NEA's chief executive officer and also an ex-officiomember of the Board. The Board is also responsible for regulating REC tar-iffs. The National Electrification Commission - Technical Staff (NEC-TS) is aseparate unit that advises the Board regarding the adequacy and appropriate-ness of REC electricity charges (para. 5.31).
- 9 -
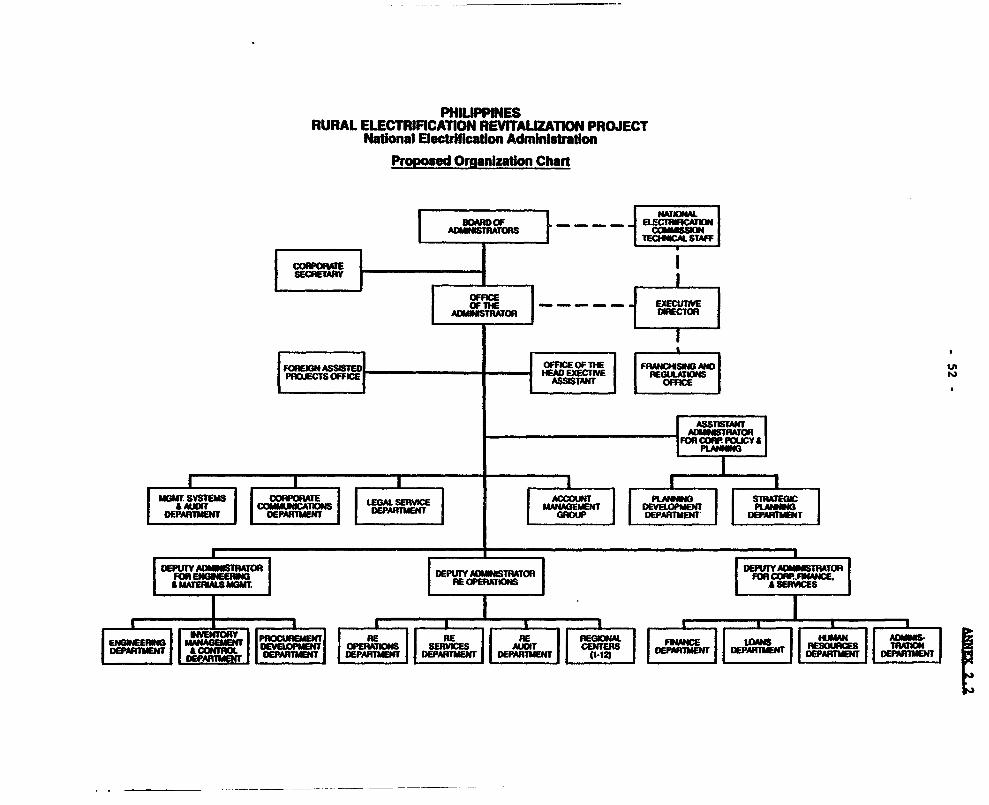
2.7 NEA's Administrator is assisted by three Deputy Administrators,each heading a major group within the organization. The Technical ServicesGroup is responsible for: (i) project engineering; (ii) materials handling andwarehousing; (iii) construction, and operation and maintenance; and (iv) al-ternative energy systems. The COOP Development Group is NEA's primary organi-zational link to the RECs, and provides them services in the areas of institu-tional strengthening, performance monitoring, and management systems support.The Finance and Administrative Group performs all of NEA's own finance, ac-counting and loan administration functions as well as providing the generaladministrative and personnel related services. NEA's current organizationchart is presented in Annex 2.1.
2.8 The current organization has two major weaknesses. First NEA has apoor history of loan administration and collections. Second, NEA has notuntil recently taken seriously the investment planning function and still hasnot developed a loan programming function. In anticipation of its change infocus, NEA has recently developed a transitional organizational structure(Annex 2.2) to enable it to (i) implement a disciplined financing strategy,and (ii) encourage operational and financial discipline among the RECs. As afirst step, NEA created a new Accounts Management Department to execute lend-ing policies, formulate conditionality, supervise project implementation andmonitor REC operational performance. In addition, this unit will have respon-sibility for formulating the Evaluation Reports that will serve as the basisfor NEA's future lending to the RECs (para. 4.8). As a second step, NEA willdelegate a number of its activities to its field organization; these includewarehousing, some aspects of REC monitoring, and major repair and maintenance.Finally, a Strategic Planning unit will be formed to set common objectives forall of NEA's units, and to coordinate their activities.
D. Staffing
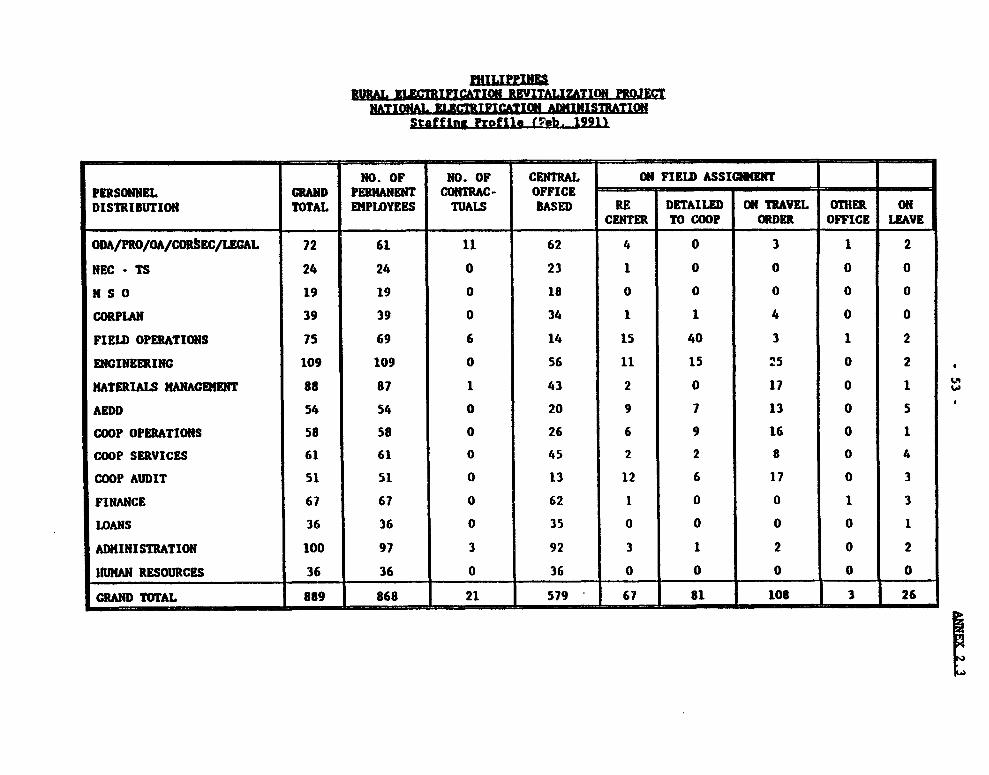
2.9 NEA presently employs about 870 staff, most of whom are located atits headquarters. A staffing profile is shown in Annex 2.3. Most of theincumbents in professional grades have technical jobs in electric utilityoperations, construction, project engineering, procurement, accounting andadministration. Few of the professionals are experienced in financial opera-tions, financial analysis, loan programming, or loan administration.
2.10 Following discussion of the sector study, NEA asked if it couldsupplement its weak capabilities in these latter areas by retaining a bank ora major financial institution, under a technical assistance to be financedfrom the Energy Sector Project, to provide on-the-job training to NEA staffand supervisory services in the loan processing and administration functionsover the next few years. NEA's retention of consultants, according to termsof reference and procurement procedures acceptable to the Bank, to provideassistance with NEA's loan administration function is a condition of effec-tiveness of the proposed loan.
- 10 -
E REC Perfonnance Monitoring
2.11 The newly established Account Management Group will have the over-all responsibility (with day-to-day assistance from NEA's field organization)for monitoring the performance of the RECs and will tie this review and evalu-ation directly to NEA'a willingness to make future loans. An a condition ofborrowing from NEA, the RECs will be required to implement PIPs (para. 4.24);these will provide NEA with a basis for monitoring each REC's implementationof meaningful activities related to its own circumstances. NEA will continueto require that the RECs have their accounts audited; over time, it will re-duce the scope of audit services being provided to the RECs, and requiro thatthe REC. employ private certified accountlng firms, where possible and appro-priate, for the conduct of the financial audit.
F. Accounting Systems and External Auditing
2.12 NEA uses a manual accounting system, which is a dual entry, accrualbased adaptation of the procedures followed by all Government institutions.With some modifications, the system is acceptable (para 5.17). NEA has an in-ternal auditing group that establishes internal controls and conducts its ownreview of NEA's books. Its accounts are also audited annually by the Commis-sion on Audits (COA), the government's official auditor. In addition to au-diting NEA accounts, COA performs management and compliance audits of theorganization. During negotiations NEA agreed to furnish to the Bank by Sep-tember 30 of each year, its annual financial statements certified by an ac-ceptable auditor. To facilitate the Bank's supervision efforts, NEA providedan understanding that it would furnish the Bank with its unaudited financialstatements by May 15 of each year.
G. Taxes
2.13 In 1986, NEA lost the tax exemptions that were built into its char-ter. It is currently liable for income taxes (levied at 35X of taxable in-come) and other smaller taxes, and make arrangements with regard to customsduties on a case-by-case basis.
H. Scurity and Insurance Aangements
2.14 All NEA loans are secured by first mortgages on materials andequipment released to the RECs. In addition, the RECs must obtain NEA's ap-proval before assuming other debt obligations. NEA is required to insure allits property. It has generally complied with this requirement; however, NEAhas not undertaken a rlsk management assessment to determine the appropriate-ness of its coverage. In the past, NEA has required that the RECs insuretheir respective assets but few have complied because of the high premiums.Under the proposed project, NEA will be expected to comply with the insuranceprovision included in the general Conditions; this condition could be met byNEA's enforcing the RECs' compliance with its existing insurance requirement.
- 11 -
3. THE ELECTRICITY MARKET
A. REC Markets
3.1 Most of the 120 RECI were created during the 1970s (Annex 3.1.They now provid, electricity to about 1,300 towns (931 of the total), andserve more than three million consumers. To a degree, the expression "RuralElectrification" inaccurately depicts the markets they serve; they cover theentire Philippines, including major cities other than Manila, Cebu, Davao andBatangas; provincial urban centers; as well as towns and truly rural areas.
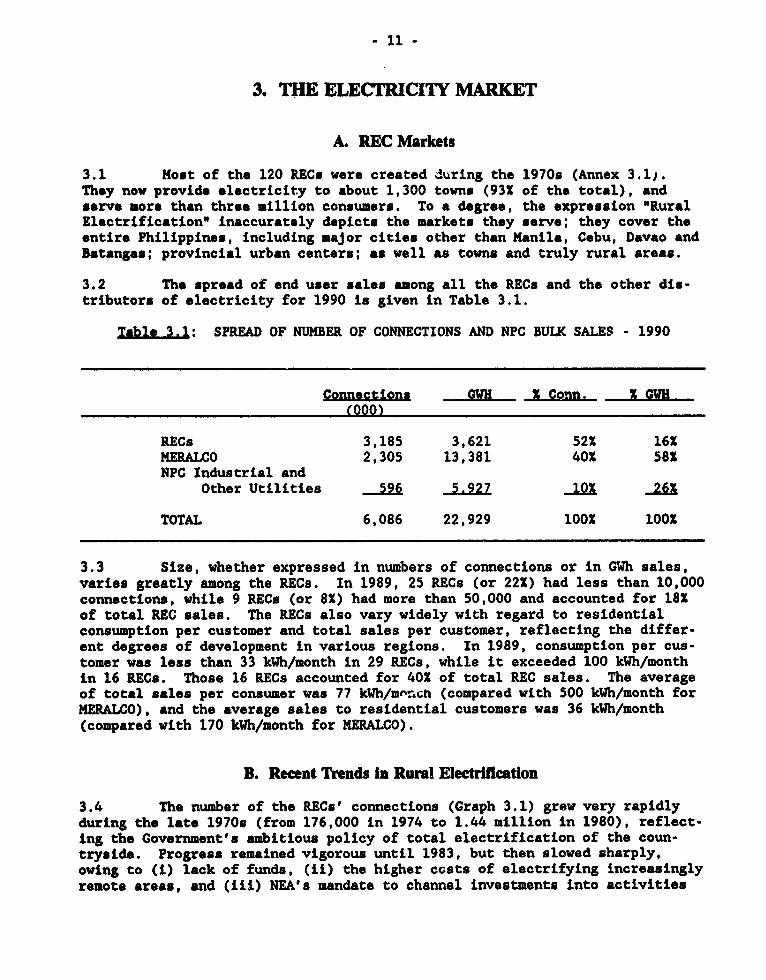
3.2 The spread of end user sales among all the RECs and the other dis-tributors of electricity for 1990 is given in Table 3.1.
Table 3.1: SPREAD OF NUMBER OF CONNECTIONS AND NPC BULK SALES - 1990
3.3 Size, whether expressed in numbers of connections or in GWh sales,varies greatly among the RECs. In 1989, 25 RECs (or 221) had less than 10,000connections, while 9 RECs (or 81) had more than 50,000 and accounted for 181of total REC sales. The RECs also vary widely with regard to residentialconsumption per customer and total sales per customer, reflecting the differ-ent degrees of development in various regions. In 1989, consumption per cus-tomer was less than 33 kWh/month in 29 RECs, while it exceeded 100 kWh/monthin 16 RECs. Those 16 RECs accounted for 401 of total REC sales. The averageof total sales per consumer was 77 kWh/m'-cn (compared with 500 kWh/month forMERALCO), and the average sales to residential customers was 36 kWh/month(compared with 170 kWh/month for MERALCO).
B. Recent Trends in Rural Electrification
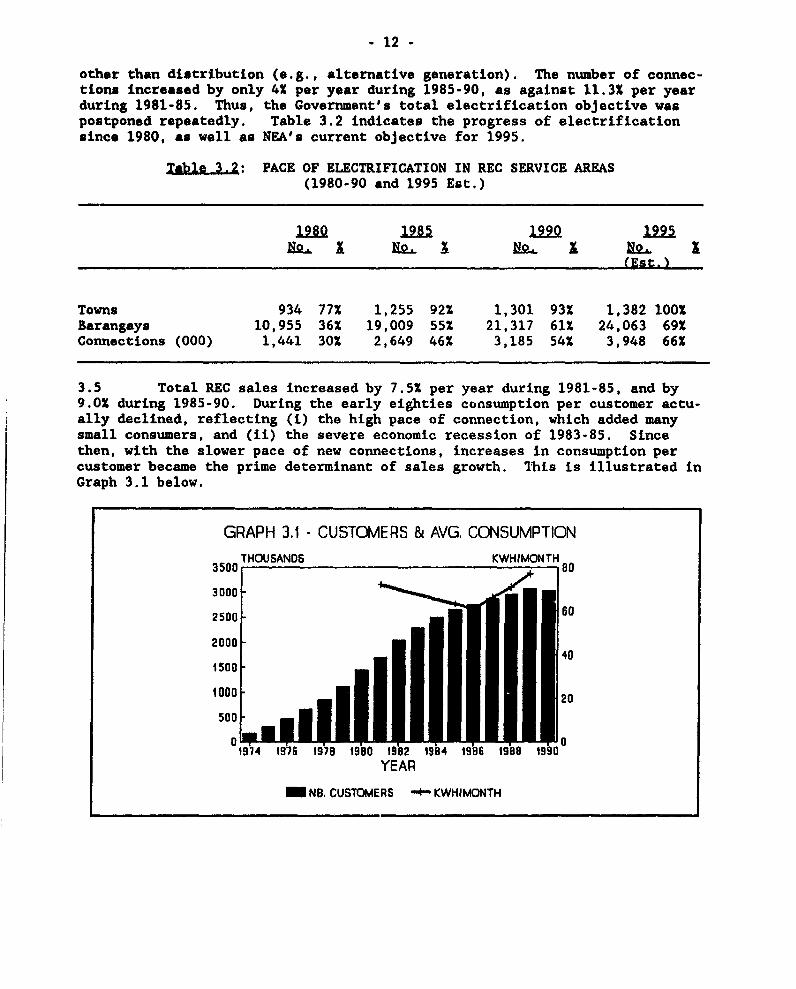
3.4 The number of the RECs' connections (Graph 3.1) grew very rapidlyduring the late 1970s (from 176,000 in 1974 to 1.44 million in 1980), reflect-ing the Government's ambitious policy of total electrification of the coun-tryside. Progress remained vigorous until 1983, but then slowed sharply,owing to (i) lack of funds, (ii) the higher costs of electrifying increasinglyremote areas, and (iii) NEA's mandate to channel investments into activities
- 12 -
other than distribution (e.g., alternative generation). The number of connec-tions increased by only 4X per year during 1985-90, as against 11.3X per yearduring 1981-85. Thus, the Government's total electrification objective waspostponed repeatedly. Table 3.2 indicates the progress of electrificationsince 1980, as well as NEA's current objective for 1995.
Table 3.2: PACE OF ELECTRIFICATION IN REC SERVICE AREAS(1980-90 and 1995 Est.)
3.5 Total REC sales increased by 7.51 per year during 1981-85, and by9.01 during 1985-90. During the early eighties consumption per customer actu-ally declined, reflecting (i) the high pace of connection, which added manysmall consumers, and (ii) the severe economic recession of 1983-85. Sincethen, with the slower pace of new connections, increases in consumption percustomer became the prime determinant of sales growth. This is illustrated inGraph 3.1 below.
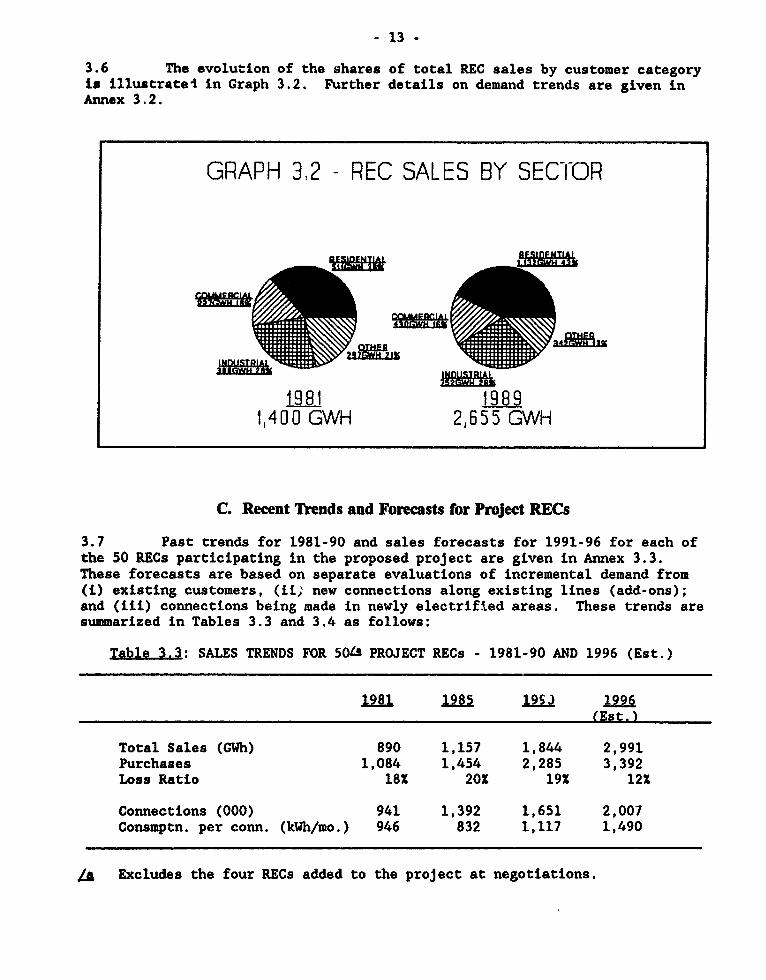
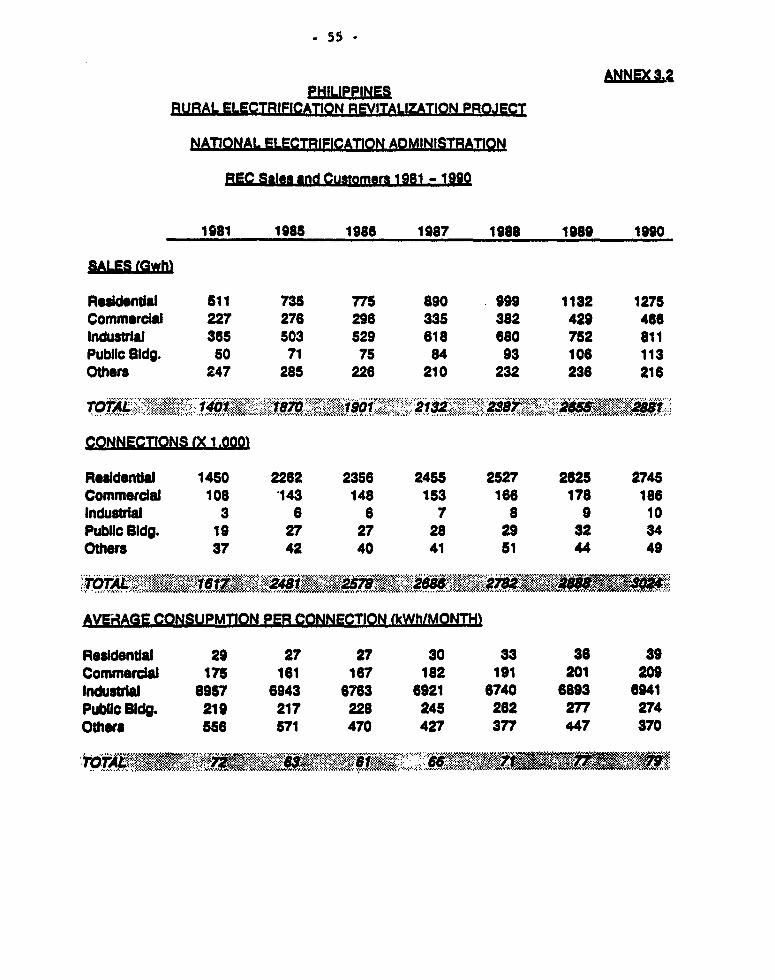
3.6 The evolution of the shares of total REC sales by customer categoryis illustratei in Graph 3.2. Further details on demand trends are given inAnnex 3.2.
GRAPH 3.2 - REC SALES BY SEC-T-OR
1981 1981,400 GWH 2,6 5 5 GWH
C. Recent Trends and Forecasts for Project RECs
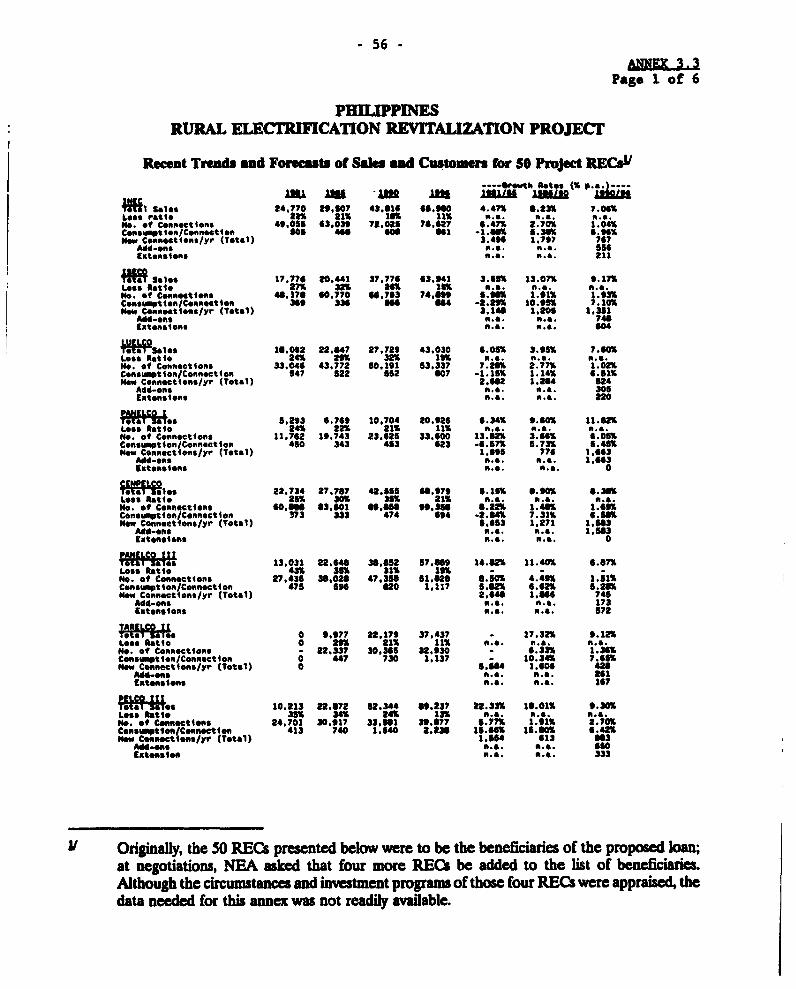
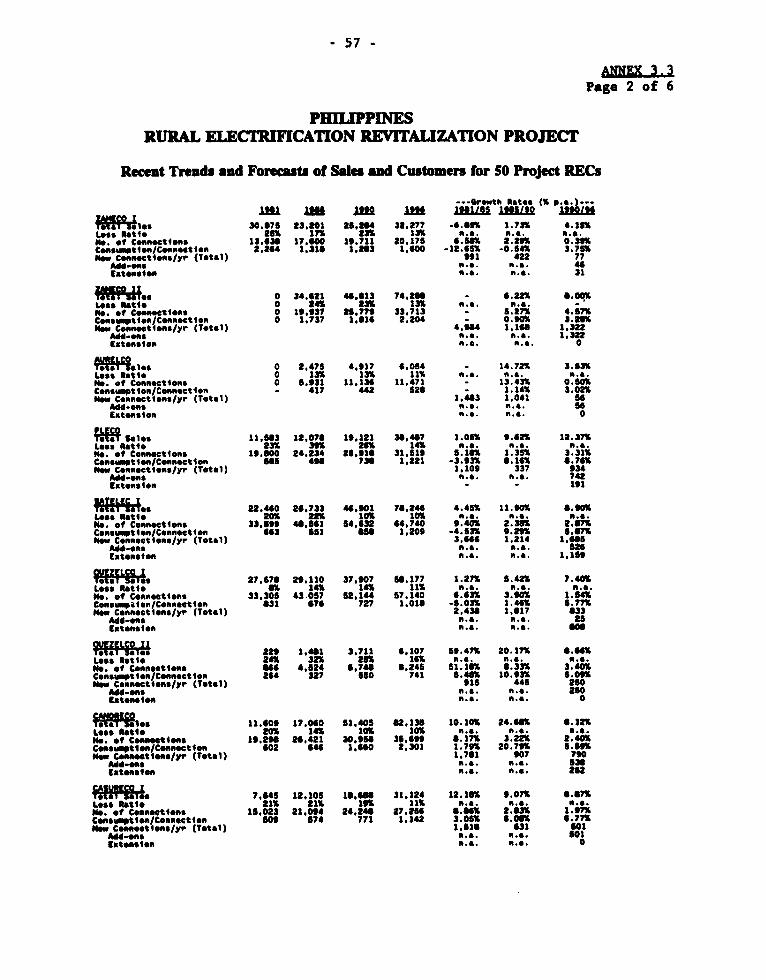
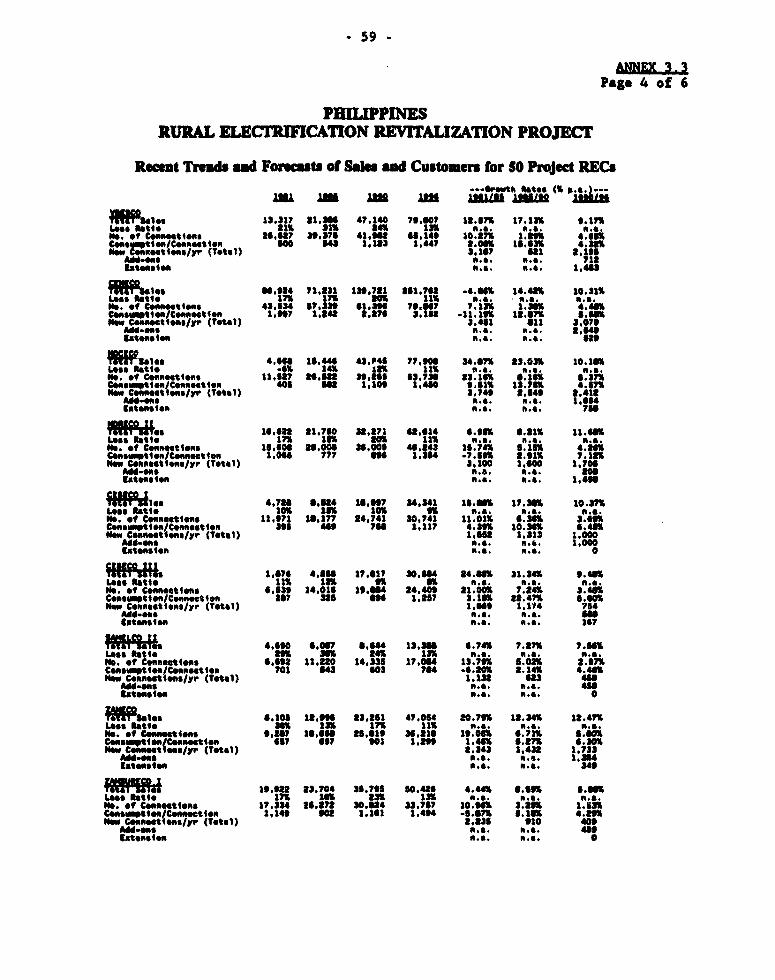
3.7 Past trends for 1981-90 and sales forecasts for 1991-96 for each ofthe 50 RECs participating in the proposed project are given in Annex 3.3.These forecasts are based on separate evaluations of incremental demand from(i) existing customers, (ii; new connections along existing lines (add-ons);and (iii) connections being made in newly electrified areas. These trends aresummarized in Tables 3.3 and 3.4 as follows:
Table 3.3: SALES TRENDS FOR 50L PROJECT RECs - 1981-90 AND 1996 (Est.)
1981 198 192s 1996(Est.)
Total Sales (GWh) 890 1,157 1,844 2,991Purchases 1,084 1,454 2,285 3,392Loss Ratio 18X 20X 19X 121
New Connections (No./year) 112,605 51,881 59,365Add-ons 38,460Extensions 20,904
La Excludes the four RECs added to the project at negotiations.
D. Future Studies and Improvements in Load Forecasting
3.8 The methodology for deriving the demand forecast (defined in Annex6.1, in the context of a general discussion of NEA's overall planning meth-odology) that provides the basis for the proposed project represents a consid-erable improvement over NEA's past practices, and the aggregate forecast it-self, while reasonably conservative, is acceptable for appraisal purposes.However, NEA can (and should) further improve its methodology for load fore-casting at the REC level. In particular, NEA and the RECs need to sharpentheir understanding of the dynamics of consumption in newly electrified areasand thereby refine their market analysis for specific extension schemes.These market analyses need to focus on factors such as demographic trends,economic activity, and infrastructure development. This new emphasis or. mar-ket analysis is adequately reflected in the Investment Guidelines, which wasapproved by the NEA Board as an adjunct to the SOP. NEA will receive the helpneeded to upgrade its load forecasting methodology through the technical as-sistance being provided under the proposed project (para. 4.9).
- 15 -
4. THE PROJECT
A. Investment Progamming and Project Preparation
4.1 Between 1971-83, NEA channeled to the RECs about $20-30 million peryear in loans from official foreign sources. Donor enthusiasm for NEA and itsprograms began waning in 1981, and declined steeply as of 1983. From 1984-89,NEA's most significant lending did not support the RECs' capital expansion;rather, the Government provided 9 500 million for a Relending Program, wherebyNEA financed the efforts of 25 floundering RECs to meet their arrears to NPC.In 1989, based on a 1987 study conducted by Price Waterhouse and Co. and theNational Rural Electric Cooperatives Association International Ltd. (NRECA),USAID made available about US$13 million to support (i) the rehabilitation ofnetworks in eighteen of the leading RECs, and (ii) technical assistance aimedat upgrading the accounting, operations and maintenance, commercial practicesand financial performance of those RECs as well as the 25 participating inNEA's Relending Program. This USAID financing is expandable to $40 million,and future phases of the project would include, Inter alla, parallel financingof the technical assistance and training being provided under the proposedproject. Also in 1989, the Bank provided NEA with $22.2 million under theEnergy Sector Project to support (i) the rehabilitation requirements of 12RECs, (ii) power supply upgrades for eight other RECs, and (iii) substantialinstitutional development for NEA, itself. The USAID and Bank financed pro-jects were intended to serve as forerunners to future lending.
4.2 Previously, NEA used en ad hoc approach to investment programming.Az NEA received materials and equipment, they were allocated to RECs based onplans for increasing the number of consumer connections. Under the ongoingUSAID and Bank financed projects, the recipient RECs were chosen from amongthe best performers in the country; and the schemes being financed, once se-lected, were anaiyzed to ensure that their economic rates of returns weresatisfactory. During 1990-91, NEA greatly improved its investment planningmethodology. The framework for an annual planning exercise, together with anoutline of the methodology to be followed and the criteria for evaluating andprioritizing investments, are set out in the Investment Guideline that is anannex to the SOP. It provides for the RECs to furnish plans that are preparedaccording to prescribed formats, taking account of constraints that had beenadvised by NEA. The process provides for substantial discussion between NEAand the RECs, and consideration of investments within a REC specific and aRegional context. Ultimately, NEA aims to refine the current process by(i) delegating greater responsibility for data gathering and analysis to theRECs, and (ii) developing procedures for verifying the data provided by theRECs. During negotiations of the proposed loan, NEA agreed to (i) conductjointly with the Bank an annual review of its investment program for the nextfive years and its investment accomplishments for the last two years, and(ii) adopt any mutually acceptable adjustments.
4.3 The proposed project identified by NEA for Bank financing involvesschemes included in the 1992-95 investment plans of some 54 RECs; constructionof any scheme to be financed by the proposed loan will have to begin before
- 16 -
the end or 1994. The RECs that would be financed under the proposed projectwere chosen at random; they represent a cross section of all RECs based ongeographical distribution, operational and financial performance, and futureprospects. The methodology used for formulating Bank financed investments isthe same as is being used in connection with other donors; and NEA intends toapply loan terms and conditionality on a source neutral basis.
B. Project Objectives
4.4 The proposed project aims at supporting the revitalization programby (i) enhancing NEA's capability to function as an effective core agency forthis sector through its application of sound strategies for evaluating andsolecting investments, supervising the implementation of schemes, and financ-ing the RECs; (ii) encouraging operational and financial reforms among theRECs through NEA's judicious use of conditionality; (iii) improving the avail-ability of reliable electricity supply in rural areas by financing a portionof NEA's 1992-95 investment program; and (iv) providing for NEA and the RECstechnical assistance and training needed for institutional development.
C. Project Description
4.5 The proposed project consists of two urgently needed ccmponents:(i) an institutional development component aimed at restructuring NEA and theRECs, and (ii) an investment component aimed at providing urgently needed newfacilities or upgrades to existing facilities:
(a) The InstitutlonaL Development Component would be implemelitedthrough (i) application of conditionality on NEA's future loans tothe RECs; and (ii) office equipment, technical assistance andtraining to be provided under the proposed project, including aprovision to complete the REMP that was begun with USAID financing.
(b) The Inyestment ComDonent consists of specific schemes from NEA's1992-95 investment program, and was structured to enable the Bankto monitor all aspects of NEA's project cycle. Activities beingfinanced under this component include: (i) system rehabilitationand reinforcements, including needed upgrades to substations, feed-er lines, secondaries, branches, and service drops as necessary,aimed at improving the reliability of power supply and customerservice; (ii) connection of prospective consumers within a reason-able distance of existing lines; and (iii) economically justifieddistribution system extensions.
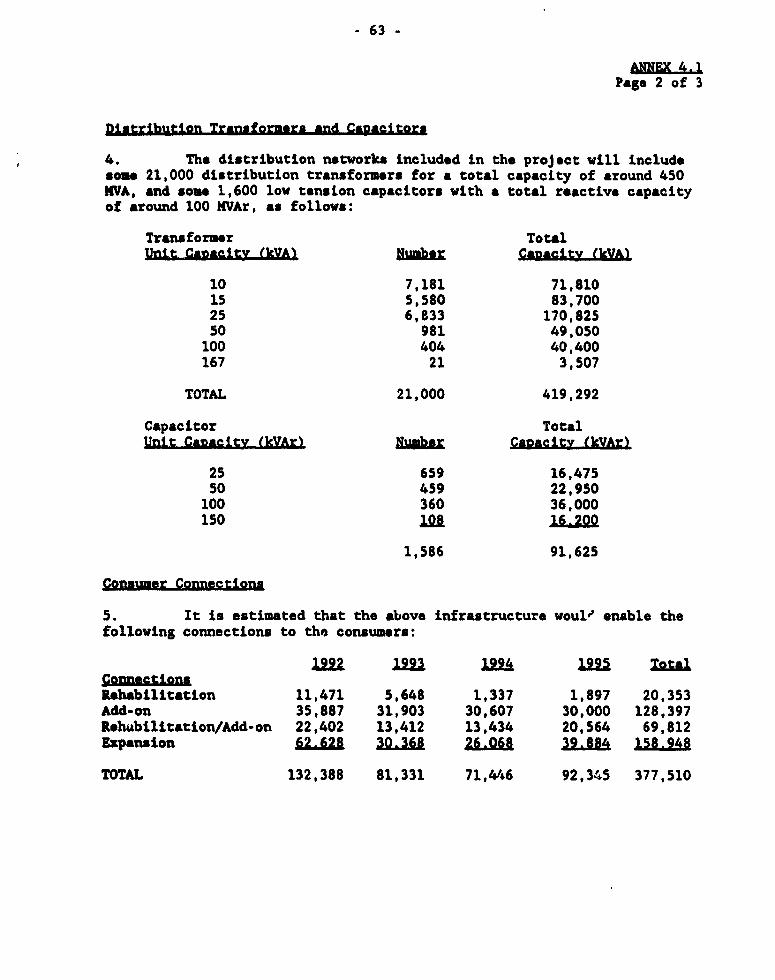
4.6 The proposed loan would finance the purchase and installation ofmaterials and equipment as well as services for the following endeavors (de-tails in Annex 4.1):
- 17 -
(a) REC Distributio2 Systems
(i) construction of forty 69/13.2 kV substations of 5, 10 or 20MVA each at about 25 RECs, and upgrading of about 15 substa-tions at about six other RECs with the addition of a total ofaround 550 MVA of transformer capacity;
(ii) construction of about 4,300 km of 13.2/7.6 kV three phase andsingle phase primary lines, and about 2,500 km of 220/110volts secondary lines and installation of about 21,000 distri-bution transformers with a total capacity of around 450 MVA atabout 54 RECs;
(iii) service materials for connection of around 400,000 consumers,including service connections, meters and some 1,600 low ten-sion capacitors (around 100,000 kVAr) at about 54 RECs;
(b) SupRort Facilities
(i) support equipment, including tools; services vehicles; andtesting, office and communication equipment for about 54 RECs,and computers for the remaining RECs;
(ii) infrastructure and support facilities for NEA, including re-gional offices, buildings at zonal repair centers, a trainingcenter, a workshop, and warehouses, and the equipment neededfor those facilities (including Inter alia computer hardware,mobile substations, etc); and
(c) Training and Technical Assistance. Consulting services and train-ing to assist NEA and the RECs in project execution, operation andmanagement (including upgrading of technical and financial skills).
D. Project Design and Engineering
4.7 The design of rural electric networks in the Philippines is basedon the single phase system used in the United States. Over the years, NEA andthe RECs have gained the necessary competence to perform most of the designfunctions themselves. Because NEA's past policies gave expansion of distribu-tion lines priority over maintenance and repair of existing system, the condi-tion of many lines has deteriorated to the point where consumers suffer lowand often fluctuating voltage levels and repeated power interruptions. NEA'semphasis has now shifted to quality of services and the operational and finan-cial viability of the RECs. Therefore, some modifications have already beenintroduced into the design and engineering of recent works. Still, to reflectthe lessons of past experience, further action is needed--including, more de-tailed mapping, and adjustments to design and operations--to reduce systemlosses and raise the system power factor.
4.8 The facilities included in the proposed Project would be construct-ed in the service areas of various RECs, spread throughout the country (Map
- 18 -
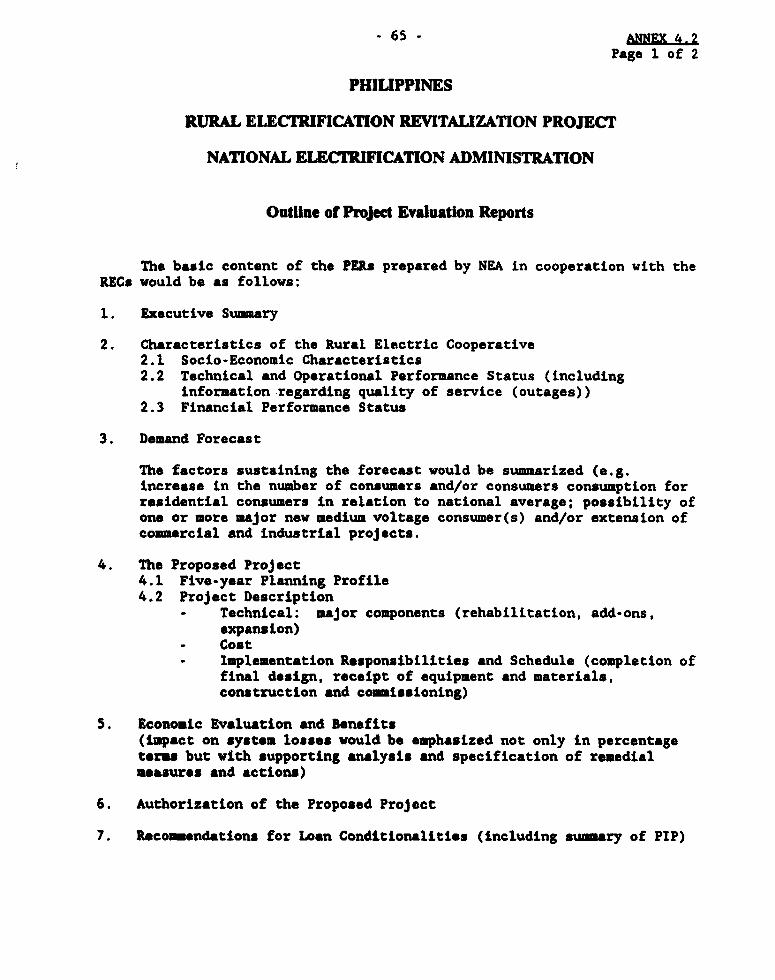
IBRD 232 .7) To (i) assexs the viability of the selected schemes, (ii) con-sider the Impact of these investments on the RECs, and (iii) strengthen theRECs by addressing operational and financial weaknesses through the applica-tion of PIPs, NEA will prepare a Project Evaluation Report (PER) for each REC.An outline for these reports is shown in Annex 4.2. Before negotiations, NEAfurnished ten satisfactory PERs to the Bank; during negotiations, NEA agreedto provide the remaining PERs to the Bank according to an agreeable schedule.It further provided an understanding that it would complete 20 more by March31, 1992 and the remaining 24 by September 30, 1992. Each PER will include asection on environment; where there are no environmental issues, this will beso stated in the PERu.
E. Technical Assistance and Training
4.9 The technical assistance and training program included in the pro-posed project would consist of three main components:
(a) Strengthening the PlannIng Ca2abilit.les of NEA and the REC. NEA'scurrent planning methodology is adequate for now, when many RECshave a backlog of justifiable investments. However, the initialplanning exercise has revealed the need to focus more on load fore-casting, network mapping and design and the definition of technicalparameters. More importantly, future plans will need to rely moreheavily on inputs from the RECs themselves, with ground truthing tobe performed by NEA. To accomplish this, the planning capabilitiesof NEA and RECs need to be strengthened, and the network requiire-ments for the medium term need to be established.
(b) Extendin, tg all RECs the Institutional Asslstance Being Providedto the Beneficlaries of the Ongoing USAD Proglect. This includes(i) developing accounting manuals, and providing training to theusers; (ii) adjusting existing budgetary systems to enable the more
effective management of REC operations; (iii) introducing a comput-erized billing system adaptable to an integrated information sys-tem; (iv) recommending adjustments to existing rate setting proces-ses based on the provisions of the tariff manual (para. 5.38); and
(v) developing training to meet managerial, operational, mainten-ance and administrative needs.
(c) Znal Maintenance Centers. This technical assistance would includethe design, preparation of specifications for the purchase ofequipment and tools, and training during start-up operations forNEA's seven major repair and maintenance centers (para 4.23).
4.10 Altogether, implementation of this technical assistance and train-ing program is expected to require about 200 person-months of consulting for
the preparation of documents and manuals, field training, courses and studytours. USAID, which would parallel finance (para 4.12) this project compo-nent, is preparing the scope of work and terms of reference for these activi-ties based on discussions with the Ban*. Procurement with regard to thiscomponent would follow USAID procedures.
- 19 -
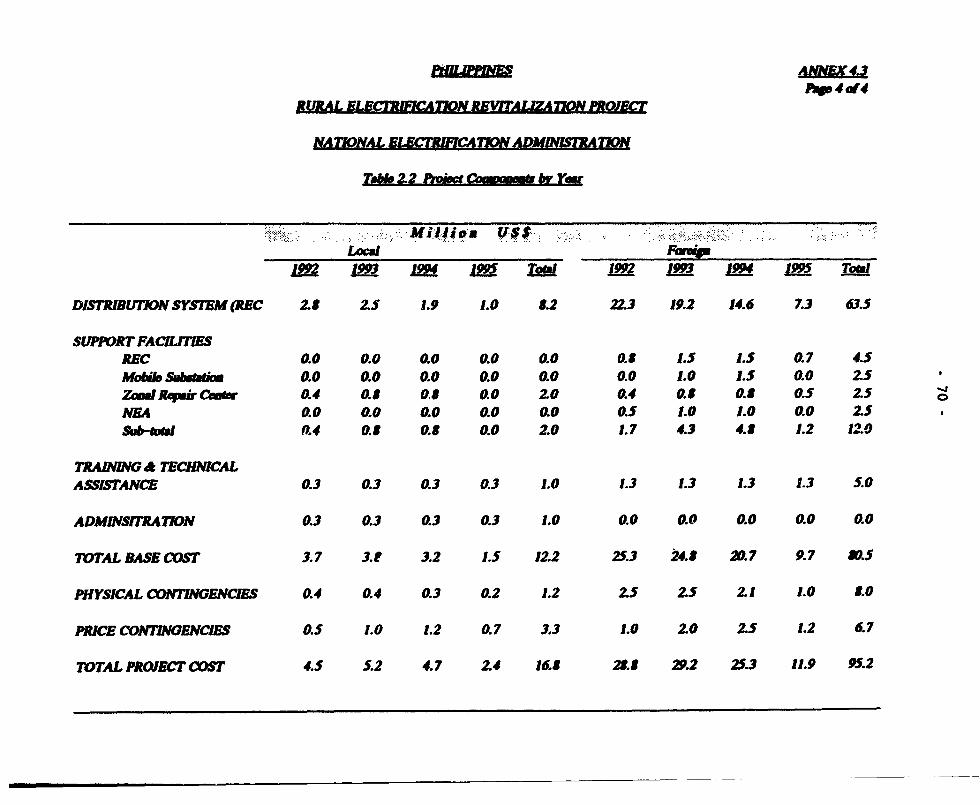
F. Project Cost
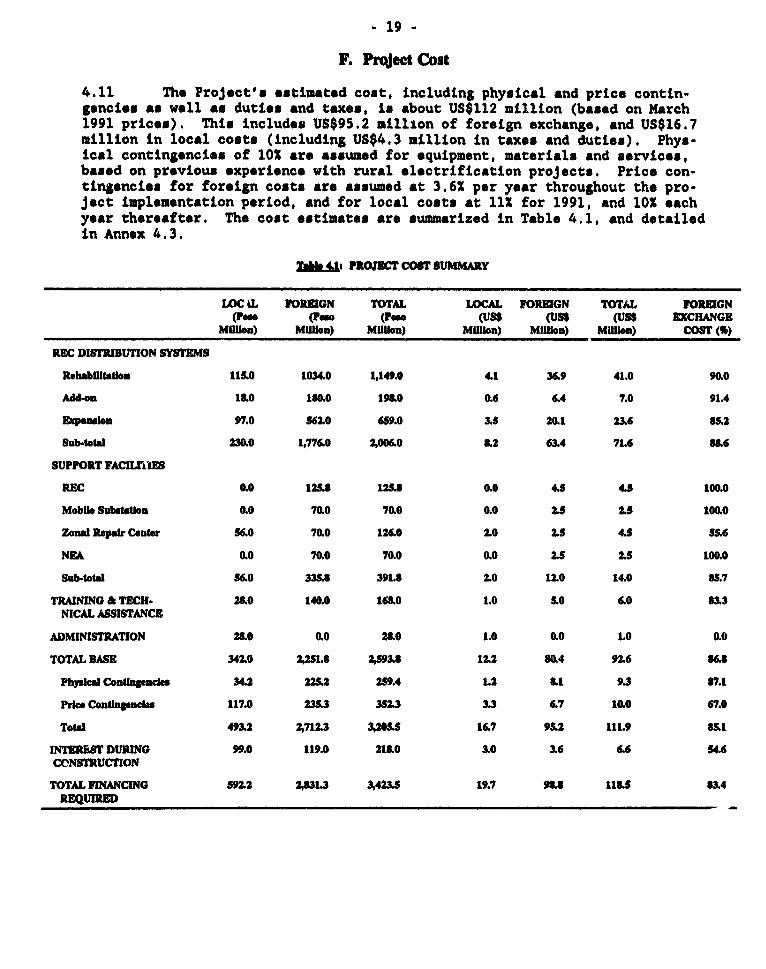
4.11 The Project's estimated cost, including physical and price contin-gencies as well ax duties and taxes, in about US$112 million (based on March1991 prices). This includes US$95.2 million of foreign exchange, and US$16.7million in local costs (including US$4.3 million in taxes and duties), Phys-ical contingencies of 10 are assumed for equipment, materials and services,based on previous experience with rural electrification projects. Price con-tingencies for foreign costs are assumed at 3.6X per year throughout the pro-ject Implementation period, and for local costs at 11 for 1991, and 10 eachyear thereafter. The cost estimates are summarized in Table 4.1, and detailedin Annex 4.3.
IahJ PROjCr COI SUMMAY
LOC L FOREIGN TOTAL WCAL FOREIGN TOTAL FOREIGN(Pe (PO (Poe (U8$ (USS (US$ EXCHANGE
TOTAL FINANCING 592.2 2,831.3 3,423.5 19.7 93J 1U.S 834REQURED
- 20 -
G. Project Financing Plan
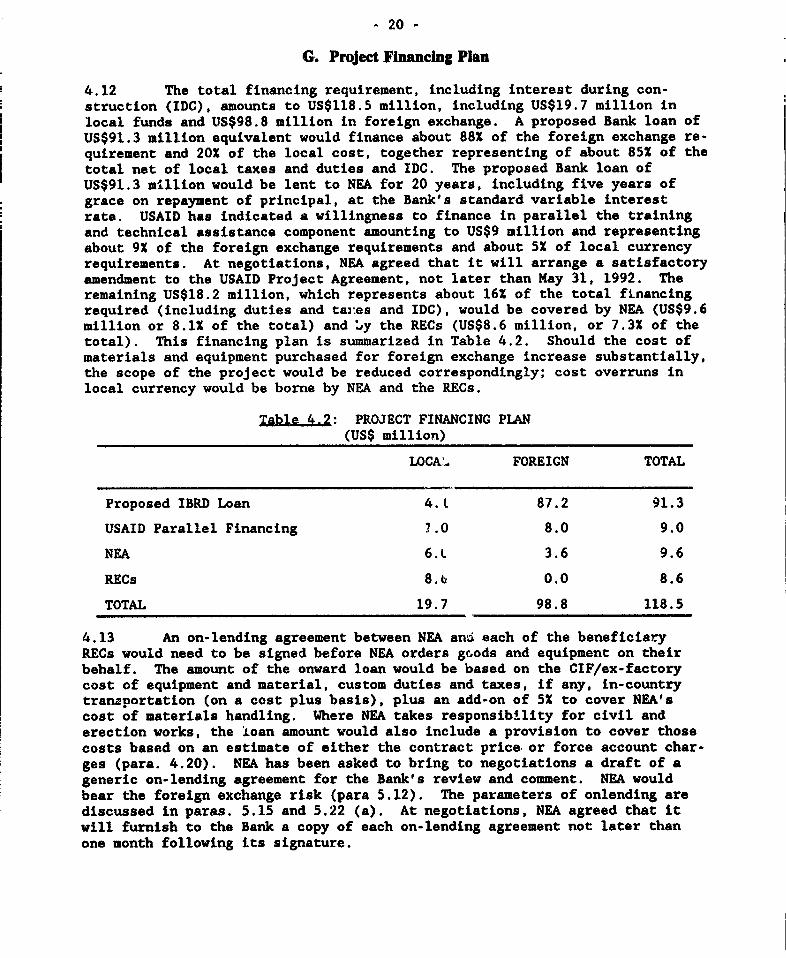
4.12 The total financing requirement, including interest during con-struction (IDC), amounts to US$118.5 million, including US$19.7 million inlocal funds and US$98.8 million in foreign exchange. A proposed Bank loan ofUS$91.3 million equivalent would finance about 88X of the foreign exchange re-quirement and 20X of the local cost, together representing of about 851 of thetotal net of local taxes and duties and IDC. The proposed Bank loan ofUS$91.3 million would be lent to NEA for 20 years, including five years ofgrace on repayment of principal, at the Bank's standard variable interestrate. USAID has indicated a willingness to finance in parallel the trainingand technical assistance component amounting to US$9 million and representingabout 91 of the foreign exchange requirements and about 5X of local currencyrequirements. At negotiations, NEA agreed that it will arrange a satisfactoryamendment to the USAID Project Agreement, not later than May 31, 1992. Theremaining US$18.2 million, which represents about 161 of the total financingrequired (including duties and tares and IDC), would be covered by NEA (US$9.6million or 8.11 of the total) and b.y the RECs (US$8.6 million, or 7.31 of thetotal). This financing plan is summarized in Table 4.2. Should the cost ofmaterials and equipment purchased for foreign exchange increase substantially,the scope of the project would be reduced correspondingly; cost overruns inlocal currency would be borne by NEA and the RECs.
Table 4.2: PROJECT FINANCING PLAN(US$ million)
LOCA', FOREIGN TOTAL
Proposed IBRD Loan 4.L 87.2 91.3
USAID Parallel Financing 1.0 8.0 9.0
NEA 6.L 3.6 9.6
RECs 8.b 0.0 8.6
TOTAL 19.7 98.8 118.5
4.13 An on-lending agreement between NEA and each of the beneficiaryRECs would need to be signed before NEA orders geods and equipment on theirbehalf. The amount of the onward loan would be based on the CIF/ex-factorycost of equipment and material, custom duties and taxes, if any, in-countrytransportation (on a cost plus basis), plus an add-on of 51 to cover NEA'scost of materials handling. Where NEA takes responsibility for civil anderection works, the loan amount would also include a provision to cover thosecosts based on an estimate of either the contract price or force account char-ges (para. 4.20). NEA has been asked to bring to negotiations a draft of ageneric on-lending agreement for the Bank's review and comment. NEA wouldbear the foreign exchange risk (para 5.12). The parameters of onlending arediscussed in paras. 5.15 and 5.22 (a). At negotiations, NEA agreed that itwill furnish to the Bank a copy of each on-lending agreement not later thanone month following its signature.
- 21 -
H. Peocurement
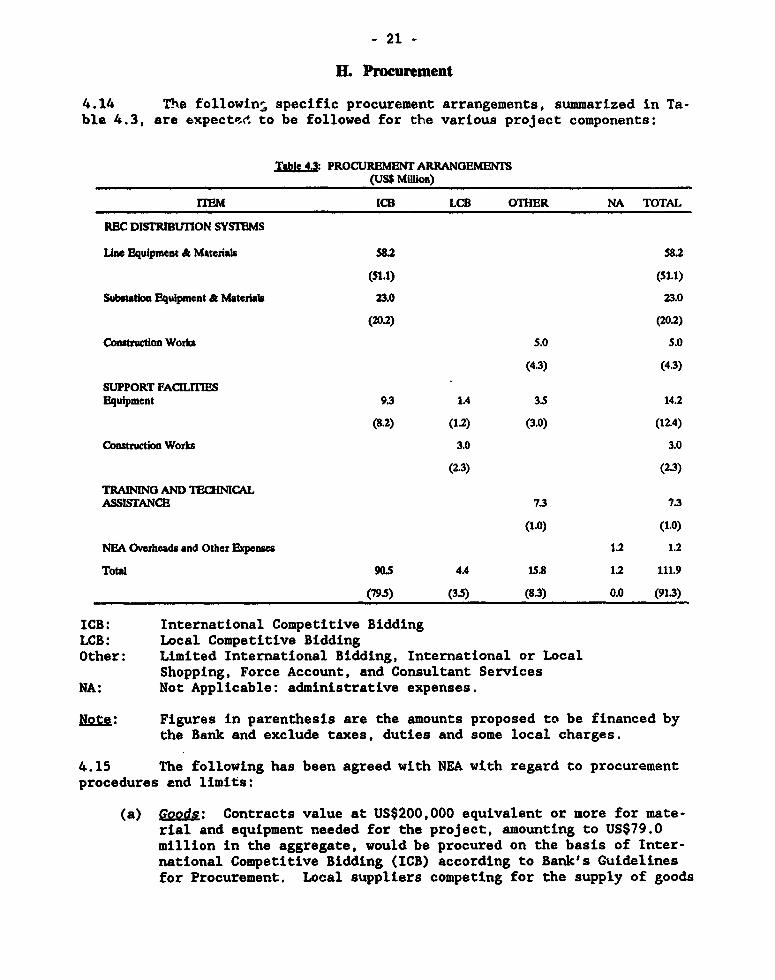
4.14 the followin, specific procurement arrangements, summarized in Ta-ble 4.3, are expected to be followed for the various project components:
Tble 4.: PROCUREMENT ARRANGEMENTS(USS Milion)
iTEM ICB LCB OTHER NA TOTAL
REC DlS1RIBMION SYSTEMS
Lne Equipment & Materials 582 58.2
(51.1) (51.1)
Subsatio Equipment & Materals 23.0 23.0
(20.2) (202)
Construction Wors 5.0 5.0
(4.3) (43)
SUPPORT FACILITIESEquipment 93 1.4 3.5 14.2
(&2) (1.2) (3.0) (12.4)
Construction Works 3.0 3.0
(2.3) (23)
TRAINING AND TECHNICALASSISTANCE 73 7.3
(1.0) (1.0)
NEA Overheads and Other Expenses 1.2 1.2
Total 90.5 4.4 15.8 1.2 111.9
(79-5) (3.5) (83) 0.0 (91.3)
ICB: International Competitive BiddingLCB: Local Competitive BiddingOther: Limited International Bidding, International or Local
Shopping, Force Account, and Consultant ServicesNA: Not Applicable: administrative expenses.
No.te: Figures in parenthesis are the amounts proposed to be financed bythe Bank and exclude taxes, duties and some local charges.
4.15 The following has been agreed with NEA with regard to procurementprocedures and limits:
(a) Goods: Contracts value at US$200,000 equivalent or more for mate-rial and equipment needed for the project, amounting to US$79.0million in the aggregate, would be procured on the basis of Inter-national Competitive Bidding (ICB) according to Bank's Guidelinesfor Procurement. Local suppliers competing for the supply of goods
- 22
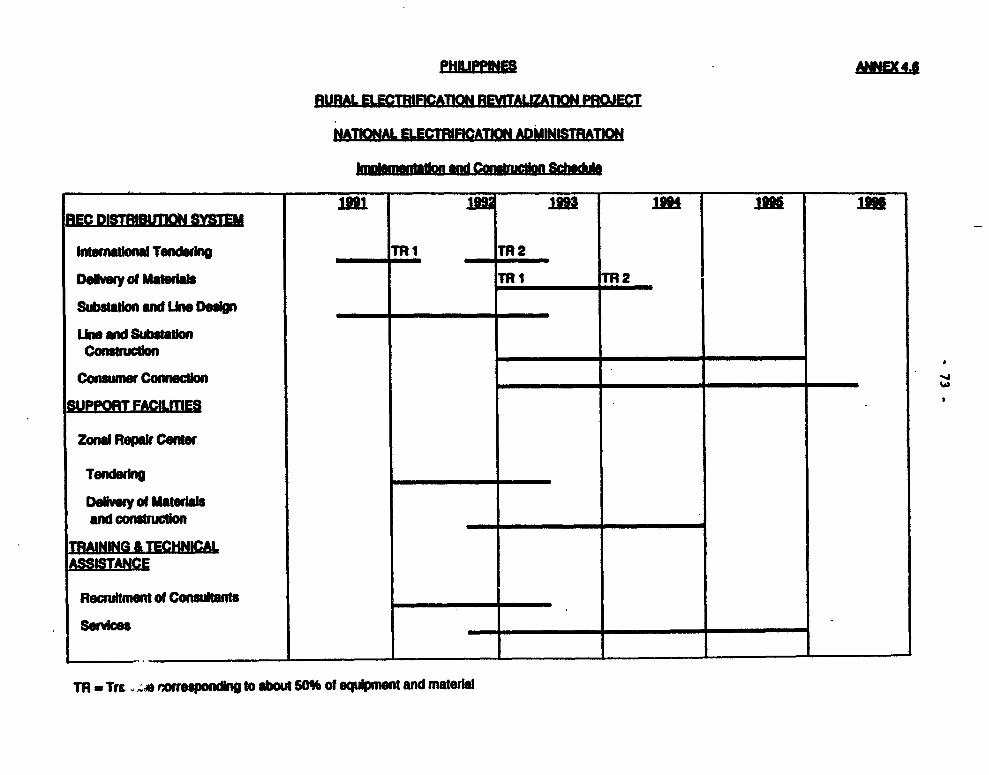
under ICB would have a preference of 15 or the applicable customsduty, whichever is less. Purchases of minor quantities of materi-als, tools, and equipment not exceeding US$200,000 per contract(except for spares), or US$3,500,0C) in the aggregate, could beprocured according to either LIB, LCB procedures acceptable to theBank, or direct contracting (in the case of spares). In addition,purchases of minor quantities of materials not exceeding US$50,000per contract and not exceeding US$1,400,000 in the aggregate couldbe procured using shopping procedures. To meet the implementationschedule, procurement of the equipment, materials and support com-modities would be split in three tranches over 1992 and 1993. Eachtranche would include separate packages to be procured under ICB(Annex 4.4).
(b) Works Civil works, mainly the construction of small buildings orthe erection of substations and distribution lines, amounting toabout US$8.0 million, would be widely scattered throughout 40 prov-inces, and numerous sites. The small size and geographical disper-sion of these works, often in remote locations and with sometimesdifficult peace and order situations, are unlikely to attract for-eign contractors; and in some instances, even reliable local bid-ders may not seek these jobs. Moreover, the project aims to en-courage the RECs to participate in project implementation to thegreatest extent possible. For theseh reasons (i) about 30X of theworks, consisting of building and substation construction, would beprocured under LCB procedures acceptable to the Bank, and (ii) theremaining 70X, consisting construction of distribution lines andconsumer connection, would be accomplished through force account,and not financed by the Bank. The RECs' capacity to use force ac-count over the years has been satisfactory.
(c) Consultant Servlces: Bank financed consultants would be selectedand employed according to the Bank's Guidelines for the Use of Con-sultants. While USAID would be financing the vast majority of con-sulting expenditures for training and technical assistance, theproposed loan includes a small provision (US$1,000,000) to financeunanticipated, highly specialized consultancies that are consistentwith the project's objectives, and which may arise in the course ofproject implementation. In the latter years of the Project, anyportion of that provision that is expected to remain unused wouldbe reallocated to other project components.
4.16 Bank financed procurement would follow Bank guidelines. According-ly, prior to tendering and award, the Bank would review all procurement docu-ments for goods valued at more than US$ 200,000 equivalent; this would cover802 of the total value of goods. A sample of other contracts for goods andworks - which would be of low value (para. 4.15 (b)) - would be reviewed bythe Bank subsequent to their award. Bank staff have reviewed NEA's handlingof local procurement, and confirm that this is acceptable. Also NEA hasshown, under the Energy Sector Project (Loan 3165-PH), a record of good per-formance in preparing procurement documents and awarding contracts.
- 23 -
I. Disbursement
4.17 The proceeds of the proposed loan would be disbursed for materialsand equipment, construction and erection works, commissioning expenditures,and consulting fees, as shown below:
(a) 100X of the CIF expenditure of imported material for lines, substa-tions and support commodities; in the case of locally manufacturedgoods, 100l of ex-factory expenditure, and in the case of goodsprocured locally, 751 of the expenditure;
(b) 851 of civil works related to expenditure for erection and commis-sioning, including civil works related to lines, substations, buil-dings and infrastructure facilities; and
(c) 100% of total expenditure of consulting services, including inspec-tion of equipment and materials.
These disbursements would be fully documented, except for minor expenditurefor equipment, materials and civil works costing less than US$50,000. In suchcases, disbursement will be made against a Statement of Expenditures (SOE),the documentation of which will not be submitted to the Bank but retained forreview by visitirg Bank missions. To facilitate disbursements, a SpecialAccount would be established on terms and conditions satisfactory to the Bank.The maximum amount that would be deposited in the Special Account would beUS$5.4 million, representing an average of four months disbursement. Duringnegotiations, NEA agreed to have its activities in relation to the SpecialAccount, as well as the Statement of Expenditures being maintained for dis-bursement purposes, audited in conjunction with the audit of its annual ac-counts (para. 2.12). However, the Bank reserved the right not to make theinitial deposit into the account unless it is maintained in a commercial bankthat allows NEA to have direct access to the funds therein.
4.18 Disbursements are expected to be concluded by December 31, 1996,one year after the expected completion of the project. The additional yearwould allow adequate time for releasing contractors' retentions and processingwithdrawal applications. In addition, as power distribution investments fol-low a dynamic process, the pattern of expenditures would be monitored closelyso that any undisbursed funds could be applied to suddenly arising justifiableschemes that meet the objectives of the proposed project, following consulta-tions with the Bank. An estimated schedule of disbursements together with acomparison with the standard country disbursement profile is given in Annex4.5. For the first four years, the expected disbursements for the proposedproject follow the standard profile for the Philippines. However, althoughthat standard profile indicates an 8-year period for full disbursements, theproposed loan is expected to be disbursed within six years given (i) the time-slice (1992-95) definition of the project, (ii) the satisfactory performanceof NEA regarding procurement in the previous projects, (iii) the fact that allequipment and materials being procured under the project are ready made, and(iv) no major civil works are required for installing goods that are purchasedunder the project. Moreover, the earlier Rural Electrification Project (Loan1547-PH) was fully disbursed within five years.
- 24 -
J. Project Implementation
4.19 While the RECs will be responsible for implementing schemes withintheir service areas, NEA will supervise all of the proposed project's con-struction activities. In the past, NEA has shipped materials and equipment tothe RECs as soon as possible after receipt of those goods at NEA's centralwarehouse. This piecemeal approach to releasing goods to the RECs has led todifficulties in ensuring that agreed schemes were actually built; the RECswere under great pressure from prospective consumers to put the goods to useas soon as these were received rather than wait for the complement needed fora given scheme to be assembled in its entirety. Under the Energy Sector Pro-ject, NEA will be shipping goods as they arrive to warehouses strategicallylocated to serve groups of RECs. At those warehouses, the goods ordered foreach REC will be stored, and released only when the full complement needed toimplement committed schemes has been assembled. NEA would then monitor close-ly implementation of the promised scheme. This approach will also be followedfor the proposed project. The RECs will only acquire liability for the onwardloans from NEA with the release to them of blocks of materials and equipment.
4.20 Once the materials and equipment have been released, the RECs willbe responsible for their storage and for execution of the construction works.In general, substation and the backbone distribution networks would be builtby independent contractors. The RECs would use force account to erect laterallines from the backbone. In order to perform these tasks, the LECs are beingequipped with the necessary tools and construction equipment under the USAIDProject and the Energy Sector Project as well as under the proposed Project.
4.21 NEA's engineering department would participate in acceptance tests,commissioning, and review and approval of as-built stake-sheets. The construc-tion period for each scheme would range between 6 to 18 months, depending onthe scope of the works. An overall implementation schedule, outlining the keydates for procurement and construction activities, is shown in Annex 4.6. Theproposed Project is expected to be completed by June 30, 1996.
4.22 To ensure effective coordination and monitoring of activities amongNEA's departments and between NEA and the RECs, NEA has appointed an appropri-ately qualified Project Director, who is responsible inter alla for managingproject implementation.
K REC Operational Performance
4.23 In the past, some RECs have developed notoriously poor records foroperation and maintenance of their facilities and for commercial discipline.The training and technical assistance program included in the proposed Project(para. 4.5), addresses some of those weaknesses by imparting needed knowledgeand capabilities to the RECs, while enhancing NEA's capacity to supervise RECoperations. NEA is also developing repair shops and testing facilities in itszonal maintenance centers. Tools and equipment for these activities have beenprovided under the Energy Sector Project and more are still being providedunder the proposed Project. These centers would provide the RECs with various
q5
specialized services (e.g. meter calibration, transformer rewinding), forwhich NEA would be remunerated (para. 5.14).
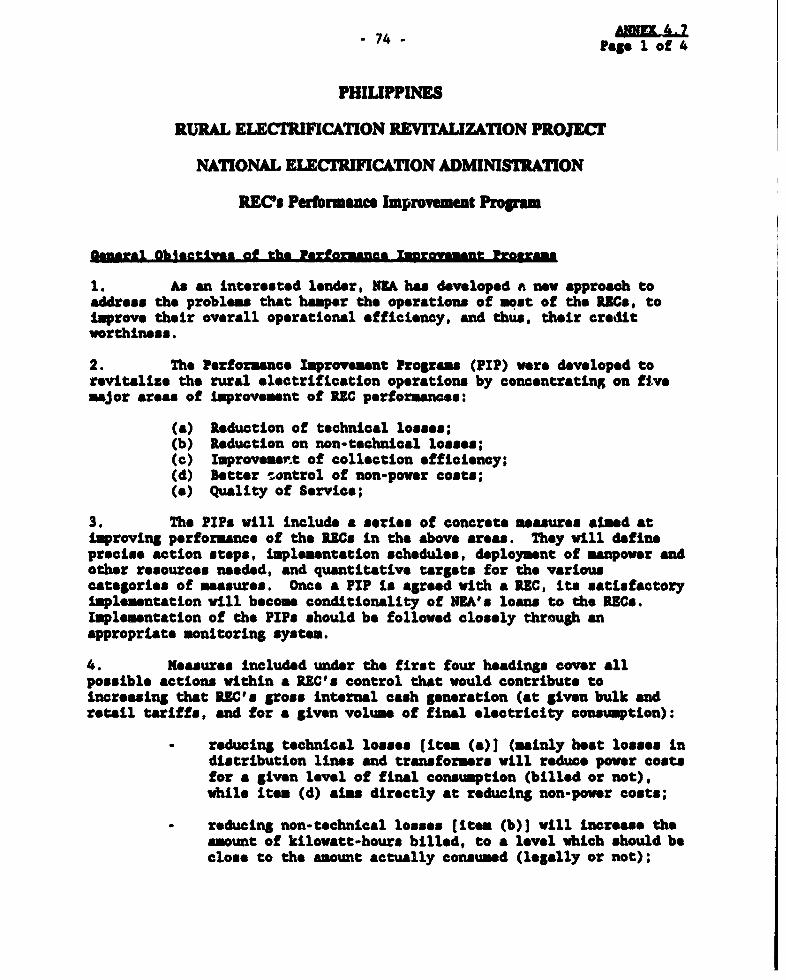
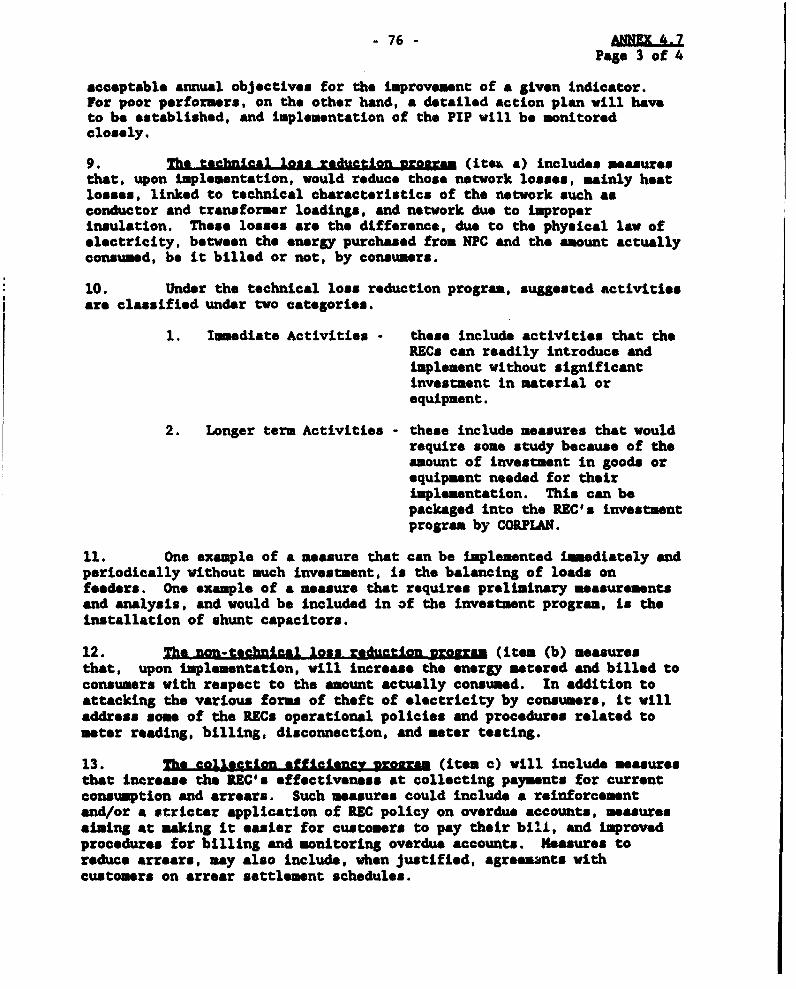
4.24 An conditionality related to its on-lending, NEA would seek theRECs' agreement to implement three year PIPs, specifically tailored for eachREC, aimed at their implementing specific measures to (i) reduce non-powercosts; (ii) reduce technical and non-technical losses; and (iii) improve col-lection efficiency. A generic program of typical measures has been preparedby NEA and reviewed by the Bank (Annex 4.7). This generic program is an ad-junct to NEA's SOP.
L Project Monitoring
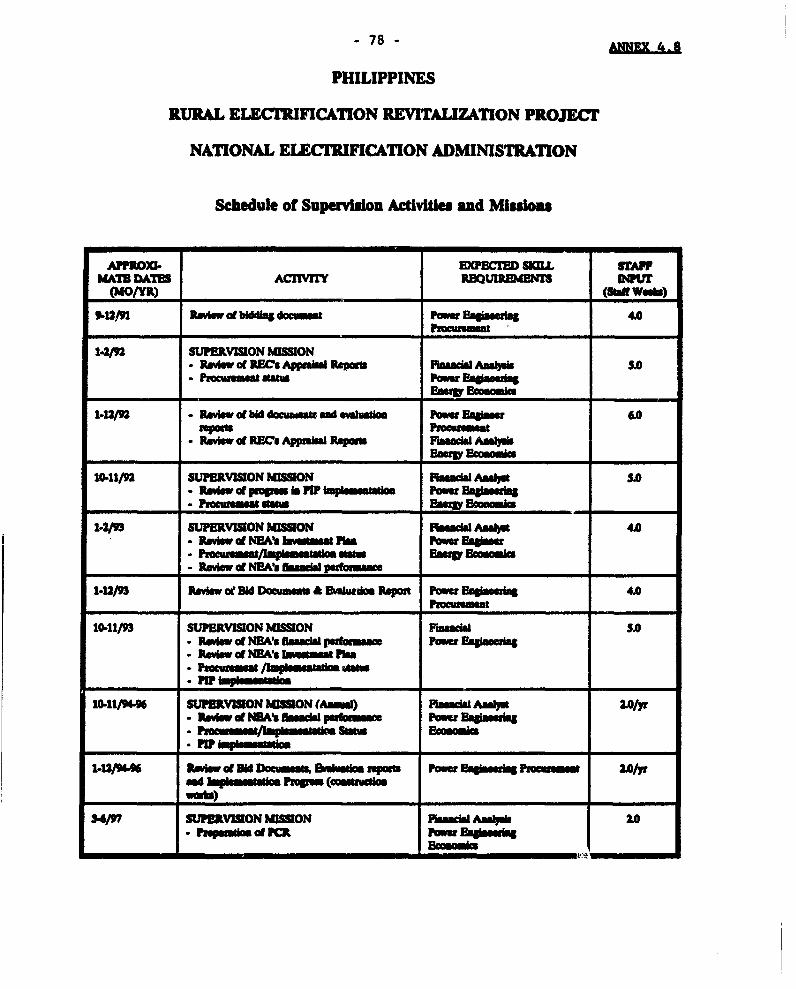
4.25 Project implementation would be monitored by NEA. NEA will furnishto the Bank quarterly progress report that cover the status of procurement,contract execution, physical progress, project costs, disbursements and admin-istration of the proposed project. It would also provide an annual report onthe operating performance of the RECs. This annual report would discuss Interalla for each REC: (i) system losses; (ii) collection efficiency; (iii) non-power cost; (iv) the customer per employee ratio; and (v) realization of itsfinancial performance targets (para. 5.30). The Bank would also superviseproject implementation through field missions; a tentative schedule for super-vision activities and missions is summarized In Annex 4.8. Following the com-missioning of schemes, NEA would require that the RECs provide Project Comple-tion Reports detailing their implementation experience. These reports wouldbe furnished to the Bank upon request. Finally, following completion of theproposed Project, NEA would furnish to the Bank a Project Completion Report,summarizing the project's execution, initial operation, actual project costand benefits, NEA's and the RECs' performance, and the realization of theproject's objectives.
M. Environment
4.26 The proposed project is not expected to pose environmental prob-lems. The rehabilitation and system reliability components involve adjust-ments to systems already in place. While the system extension and power sup-ply reliability components do envision some new works, these involve low volt-age networks that would follow existing infrastructure in thinly populatedareas. Where substations are to be upgraded, NEA has indicated that trans-formers containing PCB will be disposed of safely. In general, the technicalstandards followed by the RECs were adapted from those used in the UnitedStates, where environmental impact has been a key concern; still, NEA willarrange for preparation of ar Environmental Impact Assessment wherever net-works are extended through forests or wetlands.
N. Project Benefits
4.27 The main benefit of the proposed project would be the improvementin the quality of life in rural areas through the widespread availability of
- 26 -
grid supplies of electricity for household and commercial uses, with womenbeing the primary beneficiaries. This should, in turn, facilitate a broad-ening of economic opportunity in provincial towns and rural areas in agricul-ture and small scale industry. These benefits would be realized as a resultof the following features of the proposed project:
(a) The lnstitutional and trainIng comRonent is expected to:
(i) improve the operational performance of the RECs through thePIPs, which should result in a lower cost of service.
(ii) improve financial performance of the RECs and NEA through moredisciplined investment and lending criteria and a more appro-priato tariff policy, which together should enable the sec-tor's institutions to become more effective at deliveringtheir service.
(iii) improve the methodology being used by NEA and the RECs forplanning and network design, which should enhance the qualityof service while lowering the cost of supply.
(b) The Investment cogmonent is expected to:
(i) meot the growth in demand of existing and new customers, andImprove the quality of electricity supply in the service areasof the project RECs.
(ii) provide a more convenient source of energy as comparad withkerosene lamps or diesel motors, and enable the use of lifeenhancing electric appliances for newly connected customers.
0. Project Risks
4.28 NEA and the RECs are generally weak organizations that will be at-tempting to implement ambitious investment programs. In that sense, they mayconfront problems in meeting implementation schedules or raising counterpartfunds. In addition, the RECs may not realize financial and operational per-formance improvements as quickly as desired. At appraisal, the Bank triedvigilantly to ensure that the proposed Project would not exceed the absorptioncapacities of NEA and the participating RECs.
- 27 -
5. FINANCE AND TARIFFS
A. National Electrification Administration
Past and Present Financisl Condition
5.1 NEA's financial performance for 1986-90 is presented in Annexes 5.1and 5.2 and summarized in Table 5.1:
Current Ratio .94 .80 .74 .64 .73Debt/Equity Ratio 70:30 75:25 88:22 91:09 93:07
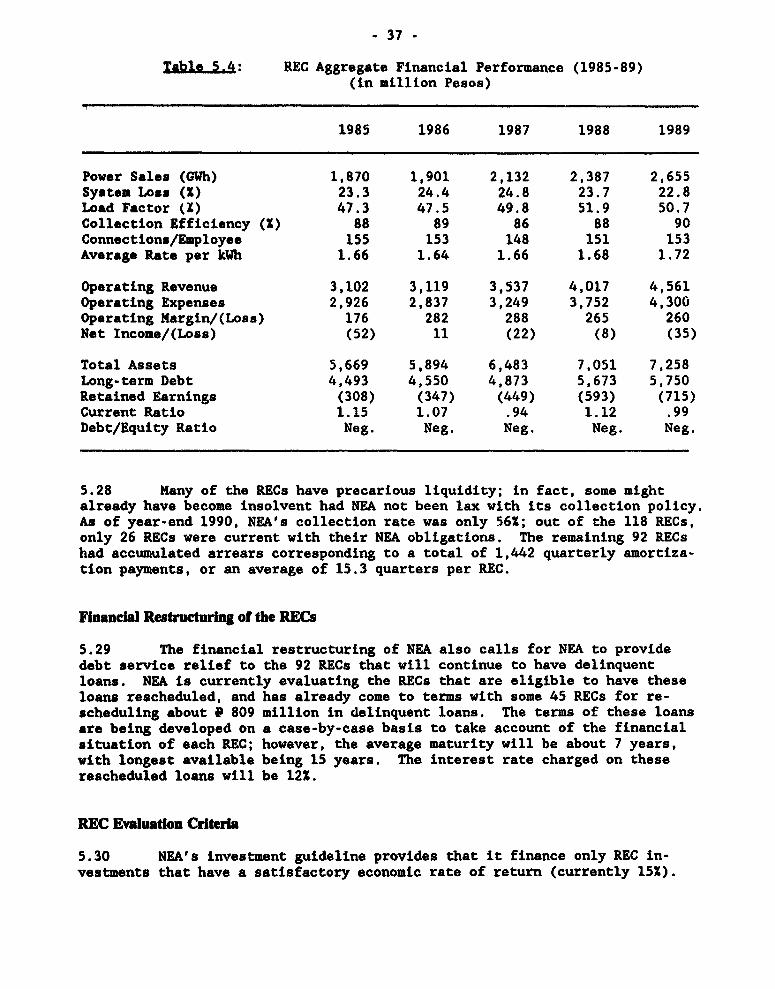
5.2 Except for 1966, NEA has consistently incurred large financiallosses. During 1987-90, NEA's operating revenue was insufficient to recoverinterest or other operating expenses. Since NEA accounts for interest revenueon an accrual basis and does not make provisions for doubtful accounts, therevenue claimed is substantially overstated. During the period, NEA's delin-quency rate on interest payments alone averaged about 45X per year; for prin-cipal and interest together, the delinquency rate is currently about 56X. In1989 and 1990, despite large subsidies to offset interest on advances thatpreviously had enabled NEA to meet its foreign debt service obligations, itsfinancial losses exceeded twice its total revenues.
5.3 NEA was initially organized as a Government corporation with autho-rized capital of P 1 billion. Several subsequent amendments to the NEA char-ter raised the authorized capital to P 5 billion. By the end of 1990, afterthe Government had already subscribed about P 4 billion of NEA's capital, NEAhad virtually eroded that capital and was operating unsustainably. Its cur-rent ratio was less than .75, and its debt to equity ratio reached 93:7.NEA's cash flow depended on the Government's relaxing the requirement to repayadvances. If commercial accounting practices were applied, many of NEA's out-standing loans and the interest receivable thereon would be deemed doubtful
- 28 -
and therefore written off. In addition, substantial inventories primarily ofalternative generation equipment have negligible value. With expenses runningfar ahead of revenues, current liabilities outpacing current assets, and sig-nificant overvalued inventories, NEA is virtually insolvent.
5.4 These factors were discussed explicitly in the Bank's 1989 SectorStudy. In its aftermath, the Government and NEA decided to implement a numbermeasures to put the sector's institutions on a sound financial footing.These included: (i) reorientation of NEA to the role of interested lender,with the capability to act as receiver (para. 5.5); (ii) the financial re-structuring of NEA, and through NEA, the RECs (para. 5.6); (iii) the adoptionof a coherent financing strategy and corresponding policies that will encour-age NEA and RECs to observe financial discipline, and thus sustain their sol-vency after being restructured (para. 5.10); and (iv) the adoption of soundelectricity tariff policies (para. 5.38).
Reorientation of NEA's Role
5.5 In NEA's new role as 'interested lender", it intends to act as areceiver in instances of REC defaults. NEA would therefore focus on the dis-position of failed RECs, possibly in altered form, rather than on rescuingthose RECs largely for the benefit of entrenched interest groups. The capac-ity to act as a receiver will substantially alter in NEA's favor its powerrelationship with the RECs.
Finandal Restructuring
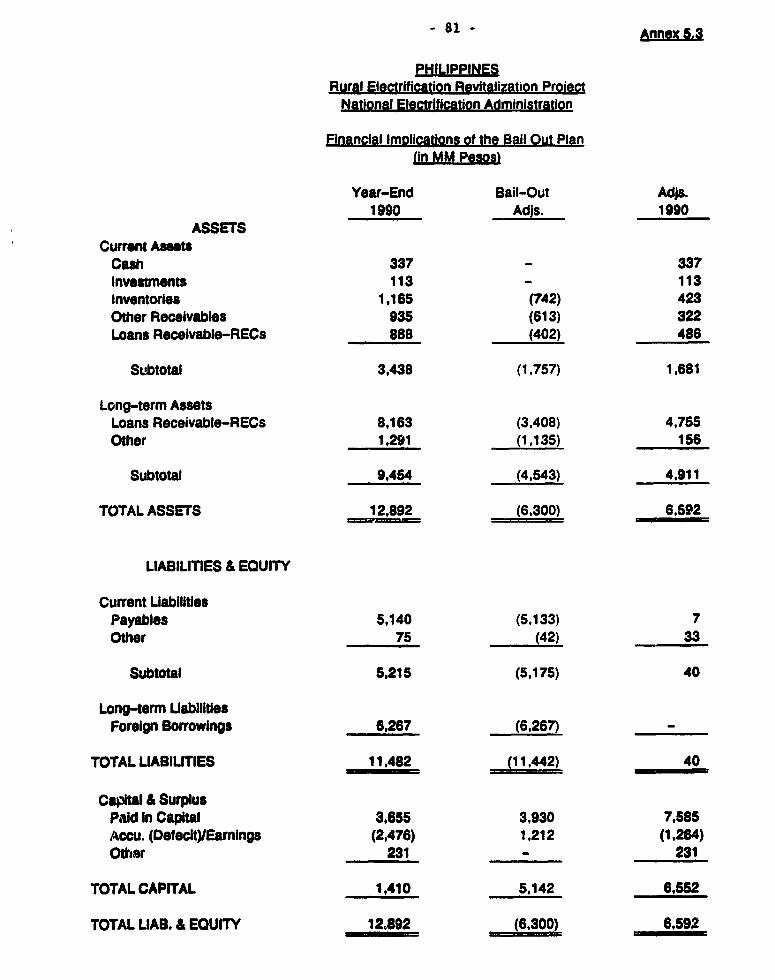
5.6 On January 24, 1991 the Government formally agreed to implement acomprehensive financial restructuring of NEA. This will place NEA on a "cleanbooks" basis, thereby enabling it to address the future development of thesector free from the financial burdens of past mistakes. Thiq restructuringplan is outlined in Annex 5.3. Under the plan the Government will:
(a) Convert to equity about P 5.1 billion of advances made to NEA dur-ing the past seven years.
(b) Assume the responsibility for all of NEA's foreign loan obliga-tions, as and when those obligations are due (as of December 31,1989, these amounted to P 6.3 billion).
(c) Enable NEA to write off numerous doubtful and uncollectible loans,or other over-valued assets. These include: (i) P 1.4 billion ofloans to 25 remote island RECs with limited prospects for financialviability; (ii) P 1.9 billion of loans for inoperative alternativegenerating equipment nominally transferred to the RECs, but eithernot installed or commissioned; (iii) P 663 million of loans to RECsfor operational alternative generation equipment; (iv) P 558 mil-lion, representing alternative generation equipment inventory onNEA's books; and (v) P 592 million of other doubtful assets andloans on NEA's books.
- 29 -
(d) Direct the RECs to transfer their alternative generation equipmentto NPC. In addition, NEA will sell any alternative generationequipment in inventory and transfer the proceeds to the Government.
5.7 This restructuring program will cost the Government a total ofabout P 11.4 billion. Although this price tag is high in nominal terms, thefiscal implications are negligible; the Government has been aware, at leastsince discussion of the issue in the Sector Study, that NEA had no revenuescorresponding to these liabilities, and therefore no hope of meeting them.Moreover, NEA and the RECs acquired these obligations as a result of intemper-ate decisions of the previous Government. No other entity can appropriatelytake responsibility for these liabilities.
5.8 This financial restructuring will have two major impacts on NEA:
a) Reduction of NEA's Cost of Funds. Prior to restructuring NEA's cap-ital structure consists of P 11.4 billion in debt and 8 893 millionin equity. After the restructuring, NEA's capital base will mate-rially change to P 6.2 billion of equity and no debt, giving NEA a0:100 debt to equity ratio and a zero weighted average cost offunds. Moreover, NEA will be receiving up to US$40 million of fi-nance originating from USAID and US$22.2 million from the Bank'sEnergy Sector Project as equity, thereby increasing its equity cap-ital by about P 1.6 billion. Current NEA efforts to raise new debtwill produce obligations beginning only in 1993. Thus, NEA'sweighted average cost of funds is expected to remain below 2X forthe foreseeable future.
b) Healthy Cash Inflows for NEA. While the restructuring will resultin cancellation of P 11.4 billion in loans to NEA, NEA will onlyforgive P 3.5 billion in loans to RECs, leaving about P 5.1 billionin REC loans for which NEA has no corresponding liability. Of thatamount, about P 4.3 billion are current. The remaining P 821 mil-lion are in arrears, and NEA will be rescheduling these as a onetime measure. While this rescheduling will give the mismanagedRECs more time to meet their obligations, the related interest ratewill increase sharply from the present 3X to 71 range to 121.
5.9 Although the Government agreed to the financial restructuring, itsimplementation depends on: (i) the Government making the budget allocationsneeded to enable the agreed conversions of debt to equity; and (ii) NEA com-plying with conditionality attached by the Government. Those components ofthe restructuring that involve NPC's absorption of alternative generationassets and liabilities as well as the conversion to equity of some advancesare expected to be implemented in 1991. Much of the remainder is due forimplementation in 1992.Y The foreign exchange related obligations will beabsorbed by the Government as and when they mature (declining amounts willmature through the year 2000). At negotiations, the Government agreed that it
M NEA's write off of uncollectible loans requires Congressional authoriza-tion. NEA has already drafted and secured Administration support forthe necessary legislation.
. 30 -
will make the annual budgetary allocations required to enable the timely im-plementation of NEA's financial rescheduling. The conditions imposed by the
Government are consistent with those of the proposed project. Because of the
Government's commitment to the financial restructuring, all analyses of NEA's
future financial prospects will be formulated net of the bail-out plan.
Financing Strtegy
5.10 In May 1991, the NEA Board approved, as an adjunct to the SOP, anew Financing Strategy. It includes: (i) treating loan funds as source neu-tral, and using the average cost of furids as the base for its onlending rate;
(ii) rationalizing the costs to be recovered through the interest rate;(iii) arranging for provisions against potential foreign exchange losses;
(iv) relieving NEA of the responsibility for lending to support financiallynon-viable RECo or economically non-viable projects; and (v) charging fees for
other services that NEA considers it should provide but that are not directly
related to loan formulation or supervision. This strategy, which also in-
cludes financial policies to be followed by NEA, is acceptable to the Bank.
Lending Policies and Procedures
5.11 NEA has compiled a Loan Policy Manual, which is also an adjunct tothe SOP. The manual establishes (i) authorities and limits for lending,(ii) accountability for loan transactions, and (iii) a loan committee for
evaluating proposed RZC loans. It includes financial objectives and appraisal
criteria, and formalizes the role of the PIPs in developing operational tar-gets for the RECs. The Loan Policy Manual is acceptable to the Bank.
Foreign Exchange Fund
5.12 NEA's financial distress was the inevitable consequence of the pre-
vious Government's decision that NEA should borrow in foreign exchange andrelend in pesos on concessionary terms. The Sector Study recognized that RECs
lacked the capacity to borrow in foreign exchange or to implement indexedtariffs. To prevent such debilitating exposure from recurring, NEA estab-lished in December 1991 a Foreign Exchange Fund. This fund would operate much
like an annuity account, with regular contributions being made to cover antic-ipated future payments. The amounts contributed would be set according to
estimates of future foreign exchange losses based on expected rate variationsbetween the Peso and the currencies of NEA's foreign borrowings. The contri-
butions rate will be reviewed periodically to determine whether: (i) the fund
balance is adequate, and (ii) the level of contributions is appropriate. AsNEA intends to accumulate quickly a sizeable balance, starting with 1992 itwill initially allocate about 35X of interest income from all loans to thefund. NEA's Board has already (i) approved the establishment of the fund, and
(ii) instructed management to use the proceeds in the fund to purchase forward
cover from the Government. At negotiations, the Government and NEA providedan understanding that resources allocated to this fund will be utilized onlyfor the purpose of covering NEA against future foreign exchange losses.
- 31 -
5.13 Under the Industrial Restructuring Project (Loan 3287-PH), the Gov-erNment agreed to provide borrowers of official loans with forward coveragainst foreign exchange risk. The fee for this cover is based on the differ-ence between the prevailing commercial rate for the currency being covered (oran acceptable proxy in case a commercial rate cannot be established) and theweighted average interest rate on peso time deposits of 60-91 days. This rateis adjusted quarterly, in line with the movement of the various referencerates. At negotiations, the Government agreed that it would provide NEA withcover against foreign exchange risk for a fee linked to the Weighted AverageInterest Rate for 60-91 day time deposits. The Government emphasized thatthis decision was predicated on NEA's passing the cost of this cover to elec-tricity consumers; therefore, NEA would meet this cost while preserving thesource neutrality of its lending by (i) appropriating a portion of its aggre-gate interest rovenues to the Foreign Exchange Fund and (ii) using the pro-ceeds that fund to purchase the requisite cover.
Fees for Support Services
5.14 NEA has been offering a wide array of services to the RECs, includ-ing engineering and technical services, materials management, warehousing,training, and financial advisory and auditing services. The cost to NEA ofthese services is significant and should not be covered entirely from theinterest rate being charged to the RECs. In connection to its new financingstrategy, NEA has decided to: (i) cover the cost of services directly relatedto loan formulation and administration through the interest rate; (ii) chargefor materials handling by adding an appropriate percentage (currently 5X) tothe principal amount of corresponding loans; and (iii) levy direct fees forits other services. In connection with the SOP, NEA has developed a feeschedule for those other services, including training, major maintenance andrepair, miscellaneous engineering, auditing, and corporate development.
Onlending Rate
5.15 The Sector Study recommendedV that NEA formulate an onlending ratethat would cover: (i) its average cost of funds, (ii) appropriate operatingcosts, and (iii) a provision to protect against anticipated foreign exchangerisk. As onlending would be source neutral, (i) the onlending rate should beapplied consistently to all new loans, and (ii) the provision for foreignexchange losses (para. 5.12) would be derived from all NEA loans to the RECs,not just those that arise from NEA's own foreign borrowings. NEA has includedthis interest rate formula in its financing strategy. Currently:
(a) Based on the financial restructuring, NEA's current weighted aver-age cost of funds is OX, and should not exceed 2% for a number ofyears (para. 5.8).
W Philippines Rural Electrification Sector: An Integrated Program to Revi-talize tbe Sector; Nov. 9, 1989; Rep. No. 8016-PH; Page 87, para. 6.35.
- 32 -
(b) NEA has rationalized the operating costs to be covered by the in-terest rate (para. 5.14). NEA's costs for these activities arecurrently estimated to equate to a spread of 61 to 8X.
(c) By allocating 35X of all interest revenues to the Foreign ExchangeTrust Fund at a time when its own foreign exchange exposure is min-imal, NEA expects to accumulate a sizeable reserve during the nextthree to five years.
NEA's current interest rate of 12X complies with this formula. To manage theliability side of its balance sheet more effectively, NEA has decided that itsnew loans would carry a variable interest rate. The rate would be reviewedannually, and an adjustment would be applied following the review.
5.16 Since no explicit cost was allocated to the Government's equity inNEA, this cost based onlending rute contains an implicit subsidy. This subsi-dy is justified because:
(a) the 120 RECs that borrow from NEA are all financially and opera-tionally weak. Even with this the subsidized interest rate, nearly100 RECs have recently had to implement substantial tariff in-creases merely to enable them !o be financially viable in 1991-92(para. 5.34).
(b) the RECs are regulated monopolies, with a limited selling price butcosts that can increase without constraint;
(c) given that the bulk of the RECs' customers are poor rural folk liv-ing below the pcverty line, their service has a social as well as acommercial value;
(d) the RECs are unable to issue bonds or obtain investment funds fromsources other than NEA, thereby limiting any possible impact ofNEA's subsidized lending on the financial sector;
(e) NEA's new Loan Policy Manual (para. 5.11) includes a provision forthe rate to be reviewed annually, and adjusted as needed to takeaccount of changes in NEA's cost structure. Thus, as the RECs im-prove their financial health, NEA would expect to lift the subsidyfrom its interest rate; and
(f) albeit that its posted interest rate contains an implicit subsidy,the fees it plans to charge for services unrelated to lendingshould provide NEA with substantial additional revenues. Thus,notwithstanding the interest subsidy, NEA is projecting healthyfinancial performance through 2000 (para. 5.23).
Changes In Accounting Procedures
5.17 The final element of NEA's new financing strategy is the adoptionof changes in accounting procedures appropriate to NEA's new function as an
- 33 -
"interested lender,. Accordingly, NEA is seeking COA's approval to change itsprocedures to enable: (i) the ongoing provisioning and write-off of REC loansthat are determined respectively to be doubtful and uncollectible; (ii) theprovisioning for likely losses resulting from foreign exchange exposure onoutstanding borrowings; (iii) the recognition of interest earned by NEA basedon the status of the underlying loans; and (iv) the placement in a suspenseaccount of the various components of the bail out plan as of year-end 1991.In addition, NEA indicated it would seek COA's permission to account for theForeign Exchange Fund off its balance sheet, since this reserve is essentiallya committed expense once the funds are allocated to the trust.
Financing Plan
5.18 NZA's financing plan for 1992-96 (the 1riod within which projectrelated expenditures are expected to be incurred) is summarized in Table 5.2.
Table 5.2: NEA's Financing Plan (1992-1996)
Pesos Millions Percent
I. Internal Cash Generation(Net of Working Capital Needs) 7,746 53X
II. Debt Service (Ex. Payments to Forex Fund) 1L294 -92XCash After Debt Service 6,452 441
IV. Loans and InvestmentsREC Loans Disbursements 11,770 801
Purchase of Ass' 412 31Contribution to Foreign Exchange Fund 980 71Purchase of Short-term Securities 1,471lO
Total Uses of Funds 14 633 lOOX
5.19 NEA's use of the funds for the period will be about P 14.6 billion,of which 801 represents loans to the RECs. By 1996, net contributions to theForeign Exchange Fund will amount to P 980 million, or 71 of its cumulativefinancing requirement. NEA's remaining financing requirements are for its own
- 34 -
plant and equipment and the purchase of short-term securities. Combined,these represent about 13X of NEA's total use of funds for the period.
5.20 About 441 of NEA's investment program is expected to be financedfrom internal cash generation after debt service, and the remainder from:(i) external borrowings, (ii) foreign grants, and (iii) government equity con-tributions. The proposed loan represents about 22X of the total sources offunds. Government contributions, which represent only about 61 of total fi-nance, are intended to finance investments in remote, small island RECs. ThsV 606 million of grants from foreign sources includes the conversion to equityof NEA's US$ 22.2 million allocation from the Energy Sector Loan. The Govern-ment cannot make this equity infusions, nor can it make the conversions toequity implied by the financial restructuring of NEA, unless pending legis-lation to increase NEA's authorized capital to * 20 billion is passed. Thatbill has already been approved by the House of Representatives and is expectedto be passed by the Senate before the end of its term in late February 1992.At negotiations, the Government and NEA provided an understanding that theywill use their combi-ed best efforts to ensure that legislation to increaseNEA's authorized capital to 0 20 billion is enacted by the end of 1992.
S.21 NEA plans to raisa an unusually large part of its investment re-quirements from internal cash generation. First, NEA projects making sizeableprovisions for doubtful loans and for foreign exchange losses, which do notinvolve cash outflows. Thus, even though NEA is projected to operate atbreak-even during 1991-96, it should generate significant amounts of cash fromoperations. Second, the financial restructuring will transfer most of NEA'sexternal debt to the Government, thereby minimizing NEA's debt service re-quirements during the period. Finally, NEA is expected to collect on many ofits existing outstanding loans, thus generating additional cash inflowsagainst which it would have negligible outflows.
Future Finance
5.22 Financial projections for 1991-2000, along with the detailed as-sumptions, are presented in Annexes 5.4 and 5.5. Key financial indicators andratios for the period are summarized in Table 5.3. The projections are basedon the following principal assumptions:
(a) Starting with 1992, all new loans to the RECs will carry a 121 in-terest rate and an average maturity of 20 years. The lending rateshould be increased to 131 in 1993 and to 141 in 1995 in order tokeep consistent with the cost based onlending rate formula (para5.15). Resched!'led loans will also carry an interest rate of 121even though NEA will not be realizing loan origination expenses.NEA will not finance from its own account inherently non-viableRECs; instead, for a service fee, it will act as a channel for di-rect government financing of these and other projects of question-able viability that the Government chooses to implemer.t.
(b) Beginning in 1992, NEA will charge fees for a number of its supportservices (para. 5.14).
- 35 -
(c) NEA will make appropriate provisions for doubtful accounts and foranticipated foreign exchange losses. Also, starting with 1992, NEAwill contribute 35X of all interest revenues to the Foreign Ex-change Fund. The fund will be utilized to purchase foreign exchangecover from the Government at a cost assumed at 8X of NEA's out-standing foreign currency denominated borrowings (para. 5.13).
(d) NEA will improve its collection rate from an initial assumed levelof 652 in 1991 to 851 in 1995. These targets are attainable be-cause: (i) under the financial restructuring, many of NEA's shaki-est outstanding loans will he canceled, and (ii) the application ofthe investment guideline and strict credit evaluation criteria willlargely eliminate investments in nonviable schemes.
(e) The peso-U.S. dollar exchange rate is assumed to decline each yearin relation to the differential between the local inflation rateand the international inflation rate.
5.23 NEA is projected to show a stable financial profile throughout the1991-2000 period. NEA in expected to realize operating losses during 1991 and1992, mainly because of the substantial loan loss provisions against its ex-isting portfolio of past loans that will be made during those years. In thefollowing years, NEA's net income is projected to improve, from P 32 millionin 1993 to a high of P 357 million in 1998. After 1998, net income stabiliz-es, partly because of the dampening effoct of increasing provisions for for-eign exchange losses on NEA's net income.
Table 5.3: NEA's Projected Financial Performance (1991-2000)(in million Pesos)
5.24 NEA's cash flow should remain sound, because of: (i) the substan-tial amounts charged against income for "non cash items" (such as, foreignexchange and loan loss provisions); and (ii) the gradual increase in collec-tions. These factors enable NEA to increase operating cash flow sharply fromabout P 168 million in 1991 to almost P 1.7 billion in 2000. At the sametime, debt will account for an increasing proportion of NEA's capital; debtservice coverage is expected to drop to about 3 times by 2000.
5.25 To realize this healthy performance, NEA will have to manage itsfinancial affairs prudently. The Financing Strategy provides for NEA to real-ize or exceed the following financial targets: (i) collection rates of 701 in1992, 751 in 1993, 801 in 1994 and 851 in 1995 and thereafterW; (ii) a re-turn on total assets (after appropriate provisions for foreign exchange lossesand doubtful accounts) of at least 0 through 1994 and exceeding 2.01 in 1995and thereafter; (iii) a debt service coverage ratio exceeding 4.0 through 1996and exceeding 3.0 thereafter; and (iv) a debt:equity ratio of less than 60:40.These targets are acceptable to the Bank7/.
B. Rural Electric Cooperatives
Past Financial Performance
5.26 Summary indicators of aggregate REC financial performance during1985-89 are shown in Table 5.4 (page - 37 -).
5.27 Despite some improvements in system losses, load factor and collec-tion efficiency, the RECs overall financial condition deteriorated sharplyduring the 1988-89. Aggregate retained earnings and the RECs' net worth werenegative throughout the period, and net losses were realized in each yearexcept 1986 and 1988 (when the RECs as a group broke even). By 1989, theaggregate retained earnings deficit reached P 715 million, more than doublethe 1985 level. Because the RECs previously could not increase their tariffsas needed or otherwise increase their capital, their financial condition inev-itably worsened from year to year. Paid in capital from members amounted toonly P 20.5 million in 1989, representing an increase of only i° 7.5 millionduring the period. Revenues per kWh increased by 391 during the period, orless than 81 annually. By comparison, operating expenses increased 631 duringthe period, or an average of 12.61 annually.
vf So far in 1991, as a result of (i) the cancellation of a large block ofnon-performing loans in connection with the financial restructuring, and(ii) the substantial REC tariff increases, NEA's collection rate hasclimbed to about 701.
v/ The agreement being sought from NEA that it will neither amend, abridgenor repeal the SOP and the annexed Financing Strategy without the Bank'sconsent effectively ensures that NEA will be committed to meeting thesetargets as a matter of policy.
- 37 -
Table 5.4: REC Aggregate Financial Performance (1985-89)(in million Pesos)
1985 1986 1987 1988 1989
Power Sales (GUh) 1,870 1,901 2,132 2,387 2,655
System Los. (X) 23.3 24.4 24.8 23.7 22.8
Load Factor (Z) 47.3 47.5 49.8 51.9 50.7
Collection Efficiency (X) 88 89 86 88 90
Connections/Employee 155 153 148 151 153
Average Rate per kWh 1.66 1.64 1.66 1.68 1.72
Operating Revenue 3,102 3,119 3,537 4,017 4,561
Operating Expenses 2,926 2,837 3,249 3,752 4,300
Operating Margin/(Loss) 176 282 288 265 260
Net Income/(Loss) (52) 11 (22) (8) (35)
Total Assets 5,669 5,894 6,483 7,051 7,258
Long-term Debt 4,493 4,550 4,873 5,673 5,750
Retained Earnings (308) (347) (449) (593) (715)
Current Ratio 1.15 1.07 .94 1.12 .99
Debt/Equity Ratio Neg. Neg. Neg. Neg. Neg.
5.28 Many of the RECs have precarious liquidity; in fact, some mightalready have become insolvent had NEA not been lax with its collection policy.
As of year-end 1990, NEA's collection rate was only 56X; out of the 118 RECs,
only 26 RECs were current with their NEA obligations. The remaining 92 RECs
had accumulated arrears corresponding to a total of 1,442 quarterly amortiza-
tion payments, or an average of 15.3 quarters per REC.
Financial Restructuring of the RECs
5.29 The financial restructuring of NEA also calls for NEA to providedebt service relief to the 92 RECs that will continue to have delinquentloans. NEA is currently evaluating the RECs that are eligible to have theseloans rescheduled, and has already come to terms with some 45 RECs for re-
scheduling about P 809 million in delinquent loans. The terms of these loans
are being developed on a case-by-case basis to take account of the financialsituation of each REC; however, the average maturity will be about 7 years,with longest available being 15 years. The interest rate charged on these
rescheduled loans will be 12%.
REC Evaluation Criteria
5.30 NEA's investment guideline provides that it finance only REC in-
vestments that have a satisfactory economic rate of return (currently 15X).
- 38 -
The SOP also provides that the RECs be required to implement PIPs as a condi-tion of borrowing from NEA. On the financial side, NEA will develop financialtargets on a case by case basis, taking account of improvement expected underthe PIPs. The Loan Policy Manual provides for NEA to adopt for the RECs thefollowing long term financial performance targets: (i) a current ratio exceed-ing 1.0; (ii) a self financing ratio exceeding 20X; and (iii) a debt servicecoverage ratio of 1.2-V. These financial performance targets are consideredwidely attainable for most of the RECs within five years, given the substan-tial efforts at tariff reform currently in progress (para. 5.38).
C. REC Tariffs
Tariff Reguladon
5.31 The RECs' retail tariffs are regulated by the NEC-TS which reportsdirectly to NEA's Board. In recent years, tariff regulation focussed primari-ly on the average level of rates. Little attention was given to tariff struc-ture. As a result, tariffs neither (i) reflect the costs of supplying dif-ferent types of loads, nor (ii) provide incentive for load management.
Tariff Level
5.32 Annex 5.6 presents bulk rates, REC margins, and average retailrates in constant pesos for the period 1985-90. Retail rates remained practi-cally unchanged in current terms (Table 5.4), and declined steadily in realterms during 1985-89, mostly reflecting real declines in NPC's bulk rates.Then, they increased slightly in real terms in 1990, mainly to reflect bulkrate increases.
5.33 The formula for establishing the RECs' average revenues covers:
(a) the average cost of bulk purchases;(b) the cost of losses up to 25X of the energy purchased;(c) REC operating expenses per kWh sold;(d) debt service per kWh sold;
Albeit that the formula calls for covering these costs fully, the Governmentintroduced a policy in mid 1988 limiting the level of retail rates to no morethan P 2.50/kWh. As a result, explicit subsidies were introduced for smallisland REC8 with higher costs per kWh; others simply did not meet debt serviceobligations on NEA loans (and, where needed, some RECs delayed paying NPC forbulk purchases). Similar problems arose for REC8 with system losses above the25X ceiling (about one-fourth of the RECs). NEA's tariff policy has allowed
Iv The agreement being sought from NEA that it will neither amend, abridgenor repeal the SOP and the annexed Loan Policy Manual without the Bank'sconsent effectively ensures that NEA will remain committed to these RECevaluation criteria as a matter of policy.
- 39 -
the RECs to realize an additional provision of up to 5S of revenues to enableself-financing a portion of investment; however, this provision was not in-voked until the round of tariff adjustments that started in late 1990.
5.34 In September 1990, the Government decided to lift the P 2.5/kWhcoiling. NEC quickly authorized the affected RECs to implement overdue 'auto-matic" adjustments for increases in bulk rates and wages. Then, in late 1990,NEC initiated a full round of REC rate adjustments, and authorized the RECs toinclude in their rates the 5X reinvestment provision. Pending local endorse-ment and NEA Board approval of the new rates, the RECs were authorized toapply an automat-ic 1.4 multiplier adjustment for increases in NPC's bulk rate.By September 1991, some 100 RECs had implemented substantial tariff increases.Following this round of increases, the average retail rates in Luzon and theVisayas are expected to average about P 3.4/kWh (US l2g/kWh), which is reason-ably in line with other countries in the region. In some of the smaller is-lands, retail rates will reach about P 4.1/kWh (US 15g/kWh), a level common inCaribbean countries. Because of Mindanao's hydro resources, consumers therewill enjoy low rates of about P 1.8/kWh (US 6.4g/kWh). Over all, averagerevenues for all RECs increased from an average of P 1.97/kWh during 1990 toan expected average of about P 2.81/kWh for September 1991. Part of the dif-ferential reflects increases in NPC's bulk rate; however, a large amount cor-responds to increases in the RECs' distribution margins. Thus, NEA's expan-sive policy toward REC tariffs that took root in late 1990, combined with thenew emphasis on REC improving performance, provide the underpinnings for thefinancial rehabilitation of the RECs.
Tariff Structure
5.35 The range of tariffs that the RECs apply to various consumer cate-gories are detailed in Annex 5.7.
5.36 Residential. commercial, and gublic building consumers are chargedflat rates per kWh with minimum bills. Within a given REC, these rates aresimilar, except for minor differences in minimum charges. There appears to beno cross-subsidy among the low-voltage consumer categories. However, largerconsumers who are connected at medium-voltage are penalized since they pay thesame price as low voltage users.
5.37 With some exceptions, lndustrlal rates do include demand charges.However, the demand charges are generally too low to reflect the structure ofthe cost of supply, or to provide incentives for load factor improvements.Since the energy prices applied to industrial consumers are generally the sameas those appiied to the other consumers, most medium-voltage industrial cus-tomers pay generally higher rates than low-voltage consumers. Thus, the RECsindustrial tariffs are not competitive with NPC's, and many RECs charge royal-ties to customers being supplied directly by NPC instead of competing to servethem. The efficiency improvements expe4ted from successful implementation ofthe PIPs (para. 4.24) should give the RECs scope to restructure their indus-trial charges without correspondingly increasing low-voltage rates. Many RECshave a special rate for Irrigatlon, which in fact is similar to the industrialtariff. Thus, no pattern of subsidization of irrigation is discernable.
- 40 -
Future Tariff Polky
5.38 NEA has recently begun a review of its tariff policies aimed atmaking rate levels and tariff structures more reflective of the cost of sup-ply. A Tariff Policy Manual is under preparation for approval by NEA's Boardby February 1992. It summarizes NEA's existing tariff policies and includesthe recommended improvements given in the following paragraphs.
5.39 Lgvel. The tariff manual is expected to reconcile the need tolimit the REC inefficiencies that can be passed on to consumers with the real-ity that improvement expected in connection with the PIPs will take time andrequirs some investment. Also, the reinvestment provision is being reviewedto reflect the RECs' long term financial objectives (para. 5.30). The TariffPolicy Manual is expected to include the following provisions:
(a) The losses ceiling will gradually be reduced to 22Z by 1995.While RECs with losses currently under 25X will be required tomeet that ceiling in the interim, those that cannot be expected tocomply with the ceiling in the foreseeable future will have year-by-year targets set on a case by case basis according to the PIPs.
(b) The self financing ratio carried in NEA's Loan Policy Manual im-plies that the reinvestment provision will cover necessary in-creases in working capital. On occasion, this might require in-creasing the allowed range for the reinvestment provision. Thelong term objective would be for the RECs to realize a 20X self-financing ratio after covering debt service and workinrg capitalrequirements (para. 5.30).
5.40 Structur. The rate manual is expected to include the followingprovisions concerning tariff structure:
(a) unification of all small, low-voltage, non-residential tariffsunder a new general service tariff;
(b) unification under a single two-parts tariff of all medium-voltagetariffs; and
(c) inclusion of a power factor penalty to be applied to all medium-voltage customers.
5.41 NEA is expected to make gradual adjustments to medium voltagetariffs; and, pending further studies of optimal tariff structures, realizereasonable transitional targets regarding (i) the relative weight of demandcharges, and (ii) rate differentials between medium and low voltage supply.
- 41 -
6. PROJECT JUSTIFICATION
A. Economic Evaluation of REC Investment Programs
Categories of Investment
6.1 REC investments are disaggregated into to three main categories:(i) rghabilitation or reinforcement, which may be required either because ofdemand growth or the deterioration of existing networks; (ii) add-ons, whichconsist of connecting new consumers within reach of existing networks; and(iii) extJMsjong, which provide grid supply to previously unserved areas.Generally, for each REC, each of these categories of investments is evaluatedseparately. In developing their requirements for rehabilitation/reinforcementinvestments, the RECs provide detailed lists of needed materials and equip-ment; in contrast, the cost of add-ons and extensions are derived from NEAstandards (formulated either on a per consumer basis, or per km. of line). Inaddition, each REC's investment program includes needed supporting equipmentand services, such as specialized vehicles, tools, and computers.
Methodology
6.2 NEA's evaluation of investments relies on a sophisticated computermodel. This model was first used to evaluate the investment programs of RECsthat would participate in the proposed project. The methodology is summarizedin Annex 6.1. The model calculates both the financial and economic rates ofreturn of the programs being evaluated. For the financial rate of return, thecost streams include the financial cost of investments, operating expenses,and energy purchases based on NPC's rates (adjusted to include the effect ofreduced losses); and the benefit streams consist of revenues from incrementalsales (adjusted to include the effect of reduced pilferage) valued at theREC's existing retail tariff.
6.3 The ec2nomic rate of return takes into account a shadow exchangerate of 1.2, and a shadow price factor of 0.6 for unskilled labor (the valuesused by the Government in connection with the Public Investment Program).Incremental bulk purchases as well as savings through loss reduction are val-ued at the Long Run Marginal Cost (LRMC) of supply at 69kV; NEA has computedLRMC for each of the Regional networks, using the same shadow price factorsand a discount rate of 15X (Annex 6.2). The economic benefits to new residen-tial and commercial consumers are valued on the basis of their willingness topay for basic lighting using kerosene lamps, and an estimate of consumer sur-plus associated with consumption over and above basic lighting. For industri-al consumers, economic benefits are valued on the basis of willingness to payfor diesel based self-generation. Benefits relating to increased consumptionof existing customers are valued only on the basis of the prevailing tariff ofeach REC. No economic benefit is attributed to increased sales resulting fromthe reduction of non-technical losses; only a small amount (25X) of the energy
- 42 -
saved by the reduction of non-technical losses is assumed to correspond towasteful consumption, and therefore counted among the net economic benefits.
B. Rates of Return on REC Investment Programs
6.4 Annex 6.3 shows the economic and financial rates of return pertain-ing to the 1991-95 investment programs of the original 50 project RECs. Ratesof return were computed separately for each of the three major investmentcategories (para. 6.1). For rehabilitation and add-on programs, the rates ofreturn generally exceed the 151 threshold by a substantial margin. The rela-tively high levels of LRHC, resulting from their being based on a 151 opportu-nity cost of capital and a 1.2 shadow exchange rate, tends to increase theattractiveness of rehabilitation schemes by heightening the value of lossreduction, while penalizing extension schemes by reducing the gap betweenconsumer willingness to pay and bulk supply costs. The extension programs for17 of the RECs do not yield the required 151 rate of return and therefore arenot included in the proposed project. The RECs with extension programs yield-ing less than satisfactory returns are generally characterized by low levelsof consumption per customer and poor load factors. Several of these RECs'extension programs might have been justified if the cut-off rate been set at121, or if lower shadow exchange rates had been used. However, given themacroeconomic constraints currently facing the country and the need to infusefinancial discipline throughout the sector, NEA intends to concentrate invest-ment efforts on consolidating existing markets and on high return extensionssuch as those supplying productive loads.
6.6 The financial rates of return of rehabilitation schemes are gener-ally higher than the economic rates of return, given the high financial valueof non-technical loss reduction. However, at a number of RECs, the financialrates of return of extension schemes are somewhat lower than their economicrates of return because of the exclusion of consumer surplus from the valua-tion of financial benefits. Economic rates of return for rehabilitation andadd-ons are generally higher than for extensions, which is consistent with thedxpectations of the Sector Study, and confirms that network extensions shouldbe considered primarily for areas of high consumer density. The rate of re-turn, based on the consolidated net benefits for the original 50 project RECsis 361, including the cost of support services.
- 43 -
7. AGREEMENTS TO BE REACHED AND RECOMMENDATION
A. Agreements to be Reached
7.1 Assurances were obtained at negotiations that the Government would:
(a) Make the annual budgetary allocations required to enable the timelyimplementation of NEA's financial rescheduling (para. 5.9); and
(b) Provide NEA with cover against foreign exchange risk for a feelinked to the Weighted Average Interest Rate for 60.91 day timedeposits (para. 5.13).
7.2 Assurances were obtained at negotiations that NEA would:
(a) Not amend, abridge, or repeal the SOP, any annex thereto, or theTariff Policy Manual, without prior consultation with the Bank(para. 1.9);
(b) Furnish to the Bank by September 30 of each year, its annual finan-cial statements certified by an acceptable auditor (para. 2.12);
(c) (i) conduct jointly with the Bank an annual review of its invest-ment program for the next five years and its investment accomplish-ments for the last two years, and (ii) adopt any mutually accept-able adjustments (para. 4.2);
(d) Arrange a satisfactory amendment to the USAID Project Agreement,not later than May 31, 1992 (para. 4.12).
(e) Furnish the remaining Project Evaluation Reports for the Bank's re-view and comment, according to an acceptable timetable (para. 4.8);
(f) Furnish to the Bank a copy of each on-lending agreement not laterthan one month following its signature (para. 4.13); and
(g) Have its activities in relation to the Special Account, as well &athe Statement of Expenditures being maintained for disbursementpurposes, audited in conjunction with the audit of its annual ac-counts (para. 4.17).
7.3 At negotiations, understandings were obtained from the Governmentand NEA that:
(a) NEA would furnish the Bank with its unaudited financial statementsby May 15 of each year (para. 2.12);
- 44 -
(b) NEA would utilize resources accumulated in Foreign Exchange Fundonly for the purpose of covering NEA against future foreign ex-change losses (para. 5.12); and
(c) Use their combined best efforts to ensure that legislation to in-crease NEA's authorized capital to P 20 billion is enacted by theend of 1992 (para. 5.20).
7.4 The following are conditions of effectiveness of the proposed loan:
(a) NEA Board Adoption of the Tariff Policy Manual (para. 1.9)
(b) NEA's retention of consultants to provide technical assistance inthe area of materials handling (para. 2.5); and
(c) NEA's retention of consultants to provide assistance with NEA'sloan administration function (para. 2.10).
B. Recommendation
7.5 Based on the agreements given above, the proposed project providesa suitable basis for a Bank loan of US$91.3 million equivalent to NEA. Thisloan would have a term of 20 years, including five years of grace on repaymentof principal, and carry the standard variable interest rate.
WHEREAS; the Government of the Philippines has approved a plan to re-lLevo NEA and the REC's of undue financial burdens imposed by uneconomicdecisions of the previous government;
WHEREAS; "EA has proposed amendments to its charter which are intendedto strengthen its role in project development related to electrical distri-bution and lender of capital to the RECs;
WHEREAS; a bill to increase the authorized capital of NEA has beenplaced before Congrcss;
RESOLVED TH1ERUEFORE, to approve, as it is hereby approved, a statementof operating policy intended to guide the activities of NEA and the RECs inthis emerging new environment. A copy of the policy and attached Annexesare appended hereto and form an integral part of this resolution.
Without Annexes
This Statement of Operating Policy was amended on November 12, 1991, when the NEABoard of Administrators approved all the Annexes as part and parcel of and as underlyingpolicy for the Statement. One of the Annexes, the Loan Policy Manual, was amended onDecember 17, 1991 so as to adopt as NEA policy specific long term financial performancetargeu for the RECs.
- 48 -
Page 2 of 4
National Electrifcation Admiistration
Statement of Operating PoUcy
Istraduidon
In June 1969, Republic Act 6038 declared the total electrification of thecountryside to be a national policy objective. The same Act also providedfor the organization of rural electric cooperatives (REC8) to implement thepolicy and operate the resultant distribution networks.
The charter of the National Electrification Administration assigns to itthe role of supervising and coordinating implementation of the nationalpolicy, by providing tochnical support to the RECs and financing theirexpansion programs through grants and long term loans.
In recent years, progress towards achievement of the government's ultimateobjective of total electrification has slowed, accentuated by continuedfinancial difficulties encountered by the RECs. These difficulties in manyinstances result from long standing inefficiencies and the requirement toprovide electricity to areas that are inherently uneconomic to serve. Thecumulative effect of inade-quate revenues and the consequent inability ofthe RECs to maintain and improve existing plant has caused many of them todefault on payment of debt service to NEA, which in turn has severely lim-ited the ability of the Administration to finance new expansion projects.
To revitalize the sector and renew the national commitment to the long termgoal of rural electrification requires major financial initiatives whichcan only be implemented by the Government. In this regard a number of pro-posals are under active consideration. As part of this proposed revital-ization, it is also essential that NEA develop and implement new and im-proved policies, practices and procedures, consistent with its charter andproposed amendments thereto, to ensure that its activities and those of theRECs are motivated by sound financial, technical and operating principles.To this end, the following operating policies are hereby promulgated.
Operatng PoHides
1. The primary role of NEA is to serve as an interested lender inproviding financing and technical support to the electrical distributionutilities serving rural areas. To enable NEA to perform this role effec-tively, NEA has asked tae Government to certify an amendment to its charter(Annex A) that would enable NEA to (i) improve the quality of service itrenders in the areas of loan g6neration and project development; (ii) di-vest itself of functions that are net related to electricity distributionor lending; (iii) develop capabilities appropriate for an interested lender
- 49AEX 1
Page 3 of 4
to improve the RECs' operational and financial performance, and tierebytheir crtdit-worthiness; and (iv) enable itself to exercise powers, normalto a lender, that allow the imposition of discipline on its borrowers.
2. The core business of NEA sb211 be conducted in accordance withsound banking principles. Funds to s*pport the primary mission may be ob-tained from a variety of sources, in accordance with the Financing Strategyof the Administration, (Annex B). A self-insurance fund shall protect NEAfrom prospective foreign exchange losses. Funds as available shall beloaned to the RECs on a source neutral basis.
3. The loans policy of NEA is described in the Loan Policy Manualwhich also forms part of Annex B. For the immediate future, priority shallbe given to loans needed to remedy identified deficiencies in existing dis-tribution systems or to expand networks to capture productive loads, wheresuch investments would be evaluated as economically justifiable, and wouldensure the RECs' continuing financial viability.
4. Pursuant to the loan policy, and to the extent that funds areavailable, NEA shall finance and support projects initiated by the RECswhich in the opinion of NEA are technically feasible and which would main-tain or improve the financial viability of the executing utility.
S. In addition to the normul commercial conditions applying toloans made by NEA, the Administration may attach conditions relating toperformance standards and objectives, including specific action plans(patterned after the generic Performance Improvement Programs provided inAnnex C) for reducing technical and non-technical system losses, improve-ments relating to operating procedures and comercial practices, and otherconditions as specified in the Loans Policy Manual.
6. NEA recognizes the Government's overall responsibility forsocial and economic development, and the strategic importance of reliable,available, and affordable electric power in fostering economic developmentand improving the quality of life. Accordingly, the financing strategyand loan policies of KEA shall facilitate financial and technical supportfor improvements to and expansion of REC facilities in underserved areaswhich cannot be justified on economic grounds, provided that clearly iden-tified subsidies are made available to NEA on a project by project basis.NE would seek to handle the finance for such investments as the Govern-ment's agent, and off its own Balance Sheet.
7. Subsidized funding of uneconomic but socially desirable pro-jects shall be contingent on NEA performing the same rigorous technical andeconomic analysis that will be applied to financially sound projects, so asto quantify in advance the true cost to the government. Ongoing operationsthat result from subsidized funding shall also be subject to reportingrequirements anti performance objectives over and above those establishedfor commerclally vLable ventures, so as to encourage prudent management andthus improve the prospect of future viability and eventual elimination ofsubsidies.
-50 -
Page 4 of 4
8. Loan applications and proposals submitted to NEA by the RECsfor the funding of projects shall include all necessary technical, finan-cial, operating and other information pertinent to the project and be pre-sented in such format as to enable NEA to perform evaluation and selectionof investments according to the attached Investment Guideline (Annex D).Applications shall be evaluated in accordance the criteria discussed inAnnex D and any other factors that in the opinion of NEA are relevant tospecific proposals.
9. The cost of loan origination services provided by NUA to theelectricity distribution utilities shall normally be included in the costof loans. Additional services, whether requested by the utility or consid-ered necessary by NUA shall be provided in accordance with a Fee Schedule(Annex E) which may be adjusted from time to time to ensure that all suchservices are provided on a cost recovery basis.
10. Subject to Para. 6, the pricing of electricity shall recoverall supply, operating, capital and loan repayment costs, and shall generatesurplus revenues, which over time will be used to finance a satisfactoryproportion of future expansion and to meet unforeseen emergencies. Tariffstructures should reflect adequately the costs of supplying the variouscategories of load, and provide appropriate incentives for the rational useof electricity. Specific policies to be followed by the RECs in settingthe level and structure of rates being developed in a Tariff Manual, to besubmitted separately to the Board not later than February 1992. In approv-ing electricity prices, NUA shall ensure that inc reases are tied to pro-ductivity improvements and do not result from inefficient practices.
11. In order to foster cooperative ownership responsibility and toenable the RECs to raise additional capital to finance system improvementsand expansion, the RECs, with the approval of NEA, or as ordered by NEU,may raise their membership fees from time to time and may levy assessmentson their members.
12. In the event of default in loan repayments, which in the opin-ion of NUA cannot be resolved to its satisfaction, NRA shall take appropri-ate action to safeguard its investment and maintain service to consumers,and may undertake a restructuring of the cooperative by merger or the for-mation of a new entity.
13. NE may make regulations to ensure compliance with this State-ment of Operating Policy and the Annexes attached hereto, and such regula-tions shall be binding on all its borrowers.
14. This Statement of Operating Policy is effective immediately.
NO. OF NO. OF CENTRAL ON FIELD ASSIGNKENTPERSONNEL GRAND PERMANENT CONTRAC- OFFICE -DISTRIBUTION TOTAL EMPLOYEES TUALS BASED RE DETAILED ON TRAVEL OTHER ON
CENTER TO COOP ORDER OFFICE LEAVE
ODA/PRO/OA/CORMEC/LKGAL 72 61 11 62 4 0 3 1 2
NEC - TS 24 24 0 23 1 0 0 0 0
3 S 0 19 19 0 18 0 0 0 0 0
CORPLAN 39 39 0 34 1 1 4 0 0
FIELD OPERATIONS 75 69 6 14 15 40 3 1 2
ENGINEERING 109 109 0 56 11 15 25 0 2
HATERIALS NKAGEMENT 88 87 1 43 2 0 17 0 1
AEDD 54 54 0 20 9 7 13 0 5
COOP OPERATIONS 58 58 0 26 6 9 16 0 1
COOP SERVICES 61 61 0 45 2 2 8 0 4
COOP AUDIT 51 51 0 13 12 6 17 0 3
FINANCE 67 67 0 62 1 0 0 1 3
LOANS 36 36 0 35 0 0 0 0 1
ADMINISTRATION 100 97 3 92 3 1 2 0 2
IEJAN RESOURCES 36 36 0 36 0 0 0 0 0
CRAND TOTAL 889 868 21 579 67 81 108 3 26. .. .- .. ni - - -_
- 54 -
PHILPPINES ANNgX 3.1
RURAL ELECTRIMCA11ON REVgIAUZATION PROJECTNATIOwNAL ME CTIFICATION ADMINIISTRATION
1. Tho proliminary design of the proposed project is based on thedata collectod for the preparation of the RIMP and Evaluation Reportsprepared by NEA in cooperation with the RECs. When the project starts,-he areas will be surveyed and actual bills of material will be prepared.In order to start the project, about 50X of equipment and material will beprocured under a first tranchc without preparing the detailed survey anddesign. A second trancho of procurement, to follow about six monthslater, will be based on the result of detailed survey and design and willinclude additional equipment and materials and adjustments in quantitiesrequired to be made out of the first procurement.
2. It is estimated that no proposed project would consist cf therehabilitation of around 1,4b0 km of line and the extension of around4,897 km of line. All lines would be on wooden poles. The main featuresof the lines are summarized below:
4. The distribution networks included in the project will includesonm 21,000 distribution transformers for a total capacity of around 450IVA, and sone 1,600 low tension capacitors with a total reactive capacityof around 100 KVAr, as follows:
6. These would include mainly vehicles, tools, communLcation andtesting equipment and computers as follows by type and approximatequantity:
Maintenance and Utility Trucks 36Lineman's and Construction Tools Set 568Communicative Equipment (Radio) 253Testing and Recording Equipment 349(Power factar, merger, loss tester, etc.)Computers 163
Zonal R_Air Facilities-and Mobile Substation
7. Seven mobile substations will be made available to complementthe zonal repair facilities that was funded under the Energy SectorProject. The substations will serve as back-up in cases of emergency orduring instances where substations are to be shut down for maintenancepurposes. One main zonal center shall be set up in Manila to take care ofmajor repair of equipment such as Ire-manufacturing' of transformers, etc.while about six (6) regional repair centers shall service provinces.
- 65 - ANEX 4.2
Page 1 of 2
PHILIPPINES
RURAL ELECTRIFICATION REVITALIZATION PROJECr
NATIONAL ELECMRIFICATION ADMINISTRATION
Outline of Project Evaluation Reports
The basic content of the PERs prepared by NEA in cooperation with theRECs would be as follows:
1. Executive Summary
2. Characteristics of the Rural Electric Cooperative2.1 Socio-Economic Characteristics2.2 Technical and Operational Performance Status (including
information regarding quality of service (outages))2.3 Financial Performance Status
3. Demand Forecast
The factors sustaining the forecast would be summarized (e.g.increase in the number of consumers and/or consumers consumption forresidential consumers in relation to national average; possibility ofone or more major new medium voltage consumer(s) and/or extension ofcommercial and industrial projects.
4. The Proposed Project4.1 Five-year Planning Profile4.2 Project Description
- Technical: major components (rehabilitation, add-ons,expansion)
- Cost- Implementation Responsibilities and Schedule (completion of
final design, receipt of equipment and materials,construction and commissioning)
5. Economic Evaluation and Benefits(impact on system losses would be emphasized not only in percentageterms but with supporting analysis and specification of remedialneasures and actions)
6. Authorization of the Proposed Project
7. Recommendations for Loan Conditionalities (including summary of PIP)
- 66 -Page 2 of 2
Appendices
1. Attachment A: Description and Assessment of the Recommended Project
2. Attachment B: Financial Statoments and Projections (Flve-yearprojections uslng the three principal financialdocuments: Income Statement, Balance Sheet, andSources and Uses of Funds)
3. Attachment C: Performance Improvement Program
4. Attachment D: Map and/or Network Single Line Diagram
904 Ot W17 0t ex MT w at U 7t in all 5 AaRErI 0 "IV SWU gt Kt 5*9 MT is? 1f ^1r m i ixn
o o 'T M to s a01 mr9 199 0 An1 0 99AN I £5 NW
tw MTON £91 M't O IK IW7 O Ut 1O Act AN _ miwmy? 0 so - 0 of1 I5 aIT Air env kV -o
* a T 0 N E ff 1s1 DIE DIllSOTAR Ut 0 aK 0 N' UPI at I MIT on so 3S tor o get ,~ 91 msr 191U 9
Mv .9 *1 RE of git of WIT 19 aN 607 #9a5 N g* NI 0O 1*1 I t tat Et 997 w #
: at owl n t S l a ad w do 7 X ZAOT 0 O t O O Ur t a * at in up t 7
Wl a1 EN?T WI toe 10I 9 fig miW 9 to 0IT 9 gf5*f coM95 * IN? 0 Ut 0 Po IN 9W 99 -w NaminINY* O NIT a P Ot a A7 Ad £ff IX tV 119 0 WIT SC SW fit 1n au do 0 M7 Comm0
e SW OOt7 0 1C t1t AP £5 a1 I1 52WIX NC1 S 0 9K 0 Op SW IX of kV 0 De Ut 3dts No to^ 4tt dr ofr t1 m a" of o 7* m9 t7 O1 S *# NI Ut MI t07O1
o5£ LwS N Art 9W 051 it oI Aon a Ct au Ut 9W DlJa
o s MT 0 m tCD t' ea ea 00 10 S ax7 of onacmw991 Kt7 W? 0 B w - i t tNt *tN 0 g SWI NIowl PTt ori for nt on0 Suo &AT lar mo $fis ton- Su pfif7 o 2owMIT 01 MT 19 M1 E105 £01 SW1 W7 £01 9 ol01 £05 W 1.4W1I mff my 0 £1 0 0 ox 1NO n7l SWr 99 I1 DEE NawA35 801 ANT 0 .9 0 a0 art sA 01 wv us WI' USWI* .91 51*1 ot K PSt PA 0 9 5 W17 WWYe" pi 5tJ a SW d Om 0 U 7 Room* if l El K I K U t K 999 ONWO
MT I 1a 0 0 of 0 0 - A99 0 aw o17 t 169Wye 1i SWO SW 1 SW £1 W J 1 En M t AI0 51 R37 of 8 1 ptS 5l Sp O7 Z=w1917 Wtr WY 11 MP go 9 t AD I7 WA 0 o NIT U7 o
0 Ut R of 5£t 0p 55 & 5£ on lAIYn3KS? De At? AD cU t1o 8 5t OP, 9 me 0 A1" IN? If0 my we 0 a a9 ST AV 39 Wit 5CO70E"T *1 am W19 1 t WI p Ut 1991 p tW o P Ut SUtmb35 *0 £51 OU 211 9f #9 tI 119 5£ £4 091 01BiMtT rl AAT tZ si Nwtf ff mt I7 fL ar or of MT larm
AN AN £9? Mt U 91 Sol 0r 9p 9 Or kg o 130 *1
O a 03? * K t N Pn Uot 9t Dm9?o MPf GMT tic ir Ur of dof t nf 0cmpEtI 51 1art ElI St 9 DC K 9 ea St 9 of oivmu la 1V7t1 0 WI o Sn SWI t Ad 0t9 M t MT EWNEo 5t1 WI for A" w ,P D El at A w to Nt
a PtA APA m Ka A7 SW MT ttY 10 EWInW0 P5 n1 t7 au oUt t1 5z1 m 9 NI am* W 1911 m m 155g a t SW to Et t Wa *PC OP T osn A,s m ftt7 *11 tO'a at PUt fytUt - NP 0 IO S 1t1 99 115 Ot O Utt 191 591 U7MT? 5 SAaT 0 IMr ~ rog'Ia In 0£ for Mr 0£ 10N mEla
Bank TY and Half Yearly Standardain K DflLhunusumnt CmU1 a LsCuulative XPol- (X)
1992 III 2.0 2.0 2.5 0.0
1993 I 3.0 5.0 6.3 3.0II 3.0 8.0 10.0 6.0
1994 I 5.0 13.0 16.3 14.0II 10.0 23.0 28.8 18.0
1995 I 15.0 38.0 47.5 26.0II 20.0 58.0 64.4 34.0
1996 I 18.0 76.0 84.4 46.0II 10.0 86.0 95.6 58.0
1997 I 5.3 91.3 100.0 66.0II 74.0
1998 I 82.0II 86.0
1999 I 94.0II 98.0
2000 I 100.0
.1/ In the absence of standard profile for the power sector in thePhilippines, the "all sector" profile is the reference.
eH mlS NNEX4.8
RURAL ELECRIFICATION REVITALIZATION PROJECT
N&ION ELE CTRIC 91EN
ma wfdn WQ l maREC DISTRIBUTIOt SYSTEM
hEDmotI ThLmd TR 1TR 2
Ddelyof Materials TR I TR 2
Substaloanda LieDealgn
Lh and Substationc~on
__d
Co _mer Connection
SUPPORT FACILMES.
Zonal Repair Center
Tendr _
Devey of Maralan consrcton_
TRIBNING & TECHNIALASSISTANCE
Recrtment of Constant
TR * Tr& . m onesponrlt to about 50% of equipment and materil
-74 -3NEL4.Page 1 of 4
PHILIPPINE8
RURAL ELECTRIFICATION REVITALIZATION PROJECT
NATIONAL ELECRIFICATION ADMINISTRATION
REC's Perfrma Improvment Prora
Gnral Oblectivec of tha ParformaneIroan Peam
1. As an lnterestod lender, NRA ha. developed ui new approach toaddress the problems that hamper the operatLon. of most of the RiCe, toimprove thelr overall operatlonal efficlency, and thus, their creUitworthiness.
2. The Porformance Improvemnt Programs (PIP) were developed torevitalLze the rural electrificatlon operation. by concentrating on fivemjor area. of improvement of REC performnces:
(a) Reduction of technical losses;(b) Reduction on non-technical losses;(c) Improvement of collection efficiency;(d) Bettor 5ontrol of non-power costs;(a) Quallty of Service;
3. The PIPs wlll lnclude a series of concrete moeaures simed atimproving performance of the RECa Ln the above area. They will definepreclse action steps, implementation scheduloe, deployment of manpower andother resources needed, and quantitative targets for the variouscategorles of me.ures. Once a PIP is agreed wLth a UEC, lts satisfactoryimplementation will become conditionallty of NEA's loans to the RiCa.Implementation of the PIPs should be followed closely through anapproprlate monitoring system.
4. Measures included under the fLrat four headings cover allpossLble actions wlthln a REC's control that would contrlbuto toincreasing that RiC's gross internal cash generation (at given bulk andretall tarlffs, and for a glven volume of final electrLeLty consumption):
- reducLng technical loses (Ltem (a)) (mainly heat losses lndistributlon lines and transformors will reduce power costsfor a given level of final consumption (blled or not),while ltem (d) aims dlrectly at reducing non-power costs;
- reducLng non-technlcal losses (item (b)I will Lncrease theamount of kilowatt-hours blled, to a level which should becloso to the amount actually consumed (legally or not);
-75 - AM. A.2Page 2 of 4
- improving collections litem (c)J wlll, for a given aoountof kilowatt-hours billed, increase tho cash that isactually collected by the REC.
S. As concerns the quality of service (item (e)], the PIPs will notestabllsh, for the tima being, specific performnce targets other thanthose that mom. of the more advanced RECs may want to aet for themselves.Rather, at this stage, the sore appropriato goal is to generalizeprogresslvely, starting with tho RECs that are better equipped, a new andefficient approach for the monitoring of systen reliability. Not onlywould the evaluation of performance improvments be incomplete without away of monitoring service reliabllity, but also the new monitoring systenshould greatly facilitate for the REC. the identification of networksections that require reinforcements.
Global Indicators of eefr anc Tanvmenta
6. The PIPs will be designed as a set of detailed action progr amsaiming to addross the main issues faclng the poorer performing RECs over athree year period. The final stop of their preparation wlll be to set-annual targets with respect to four global performance indLcators tomeasure improvements that are expected to result from the imploemntationof the planned measures. In fact, the monitoring of performanceimprovements over time, based on these four global indicators, will boapplied to all RECs. The initial review of these lndicators wlll alsoserve as a basis for the design of the PIPs. These indicators, as well asmedium term targets for the second half of the 1990s, are as follows:
I.NDICATOR , EDIW TER TARGET
LOSS RATIO 12-15XRECEIVABLES IN DAYS OF BILLING 60 DAYSNON-POWER COST PER CUSTOMER 250-400 PESOS atMINUTES OF INTERRUPTION PER CUSTOMER NONE AT THIS STAGE
St 1990 prices
Contgnt and Preparation of the PIPs for Individual RICa
7. The attached Geoneric Performance Improv emet Program' detaLlsgenerally accepted activities to be impl emented by the RECs to addresstheir speciflc problems. This generic plan, which will be discussedfurther below, shall be tailored according to the specific areas ofweaknosses of each PEC, and would require inputs from the REC's managementand technical staff. Based on this, a detailed program to improve theperformance of individual RECs would be developed.
S. The degre of detail of the PIPs will be adapted to the currentperformances of individual RECs. Those that are good performers In allareas may not need a PIP, and in such cases one of the conditionalities ofNSA's loans would simply be to maintain satisfactory performancoindlcators. For others, the PIP may concentrate on only one area.Finally, RICa that cannot be considered as poor performrs but for whichthere is substantial room for progress, the PIP may be limited to
-76 - NNn 4.7Page 3 of 4
acceptable annual objectives for the improvemnt of a given indicator.For poor performrs, on the other hand, a detailed action plan will haveto be established, and implementation of the PIP will be monitoredclosely.
9. The tec_nical loss reduction iggeam (item a) includes measuresthat, upon implementation, would reduce those network losses, mainly heatlosses, linked to technical characteristics of the network such asconductor and transformer loadings, and network due to liproperinsulation. These losses are the difference, due to the physLcal law ofelectricity, between the energy purchased from NPC and the amount actuallyconsumed, be it billed or not, by consumrs.
10. Under the technical loss reduction program, suggested activitiesare classified under two categories.
1. Immediate Activities - those include activities that theRECs can readily introduce andimplement without significantinvestment in material orequipment.
2. Longer term Activities - these include neasures that wouldrequire some study because of theamount of investment in goods orequipment needed for theirimplemntation. This can bepackaged into the REC's investmentprogram by CORPLAN.
11. One example of a measure that can be implemented immediately andperiodically without much investment, is the balancing of loads onfeeders. One example of a measuro that requires preliminary noasurementsand analysis, and would be included in of the investment program, is theinstallation of shunt capacitors.
12. The non-techical loss geduction urom (item (b) measuresthat, upon implementation, will Lnerease the energy mtered end billed toconsumers with respect to the emount actually consumed. In addition toattacking the various forms of theft of electricity by consumers, it willaddress some of the RECs operational policies and procedures related tometer reading, billing, disconnection, and meter testing.
13. collection effici ooa (item c) will Include measuresthat increae the REC's effectiven ss at collecting payments for currentconsumption and arrears. Such measures could include a reinforcementand/or a stricter application of REC policy on overdue accounts, measuresaiming at making it easier for customers to pay their bill, and improvedprocedures for billing and monitoring overdue accounts. Measures toreduce arrears, may also include, when justified, agree-ants withcustomers on arrear settlement schedules.
- 77 - NNEX 4.7Page 4 of 4
14. Non-Poer _Cost (item d) ia the aggrogato total of operatingexpenses excluding the cost of power purchasea. Thla is normally composedof:
the Administrative and General expenses related to theadminlstratLve personnel;
- consumer account exponses, including expenses related tometor readers/colloctors and to the entlre personnel of thebilllng section of a REC; and
- expenses related to oporatlon and maLntenance by theengineering personnel.
Non-power cost is composed mostly of salaries, followed by transportatlonand traveling expenecs, per dio and honoraria, end other operatingoverhead, in the ordor of theLr signlficance.
15. No ganeric progrem is proposed for non-power coats. They aredirectly linked with menagement measures; therefore, speclfic programsthat may relate to staffing or to the reductlon of specifLc expense itemsas well as annual objectives for the level of non-power costs percustomer, will be dLscussed dlrectly with poorly performing RECs.
16. As discussed previously, there is no generic program concerningO&aLIt of servi>- (item 3). At thls stage, the program will consistessentially ln a schedule for establishing and applylng the systms andprocedures needed to prepare Monthly Intarruption Reports (see Form 2attached). Measures that will permit ioprovements in service reliabilityare related to network rehabilitation (Lnvestent program), improvedoperation and maintenance practLecs, and improved network design. Suchmeasures might be gradually integrated in future PIPs, notably after thecompletion of a review of maintonance guLdelines and monitorlng systems.Some measures relatlng to maintenance are already lncluded ln thetechnical loss-reductLon program.
Monitoring of the PIP&
17. In conjunction wlth NEA lending, each REC would be required todemonstrate that it is lndeed imple entLng the agreed action steps on acontinuous basLs. In additlon, the REC's performance indLcators will bemonltored to establish that it is improvlng and approachlng the agreedtargets.
18. Monitoring of PIPs will be performed in part through the MFSR,the PIP MonLtoring Form 1 (see attached), Monthly Service InterruptlonReports (see Form 2 attached), schedules/unscheduled visLts, specialprogress reports that may be agreed wlth the ECs, and supervisLon of thelnvestmnt program.
- 78 -
PHILIPPINES
RURAL ELECTRIFICATION REVITALIZATION PROJECT
NATIONAL ELECTRIFICATION ADMINISTRAION
Schedule of SupervIson Activities and Mssilons
AWROXl. HXpEc1D SUIL ffAFMAT8 DAM ACnIVrrY MWQUIRE115 WI
(MO/YR) _ (li Wob)MM ReIw of bd4a omume Pose Eagmee4
sS Pm-o _d 4
12/ SURVISION MIONReview of RCS Appru Repouim Flaiu AmIul 53.0
__ BMw E_ _
1.U/92 v Reve of bid docubmam NWd eatio Pow EAI60
- Review of EC'. Apps. RaCM FMae Amlik
10.11/92 SUPRVISION MISSION PM Amiy S- Reviewofl apso I Mimp luplmnamlio Pose Euglaer* PMacfUatm W ON MW =Dmi
1-293 SUPVISON MION _mUu A_ 4- Review of NMA's bvlavumef rme Fave: Eolagim*. P l e 3eEm oco.i- Reviw of NM's fi11cl pu e _
1.12/9 Reve of Bi Domea_ Evuluuuom Rqpt Pmr B_aseg0
A fully integrated model was developed to project NEA's financialactivity including the investments that will be financed under the Project.The model accepts as inputs, assumptions on lending activity to the RECs,which are directly derived from the development of their correspondinginvestment programs, other revenues such as, support services fees, andadministrative and operating expenses. Other inputs to the model includeassumptions for financing, inflation and financial management policies. Yearending 1990 balance sheet accounts, on a net of bail out basis, were alsoinputs to the model in order to establish a 'clean books* starting positionfor NEA. Although the bail out program will be implemented over a two-yearperiod, NEA will establish a separate suspense account for the bail outrelated entries so that its future financial condition is represented moreaccurately at the outset of the projection period, and the statements areconsistent throughout the period of the projections.
The model was programmed to simulate NEA's activity as a specializedlending institution, according to acceptable management principles. As such,the total funds available to NEA are allocated based on specified priorities,with internally generated funds going first to meet requirements for increasesin working capital and debt service obligations, and secondly, to meet anyadditional lending requirements. The estimated external sources of funds, bothborrowings and government equity contributions, are added as independentvariables in order to bridge any resulting financing gap. Annual cash surplus-es are reinvested in short term securities, while deficits are deductedagainst this same account to the extent that there are sufficient funds tocover the draw. The final source of funds available to NEA would be additionalcontributions to equity by the Government. However, under such circumstances,revisions to other assumptions are considered first, such as scaling down thelending program.
B. Significant Acong Priiphs
The model incorporates several important accounting principles, whichinfluence the interpretation of NEA's projected financial statements. Theseinclude.
1. Accounting for Int rest Revenue. Interest revenue is accounted ona cash basis, since it is presumed that the collections ratesassumed reflect the true arrears situation.
- 86 -
ANNEX 5.5Page 2 of 7
2. Allowance for Doubtful Lomns. The projections consider a generalallowance for losses on doubtful loans based on the averagearrears rate of NEA's outstanding loans. Annual provisions are noncash items charged to the profit and loss account. No write offsare made during the projection period of loans that have beenprovided. This would not change the interpretation of the finan-cial statoomnts, sinco NEA's outstanding loans are reflected on anet basis, after the appropriate allowances have been made.
3. Allowance for For.Lp Exchage IUJIk Louses. The projectionsincorporato a general allowance of approximately 10 of NEA'soutstanding borrowings for which it bears a foreign exchange riskexposure. Annual provisions are a non-cash chargos to the profitand loss account. Annual foreign exchange losses are estimatedbased on projected depreciation of the peso vis-a-vis tho USdollar and are deducted from the total allowances made. In addi-tion, actual losses are reflected as cash items in the Flow ofFunds Statement.
4. ForeIgn Ezchange Trust Fund. The projections assume that NEA willset up an "off the balance sheet " trust fund to pay for foreignexchango cover estimated at 8X of the outstanding balance onforeign currency denominated borrowings. The fund has been set upsimilarly to an annuity where approximate equal payments are madeto meet actual and estimated future losses. The fund earns inter-est at rate equivalent to that paid on short term securities. Foraccounting purposes, NEA's contributions to the fund are deducteddirectly from the retained earnings account.
5. HaterLlas RandlIng Fee. NEA will charge a surcharge of 5X ontotal procured items to cover its costs of materials handling,warehousing and procurement related expenses. This revenue isassumed realized when invoiced. However, NEA will add the materialhandling fees invoiced to the principal amount of the loan made aRECs. This will be treated like other loans to RECs and will earninterest on outstanding balance until fully repaid.
C. Assumptions to the Fimandal Projections
L Gener-al Projecton Parameter
- Projection Period. 1991 to 2000.
- Currzncy. Millions of pesos in current prices.
- Inflatlon. Operating expenses are inflated at 10X per yearduring the projection period. No inflation is applied to thelending volumes since it is assumed that appropriate in-flation rates were incorporated in the RECs' investment pro-
- 87 -
ANEXt 5.5Page 3 of 7
grams. Accordingly, lending activity is already presumed tobe reflected at current prices.
Income Tazes. A 351 income tax rate is levied on profitbefore taxes. The projection makes no provisions for carry-ing forward losses to reduce overall tax liability. This isnot *xpected to have a material effect the derived results.
Currency Devaluatlon. An assumption about the fluctuation ofthe Peso vis-a-vis the basket of currencies was derived bytaking 1 plus the Peso inflation rate and dividing it by 1plus the foreign inflation rate. This formula resulted in anannual depreciation rate of 6.21 throughout the projectionperiod.
2. REC Lending Actvity
Restructured Loans. An estimated baiance of 9 821 million inREC loans will be restructured at an ave;*ge interest rateand maturity period of 121 and 7 years, respectively.
Exltlng Loan.s The balance of a 4.31 billion in outstandingloans to RECs are carried forward bearing an average inter-est rate and maturity period of 3.61 and 8.5 years.
Now Loans. Annual disbursements for new loans to RECs areshown in the table on page 6 of this annex, and estimatedbased on their respective investment program. Since thesecond half of 1991, new loans have been priced according toa cost recovery formula and carry an interest rate andmaturity period of 121 and 20 years, respectively. It isassumed that the rate will be increased to 131 in 1993 andto 141 in 1995, in accordance with the agreed formula.
Flnanclal Support to Small IZland RECs. Small island RECsare assumed to receive financial support directly from theGovernment, disbursements for which are shown in the tableon page 6 of this annex. These funds will be made availableas loans with unspecified maturities and at no interestrate. However, NEA will charge a 3.51 service charge of thedisbursed amount to cover administrative and overhead ex-penses related to managing this program for the Government.
Handling Charges. Handling charges for the warehousing andmaterials handling functions provided by NEA on behalf ofthe REC8 are calculated at 51 disbursed amounts and appliedto the principal of the REC loans.
- 88 -
ANNEX S 5Page 4 of 7
Collectlons and Arrears Rates. Presently, NEA is experienc-ing an overall collection efflciency on both interest andprincipal of about 562. It is assumed that this performancewill improve substantially in the short term because ofseveral factors: (i) the bail out will relieve the RECs ofdebt, the corresponding assets of which did not generatesufficient revenues to meet servicing obligations; (ii) theplanned restructuring will spread cash payments and make theRECs existing obligations more manageable; and (iii) NEAwill apply strict appraisal criteria for granting new loans.Based on these factors, improvenent targets were establishedwhereby a 65X average collection efficiency is initiallyassumed. Gradually over a five year period is expected tomove towards 851. Arrears are assumed to follow the inversepattern.
3. Ftnandng Sources
Proposed Bank o-n. Approximately $91.3 million will bemade available by the Bank fc- the Project. The loan willhave a 20 year maturity and 5 year grace period, and willcarry an interest rate of 7.75X. A 11 guarantee fee will becharged by the Government on the outstanding balance. Theentire amount of the loan waill be disburseo over a fivecalendar year period with the first drawdown in 1992. Annualdisbursements are shown on page 7 of this annex.
OECF Loan. A loan for an estimated $67 million are assumedfrom OECF to finance investments of RECs not included in theproposed Bank loan. These funds will be made available for25 years with 7 years grace and a 3.25X interest rate. Theloans will be disbursed over a five year period with thefirst drawdown in 1992. Annual disbursements for the OECFloans are shown in the table on page 7 of this annex.
Vorld Bang (Ehezrfg Sector Loan). Approximately $22 millionare programed under the current the World Bank EnergySector Loan of which $3 mIllion was drawn down during 1990.The loan is estimated to be converted to equity in 1993. Aninterest rate of 7.75X will be applied on the outstandingbalance during period 1990-1992. These are estimated atP 23 million in 1991 and P 47 million in 1992. Annual dis-bursements are shown in the table on page 7 of this annex.
USAID Grant. It is estimated that USAID will make avail-able approximately $37.4 million in grant funds over the1991-1994 four year period. Annual disbursements are shownin the table on page 7 of this annex.
- 89 -
ANNEX 5.SPage 5 of 7
Export Developaet Corporatlon (EDC) and the Caadian Inter-natloal Developmnt Agncy (CIDA). EDC and Cida wMll Joint-ly provide financing for steel transmissLon poles In theamount of $29 million. These loans will be drawn down inthree years co mmncing in 1992. The EDC loan will carry aninterest and maturity of 9.2X and 10 years, respectively.Ths CIDA funds will be on-lent at no cost to NEA, but willbe repaid within ten years.
US Ezport-IZport Bank (Ezbmbank). The US Eximbank willJointly finance with Edison-Hubbard Corp. approximately$21.5 million for wooden poles. These Eximbank funds will bedrawn down between 1992 through 1993 and will carry aninterest rate and maturity period of 7.44X and 8 years,respectively. The supplier credit will be on-lent at thesame interest rate but with a shorter maturity period offive years.
Danish International Development Agency (DANIDA). DANIDAwill provide a grant of $7 million for onlending to theRECs. Drawdown will occur between 1994 through 1996.
Govezznent Equlty Contributions. Approximately P 200 millionin equity contributions from the Government are budgeted for1991.
4. Fnandal MIanagement Paramemte
Cash Posltlon. Based on days of operating expenses at ap-proximately 45 days throughout the entire projection period.
Deposlt Vlth Banks. NEA will be required to cover letters ofcredit issued for procuring equipment and materials. It isestimated that shipments will take approximately 4 to 6months from the time a letter of credit is opened. Accord-ingly, it was assumed that NEA will hold an average of 90day of the value of purchases in the form of deposits withbanks. Thls is assumed to drop to 45 days in 1992-94, and 30days in 1995 and thereafter. Deposits with banks are as-aimed to earn 5 on the average outstanding balance.
Ccntributlons to FZ Fund. NEA's contributions to the FX fundare for both realized and unrealized losses. The amountscontributed for realized losses are derived by taking NEA'sannual debt service obligations in foreign exchange at therevalued rate less the original booked rate. Contributionsfor unrealized losses are made as a component of the onlend-ing interest rate to RECs and arL higher in the early yearsin order to build up the fund quickly. Accordingly, during1992, the portion going directly towards FX fund contribu-
- 90 -
Page 6 of 7
tions for realized and unrealized losses is 352 of the 12Xonlending rate, or 4.22. During 1993, the percentage wasreduced to about 272. Thereafter the contribution will rangebetween 18X to 28X of total interest income. Actual annualcontributions in Pesos an well as payments to the Governmentfor the foreign exchange cover are shown in the table onpage 7 of this annex. The remaining balance in the FX Fundwill be utilized as a buffer for potential increases in theFX cover fee.
Short Trm Shcurltles. Short term securities are projectedto earn an average rate of 152 on the average outstandingbalance.
Znventories. NEA will be providing a warehousing and mate-rials management function for staging equipment and machin-ery and fcr holding spare parts inventories. As of the andof 1990, NEA was holding about k 423 million in inventoriesor almost 10 months of total disbursements to RECs. This isconsidered excessive and agreements have been reached withNEA to set improvement targets over the projection period.Accordingly, inventory levels are set at 6 months during1991, and 3 months throughout the projection period.
Interost Payable. Presently, NEA pays interest semi-annuallythrough the Bureau of Treasury. The projectLons have assumedan average lnterest payable balance of 4 months during 1991,and subsequently dropping to a 3 month balance (equating toquarterly payments) throughout the rertining period.
Accounts Payabl. Accounts payable are based on day ofoperating expenses. These are estimate at 45 days during1992 and 35 days for the remaining of che period.
91- ANU 5.5
PHUPNURuiN BMOIfa" ROiiltan Pr"t
NaflSOn EWIufusgonr AdmhftrugtonARiMplun sot Fnranca Profeciona
(In MM Poc)
1301 1992 193 It"4 1ogs 100 1997 1t" 1900 2000
Now PEo LOANS
O. WI w/ei anChIpa 1100 1320 2100 20 2025 2310 2310 2100 2100 2160
BASED ON RATE CONSULTATION^^* PROPOSED (FOR FURTHER EVALUATION)+ RATE RETENTION
Notle Orignally, the 50 RECs presonted below were to be the beneficiaries of the proposed loan; at negotiations, NEA asked that tour more FlECs be added to the list ofbeneliklarlee. Although the circumstances and Investment programs ol those RECs had been appraised, the additional data needed lor this annex was not readily available.
BWEEJNFA~~~~~~~~Pq 2 RURAL ELECRIFICATINRt r TIN PROA P323
WSIDTI§ L Comm PUUC BLGS TAK ST,5rMN BUll RATE MCN ILW RATE MIN 8WLU RATE D eAM ENERGY DE1MAD ENERGY PERREGION MINKWH ABOVEMIN MINKWH ABOVE MI MIN KWH ABOVE MIN CHARGEM HAREkW CHARA ARwEA KWH
1. Substantial progress has been made during the past few years in thearea of investment planning. REC investments used to be determined on an ad-hocbasis, mainly as a function of short-term availability of funds. They are nowestablished in the framework of five year plans, which are prepared andevaluated according to precise procedures and criteria. The process is based ona participative approach, and NEA's objective is to give RECs an increasing rolein the preparation and of medium-term investment plans. These procedures anicriteria are enunciated in NEA's Investment Guidelines. This document emphasizesthe role of economic criteria (EIRR) in the evaluation of investment programs.
2. The annual planning cycle begins each April, when NEA's CorporatePlanning Office (CORPLAN) sends gudelines to the RECs for the preparation of thefive-year investment programs ; these guidelines include the main parametersneeded for project design and evaluation, as well as methodologicalrecommendations on questiona such as market analysis and load forecasting. Oncethe plans are prepared they are discussed with NEA's Regional ElectrificationManagers, NEA's engineering department, and CORPLAN, during the InvestmentPlanning Workshops held during the summer. The plans are then analysed furtherat NEA's headquarters; this year, for the first tire, the evaluation of RECinvestment programs will be based on the new computer Model for the Evaluationof Electrification Programs (MEEP), discussed below. The process will culminatewith the preparation of Project Evaluation Reports (PERs) which summarize thetechnical, economic, and financial aspects of the REC's investment program, aswell as the REC's PIPs (Annex 4.2). These PERs, which will be updated regularly,will be submitted to NEA's Board, as part of the lending process.
General structure of the KEEP
3. The general methodology used in the economic part of the model has beendiscussed in Chap.6. In fact, the economic evaluation of RECs' investmentprograms is part of a larger model, which, first, establishes investment flowsdistinguishing foreign and local costs, based on the physical quantitiessubmitted by the RECs, and on NEA's standard costs. The relevant outputs of theproject costing and evaluation model are then fed into a financial projectionsmodel. Project costing by the RECs themselves (depending on the availabllity ofcomputers) is expected to be one of the first steps of NEA's plan to decentralizethe planning process.
- 97 -6.1
Page 2 of 2
Deuand Forgegg
4. Today, deuand forecasts are generated in the framework of the KEEP itself,based on assumptions on growth trends of consumption per customer for foursectors (residential, commercial, industrial, others), and forecasts of newccnnections given by the RECs. For neu industrial connections however, annualkWh consumption and coincident peak demano -an be input directly. For other newconnections, consumption per connection is assumed to be 85 of that of theexisting customrs. The modal also establishes peak demand projections based onload factor forecasts, taking into account the fact that technical loss reductionhas a higher impact on peak demand than on energy demand. Peak demand and energyforecasts are used to calculate the econoaic and financial costs of builk supply.
Toss Reduction PXofiles
5. In the absence of estimates of the breakdown between technical and non-technical losses for each REC, current calculations are based on standardbreakdowns and standard loss reduction profiles were adopted, as a function ofthe total loss ratio, with a ceiling of 18X for technical losses. These lossreduction profiles are acceptable (Annex 3.3).
Cost Benefit AnalXsLi
6. The methodology used for cost benefit analysis is classical. It is basedon the use of incremental consumption , valued on the basis of consumer surplus,as a proxy for economic benefits. Calculation of the consumer surplus is basedon minimum willingness to pay as revealed by the substitution of electricity forkerosene in basic ligthing uses, and by the current price paid for the currentlevel of monthly consumption (the two latter data are REC specific), assuming alinear demand curve between these two points. For industrial consumptionbenefits are based on the redustion in economic cost, as compared to diesel basedself-generation. The main parameters used in the econonomic evaluation are givenin Annexes 5.7, 6.2, and 6.3. Although the benefit cost methodology isclassical, the separation of reinforcement/rehabilitation, add-ons, and extensionprojects in the economic evaluation is an original characteristic of NEA's modal,as contrasted with the aggregate approaches often used in the economic evaluationof distribution projects. The EIRR for the entire program is calculated byconsolidating all the net benefit flows of projects passing the 151 EIRR test.
1. The following table gives the JIRCs of bulk supply at 69 lcV for thevarious grids of the Philippines. The project evaluation modeldistinguishes the capaecity and energy components of the ZINC; theequivalent total cost per klh, calculated for a load factor of 40S isgiven only as an illustration.
ECO Dbcour* R 15% Foreign Excng 1.20 Foreg RPm 2OOPI1$
FIN Dboourt Rat 12% LOC U.idld Labor 0.60 Duty 0%
Badc LhUng Reidea Okwh moBadi LgI Commec 21 kwhlmoHouwbto Cost P2000lmoPrie of Kerosen PU O0Econonic Cost Sell Generaton PS.w
SUMMARY
Total No. of ProJectRshatdAdd 11Expanon 31Rehb UAdd-cf S9
Totl No. of RECs 50
Consolidated EIRR 0.36
Od,gln* only he 60 RECa presd below were to be t benef_cles of th proposd kw at nadans,NEA ased tou more RECe be added to th Mg ol benefciares. Adthough the _m p 1 and hsesbneatprorp of tow four RECa were apprasd, th addonal dat neded or Oth anex wa not realy a_lbs.
- 100 -ANE 6.3
Page 2 of 5
PLIPPNEsRURAL EECTRICATION REVffALIZAIION PROJECT
Rates of Retur o Proposed REC ProjectsDtW
Prjooct MC Fe iee FinwfeaL Total TotalT tst wv M **w-~~~~~-199245.
11 Cagayen 49 Westn Ser C ant o pitol12 aboeb 50 REtes tamer S R _.13 Nu.-Vi-ey 51 L"I n Province Boundaries14 Quidrs 52 SentIren Lete I ,o B
111 CENTRAL LUZON 53 Rlien Region Boundaries15 Nen Edia IX WESTERN MINDANAO16 Tlrrs 54 Z-rbeQan del Nerle r1217 Zeebn1ares 55 Zcmbeng, del Sur aw International Boundoris18 Pp e-gon 56 Rbsli-n J 13 1419 bwcn 57 Sole20 bulcpcn 58 Tcowlai eren< V *NATIONAL CAPITAL X NORTERNEAMINDANAO ssaoREGION (NCR) 59 Srig dl Net 1 03
V BICOL XIlI CENTRAL MINDANAOG32 C-terines Nerle 71 L-se del Ncte33 Cornines Sur 72 Lcro de S..34 Centandueras 73 North Cetbrte35 bsy 74 Maguird-nI 936 Sersegen 75 Sulto Kudcrot37 Strbete
V~~~~~~~~~~~~~~~~~~~~~~Vl
75~~~~~~~~~~~~~~~~~~~~~~~~~5/31''( X] 5 , _
~~~~~~~~~~~~~~~~~~~~~~~~odreenlen -'l nfnleeteodRnGs. T-daneoher'ded, J 2s s a g *t r 1 . | ' i~~~~~~~~~~bndes he e hi nnS ntm e hep