S\V/F I Labor Market Behavior in the Republic of Korea An Analysis of Wages and Their Impact on the Economy David L. Lindauer WORLD BANK STAFF WORKING PAPERS Number 641 Public Disclosure Authorized Public Disclosure Authorized Public Disclosure Authorized Public Disclosure Authorized Public Disclosure Authorized Public Disclosure Authorized Public Disclosure Authorized Public Disclosure Authorized
Transcript
S\V/F ILabor Market Behavior in the Republic of Korea
An Analysis of Wages and Their Impact on the Economy
David L. Lindauer
WORLD BANK STAFF WORKING PAPERSNumber 641
Pub
lic D
iscl
osur
e A
utho
rized
Pub
lic D
iscl
osur
e A
utho
rized
Pub
lic D
iscl
osur
e A
utho
rized
Pub
lic D
iscl
osur
e A
utho
rized
Pub
lic D
iscl
osur
e A
utho
rized
Pub
lic D
iscl
osur
e A
utho
rized
Pub
lic D
iscl
osur
e A
utho
rized
Pub
lic D
iscl
osur
e A
utho
rized
WORLD BANK STAFF WORKING PAPERSNumber 641
Labor Market Behavior in the Republic of Korea
An Analysis of Wages and Their Impact on the Economy
All rights reservedManufactured in the United States of AmericaFirst printing July 1984
This is a working document published informally by the World Bank. Topresent the results of research with the least possible delay, the typescript hasnot been prepared in accordance with the procedures appropriate to formalprinted texts, and the World Bank accepts no responsibility for errors. Thepublication is supplied at a token charge to defray part of the cost ofmanufacture and distribution.
The views and interpretations in this document are those of the author(s) andshould not be attributed to the World Bank, to its affiliated organizations, or toany individual acting on their behalf. Any maps used have been preparedsolely for the convenience of the readers; the denominations used and theboundaries shown do not imply, on the part of the World Bank and its affiliates,any judgment on the legal status of any territory or any endorsement oracceptance of such boundaries.
The full range of World Bank publications is described in the Catalog of WorldBank Publications; the continuing research program of the Bank is outlined inWorld Bank Research Program: Abstracts of Current Studies. Both booklets areupdated annually; the most recent edition of each is available without chargefrom the Publications Sales Unit of the Bank in Washington or from theEuropean Office of the Bank, 66, avenue d'Thna, 75116 Paris, France.
David L. Lindauer is assistant professor of economics at Wellesley College (U.S.A.)and a consultant to The World Bank.
Library of Congress Cataloging in Publication Data
Lindauer, David, 1952-Labor market behavior in the Republic of Korea.
(World Bank staff working papers ; no. 641)Bibliography: p.1. Wages--Korea (South) 2. Compensation management--
Korea (South) 3. Wages and labor productivity--Korea(South) I. Title. II. Series.HD5078.L56 1984 331.2'09519 84-11992ISBN 0-8213-0380-5
Abstract
Throughout the extensive discussions of the determinants of Koreaneconomic success, one factor is noticeably absent. Attention is rarely calledto the supportive role that the Korean labor market has played over the lasttwenty years. Certainly one of the lessons of the Korean experience is thecontribution a responsive labor force can make to economic growth.
In this paper, recent macroeconomic events serve as a backdrop toexamining a variety of aspects of the Korean labor market. The evolution ofthe wage structure of Korea's formal economy is analyzed according to sectoraldimensions as well as worker and firm characteristics. In addition toanalyzing issues concerning wage trends and wage structure, aspects of Koreancompensation systems and employment contracts are examined. The economicimplications of the extensive system of nonbasic-wage payments, i.e., bonusesand allowances, are reviewed as is the notion that Korean enterprises rely onJapanese-style permanent employment contracts.
The paper concludes by comparing wage and productivity trends overthe last decade in an attempt to understand the basis for domestic priceinflation. Both cost-push and demand-pull explanations are evaluated.Lastly, a technical Appendix revielws sources of Korean labor market data.This review suggests that a far vaster urban informal employment sectorexists than is usually portrayed in discussions of the Korean economy.
Extracto
En todos los extensos analisis de los factores determinantes del _xitoecon6mico de Corea, hay uno cuya ausencia es nozable. Rara vez se destaca lafunci6n de apoyo que ha cumplido el mercado laboral coreano en los ultimosveinte ainos. Sin duda, una de las lecciones que ensenia la experLencia regis-trada en Corea es el aporte que puede hacer una fuerza laboral sensible al cre-cimiento economico.
En este documento se utilizan ciertos sucesos macroeconomicos recien-tes como tel6n de fondo para examinar diversos aspectos del mercado laboralcoreano. Ta evolucion de la estructura salarial de la economia formal de Corease analiza de acuerdo con las dimensiones sectoriales y las caracteristicas delos trabajadores y de las empresas. Ademas de analizarse las cuestiones relati-vas a las tendencias y estructura salar4ales, se consideran aspectos de los sis-te.mas de rernuneracion y de loS contratos de trabajo de Corea. Se estudian lasrepercusiones economicas del vasto sistemna de oagos no incluidos en eL salariobasico, es decir, bonificaciones y asignaciones, y se examina tambien el con-cepto de que las empresas coreanas utilizan contratos de trabajo permanente alestilo de los japoneses.
Este documento termina con una comparacion entre las tendencias delsalario y de la productividad en la uiltima decada, para tratar de comprendercual es la base de la inflacion de los precios internos. Se evalua tanto laexplicacion que se basa en el alza de los costos como la que se fundamenta en lapresi6n de la demanda. Por ultimo, en un apendice tecnico se estudian las fuen-tes de los datos relativos al mercado laboral de Corea. Este estudio indica queexiste un sector de empleo informal urbano mucho mras vasto que el que suele des-cribirse en los analisis de la economia de Corea.
Les etudes circonstanciiies qui sont faites sur les causes de lareussite economique de la Coree omettent un facteur important : on neparle que rarement du r6le positif que joue le marche du travail depuisvingt ans dans ce pays. Or, l'impact d'une main-d'oeuvre dynamique surla croissance 6conomique est certainement l'une des leqons a tirer desr6sultats obtenus par la Coree.
Dans l'etude presentee ici, les phenomenes macro-economiquesrecents servent de toile de fond Ai l'analyse de divers aspects du marchedu travail en Coree. On y examine l'volution du bareme des salairesdans l1economie structuree, d'abord par secteur mais aussi selon lescaracteristiques des travailleurs et des entreprises. On y etudie nonseulement les tendances et la structure des salaires, mais aussi certainsaspects des systemes de remuneration et des contrats de travail. On yanalyse les implications 6conomiques du systeme generalis6 deremuneration autre que par un salaire de base, a savoir sous forme deprimes et dtindemnit6s, et l'idee que le succes des entreprises coreennesrepose sur des contrats de travail permanients, a l'instar du Japon.
L'etude compare ensuite les tendances des salaires et de laproductivite au cours des dix dernieres ann6es en vue de mieux comprendreles causes de l'inflation des prix internes : elle evalue le r6lerespectif de l'inflation par les couts et par la demande. Enfin, uneannexe technique passe en revue les sources des donnees concernant lemarche du travail coreen. I1 ressort de cette etude qu'il existe enmilieu urbain un secteur non structur6 de l'emploi bien plus importantque ne le laissent g6neralement supposer les descriptions de l1'conomiecoreenne.
Acknowledgments
I am grateful to Messrs. Mark Leiserson, Shahid Yusuf and RogerKey for their comments.
Table of Contents
Page No.
1. Introduction and Summary of Findings . . . . . . . . . . . . 1
A. Background . . . . . . . . . . . . . . . . ... . . . . . . 1B. Organization and Primary Findings . . . . . . . . . . . . 2C. The Role of Government in the Wage Setting Process . . . . 6
1. Average Earnings in Manufacturing (1955-80)2. Average Real Earnings in the Formal Economy (1970-82)3. Monthly Real Earnings by Economic Sector4. Interindustry Earnings Structure - The Trend in Relative Dispersion5. Average Annual Percentage Increases in Total Earnings6. Male/Female Earnings Ratio by Education (1971-81)7. Earnings Ratios for Men and Women by Education (1971-81)8. Earnings Experience Ratios by Selected Occupations for Selected Years9. Earnings by Firm Size (1970-80)10. Earnings by Firm Size by Sex and Occupation, Selected Years11. Distribution of Employment by Firm Size for Selected Years12. Ratios of Earnings and Productivity for SMIs and Large Industries
(1970-79)13. Earnings by Region in Manufacturing (1955-80, Selected Years)Al: Total Monthly Earnings by Sex and Level of Educational Attainment
(1971-81)A2: Total Monthly Earnings by Sex and Level of Educational Attainment
(1971-81)14a: Share of Total Compensation Received as Bonuses and Overtime Pay (Men
Only)l4b: Share of Total Compensation Received as Bonuses and Overtime Pay (Women
Only)15: Average Length of Duration at Firm and Average Years of Job Experience
by Occupation (1971-81)16: Earnings, Price and Productivity Trends (1971-81)17: Employment by Economic Sector (1979) According to Alternative Sources18. Persons Employed by Class of Worker (1979)19. Comparison of Occupational Composition (1980) Nonagricultural
Workers Only
A3: Comparison of Productivity and Earnings Measures in Manufacturing(1971-81; 1975=100)
1. INTRODUCTION AND SUMMARY OF FINDINGS
A. Background
Over a span of twenty years the Republic of Korea has transformeditself from a poor and backward agrarian nation into a modern industrialsociety. Between 1960 and 1980 real GNP per capita is estimated to havegrown at an annual average rate of 7% - an increase almost unparalleled ininternational experience. ALong with sustained increases in GNP per capitathe nation has registered significant improvements in almost every otherindex of economic growth and development.
Considerable research has been undertaken into the primarycauses and determinants of Korean economic growth. Such research has beenmotivated not only by the desire to explain Korean history but also by thehope that lessons learned from Korean experience might be successfullyapplied to other nations who thus far have witnessed less satisfying economicdevelopment. Among the most common factors mentioned as determinants of theKorean growth miracle are the magnitude and impact of foreign aid, thesignificance of education in Korean culture, and the role of specificgovernment policies and interventions in the fields of agriculture,industrial development and especially export promotion./L Throughout thedebate on the determinants of Korean economic success, one factor is oftennoticeably absent. Attention is rarely called to the supportive role thatthe Korean labor market has played over the last twenty years. And yet,without this support, the successful transformation of the Korean economycould not have been achieved. Understanding how a relatively backwardagrarian population evolves into a modern industrial work force in the spaceof a generation is likely to reveal much about the success of the entireeconomy. Certainly one of the lessons of the Korean experience is thecontribution a responsive labor force can make to economic growth.
Having achieved so rapid a transformation of the economy, Koreanow faces new economic problems, many of which involve the labor market.The macroeconomic events of the last ten years have produced rapid growth inoutput, exports and real wages. High inflation followed by growing unem-ployment and decreasing export competitiveness have also characterized therecent past. In many ways these recent economic troubles should not havebeen unanticipated. The export-led strategy of the late 1970s placed Koreain a vulnerable position to the vagaries of international economic condi-tions. The impact of slack export demand in the early 1980s and the entrance
/1 See Mason et. al. (1980) for a complete review of these hypotheses.
- 2 -
of new competitors in the international arena are likely to have been asresponsible for recent economic problems as were purely domesticdevelopments.
With recent macroeconomic events as a backdrop, this reportexamines a variety of aspects of the Korean labor market. The allocativeproperties of the market are first considered and offer insight into thefundamental dynamics of Korean wage determination. After having establishedsome basic properties of the labor market, the report goes on to examine theimpact of wage trends on domestic price inflation.
B. Organization and Primary Findings
Although rich in statistics, some major weaknesses in Korean labormarket information exist. Specifically, by comparing the household basedsurvey of the economically active population with establishment-based wageand employment surveys, official sources are found to account for theearnings of only one third of total private, nonagricultural employment. Inother words, according to available sources, some two-thirds of Korea'sprivate, nonagricultural work force belongs to the small-scale or informaleconomy for which no wage data exist. The majority of the nonagriculturalwork force appears to be engaged primarily in service activities operatingas self-employed or family workers. What is striking about these results istheir suggestion that a far vaster urban informal employment sector existsthan is usually portrayed in discussions of the Korean economy. Addi-tionally, these findings limit in scope the generalization on wage andemployment which can be safely drawn from the available data. (The Appendixto this report reviews in detail sources on Korean wage employment.)
With these limitations in mind, Chapter 2 considers real earningstrends in manufacturing and the rest of the formal economy. Chapter 2 isgenerally concerned with the allocative and signalling properties of thelabor market and relies on earnings trends and the evolution of the wagestructure to document these properties.
The manufacturing sector experienced significant real earningsgrowth from the mid-1950s through the late 1970s. As employment in thissector expanded, real earnings increased by close to 60% throughout the 1960sand doubled in the 1970s. 1980 marked the first decline in real earningsin at least two decades. Other formal economic sectors experienced relativelyanalagous real earnings movements.
The earnings trends of the formal economy suggest that the Koreaneconomy had passed through the Lewis phase of surplus labor by themid-1970s. The sustained wage increases of the period 1976-79 are difficult
- 3 -
to reconcile with any other interpretation of the changing long-run elasti-city of labor supply. Real wage stagnation and erosion in the post-1979period is seen not as proof of a reemergence of a surplus labor situationbut rather as an indication of the labor market's response to cyclical dis-turbances. Use of a surplus labor model to depict the contemporary Koreaneconomy is seen as an incorrect macroeconomic framework for the 1980s.
Concerning more microecorLomic indications of allocative behavior,Section B examines movements in the interindustry earnings structure between1970 and 1981. Stability in the ordinal ranking of industries is inevidence. Compression of the interindustry earnings structure is alsoapparent especially since 1975. Th,is compression suggests significant wagecompetition for workers during this period.
Another dimension of the formal economy's interindustry earningsstructure which is considered, is a. comparison of public and privateearnings. No obvious trend toward, so-called, public sector wage leadershipis revealed by this comparison. Although the public sector may providesignificant wage signals to the rest of the economy, the evidence does notmaintain that public sector wage settlements dominate private sector wageagreements.
In Section C, the "'demographic" dimensions of the wage structureare considered. Starting with earnings differentials by sex, it is notedthat male wage premiums are inversely correlated with level of education.However, even after adjusting for level of educational attainment, male/female earnings ratios show virtually no secular compression during the1970s. The data suggest that female workers, even with their lower reser-vation wages, failed to dampen male wage increases even during the late1970s peak labor demand. This revealed low elasticity of substitutionbetween the sexes suggests an institutional distortion in industrial laborcosts which may impose, at least in the long run, inefficiency costs on theeconomy.
The wage structure according to education reveals largedifferentials between college and high school graduates and smallerdifferentials between workers with high school versus middle and primaryschool educations. The intertemporal pattern of these differentials,especially for men, appears to track the relative scarcities of educatedlabor. In the early 1970s differentials widen but by the late 1970s whensupplies had significantly expanded differentials held firm during the highgrowth years and subsequently declined as labor demand leveled off in the1980s.
The Korean government's stated desire of the past few years toreduce wage differentials appears consistent with market forces. Policymakers are, however, cautioned not to accelerate these trends beyond the
- 4 -
dictates of the market. Undesirable consequences, such as the substitutionof educated for uneducated labor, may result from forced wage tapering andmay represent a costly mechanism for achieving equity objectives.
Section D considers earnings behavior according to firm size,region and a number of other parameters related to the firm. The results onearnings by firm size are particularly strong. Although larger firms paymore throughout the period under consideration a substantial reduction inthe large firm premium is realized over time. In 1970, for example, workersin manufacturing firms of 500 or more employees made almost 2 1/4 times whatworkers in the smallest firms, 5-9 employees, earned. By 1980 this dif-ferential had fallen to a large firm premium of under 75%. Coincident withthis compression in the wage structure, the small firm sector continued tothrive, suggesting that wage and productivity developments were well alignedand that wage dynamics may have been more market than institutionallyenforced.
Wage compression in the manufacturing sector according to region ofemployment also showed considerable narrowing over the 1970s. Reduction inregional wage differentials due to firms competing for workers appearsstronger than the dual of workers competing for jobs. This inference isbased on the movement of earnings differentials during peak versus slackperiods of labor demand.
Chapter 3 moves away from strict inspection of allocative issuestowards more institutional aspects of the wage payment system. Inparticular, the composition of the compensation package and the natureof permanent employment contracts are discussed.
Korea has inherited, adopted and adapted aspects of the Japaneselabor and industrial relations system. Concerning compensation, theKoreans also rely on an array of bonuses, allowances and fringe benefits intheir remuneration package. Bonus payments, namely payments which varyaccording to the success of the enterprise, and overtime pay account for 30%of average total compensation in the formal economy. This percentage hasbeen growing throughout the 1970s as firms have chosen to increase bonuspayments rather than basic wages.
Such behavior on the part of firms can be explained in terms ofthe added flexibility the bonus sytem provides. As bonuses increase, anincreasing proportion of the wage bill becomes a variable as opposed tofixed cost, at least in the short run. Firms also prefer granting payincreases through bonuses because the level of most fringe benefits islegally tied to basic wages not to total cash compensation. Total laborcosts can thereby be reduced by minimizing increases in basic wages.
The economic implication of this growing reliance on nonbasicwage compensation are varied. The system passes on some of the risk ofbusiness activity to workers since both profits and wage bonuses can vary
- 5 -
with the firm's economic success. The system is also likely to disguise truelevels of inter-firm compensation and thus limit the information available inthe labor market.
While Korean firms may have adopted the Japanese bonus system, itis less clear that permanent or lifetime employment contracts have beensimilarly transferred. Although the information is often contradictory, areview of scholarly works by Korean labor market specialists, discussionswith Korean businessmen and economy-wide data on job turnover and workercommitment to individual firms, suggests that permanent employment is notthe rule in Korean establishments. If anything, firms pressured by govern-ment have a greater responsibility toward maintaining workers than workershave toward their attachment to enterprises.
The economic implications of these findings suggest that theeconomy can have continued confidence in labor's mobility which willsupport development of new economic sectors. Furthermore, governmentmay have to assume greater responsibility in insuring incomes and employ-ment during cyclical downturns, since firms will not automatically bear thisburden as part of existing institutional arrangements. Lastly, the lackof employment guarantees suggests the need for improvements in industrialand labor relations institutions to facilitate worker-management dialogue.
In the report's last chapter, Chapter 4, entitled, "Wages, Pricesand Productivity" the impact of recent wage developments on domestic priceinflation is considered. Throughout the 1970s the rate of wage increasesexceeded the rate of price increases. Furthermore, during the late 1970s,rapid wage growth was coincident with accelerating price increases andpreceded the high inflation of 1979-81. However, these findings need notimply that cost-push rather than demand-pull was at the heart of thewage-price spiral. Demand pull extplanations are also consistent with therapid growth of the Korean economy during these years and along withaccomodation by monetary authoritiLes, may help to explain the cause of thisround of increases in the Korean price level.
While Chapter 4's discussion of wage and price inflation isprimarily devoted to reconciliation between basic data and alternativetheories of inflation, some attent:ion is focused on policy prescriptions.In particular, the institution of mandated wage controls in the event offuture episodes of price inflation is discouraged, since the structuraldeterminants of such inflations may not stem from the supply side of thelabor market. By imposing such controls, wage increases may be dampened atthe price of potential bottlenecks and generally inefficient operation ofthe labor market.
- 6 -
C. The Role of Government in the Wage Setting Process
Throughout this report the position that government has had alagging not leading role in the wage determination process is maintained.This position is likely to be disputed by some individuals familiar with theKorean labor market. This is not to say that the government was uninvolvedor that laissez-faire is an appropriate characterization of the market.What is instead being suggested is that market forces are likely to havedominated wage and employment outcomes, and that wage and employment trendswere not independently determined as a consequence of government wageguidelines or mandated employment policies.
Defending this position is not as easy as it might first appear.During the period under consideration, roughly 1970-1982, the governmentnever had a formal apparatus for wage controls akin to what has existedor does exist in other nations. However, wage guidelines have been periodi-cally announced throughout this period and have been enforced through theweb of government, labor and industrial relations which characterizes theKorean economy. The organized financial sector may also have played a rolein this implicit system of control, compromise and persuasion.
Between 1975 and 1978, the government appears to have favored someadministrative guidelines on minimum levels of basic wages. By 1979, offi-cial spokesmen were encouraging adoption of national productivity growth asa wage guidepost. Public statements in 1980 through 1981 altered this posi-tion as they urged the parties involved to reach their own accords. Byearly 1982 no official stance was being taken although some members of thegovernment planning community did favor wage settlements limited to a singledigit. If anything, this accounting of government wage policy highlightsits implicit and variable nature. It appears that the government "has keptits ear to the ground" and has avoided significant departures from thedictates of market forces. Even if such departures may have been advisedthey have rarely been long term in nature. This flexible approach towardsinfluencing labor market outcomes should be encouraged because it is likelyto have been a key element in maintaining the responsiveness of the labormarket to the needs of Korean economic growth.
As Korea faces increasingly more complex macroeconomic distur-bances such as the high inflation of the late 1970s and the current economicrecession, the imposition of labor market controls may appear as attractiveexpedients for ameliorating immediate problems. However, by not getting atthe structural roots of these problems, and by only dealing with theirmanifestations in the labor market, such solutions may impose long runefficiency costs on the economy in return for short run benefits. Suchtrade-offs should be avoided.
- 7 -
2. WAGE TRENDS AND WAGE STRUCTTURE
A. Wage Trends--An Overview
An understanding of Korean wage dynamics is aided by consideringthe macroeconmic transitions of the last few decades as reflected inavailable earnings data. Starting from the late I050's, these data traceKorea's transition from a Lewis type surplus labor economy through thebusiness cycles of the mid-, to late 1970's and early 19qo's. An appre-ciation of this 20 year wage history lends perspective to recent events.
The Mining and Manufacturing surveys and censuses date back to1955 and have been undertaken annually since 1969./I Although representingonly a small percentage of the total work force, earnings trends in thissector are a good proxy for wage movements in the formal economy. Table 1presents the nominal and real earnings trends for the manufacturing sectorfor 1955-1980. The data reveal the considerable real wage gains ofemployees in this sector. As the manufacturing sector has grown, so havethe levels of pay. Over the decade of the 1960's real increases of close to60% were achieved while the 1970's saw real earnings in manufacturing morethan double.
/1 The Mining and Manufacturing surveys and censuses as well as all theother wage and employment surveys mentioned in the text are fullydescribed in the Appendix.
- 8 -
Table 1: AVERAGE EARNINCS IN MANUJFACTUJRING (1955-19RO)(in '000 won/annum)
Real EarningsNominal Index number X change from
Year Earnings (1q75 won) (1975 = 100) previous year
/a The percentage change is the computed average annual percentage changeover the relevant interval.
Source: All data are originally from the Mining and Manufacturing Survey orCensus. Collection of these data has been the responsibility ofvarious agencies, including, in chronological order: Bank ofKorea, Korean Reconstruction Bank and Economic Planning Board. Forthe years 197n-1979, the data are from the tabulations of the Smalland Medium Industry Randbook (1980).
The late 1970's were a period of rapid growth in the Korean economyand for four consecutive years, 1976-1979, earnings in manufacturing increasedat a pace far above the previous historical trend. What must be emphasizedabout this period was not only the high level of real earnings growth, butthat this level was sustained for so many years. In two earlier periods--
1967-1969 and 1973--significant increases also occurred, but they were,respectively, of a smaller magnitude and relatively short lived. Lastly,the decline in real earnings in 1980, even though it measured less than onepercentage point, stands as a major departure from more than two decades ofannual real wage gains.
- q -
In order to illustrate that the manufacturing sector's earningstrend does not represent an isolated event in the movement of Yorean wages,Table 2 presents earnings series for manufacturing and for private non-manufacturing employment in the for-mal economy. These series are derivedfrom the Monthly Wage Survey and extend from 1970 through 1981. Accordingto the Monthly Wage Survey, the share of formal employment of thenonmanufacturing group averaged approximately 30% during the 1970's.
Table 2: AVERAGE REAL EARNINGS IN THE FORMAL ECONOMY (1970-82)('000 won/annum)
Manufacturing Non-ManufacturingIndex % change Index % changenumber from pre- number from pre-
Year (1975 won) (1975=100) vious year (1975 won) (1975=100) vious year
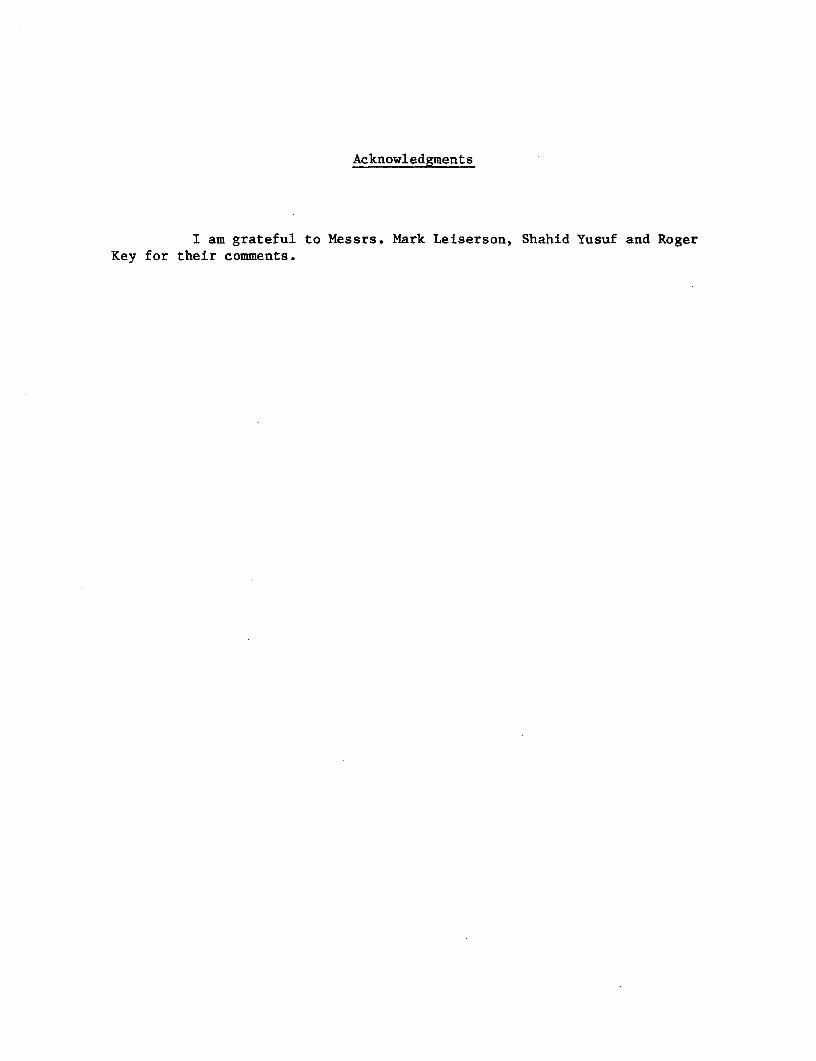
The Monthly Wage Survey results portray manufacturing and the restof the formal economy experiencing very similar earnings trends over the1970-81 period. Once again, the pattern of relatively modest real wagegrowth (1970-75), followed by extremely rapid growth (1976-78), followed bydeclining real growth (1980-81) is apparent. The magnitude and exacttiming of real wage change does, however, vary between manufacturing andnonmanufacturing. This is due, to a large extent, to the volatile wagepatterns of the construction sector (this point will be elaborated uponbelow).
The evidence of a recent reversal in earnings trends since the late1970's is consistent with the general slack in the Korean economy and withthe absolute decrease of over 100,000 workers employed in the formal sector.This reversal highlights the worsening income position of Korean labor.
- 10-
In Figure I, the similarity between the long run real earningstrends of the manufacturing /1 and nonmanufacturing sectors are againpresented. Having established these trends, it is now possible to interpretthem in terms of Korean macroeconomic developments. The model most oftenapplied to the Korean economy has been of the Lewis surplus labor type.Briefly, these models see modern sector growth fueled by relatively cheaplabor until the point when marginal productivity wage setting characterizesthe traditional sector. At this point, the so-called "commercializationpoint," wages in both the modern and nonmodern sectors reflect productivitycriteria and are seen as part of a sectorally integrated process of wagedetermination.
The value of assessing Korea's position within the Lewis model isto determine how much, if any, surplus labor exists to fuel future indus-trial expansion. The relatively gradual real growth in the manufacturingearnings series prior to 1967, and maybe even to 1975, probably reflects avariety of factors including an increasing skill mix of employment withinthe sector and/or changing institutional arrangements in wage setting. Ingeneral, this period is consistent with the surplus labor phase. However,from 1976-1979 it would be difficult to attribute the sustained increases inreal wages solely to nonmarket forces, given that neither union power norgovernment involvement in wage determination was a significant factor duringthis period. Furthermore, the rapid acceleration of the Korean economyduring these years suggests that market forces were working in the directionof increasing labor earnings. Although it may remain a matter of debatewhen Korea passed its commercialization point, the evidence suggests thatlabor surplus, in the Lewis sense, had been absorbed by the mid 1970's.
/1 It should be noted that the results on the manufacturing sector fromthe two surveys are not identical. Differences can be attributed toa number of factors including:
(a) differences in coverage (Mining and Manufacturing surveysinclude small establishments);
(b) differences in collection period (the Monthly Wage Survey is anaverage of monthly earnings while the Mining and Manufacturing isan annual figure); and
(c) the Mining and Manufacturing survey uses a broader definition ofremuneration and includes more components of labor costs.
- 11 -
FIGURE I
Earnings Trencks in the Private Formol Ecoromy
175-Manufacturing(?1H) ir-Mufocictr ing(MUS) '
1~6- Manufactu- ng>(H;S) 1�158 .1
nd 125
N 188
r t Ib 7reI
25
1955 1968 1965 1978 1975 1980
Year
* l2 -
The rapid acceleration in real wages in the late 1970's suggeststhat a long run, elastic labor supply curve no longer faces Korea's indus-trial sector. The narrowing of the urban/rural household income gap, citedby Bhalla (197q), further suggests the integration of the nation's labormarket and runs counter to the dualism model's claim of institutional wagedetermination in the traditional sector. If a situation of elastic laborsupply prevails in the next few years it is likely to reflect short runcyclical phenomenon not a secular tendency as depicted by a surplus labormodel. What this implies for anticipated pressures on industrial wages isthat they are likely to be low until unemployment rates, for given skills,again reach their frictional points.
B. The Interindustry Wage Structure
The manufacturing/nonmanufacturing earnings trends presented abovecan be complemented by finer disaggregations by industrial subsector.Table 3 presents monthly real earnings trends for manufacturing, commerce,construction, finance, personal services and transportation industries./1These same trends are illustrated in Figure II.
/1 The Monthly Wage Survey includes mining and electricity as two addi-tional major classifications. Given their relatively low levels ofemployment, in 1981 they represented 2.5% and n.n% of total private formalemployment, and for brevity's sake, they have not been included inTable 3. Note also that construction with 83,724 workers, representinga 3.2% employment share in lql, is also a relatively small sector, butits earnings volatility makes it an interesting special case. Lastly,far more detailed earnings series, down to the 5-digit SITC level, canbe constructed within manufacturing industries. For present purposesthis seemed unnecessary.
13 -
Figure 1: Monthly Real Earnings by Economic Sector(in thousond won)
140 1 '
128 /
9~~~~~~~~n 188 /~~~~~,/ /
88 |e ,/. / , S
0 /
40 *r -i" -je / --Commerce. af $ E} iD~~~~~~Construct ion68 -- Finance, etc.
-- Personal Services
28 ._ 11 -r--- r *- -Transporl, etc.
1970 1972 1974 1976 1978 1980 1982
Year
- 14 -
Table 3: MONTHLY REAL EARNINGCS BY ECONOMIC SECTOR(in '000 1975 won)
Manufactur- Finance, Personal Transport,Year ing Commerce Construction etc. Services etc.
The data suggest considerable stability in the ranking of inter-industry earnings over time with only the construction sector showing signi-ficant relative wage changes./I The stability of the interindustry earningsstructure is maintained over a period of rapid real wage growth in allsectors. These events are consistent with results from other nations, whereinterindustry wage rankings are found to be similarly stable over time.Furthermore, the relatively inferior earnings level in manufacturing and
/1 The construction sector in Korea, as is likely to be the case in nationssuch as Pakistan and the Philippines, underwent a dramatic change duringthe 1970's due to opportunities in the Persian Gulf. Construction, inessence, historically a nontradeable became a tradeable, and one whichsuffers from considerable exposure to worldwide business conditions.The volatility of construction wages are a reflection of these circum-stances. What is also blurred by the formal economy statistics is theexistence of a large, small-scale domestic construction sector which islikely to be significantly less well paid than is its formal sectorcounterpart. This is not surprising since the two sectors may actuallybe thought of as producing different outputs.
_ 15 -
moderate level for construction are similar to the earnings structures ofmany countries, including Japan, Hong Kong, Singapore and the TI.S./1
In addition to reinforcing earlier evidence on the similarity ofreal wage trends throughout: the formal economy, the disaggregated inter-industry earnings data pernit some evaluation of market efficiency. Tindercertain assumptions, the change in relative dispersion of the interindustrydimension of the wage structure can be used as a test of market behavior.A narrowing of earnings dispersion is consistent, for example, with compe-titive conditions. As firnms compete for workers and workers compete forjobs, differentials strictly associated with sector of employment shoulddiminish. Analagously, an effective government wage policy aimed at, say,the distributional objective of compressing wage differences could generatethe same observeable outcome. Of course, in either instance, other forceswill effect the dispersion of interindustry earnings. Changing skill mixesand differential growth rates between industries can cause either greatervariance or compression in the wage structure irrespective of either compe-titive or institutional pressures., For this reason, the simple trend ininterindustry earnings dispersion is far from a definitive measure of marketbehavior.
In Table 4 a summary measure of relative dispersion, the coeffi-cient of variation, equaling the standard deviation divided by the mean, ofmonthly earnings for the eight ma:Jor industrial subsectors /2 is presentedfor the years 1970-81. In the early 1970's no discernable trend is evident,but after 1975 a steady contraction in interindustry earnings differences isapparent. Although this contraction extends one year beyond the high growthperiod 1976-1979, the results suggest a correlation between growing labordemand and wage competition. During this period it is difficult to identifya dominant institutional force which could account for so noticeable acompression in the interindustry wrage structure. Competition between firmsin different sectors for scarce workers does emerge as a likely explanationfor the observed trend./3
/3 Evidence on the mobility of Korean workers lends additional support tothe interpretation. Ba:L (1977), using sample survey date on 1,115workers, found that 54.2% of the sample had changed jobs at least once.Other evidence, cited below in the discussion of permanent employment,also supports the view that worker mobility between firms exists. Suchmobility is a necessary condition for a competitive explanation of theobserved compression in the interindustry earnings structure.
/a Coefficient of variation equals the stand-ard deviation divided by the mean of month-ly earnings for 8 industrial subsectors.
The lack of systematic narrowing of earnings differentials in theearly 1970's and the reversal of trend in 1Q81 may suggest that during rela-tively slack periods wage competition between workers is not an effectivemechanism for reducing interindustry wage differences. Wage setting duringthese periods may be relatively more responsive to firm and worker specificsituations than to competitive forces.
A final issue which the interindustry earnings series can be usedto address, concerns the pattern of wage setting and its potential role as asource of wage push in domestic price inflation. The relationship betweenannual nominal wage increases in one industry or sector and how they "spill-over" into other industries and sectors has been raised in both the microand macroeconomic literature. In the O.E.C.D. nations the notion of wagerounds or pattern bargaining, argues that wage outcomes in certain keyindustries or large firms form the basis for wage determination elsewherein the economy. On a behavioral plane, the objective of workers, at leastimplicitly, is to maintain relative earnings. When applied to developingnations, this concept has been referred to as "wage leadership," where thewage leader is usually the public sector, a major trade union or multi-national enterprise. Whatever label is attached to the theory, the basicnotion remains the same--institutional forces empower workers in the wage-following sectors to raise their compensation above what purely market
- 17 -
forces would produce. The system biecomes a de facto version of an admin-istered price of labor. If the wagie leadership model holds up, the entireprotected sector realizes wage gains above what productivity criteria mightdictate and a wage-price spiral may follow.
Although this theory has Ibeen voiced since the 1950's when majorU.S. industrial collective bargaining settlements, in such industries asautomobiles and steel, were seen as setting off wage rounds affecting otherindustries, the theory has not been rigorously tested at either a micro-economic or macroeconomic level. Conditions for when wage leadership exists,or for when a pattern of interindus try wage settlements reflects wageleadership, are not well defined. (;iven the limitations of the receivedtheory, it is difficult to assess the role selected sectors in the Voreaneconomy may have played in influencing wage levels throughout the formaleconomy.
The existence of neither a strong union movement, nor of rigidgovernment wage guidelines, nor of a dominant foreign enterprise sector makesthe Korean labor market an unlikely candidate for wage leadership to apply.Nonetheless the benchmark or reference wage effect of certain settlementsmay be significant. For example, government wage increases are determinedannually and are publicized, and may exert a guideline effect on wagesetting elsewhere in the formal economy. To explore this possibility andsince wage leadership refers to nomLnal events, Table 5 presents the averageannual percentage increase in earnings for manufacturing, nonmanufacturingand the government./1 The government figure is not the realized averageincrease, rather it is a statement of the government's wage target and doesnot take into consideration promotions or any changes in the skill mix ofpublic employment. As such, the target as an estimate of average publicsector wage increases is likely to be biased downward relative to thepercentages reported for the private formal economy.
/1 Recall that in 1981 government employed almost 900,000 workers repre-senting 18% of total public plus private formal economy employment. Itspotential influence, based on sLze alone, could be considerable. If onebreaks down public employment by skill classes it is likely that thegovernment employs even larger percentages of higher level skills andis, therefore, even more influential in these submarkets.
_18
Table 5: AVERAGE ANNUAL PERCENTAGE INCREASES IN TOTAL EARNING.S
If one considers the data of Table 5 or the accompanying graph,Figure III, no obvious pattern of correlation describes the interaction ofpublic and private earnings. Public sector increases steadily rose through-out the early 1970's, leveled off during 1977-1980 and fell in 1981. (Notethat this decline is scheduled to continue for at least another year. Theannounced 1982 target is an average Q% increase.) From 1Q72 through 1976the public sector, in an attempt to "catch-up" to compensation levels pre-vailing elsewhere, rapidly increased civil servant salaries. During thehigh growth years, 1976-1979, public sector increases started to lag behindthe private economy. Since the downturn in economic activity, lower publicsector salary increases have been mandated due to both fiscal pressures andthe government's desire to set an example as part of an "implicit" wageguideline policy.
The data do not readily support the view that the government hasbeen a wage leader. The correspondence of same year wage increases betweensectors is low and no obvious lag pattern emerges upon inspecting the trends.This does not deny that increases granted by the government are going toserve as a signal elsewhere in the economy. However other forces, includingmarket pressures, appear likely to heavily influence private wage settle-ments. If wage push explanations are at the root of the Korean price infla-tion of the late 70s, an alternative to public sector wage leadership asthe causal mechanism must be found.
- 19 - .
Figure IU: Average Annual Percentage Increasesin Total Earnings
70
Manufactringp 60 Non-Manuacturinge Go46vernmentr
50e fl
198 /9411 9818
e IiY
a
e /A2 .
e ~ ~
1972 1974 1976 1978 1980
Yeor
- 20 -.
A summary of the empirical findings on the interindustry earningsstructure follows:
(a) Similar real earnings trends across economic subsectors from1970-1981;
(b) Stability in the ranking of interindustry earnings coupled withsecular compression in the structure, especially during the late1970s; and
(c) Lack of simple correspondence between public and private wageincreases throughout the 1970s.
These findings suggest some responsiveness of industry earnings tomacroeconomic events and the potential allocative efficiency of the wagesetting system. Furthermore, the role of public sector pay determinationis, at best, an influence on private wage setting but does not appear tohave acted as a binding wage guideline.
C. "Demographic" Dimensions of the Wage Structure
An account of the interindustry earnings structure provides a use-ful starting point for evaluating the trends and their implications in theformal economy wage structure. However, the interindustry dimensions pro-vides a restricted view of wage dynamics because its boundaries are somewhatarbitrary. Afterall, we do not believe that specific labor markets aredefined by industrial classifications. The mobility of Korean workers andthe absence of industry unions supports this view. By focusing on personalcharacteristics of workers, such as sex, education and experience, it ispossible to identify specific labor markets which are more clearly deli-neated. By analyzing the movements in wage differentials between suchgroups, the allocative properties of the labor market can be furtherassessed. The response of the labor market to the relative scarcity ofdifferent types of labor should reflect the market signaling properties ofwage outcomes.
Relative to other economies, there are few obvious categories ofnoncompeting groups within the Korean labor market. Neither ethnic norregional differences produce significant segmentation. Men and women,however, may represent noncompeting groups both in terms of earningsdetermination and educational and occupational opportunities. The tendencyfor women to leave the work force at marriage plus characteristics of Koreansociology warrant separate treatment of male and female labor market experi-ence. Wherever possible in our analysis of the wage structure we will dis-tinguish workers according to their sex.
- 21 -
Sex Differentials
We proceed by examining the trend in relative wages between menand women. The relevant nominal earnings data appear in the Annex.1 ITable 6 below presents the derived male/female wage ratios for specificeducation cohorts.
Table 6- MALE/FEMALE EARNINGS RATIO BY EDUCATION (1971-1981)
Educational AttainmentCollege &
Year All Workers University /a High School Middle & Primary
mean 2.26 1.60 1.67 1.92(s.d.) (.114) (.195) (.122) (0.87)
/a Includes Junior College, College and University Graduates.
Source: See Annex Table A2.
/1 These data were obtained from the ten year collection, 1971-81, of pub-lished results from the Occupational Wage Survey. (The first survey wasundertaken in 1970 but these ;results are so out-of-line with laterfigures that they were not included in this analysis.) Both the Occupa-tional and Monthly Wage Surveys rely on almost identical samples ofestablishments. Major revisions in the list of establishments fromwhich this sample was drawn were undertaken in 1973, 1976 and 1980. Asa result some discontinuous "leaps" can be expected surrounding theseyears. However, it is expected that employment rather than earningsdata were more affected by these sampling changes. For the Monthly WageSurvey, an ex-post smoothing of data trends was undertaken, therefore,previous results cited from the MWS, all of which rely on only thelatest publication of that survey, are not as seriously affected by thesampling change as may be the OWS results.
22
Male earnings in the private formal economy averaged 2.26 timesfemale earnings from 1971-81./l Furthermore, this differential shows nosecular trend over the 11 year period. Not even during the high growth peri-od, 1976-79, was there a particularly distinct pattern of change. This is asomewhat surprising result, since the considerable demand pressures of thoseyears, reflected in rapidly growing real wages, might have been expected tolower prevailing differentials as firms substituted lower priced femaleworkers for relatively more expensive male labor.
To further test this substitution hypothesis a more disaggregatedview of the male/female wage structure is of value. After all, during theentire 11 year period, significant changes in the skill mix of industrialemployment occurred. Therefore, the aggregate trend in the male/femaleearnings ratio may mask the true direction of relative wage adjustments.OWS estimates indicate that the Korean labor force was becoming more femaleand more education intensive during the 1970s. In the 11 years underconsideration women increased their share of industrial employment from31.9% to 38.5%./2 Among all workers, those with more than middle schooleducation grew from 34.8% of total formal employment in 1971 to 43.8% in1981. Educated women, those with more than middle school, increased theirshare of total female employment from 17.5% to 28.5% during this periodwhile the corresponding figures for educated men were 43.0% and 53.5% res-pectively. These changes in the education/sex mix of industrial employmentlegitimate the need for a more disaggregated inspection of the sex dimensionof the wage structure.
In Table 6, male/female earnings ratios by level of educationalattainment indicate that, on average sex differentials decline as educationlevel rises. Looking within education groups, over the entire period forcollege and high school graduates the premium accruing to men shows agradual increase. In all cases the high growth years are associated withwidening sex differentials and only for the most educated have thesedifferences narrowed appreciably during the recent, post-1979, economicslump.
Since education is only one attribute which contributes to workerproductivity, it would be incorrect to assume that all skill differencesbetween the sexes have been captured by the education disaggregation. Jobexperience in particular is vastly different for men and women due to sex
/1 By way of comparison, in Japan in 1955 the male/female earnings differ-ential equaled 2.25. By 1965 it had fallen to 2.09 and by 1975 to 1.79.(Source: Cook and Ylayashi (1980) ).
/2 By way of comparison, the corresponding percentages of female employmentin Japan's industrial sector are 28.7% (1960), 3103% (1970) and 31.2%(1978). (Source: Cook and Hayashi (1980)).
23 -
related patterns of labor force participation. Nonetheless, the resultssuggest that wage competition between men and women was not strong enoughto compress earnings disparities. It should also be noted that during periodsof peak demand, male earnings growth outpaced female pay increases, whilefemale employment grew at a faster rate than did the increase in jobsfilled by men. By implication, the elasticity of labor supply is greaterfor women than for men, a not uncommon result.
The inability of the female labor market, with its lower reser-vation wages, to dampen male wage increases for even the lowest educationgroups suggests a low elasticity of substitution of women for men which mayproduce allocative inefficiencies. Since the Korean labor market exhibitsboth industrial and occupat:ional segmentation by sex -- there are, in essence,male industries and female industries, male occupations and femaleoccupations -- it may be the case that Korean institutions and not marketforces may limit the role t:hat women, as a significant percentage of theworking age population, can contribute to the growth process. By not morefully integrating women into the formal labor market -- either by removingsex related job barriers or by offering better wages as incentives -- Koreamay maintain an industrial cost structure containing distortions which couldbe removed. Although the entire fabric of Korean culture and society iswoven into this problem, government initiatives within, say, greater equalityof opportunities in public employnent or through other policy directivescould augment the efficiency of the industrial labor market. Tne redis-tributive impact of such policies might also be considered beneficial.
Education Differentials
In an efficiently operating labor market various forces will actto either expand or contract the educational wage structure. The relativescarcity of different types of workers should determine relative wagemovements. On the supply side, lagged population growth and the capacityof the schooling system are likely to be key determinants. On the demandside, differential rates of indust:rial expansion and ease of substitutionbetween education groups will influence wage outcomes.
Korean macroeconomic trends are consistent with an increasingdemand for labor throughout the 1970so The 1980s have been associated withfar slower expansion, if not negat:ive employment growth. On the supplyside, stocks of educated workers grew over the entire time period withcollege trained and high school graduates becoming increasingly lessscarce. By 1982, concern over the unemployment of educated youth was beingvoiced. This represents a significant reversal from the late 1970s whenfirms complained about the difficulty of finding trained labor.
With these trends in mind, we turn to the available data whichpermit calculation of earnings ratios between the following groups: collegeand university; junior college; high school; and, middle plus primary schoolgraduates. The data, reported in Table 7, suggest a nmber of trends. For
_ 24 -
both men and women, the largest of the three differntials is College/HighSchool, averaging to an 88% and 93% premium for College educated men andwomen respectively./l If productivity factors are responsible for theseearnings ratios, then it can be concluded that post-secondary schooleducation has been the most productivity augmenting form of education overthe last decade. If institutional explanations, such as credentialism,account for at least some of the observed differentials then a strictproductivity explanation needs to be modified.
Table 7: EARNINGS RATIOS FOR MEN AND WOMEN BY EDUCATION (1971-1981)
Men WomenCollege//a High College//a Highjunior College//b school/ junior College//b school/
Year college high school middle /c college high school middle /c
/a College and university graduates./b Junior college, college and university graduates./c Middle and Primary School Graduates.
Source: See Annex Tables Al and A2.
The trend in education differentials for men suggests the following.From 1971-1978 the High School/Middle School ratio remained relativelyconstant. After 1978, steady declines in the ratio are consistent with the
/1 Park (1981) arrived at a similar conclusion based on cross-sectionestimation of human capital earnings functions. For both the men andwomen in his 1976 sample survey, the economic return to College andUniversity education was incrementally higher than for any otherlevel of completed schooling.
25 --
declining scarcity of High School graduates as Korea approached universalsecondary education. Additionally, the unskilled nature of many of Korea'sindustrial jobs suggests that a high degree of substitution should existbetween these two education group. The College/High School ratio shows amarkedly different pattern. Widening differentials generally characterizethe years 1971-1977, followed by 2 years of constant relative earnings andthen 2 years of a declining earnings ratio. The increasing demand foreducated workers in the early 197Os met with scarcities in the availablestocks of such workers. By the latte 70s, however, supplies had increasedand the stability of the College/High School differential during the post-1975boom argues for a significant turnaround in the relative scarcity ofcollege educated men. The decline in their relative earnings since 1979further supports this view. The College/Junior College trend is quitestable, varying little more than a percent or two since 1975. The stabilityof the differential suggests that the substitutability of these workers aswell as the relative growth in their demand and supply have remainedessentially constant.
In the female labor market, Migh School/Middle School differentialseroded even more quickly than did the male trend. As with the men, thefact that the trend exhibits no cyclical behavior may indicate thatrelative scarcities of these types of labor progressively diminished. Theexperience of college educated women exhibits no generalizeable patternsuggesting that the wage dynamics of this labor submarket are morecomplicated, and, perhaps, far more institutionally affected, than they arefor their male counterparts. Given the relatively small percentage thatcollege educated women represent out of total formal employment, theefficiency implications of these wage trends are not likely to be of majorsignificance. The College/Junior College trend also shows rather erraticmovements which do not lend t:hemselves to any straight forwardinterpretation.
For major employment categories, the lower levels of educationalattainment for men and women, and fDr higher educated men, earningsdifferentials appear to track relative scarcities. The role ofinstitutional forces, be they the results of internal wage structures orgovernment wage policy, may also account for the observed trends. However,the dynamic adjustments which have been documented suggests that ifinstitutional forces are a major determinant of these wage trends, theninstitutions must have flexible objectives. If not, greater wage rigiditieswould be expected. If institutionaL forces exhibit such flexibility thenthe distinction between institutions and market behavior
- 26 -
becomes blurred. For these reasons a market oriented system of wage deter-mination appears as a reasonable description for most of the educationdimension of the Korean labor market./l
The long run as well as cyclical pattern of earnings differentialsby education serve as a useful backdrop for assessing recent changes in theGovernment's implicit system of wage guidelines. For the last few yearsthe Government has suggested that firms compress internal wage structures.This policy, oriented toward distributional objectives, might be consideredto have been achieved based on the evidence assembled in Table 7. However,the initial narrowing of education differentials predates the Government'sstated commitment to this objective and argues that market forces may-beprimarily responsible. At a minimum, market forces and Government policiesappear to be working in tandem. In the future, the Government should bewary of imposing wage guidelines which act to further accelerate thecompression of the wage structure. Although laudable on equity grounds,such policies may produce improper market signals, encouraging firms tosubstitute educated (i.e., relatively less expensive) for uneducated (i.e.,relatively more expensive) workers. Such disemployment effects, if theyoccur, would run counter to the initial distributional objectives of thestated policy.
The contribution public policy versus market forces has made torecent trends is something that even sophisticated wage analysis would beunable to accurately separate. What can be concluded is that the forces oflabor supply and demand have exerted a significant impact on the rewardsthat education returns to those in the labor force. In the most recentperiod these rewards have been falling, suggesting slack in the labormarket for educated workers, a situation distinct from conditions of thelate 1970s.
/1 One other potentially important institutional factor should also beraised. As has been argued in other nations, a system of jobfiltering may occur whereby education becomes a necessary, althoughon productivity grounds unwarranted, criteria for employment. Undersuch a system, observed wage differentials by education erode, becausethe average wage of the educated falls as workers with education startaccepting lower paid positions. Such outcomes may be consistent withefficient wage determination but reflect considerable inefficienciesin the use of resources devoted to education. The social costs ofeducation under this scenario diverge from the private returns. Lackingany evidence, we cannot even speculate on the presence or extent of jobfiltering in the Korean labor market.
- 27 -
Experience Differentials
In addition to education, job experience is a prime determinantof individual earnings. As workers accumulate more experience theirearnings tend to rise, although this increase usually occurs at a decreasingrate. The productivity explanation of this trend is straightforward.Learning-by-doing increases the quantity and quality of output a workerproduces and employers reward this higher productivity with a higher levelof compensation. Human capital theory enriches this explanation byinterpreting the time and resources devoted to on-the-job training asinvestments which bear a positive return at some later date. An earningsexperience profile can then be derived which exhibits properties which aregenerally substantiated by empirical information. The human capital theory,with its distinction between specific and general human capital, also leadsto additional hypothesis concerning the relative shapes of earningsexperience profiles for various education and occupation cohorts. Lastly,the institution of seniority systenms, which may not mesh with productivitytrends, can also account for the observed relationship between annualearnings and a worker's years of job or career experience.
In Korea, experience is certainly rewarded. The OWS reportsearnings by years of career experience by occupation. Note that such datado not pertain to any one individual. Therefore, in addition to the usualbias inherent in cross-section studies, if workers change occupations,their own earnings profiles will differ from those generated by thisaggregate analysis. Based oln the OWS data, the accompanying Figurepresents, for 1980, the earnings experience profiles for six, relativelywell-defined occupations. For each profile 4 data points are available:mean earnings for less than 1 year of experience, 1 - 4 years, 5 - 9 yearsand 10 or more years./l Every occupation exhibits earnings as an increasingfunction of experience. A flattening of the profile, consistent with theaccepted semi-logarithmic specification of earnings as a function ofexperience and experience squared, is not apparent, perhaps due to thelimited amount of information available. Given the youthful nature of theKorean industrial labor force, even the greater than 10 years of experiencecategory will not contain sufficient numbers of older employees to force thecohort average to decline from its earlier trend.
The relative slopes of the profiles are somewhat consistent withexpectations, since they appear to vary positively with the level ofearnings in a given occupation. This may suggest either (or both) agreater tendency or greater opportunities to invest in productivity
/1 In Figure IV, earnings were plotted at the midpoint of the first threeexperience intervals: 0.5, 2.5 and 7 years. For the open-endedcategory, earnings were plotted at 15 years of experience.
- 28 -
Expwience Earnings Profiles By Occpaton (198)(FIGURE IV)
Tho 258
d 1200 < , , t ~ - ForerU
o //St - ~~~~~~~~noroduc so
#"~~~ - $irs
a 2 4 6 8 10 8 2 14 16 18 20
Years of Exp izene
c 29 -
augmenting human capital at more sophisticated occupations. Note that theproduction supervisor and general foreman category is not consistent withthis trend.
With these profiles as background, the responsiveness of earningsto experience due to macroeconomic events can be considered. For the sixoccupations depicted in the preceding Figure, Table 8 provides estimatesof how the returns to experience have varied over time. For eachoccupation, the ratio of earnings; in the <1, 1 - 4 and 5 - 9 experienceintervals to earnings in the >10 interval is presented for 1975, '78 and'80. Focussing only on the experience of new entrants, there is evidence ofgeneral tightening (e.g., spinners, etc.), widening (e.g., engineers, etc.)and variability (e.g., production, etc.) in experience differentials overtime. Based only on this sample no single trend is apparent, suggesting thatvarying market and institutional conditions affect each occupational labormarket.
This lack of a consistent trend is somewhat surprising, especiallyfor 1978. Given the strength of labor demand in that year, it might havebeen expected that experienced workers would have emerged as especiallyscarce. A widening of differentials should have then emerged. Although wecannot account for why this did not occur, we can consider one possibleexplanation. If internal wage structures rather than market forces dominateoccupational wage determination, then rigidities in the changing of relativewages may operate. Although quantitative standards for when wage rigidityis in evidence are not available, the data of Table 8 show large relativewage changes over only 2- and 3-year intervals, i.e., compare, say, 1975 to1978 earnings experience ratios for any given occupation. Such evidencedoes not appear consistent with internal wage structures as the explanationof the trend in experience differentials over the business cycle./I
/1 Note that this is not a good test for the existence of internal wagestructures since the data are not firm specific. Inter- as well asintra-firm changes plus differences due to occupational mobility willcontribute to the observed variance in earnings by experience.
- 30 -
Table 8- EARNINGS EXPERIENCE RATIOS BY SELECTEDOCCUPATIONS FOR SELECTED YEARS /a
/a The earnings ratio compare earnings of each experience level to earningsin the > 10 years of experience category.
_ 31 -
D. The Earnings Structure According to Characteristics of the Firm
Earnings Differentials by Size of: Firm
In a competitive labor market, characteristics of the firm suchas size or type of ownership should not affect the compensation received byworkers, assuming that these workers are identical in all other respects.This competitive condition is rarely met and the existence and persistenceof wage differentials by firm size is one of the most robust results ofwage structure analyses undertaken in both developed and developing nations.Explanations for this differential vary. Competitive theorists argue thatboth training and hiring costs produce the differential while bargainingtheorists cite the consequences of some form of bilateral monopoly. Duallabor market theories often point to firm size as a critical boundarysegmenting primary and secondary labor markets.
Turning to the Korean data, the evidence reported in Table 9,conforms with results from other nations. For almost every year averageearnings in manufacturing monotonically increase with firm size. However,since these data are not standardized by skill mix - that is, they do notpertain to identical workers - some of the observed differentials will bedue to the presumed increasing skill intensity of larger establishments./I
Given our interest in the efficiency of the Korean labor market,the trend in wage differentials by firm size is of more value than theintra-year findings. The last column of Table 9 illustrates thecompression in the earnings structure by firm size. Again, relying on thecoefficient of variation as an index of relative dispersion, note that from1970-1980 inter-firm size differentials declined. The trend has almostmonotonically narrowed with relat:ive dispersion falling by 66% over thedecade. Cyclical responses, which have been evident in some of the otherdimensions of the wage structure, are not readily apparent in this instance.At best, peak growth years have accelerated the rate of compression in firmsize wage differentials; at worst., these years have not deviated from thelonger run trend.
/1 If one estimates an interindustry earnings function for a given year,where industry earnings are regressed on capital and skill intensityas well as firm size, firm size, ceterus paribus, is significant andpositively related to earnings. See Lindauer (1979).
/a Includes 200-499./b Equals the standard deviation of earnings by firm size divided by the mean.
Source: Major Statistics of Small and Medium Industries, derived from Miningand Manufacturing Surveys.
- 33 -
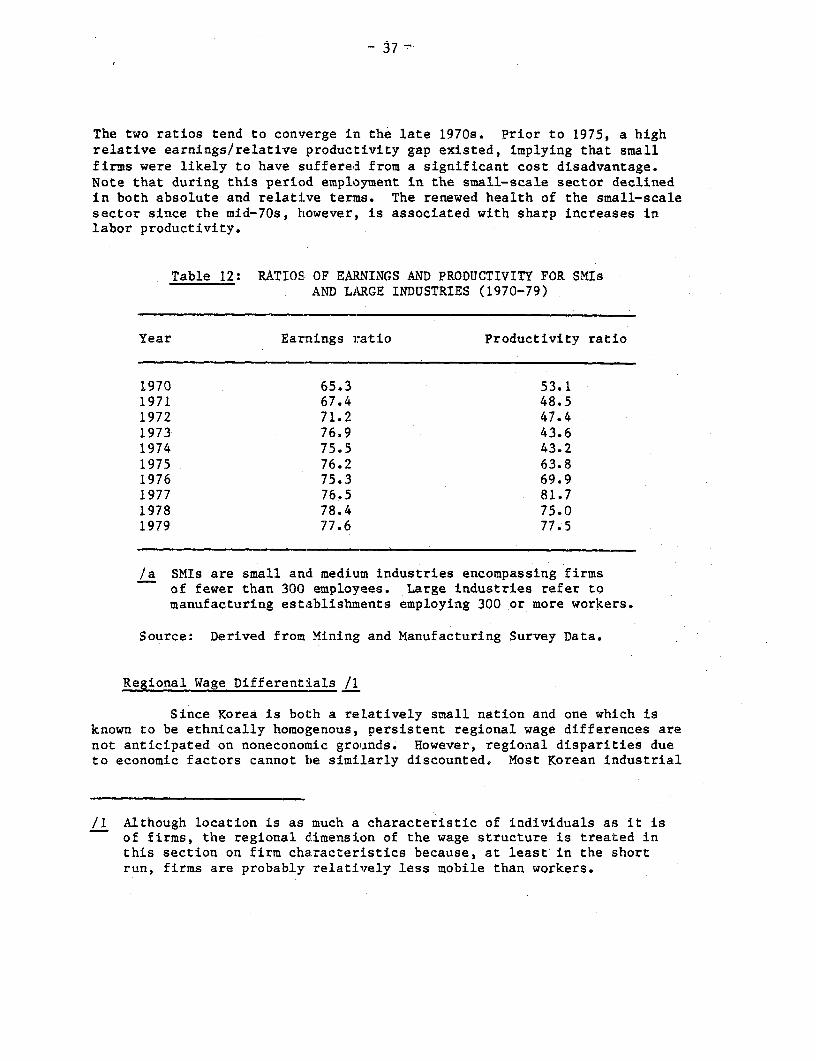
The two ratios tend to converge in the late 1070s. Prior to 1975, a highrelative earnings/relative productivity gap existed, implying that smallfirms were likely to have suffered from a significant cost disadvantage.Note that during this period employment in the small-scale sector declinedin both absolute and relative terms. The renewed health of the small-scalesector since the mid-70s, however, is associated with sharp increases inlabor productivity.
Table 12: RATIOS OF EARNINGS AND PRODUCTIVITY FOR SMIsAND LARGE INDUJSTRIES (1970-79)
/a SMIs are small and medium industries encompassing firmsof fewer than 300 employees. Large industries refer tomanufacturing establishments employing 300 or more workers.
Source: Derived from Mining and Manufacturing Survey Data.
Regional Wage Differentials /1
Since Korea is both a relatively small nation and one which isknown to be ethnically homogenous, persistent regional wage differences arenot anticipated on noneconomic grounds. However, regional disparities dueto economic factors cannot be similarly discounted. Most Korean industrial
/1 Although location is as much a characteristic of individuals as it isof firms, the regional dimension of the wage structure is treated inthis section on firm characteristics because, at least in the shortrun, firms are probably relatively less mobile than workers.
_ 34 -
In analyzing the movement of these wage changes, it is worthrepeating that firm size differentials embody differences attributable toskill mix. Whereas this poses a problem for interpreting cross-sectiondifferences, for analyzing time trends, nonstandardization by skill mixprobably biases the results in a conservative direction. For differencesin the skill mix to account for the secular compression in relativedispersion, small firms would have to become increasingly skill intensiverelative to large firms. Although the data are not readily available torefute this hypothesis, knowledge of Korean development during the 1970ssuggests that such an outcome is improbable.
A more disaggregated view of the time trend in wage differentialsby firm size is provided by Park Fun-Koo (1981). IJsing OWS data, Parkdemonstrates that throughout the 1970s, wage differentials by firm sizewere reduced for both men and women, and for both production and adminis-trative personnel. Park's results are reproduced as Table 1 below. Theinter-skill mix dimension of Park's work suggests that for any given yearwhite collar occupations experience the greatest differential by firm size.This result is expected since the level of skill and responsibility requiredof administrative workers increases with firm size.
_ 35 -
Table 10: EARNINGS BY FIRM SIZE BY SEX AND OCCTJPATION, SELECTED YEARS
The empirical findings presented above indicate that differentialsby firm size have eroded over time. These results are consistent with amarket environment in which firms are forced to compete for workers. As anadditional question it would be useful to know what impact this wage com-petition has had on small firms. Has labor market efficiency been achievedat the price of losing the small-scale sector?
In Table 11 the number of workers and their relative share oftotal manufacturing employment by firm size are presented for selectedyears. From 1971 to 1975 employment in the smallest firms (5-19) fell inboth absolute and relative terms. Given that this was a period of totalemployment growth, the decline is even more substantial. If the small-scalesector is more broadly defined to include employment in all firms with
_ 36 _
fewer than 200 employees, 1971-75 remains a period of declining employmentwhile post-1975 experience shows considerable growth in absolute employmentlevels and some increase in relative shares. What these results imply isthat wage competition during the latter 1970s did not crowd out smallerestablishments. In an indirect way this supports an aspect of theefficient labor market hypothesis. If institutional arrangements forcedsmall firms to accept the high wages of large scale establishment, then thecontinued demise of the small-scale sector would be expected. After all,the competitiveness of their product markets would leave little room forpaying excessive wages. The viability of the small enterprise sector,therefore, argues against this interpretation.
Table il: DISTRIBUTION OF EMPLOYMENT BY FIRM SIZEFOR SELECTED YEARS
Number of employeesYear 5-19 20-49 50-99 1oo-199 >200
In order to maintain a market interpretation of the erosion ofearnings differences by firm size, productivity differentials should becorrelated with earnings differentials. If small firms had only experiencedrelative wage growth without complementary productivity growth then thedemise of the small-scale sector would again be predicted. For two firmsize categories - small and medium industries (SMIs) with employment of lessthan 300, and large industries employing more than 300 - Table 12 presentsthe ratios of earnings and productivity measures over the 1970s.
37 -7
The two ratios tend to converge in the late 1970s. Prior to 1975, a highrelative earnings/relative productivity gap existed, implying that smallfirms were likely to have suffered from a significant cost disadvantage.Note that during this period employment in the small-scale sector declinedin both absolute and relative terms. The renewed health of the small-scalesector since the mid-70s, however, is associated with sharp increases inlabor productivity.
Table 12: RATIOS OF EASNINGS AND PRODUCTIVITY FOR SMIsAND LARGE INDUSTRIES (1970-79)
/a SMIs are small and medium industries encompassing firmsof fewer than 300 employees. Large industries refer tomanufacturing establishments employing 300 or more workers.
Source: Derived from Mining and Manufacturing Survey Data.
Regional Wage Differentials /1
Since Korea is both a relatively small nation and one which isknown to be ethnically homogenous, persistent regional wage differences arenot anticipated on noneconomic grounds. However, regional disparities dueto economic factors cannot be similarly discounted. Most Korean industrial
/1 Although location is as much a characteristic of individuals as it isof firms, the regional dimension of the wage structure is treated inthis section on firm character:Lstics because, at least in the shortrun, firms are probably relatively less mobile than workers.
38 -
activity is concentrated in the Seoul or Busan vicinity. In 1980, 71% ofall manufacturing employment was situated within these two cities and theirsurrounding provinces. Therefore, it might be expected that labor marketcircumstances and wage outcomes could vary across regions.
Compression in the regional wage structure can be construed asanother test of labor market efficiency. A secular tendency toward thenarrowing of regional wage differences is expected if competitive forcesoperate. Workers seeking better wages and firms attempting to minimizecosts would be expected to help arbitrage regional wages.
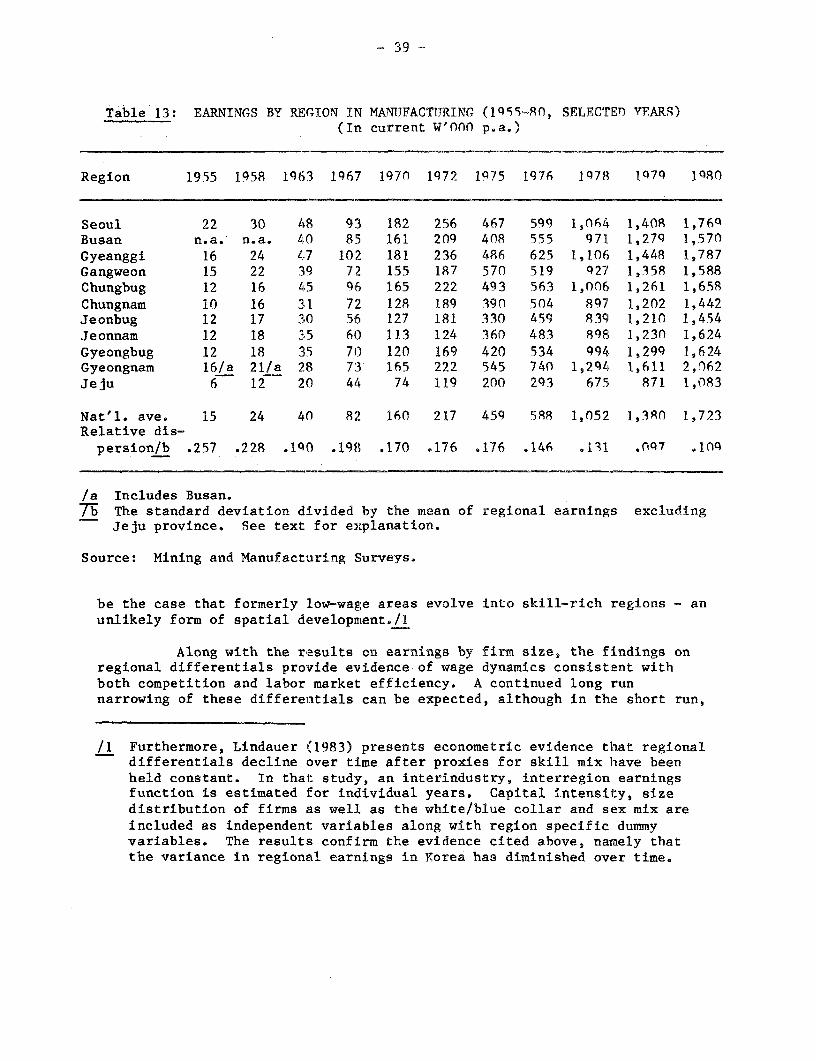
The only data available to test this hypothesis come from theMining and Manufacturing surveys. Average annual remuneration for allworkers, and for production and administrative personnel separately, arestratified according to 11 regional classifications and by 9 manufacturingsubsectors. As Table 13 illustrates, significant nominal regionalearnings differential have existed since 1955./I Furthermore, shifting inthe rank ordering of regional earnings has occurred with Seoul not alwaysin the wage leading position.
The market efficiency hypothesis predicts secular narrowing inregional wage differentials. Choosing the coefficient of variation as anindex of earnings dispersion, the bottom line of Table 13 illustrates thesignificant compression in regional earnings which has occurred throughoutthe recorded period. The actual measure of dispersion employed in thisanalysis is based on Korea's two "special" cities, Seoul and Busan, and on 8of its 9 provinces. Jeju, a small island off the Korean coast accountingfor less than 0.5% of 1980 employment in manufacturing, was excluded fromthe computations. As an extreme outlier it would otherwise generatesignificant distortions in the variance measure.
The univariate analysis of regional wage dynamics just offereddoes not, of course, account for the impact of changing regional skillmixes. However, if the observed compression is to be explained bydifferential rates of changing skill intensity across regions, then it must
/1 Nominal earnings are used because regional price indices are notavailable to deflate each year to the same base. Cost-of-livingdifferences will, therefore, account for some, but unlikely for all,of the observed regional variance in earnings.
- 39 -
Table 13: EARNINGS BY REGION IN MANUFACTUJRING (1559-80, SELECTED YEARS)(In current W'nno p.a.)
/a Includes Busan.7b The standard deviation divided by the mean of regional earnings excluding
Jeju province. See text for explanation.
Source: Mining and Manufacturing 'Surveys.
be the case that formerly low-wage areas evolve into skill-rich regions - anunlikely form of spatial development./I
Along with the results on earnings by firm size, the findings onregional differentials provide evidence of wage dynamics consistent withboth competition and labor market efficiency. A continued long runnarrowing of these differentials can be expected, although in the short run,
/1 Furthermore, Lindauer (1983) presents econometric evidence that regionaldifferentials decline over time after proxies for skill mix have beenheld constant. In thai: study, an interindustry, interregion earningsfunction is estimated for individual years. Capital intensity, sizedistribution of firms as well as the white/blue collar and sex mix areincluded as independent variables along with region specific dummyvariables. The results confirm the evidence cited above, namely thatthe variance in regional earnings in Korea has diminished over time.
- 40 -
based on evidence for 1980, a small widening may occur as competitionbetween firms for workers diminishes. It appears that competition betweenworkers for jobs does not produce the same type of wage adjustments as doescompetition between firms for workers. In periods of slack labor demand,some firms, having the capacity to do so, may attempt to "hoard" experiencedworkers in anticipation of a cyclical upswing. Widening earningsdifferentials across a number of dimensions of the wage structure in 1980,may reflect such practices. However, it should be emphasized, based on pastexperience, that such deviations from the long run trend tend to be bothsmall and short-lived.
Public/Private Sector Wage Differentials
A comparison of public and private compensation has already beenencountered in the earlier discussion of interindustry wage trends. It wasnoted that public and private sector wage increases were not wellcorrelated over the 1970s. In this section a cross-sectional view will beadopted. Of interest is whether a wedge exists between the pay received bypublic versus private employees in similar occupations. If such wedges doexist, then an inefficiency in the labor market may result. If, forexample, civil servants earn less than private sector counterparts, jobturnover and low levels of job performance may characterize publicemployment. Alternatively, if the wage premium accrues to the publicemployee then job queuing, nepotism and other inefficiencies associatedwith "rent seeking" /1 activities may proliferate.
Wage comparisons for one year, let alone over time, for publicand private employees are not readily available for most nations. Thepresumed wage taker position of public authorities has perhaps minimizedthe amount of empirical research in this area. In the Yorean case, neitherthe MWS nor OWS include government agencies in their sampling frames,therefore, no comparisons can be made based on a unified data source.
What is available is a study by Park Se-Il (1981b) which relies onOWS for data for the private sector and published civil service salaryscales for the public sector. For different occupations (e.g. startingmanager in a large firm versus 1980 Grade 3B in the civil service, i.e.presumed entry positions of male college graduates), Park shows whether, in1980, government workers received higher or lower total earnings than didprivate employees. He further derives estimates of life-time earningsbased on expected promotion patterns. Park's general conclusions are thatpublic employees earn less, and that the differential increases as skill andeducation levels increase. For college graduates, a private employee's entrywages are approximately 35Q higher; for junior college graduates 30% higher-
/1 See Kreuger (1q74)
_ 41
and, for high school graduates engaged in clerical work the entry differen-tial falls to 15%. For all education and occupation groups the differentialnarrows appreciably after age 40./L[
The existence of a prival:e sector wage premium led Park toexamine the strength of demand for public sector employment. He found thatsince the mid 70s the ratio of applicants to job openings has remainedrelatively constant and seemingly high -- around 40 applicants/job for non-clerical posts. Annual public sect:or turnover rates, averaging A.3% perannum, and voluntary quit rates, 5.3%, also did not seem high by nationalstandards. MWS data report monthly separation rates averaging 4.5a duringthe same period for employees in the private formal economy. Therelatively low turnover rates in the public sector are all the moredramatic considering that the late 70s were a period of high wages andlabor demand in the private economy.
Park concludes that a numiber of compensating differentials mostprobably account for the observed findings. Security of job tenure,pecuniary and non-pecuniary perquisites of public office not reported intotal earnings, and a general Korean "preference" for government work helpreconcile the earnings disparities.
For our purposes, the results reinforce our skepticism over thegovernment's playing a wage leadership role. Furthermore, civil servicesalary reform is likely to emerge in the medium term as an issue of publicsector performance not an issue of labor market wage distortion.
Union Differentials
One of the admitted purposes of trade unions is to raise wages.If a union does so by extracting a monopoly rent either through restrictingthe supply of labor or through the use of strikes or other activities whichincrease production costs but not productivity, then the union's actionscan be seen as generating inefficiencies within the labor market. If,however, unions contribute to increasing the productivity of workers or ifunion power offsets the monopsony power of employers, then unions maycontribute to the efficiency of labor market outcomes. The analysis ofunion wage effects and their efficiency implications occupies a large shareof contemporary labor economics research. For the T1.S., although the pre-sence of a union wage effect is beyond dispute, its efficiency implicationshave not been resolved.
/1 Park also found the following:(i) significant intra-public sector wage differences;(ii) compression in the public sector's own wage structure from 1978-81.
_ 42 -
In Korea, where union power is minimal due, in part, togovernment actions which have limited the scope of bargaining units and theuse of strikes and other exhibitions of labor power, a significant unionwage effect is not anticipated. The only available evidence of union/non-union wage differentials comes from a survey of individuals collected byProf. Bai of Seoul National TJniversity.
Both Bai (1977) and Park Se-Il (1981a) have analyzed the earningsprofile of the 1115 respondants to this survey. The survey, undertaken inJune 1976, reports 35.2% of the sample as members of trade unions. This islikely to be a larger percentage than prevails in the formal economy sincethe sample is biased toward larger establishments. According to Bai, tradeunion members received, on average, 26% higher wages than did the non-unionized individuals in the sample. This positive union wage effect doesnot, of course, adjust for any other wage determining factor such as age,sex, education, or experience.
Park Se-Il (1981a), using the same data, controlled for humancapital variables by regressing individual earnings on education, workexperience and a number of other firm and work specific characteristics./1Running separate equations for men and women, Park found that aunion/non-union dummy variable was not significantly different from zero inany specification which included human capital proxies. He, therefore,concludes, "This suggests that unions do not, in fact, make any differenceas far as worker's earnings are concerned..."/2
E. Cross-section results on the Yorean Wage Structure
The limitation of the univariate and bivariate analysis of thewage structure conducted thus far is its inability to simultaneouslyaccount for the various factors which determine earnings. Therefore, whenanalyzing the time trend of, say, the college/high school earnings ratio,the interpretation must be qualified since the independent effects ofchanges, for example, in worker experience and in the evolving sizedistribution of firms have not been controlled for. A multivariateanalysis of earnings can overcome these limitations. Estimation of earningsfunctions permits the statistical identification of the partial effect onearnings of both worker and firm related characteristics. The
/1 These estimations will be further discussed in the proceeding section.
/2 Park Se-Il (1981a), p. 38.
- 43 -
weakness of the multivariatet approach in the Korean context is the lack ofdata for a sufficient number of years. Restricted, in most cases, to datafrom a single year, previous studies have relied on cross-section findingsto approximate time series trends. This common approach with itsrecognized form of bias is particuLarly troublesome in this context due tothe dynamic nature of the Korean economy. As such, the univariate analysispresented above may be superior to the cross-section, multivariate studiesfor understanding the evolution of the Korean wage structure.
The cross-section studies which have been undertaken complementthe findings on wage structure reported above. The available studies, mostof which have already been referrect to, include Bai's (1977) and Park Se-Il's(1981a) work on a 1976 survey of 1115 individuals employed in registeredfirms; Park Fun Koo's (1981) analysis of 1980 Occupational Wage Survey data;and, Kim (1973) and Lindauer (1979, 1983) and their use of publishedinterindustry data.
These studies indicate, ceterus paribus, that education yields apositive return to both men and womn, that work experience increasesearnings, but at a decreasing rate, that sex differentials remain aftercontrolling for human capital attributes and firm specific characteristics,and that differentials by firm size manifest themselves regardless of thepermutation of wage data.
In addition to coniirming these trends, Park Se-II (1981a) findsthat it is possible to explain a larger proportion of the variance in malethan female earnings. This may suggest the greater role of institutionsand custom in female wage determination. Park also notes that employmentin enterprises with foreign involvement yields, ceterus paribus, some wagebenefit although the statistical result is only strong for women. InLindauer's (1979) multivariate examination of the interindustry earningsstructure, he finds that the determinants of this structure in Korea bearconsiderable statistical similarity to the determinants of the rU.S.earnings structure in manufacturing. The result implies similaritiesbetween the nations in the outcome of the wage setting process and mayfurther imply similarities in the process itself.
For our purposes, the consistency of the cross-section findingswith our time trend results is what is of most importance. There are noapparent areas of conflict which might require a reinterpretation of thetrends reported above./I
/1 It is important to note that both Park Se-Il(1981a) and Kim (1973)interpret some of their findings as supportive of models of labormarket dualism and of "custom" as a determinant of wage setting withinthe formal economy. The significance, ceterus paribus, of firm sizevariables is critical to this interpretation. The interested reader isdirected to the original works for an accounting of thisinterpretation.
_ 44 _
F. Conclusion
In any economy wage and employment outcomes are influenced by theforces of labor supply and demand as well as by the institutional environ-ment in which these outcomes are produced. Alternative theories of the labormarket - perfect competition, monopsony models, non-competing groups, dualand segmented markets - vary according to the emphasis placed on how thesealternative forces influence wages and employment. The models also differregarding their implications for the efficiency of the labor market, itsdistributional properties and the policy initiatives which should be pur-sued. Trying to determine which of these alternative models best depictsthe Korean situation was not the primary objective of this chapter. Toattempt to have done so would have implied that empirical tests exist bywhich competing hypotheses could be definitively accepted or rejected. Suchconclusive tests do not exist. Instead our main objective was to assess theresponses of Korean earnings to macroeconomic trends. By so doing we hopeto have gained some insight into the allocative properties of the labormarket and the likely path of future wage movements.
_ 45 -
ANNEX
Table Al: TODTAL MONTHLY EARNINGS BY SEXAND LEVEL OF ED1JCATIONAL ATTAINMENT (1971-1981)
(In current won)
MenAll College & Junior High Middle Primary
Year workers university college school school school
The previous chapter considered the trends in Korean earnings inthe formal sector as well as the evolution of the Korean wage structure.In this chapter, other aspects of the wage payment system will be examined.In particular the structure of compensation will be described and theprevalence of permanent employment systems, analagous to those in Japan,will be reviewed. These topics provide more institutional detail on theworkings of the Korean labor market while also exposing economic issues notrevealed by the analysis of earnings alone.
B. STRUCTURE OF COMPENSATION
An element of any industrial labor relations system is the compo-sition of total remuneration received by workers. In addition to'basicwages, workers may receive overtime pay, annual or seasonal bonuses,incentive payments, insurance coverage, special allowances for educationor family circumstances, and a host of other fringe benefits. Custom andtradition, as well as economic forces, will affect not only the compositionof the compensation bundle but also the relative significance of individualbenefits. In the Korean case, the legacy of Japanese colonialism exertedconsiderable influence over the wage payment system, therefore, whereappropriate, comparisons between Korea and Japan will be presented.
The most striking characteristic of Korean compensation schemesis the relative magnitude of allowances and bonuses. In 1981, according tothe OWS, the average worker received 70% of his compenisation in basic wages.(In this context, basic wages incLude base pay as well as cost-of-living orfamily allowances or any other similar payment made on a regular monthlybasis.) The remaining 30% was roughly divided between overtime and bonus
- 48 -
payments./l By comparison, in the mid-1960s, Japanese workers receivedclose to 77% of compensation in basic wage. The corresponding U.S. figurewould be closer to 90%./2
A finer breakdown of the Korean compensation structure is exempli-fied in Exhibit I-a below, the breakdown of the monthly starting pay of acollege graduate working at the Bank of Tokyo in Seoul in April 1979./3
/1 A 1980 survey of over 700 establishments conducted by the KoreanEmployers Federation arrived at similar figures. Basic wages amountedto 73% of average labor payments, while bonuses, overtime and otherforms of compensation accounted for 15%, 11% and 1.7%, respectively.Labor payments accounted for 87% of all labor costs. The remainingpercentage primarily represents severance payments, payments in-kindand welfare costs required by law. Large firms, those employing morethan 300 workers, paid a somewhat greater percentage of compensationin the form of nonbasic wage payments as indicated in the table below:
BONUSES AND OVERTIME PAY AS A PERCENTAGE OFTOTAL REMUNERATION BY FIRM SIZE
Firm size Production Workers Administrators(No. of employees) % bonus % overtime % bonus % overtime
a. Living allowance /1b. Encouragement allowance /2c. Other allowances /3
II. Annual special payments (bonuses)
III. Statutory fringe benefits
IV. Nonstatutory fringe benefits
1 Includes allowances reflecting different cost of living of each employeesuch as dependent allowance, housing allowance, and locality allowance.
/2 Includes allowances such as overtime, holiday work, night shift, skill,position, and special assignment.
/3 Education allowance, continuous service allowance, etc.
- 50 -
In this instance, basic wages amount to less than 40% of total monthly pay-ments, however, some of the overtime premium is likely to be guaranteed andas such, may really reflect basic and not overtime pay. A more generaldisaggregation of Korean compensation, discussed by both Kim (1973) and Park(1980) appears in Exhiboit I-b. The various categories of nonbasic wagepayments can be appreciated in this depiction of the compensation package.
The Korean allowance and overtime systems have much in common withthe fringe benefit and overtime pay systems of other nations. Allowancescover everything from housing to transportation. Korean firms may employmore of these allowance systems than on average exist in other countries, butthere is nothing especially unique in this area./l Concerning overtime pay,the letter of the law requires time and a half for work over 48 hours ifreached by the "mutual agreement" of the parties involved. In practice,Park (1979) notes, "... overtime work is frequently paid at the straighthourly rate. No overtime premium is, in fact, almost a customary practicein most small establishments." /2
What is perhaps most unique to the Korean system are the specialannual payments or bonuses. The bonus system is inherited from the Japaneseand involves lump sum payments which may be seasonal or annual. Originallyintroduced during the colonial period (1910-45), and later dismantled duringU.S. military rule (1945-48), bonuses reappeared in the 1950s and are now aregular feature of Korean enterprises, especially larger ones./3
In Japan, bonus payments are presently seen as a permanent part ofthe wage package and in some sense, especially according to unions, areguaranteed. This, of course, was not the case when the bonus system wasoriginated. Initially the success of the firm and the performance of anindividual worker determined the extent of the bonus payment.
/1 On this point, Kim (1973, p. 136) writes:
There are a variety of titles of allowances in all countries,but the number of the titles in Korea is so numerous that itis hard to enumerate all of them. The names are quite dif-ferent depending on companies so that there is hardly anyuniformity in the practice of paying allowances in Koreanfirms. This suggests that employers by creating a varietyof titles of allowances along with the high percentage ofallowance payments, seem to attempt to give a strong impres-sion of their benevolent and paternalistic attitudes towardemployees.
/2 Park (1979), p. 96.
/3 Park (1980), p. 91.
51 -
In Korea, the bonus is n.ot guaranteed in most firms. It tends toreflect business conditions and, therefore, varies across establishments andover time. During some recent years, successful firms are known to haveawarded 600% bonuses, meaning that workers received, in addition to theirbasic pay, the equivalent of 6 months worth of basic wages, usually paid outon a pro-rated, quarterly basis./l The system extends beyond the privatesector with public enterprise and civil servants receiving analogous pay-ments. In 1982, civil servants anticipate a 400% bonus. As illustrated inTable 14a and 14b bonus payments have been becoming an increasingly largershare of total wage payments since the early 1970s. For both men and womenthe increase in the share of bonuses for all workers has almost tripled.When broken down by education cohort the major cross section finding is asexpected - higher education, reflecting higher salaries and more sophisti-cated occupation categories, tends to yield greater bonuses. This resultreflects what is true in advanced economies, namely, that higher educationand greater fringe benefits are well correlated./2
In addition to illustrating the evolution of bonus payments overthe 1970s, Table 14a and 14b present the share of wage payments due toovertime. Again as expected, overtime and educational attainment areinversely correlated. This is as expected since management and professionaloccupations, associated with higher levels of schooling, tend to be salariedpositions and, therefore, overtime work is not recorded. While college,junior college and high school graduates of both sexes have generally had adecline in overtime earnings, middle and primary school graduates showlittle trend. The lack of an obvious pro-cyclical pattern in overtime payis a somewhat surprising finding.
Having described and documented the trend in the structure ofKorean compensation, we now consider the economic implications of thesedevelopments. Our focus will almost exclusively concentrate on the growingshare of bonus payments out of totaLl remuneration.
/1 Park (1979, P. 102) notes:
According to a survey of 983 firms in the manufacturingindustry made in February 1979 by the Korean Chamber ofCommerce and Industry, all firms paid bonuses in 1978.they ranged from one-half of a month's pay, given once yearly,to 100 percent of a month's pay given seven times or more ina year.
Median bonuses were in the 300-399% wage.
/2 Among other things, progressive income taxation of cash earnings inadvanced economies encourages this redistribution of the compensationpackage.
- 52 -
Table 14a: SHARE OF TOTAL COMPENSATION RECEIVEDAS BONUSES AND OVERTIME PAY
(Men, 1971-1981)
Junior High-Year All College College school Middle Primary
Korean enterprises may favor granting pay increases through higherbonuses rather than through raising basic wages for several reasons. Bothbasic wages and bonuses are paid after employees have completed the asso-ciated work for which they are being compensated. However, given the rela-tive infrequency of bonus payments, firms maintain control over wage fundslonger and thereby enhance their cashflow position. Secondly, both wagecustoms and Korean labor legislation tie a variety of compensation benefitsto basic wages not total pay. Bonuses, overtime and severance pay - by law,one month's basic wages for each year worked /1 - are computed as percent-ages of basic wages. A firm can, therefore, minimize total labor costs bygranting larger bonuses instead of giving what superficially might appear asan equivalent increase in basic wages.
Two additional points, both somewhat less obvious than the twoabove, may also account for the employer's preference for increasing bonusover basic wage payments. The first concerns wage policy. Although, ashas been stated elsewhere in this report, the recent history of governmentwage guidelines suggests far more of an implicit or indicative policy thanone of strict controls, the potential for tighter controls certainly exists.Firms, anticipating such government actions, might prefer to keep basicwages low so as to minimize the potential loss of flexibility in wagesetting that controls would impose. Bonuses are seen as under the discre-tion of the firm and, at least to some extent, beyond the domain ofgovernment intervention, Increasing the share of bonus payments, therefore,has increased the margin of potential flexibility in setting wages anddetermining labor costs. If the government decides to implement wagepolicies in the future, they will need to take account of both basic wages,special annual earnings and other fringes if the policies are to beeffective.
The next point also refers to the flexibility implied by a morebonus-oriented system. Firms are able to exercise more control over theircosts by not locking themselves into contractually agreed upon basic wagepayments. Since bonus payments are often a function of the firm's success,the firm's profits are not the only factor payment which will adjust tochanging business circumstances. Wages as well as profits may fluctuate,even in the short run, due to the enterprise's circumstances. What the firmhas thus been able to accomplish is to pass off some of the risks inherentin business activity onto the workers. lihile such a practice is likely tobe good for maintaining profits, it may be viewed as inequitable to theworkers who must bear the risk yet who have no voice in affecting businessoutcomes, It may also be ineffic-ent if, at some leTel, entrepreneurial
/1 The Koreans tend not to use the term severance pay but rather refer tothis benefit as a retirement allowance2 The implications of this mis-nomter are considered below.
- 55 -
decision-making is weakened by the diminution of associated risks. Ingeneral, the added degree of fleXibility in wage payments enjoyed by theenterprise is likely to represent the firm's greatest gain from increaseduse of the bonus system. At the same time workers may see the flexibilityin their wage receipts as the cost of this payment method. Although in thecurrent period a pro-business compensation structure may be desirable inorder to maintain already low levels of profits, in the future a move towardgreater reliance on basic wages nmay be to the long run benefit of a wellfunctioning labor market. If any change in the reliance on bonuses wasdesired, a possible starting place could be the public sector where equiva-lent basic wage payments could replace the present basic wage plus bonusformat. 1
The large shares of total compensation received as bonuses, over-time and allowances may also impose a social cost due to a reduction ininformation available to both firms and workers. Whereas information onbasic wages is easily transferred, the more complex the structure ofcompensation, the less likely it is that competitors within the 'Labor marketwill be well informed about: available alternatives.
One final point concerns the use of special allowance and fringebenefits. As in other societies, nonwage perquisites have become a part ofthe Korean compensation package. What the trend in these payments has beenis not known, as data to chart these movements are not readily available,However, by way of an example, we can consider how one benefit - severancepay - may lead to a distortion in the labor market. For all regularemployees, one month's severance pay is accrued for each year worked. Thismoney can be collected at the time of termination of employment whether thattermination is due to retirement, a firing or a voluntary quit. Sinceseverance and other fringes are costs to the firm which grow in relationshipto both the number of regular workers and the level of basic wages, firmshave an incentive to minimize the number of regular employees and to curtailthe growth in basic wages. We have already considered the latter point. Asto the former, rising fringe benefit burdens may induce firms to substituteaway from hiring regular employees and instead increasingly relying oncasuals.
/1 One other possible consequence of the bonus system, especially if itexpands both in terms of share of total compensation and number ofworkers affected, is its potential impact on prices. In a world ofimperfect capital markets, the nonrectangular distribution of pay maygenerate seasonal price fluctuations linked to the quarterly disburse-ment of bonus payments. Such ,seasonal demand shocks may create somedegree of seasonal price instability which can be considered as a socialas well as private cost of relying on the bonus system. It should benoted, however, that this effect, if it exists at all, may be small andmay be of more theoretical interest than of policy significance.
- 56 -
C. Permanent Employment
In addition to the wage contract between workers and employers,the employment contract is another essential feature of any industrial laborrelations system. Employment contracts may vary with regard to length ofcoverage -- in Korea annual contracts are the rule, protocols for layoffs,and the overall permanence or commitment, either implicitly or explicitly,agreed upon by employers and employees. In this section, the permanence ofKorean employment contracts is considered. We have already seen how Koreahas adopted and adapted the Japanese bonus system and now review the signi-ficance and economic implications of the Japanese lifetime employmentconcept as it applies to Korean industry.
There is a considerable debate in the literature over the truecharacter of lifetime employment in Japan. The origins of this system, itssociological and anthropological prerequisites, as well as its currenteconomic costs and benefits are all subject to a variety of interpretations.For our purposes, we consider permanent employment to be a system wherebyfirms guarantee, barring some catastrophic occurrence like bankruptcy,lifetime employment to a specific subset of workers who in turn have acommitment to be loyal to the firm and not to seek or accept other employ-ment opportunities. Workers are willing to accept relocation or any otherreasonable demand made by management. Workers can also count on thepaternalism of the firm and can feel reasonably protected from the vagariesof business conditions. This system is advantageous to the firm because itreduces turnover costs while also encouraging human capital investments inworkers. However, the system places an additional fixed cost burden on thefirm, depriving it of some of the flexibility associated with labor as avariable cost. For the worker, employment security is acquired at the costof lower wages, especially at the start of of the working career. A numberof other economic costs and benefits characterize the system, some of whichwill be noted below./l It is also important to point out that an entiresociological system must prevail in order to maintain the nature of thecontract since few of the lifetime provisions are a matter of true legalprecedence. An additional prerequisite is a dual labor market structure inwhich a secondary labor market exists which offers no lifetime guaranteesand which absorbs much of the cyclical fluctuations in labor demandassociated with industrial economies.
Whether or not the Koreans have developed an analagous system isimportant for several reasons. For one, the ease of inter-firm and inter-sectoral worker mobility is critical in an economy anticipating major
/1 The interested reader is directed to the literature on Japanese lifetimeemployment for a fuller accounting of these costs and benefits. See forexample, Clark (1979) and Cole (1979).
_ 57 _
changes in product mix over the medium-term. Secondly, during economicdownturns, widespread permanent emlployment systems pass the burden of weaklabor demand and industrial un- and underemployment onto firms, thusrelieving some degree of the public sector's responsibility for maintaininghousehold incomes. Thirdly, these systems tend to buy labor peace anddampen wage demands, potentially limiting the need for institutionalimprovements in the industrial and labor relations arena. We will return tothese issues after considering the state of lifetime employment contracts inKorea's formal economy.
A diversity of opinions exist concerning the prevalence of lifetimeemployment contracts in Korea. In discussions with a small (and non-random)sample of some of Korea's larger and more successful enterprises, some firmsindicated the existence of permanent employment while others did not. At aminimum, only management and highly skilled workers would qualify. The bulkof employees, production workers and unskilled operatives, had no employmentguarantees and, in fact, exhibited very high turnover rates, often in theneighborhood of 5% per month. The fact that production workers are notcovered is somewhat analagous to the Japanese system although lifetimeemployment is likely to extend further down the occupational hierarchy inJapan than it is in those firms employing the system in Korea.
At a more general level, Korean labor market specialists disagree onthe extent of lifetime employment within Korean firms. Kim Hwang Joe (1973)argues,
Giving a job is considered as a favor by the newly-employed. Once they are employed they remain permanentlyattached to the firm until the firm is in bankruptcy andno longer able to employ them. Although the surplus labormarket condition reinforces the tendency of the employeeto attach himself to a firm permanently, the Korean valuesystem in general considers it immoral for a worker tochange employers because of monetary motivations. It isalso considered immoral for the employer to dismiss apermanent worker except for the gravest case of moralturpitude. Under this permanent employment system,employers can pay low wages under the excuse of inabilityto pay./l
Arguing the opposite position, Kim Sookon (1978) writes,
One might expect some similarity between Korea and Japanin their industrial relations system because of the FarEastern cultural characteristics shared by the two
/1 Kim (1973), p. 169.
- 58 -
countries. Surprisingly, however, the results are quitecontrary. Twenty-two percent of the Korean workersexperienced a willingness to move to another company, whichis comparable to the American worker's propensity tomove... we can say that Korean workers feel free to shiftto a different employer whenever a better opportunitybecomes available.../l
Kim Sookon supports his position by citing the results of attitu-dinal surveys administered to Korean, Japanese and American workers. Onaverage, Korean responses to questions concerning the degree of theircommitment to their firm more closely resembled American than Japaneseworker responses. However, Korean employees, more than either theirAmerican or Japanese counterparts express the opinion that their firms havea greater commitment to keeping them employed, even during times ofdifficult business conditions./2 This almost suggests a system of tenure -whereby only the firm, not the workers, guarantees employment -- rather thanone of lifetime employment where the commitment is mutual.
Bai (1977), using similar attitudinal survey techniques, also foundthat Korean workers are willing to change jobs for better wages. 52% of hissample of workers in the Seoul area expressed willingness to leave theirpresent employers if offered a 20% wage increase elsewhere./2
Although attitudinal data offer insight into worker commitments,revealed behavior may be a better indicator of the existence of lifetimeemployment systems. Unfortunately, the data on job turnover and onemployment tenure are not sufficiently stratified by age, occupation andsex, to permit accurate testing of the alternative hypotheses. For example,the very rapid turnover rates experienced by Korean firms, rates which inthe mid-1970s were twice those of Japan's, are not available according towhich of the two labor markets, the one with lifetime guarantees versus theone without, workers belong. As such, the average turnover figures are nota good test for the existence of permanent employment set-ups.
The only readily available data for examining the content of firmspecific tenure and hence the prevalence of permanent employment come fromthe OWS. Duration with the firm plus total years of job experience arereported by occupation. These data appear in Table 15. Note that even for
/1 Kim (1978), p. 161, 163.
/2 Kim (1978), pp. 163-70.
/3 Bai (1977), pp. 37-38.
59 -
Table 15: AVERAGE LENGTH OF DURATION AT FIRM AND AVERAGE YEARSOF JOB EXPERIENCE BY OCCUPATION (1971-81)
Year Professional Administrative Clerical Service Production
/a Ratio of years at firm to years of total job experience.
Source: OWS.
the highest occupations, years of experience in 1981 amounted to only 6.5and 11.2 years for professional and administrators respectively. Clearlythe youthful nature of the Korean formal sector work force is keeping theseaverages low and subsequently making tests for permanent employment diffi-cult if not premature. By computing the ratio of duration with the firm toyears of job experience we get a crude measure of attachment to the firm.If permanent employment was prevalent we would expect the highest occupa-tional categories -- those workers the firm would least like to lose to havethe highest level of worker attaclhment. In fact, the data show the oppositetrend. Less skilled employees, albeit with shorter work experience, havespent a somewhat larger percentage of their working years with one firm
60 e
throughout most of the 1970s and early 1980s./1 Although not strongevidence, these results further weaken the notion of widespread Koreanworker commitment to the firm.
The dual of worker commitment to the firm is the firm's commitmentto the worker. For unskilled labor no commitment is apparent. OnePersonnel Manager commented that he wished turnover was even more rapid thanthe 2-3% per month the plant experienced. If it were, labor costs could bereduced without any loss in productivity due to the escalation of fringebenefits as duration with the firm increases. For skilled labor andmanagerial positions, firms would like to retain their employees. Fears of"scouting", that is, pirating by other firms in similar production lines, isoften expressed. However, the desire to maintain experienced professionalsis as much a simple reaction to their scarcity as it is to any specificinstitutional arrangement./2 A commitment to maintain skilled workers islikely to be a feature of many Korean firms but the absence of workercommitment to the firm signals the limited role of lifetime contractscurrently in use in Korean enterprises.
In recent years, when firms may have wished to lay off employeesdue to declining business conditions, government intervention as opposed tolifetime employment contracts, has acted to discourage if not denyreductions in work forces. If a firm wishes to discharge workers, a planand explanation must be first submitted to the local Ministry of LaborOffice. Such plans can be accepted or denied and the enforcement mechanismof these policies is part of the intricate web of labor, management, andgovernment interactions which characterize much of the formal industriallabor relations system of Korea.
To summarize, it is difficult to fully assess the level ofcommitment firms have to their workers for three reasons. One, the highrate of job turnover, most of it apparently voluntary and, especially forwomen, related to Korean patterns of labor force participation, obviates
/1 Not much should be made out of the time series dimension of these data.If anything, the intertemporal variance suggests potential irregularitiesin the data themselves.
/2 Korean enterprises often express a preference for workers who are recentschool graduates or who have not had previous employment. Such atti-tudes, which are consistent with a permanent employment framework, arealso consistent with attempts to maximize productivity by minimizing thechances that workers have acquired "bad habits" from other jobs. Thisis particularly important for production line work. In this context,preference for new entrants need not be construed as indicative of alifetime employment relationship.
61 _
most of the need for a firm to formulate an employment policy. Second,limited experience with economic recessions in the last 10-12 years hasprovided little stress on employnent demands. Third, governmentintervention, often in an implicit manner, disguises the true long-termcharacter of the firm's position.
For the moment we concLude that lifetime or permanent employmentsystems such as those that exist in Japan are not a feature of any signi-ficant sector of the Korean economy. This is not to say that such a system,as it did in Japan, will not evo:Lve with changing economic and institutionalcircumstances./1 The absence of lifetime employment systems in contemporaryKorea, is important for descripti:ve purposes as well as for policy implica-tions. The latter might include the following:
(a) continued confidence in labor mobility to support developmentof new economic sectors;
(b) greater government responsibility in insuring incomes, if notemployment, during cyclical downturns (a matter of growingimportance given the Korean economy's increasing dependenceon export, and hence exogenous demand);
(c) potential need for greater public investments in job specifichuman capital through, for example, training and vocationalcenters, due to the limited degree of such investments thatfirms, fearing the turnover of trained workers, are willingto undertake;
(d) the potential need for institutional development of betterindustrial and labor relations systems since within-enterprise system are likely to be insufficient forfacilitating the dialogue between workers and employers overwage and employment solutions.
In conclusion, the results of this Chapter indicate that althoughthe Koreans may have adopted aspects of their industrial relations systemfrom other societies, they have also adapted them to their owncircumstances and now possess syst:ems which are uniquely Korean.
/1 Some economists argue that the Japanese system evolved in,response tothe militancy of trade unions in the late 1940s toward employmentsecurity. Lifetime employment then emerged as a mechanism for buyinglabor peace. See Cole (1979).
-'62-
4. WAGES, PRICES, PRODUCTIVITY AND EXPORTS
A. Introduction
Since the early 1970s the overall trend in nominal and realearnings in the Korean formal economy has been generally increasing.Chapter 2 documented these trends. The implications of these wage movementsare varied. Significant improvements in the real standard of living of manyKoreans have been realized. Within the formal economy, the distribution ofoutput between profits and earnings has changed with this movement likely tohave favored labor. Wage developments have affected relative factor prices,which in turn have influenced substitution in industrial production. On amore macroeconomic level, earnings trends are likely to be implicated inboth the inflationary episodes of the last decade and the changing compara-tive advantage of Korean exports. Although all of these issues aredeserving of further investigation, the focus of this chapter will be on therole the labor market played in the price inflation of the late 1970s.Special attention will be given to the relationship between wage andproductivity growth during this period.
B. The Empirical Context
By late i981 and through the first quarter of 1982 price inflationwas no longer the most pressing issue facing the Korean economy. A recession,which we have already seen reflected in labor market trends, had become a emore serious problem. However, in the years prior to the current downturn,rapid price inflation plagued Korea. In Table 16, using the CPI as an indexof price inflation, annual rates of price increases are seen to haveaccelerated from 1976-1980 and to have been sustained at relatively highlevels in 1973-75 and 1979-1981.
Although a variety of factors potentially contributed to thevarious inflationary episodes, including oil shocks, exchange rate policyand international transmission of inflation, our discussion will be limitedto the relationship between wage growth and price increases. In Table 16,wage and price movements can be easily compared. From 1971-1979 increasesin nominal earnings exceeded the annual percentage change in the CPI. Onlysince 1980 have prices surpassed wages, consistent with the earlier findingof recent real wage decline. That nominal wage increases exceeded pricemovements throughout the 1970s is not surprising, since productivity growthaccounts for much of the observed wage trend.
/a Earnings and productivity refer to the manufacturing sector only.
Source: Monthly Wage Survey.
Real earnings, however, only exceeded productivity growth in 1973, and thenagain during the period of Korea's most rapid output expansion, 1976-78.These years are also coincident wiLth the period of escalating price increasesand precede the high inflation levels of 1979-81, leading some observers tocite wages as the primary cause of price inflation during these periods./l
It is worth noting that a divergence between earnings and produc-tivity growth in Korea is not a netw phenomenon. Moran, in a study of theyears 1963-1974 found the following to be true for data on the entireeconomy:
Although the real wage per worker grew by the same proportionas value added per worker during the entire 1962-74 period,there was much leapfrogging between these two variables. Forexample, between 1966 and 1970 the real average wage grew more
/1 Clearly much of this interpretation depends on the measure of produc-tivity which is chosen. A more complete discussion of productivitymeasures is contained in the Annex to this chapter.
- 64-
than 75% faster than output per worker; between 1970 and 1974productivity grew almost 50% faster than the real average wage.Average real wages have apparently been growing in a typicallagged-response pattern to spurts in productivity through theperiod./I
Given this observed pattern of wage, price and productivity growth, what nowconcerns us are the conclusions that can be drawn regarding the role ofwage increases in generating domestic price inflation, especially during thelate 1970s. To attempt to answer this question some alternative theoreticalframeworks are considered below.
C. Theoretical Background
The intent of this section is not to review the literature on thedeterminants of price inflation. The aim is simply to consider whatalternative models of inflation are consistent with recent macroeconomictrends in Korea.
Inspection of the real wage and productivity trends might lead oneto conclude that cost-push pressures were responsible for price inflation.Certainly, if labor was able to demand wages which surpassed productivitygrowth, a wage-price spiral could follow. However, cost-push models tend torequire some monopoly power on the part of labor. Such power, after all, isseen as necessary if labor is to "force" profit conscious firms into payingwages greater than those dictated by productivity. This wage/productivitygap can be generated by powerful trade unions, by wage demands which arestrongly supported by the government, and/or by wage customs on otherinstitutions which act to maintain wage rigidities across workers regardlessof individual trends in productivity. Cost-push inflations also tend to beassociated with declines in capacity utilization and hence output growth.This is because profit receivers are no longer willing to provide formerlevels of capital at the now lower rates of return. (This interpretation ofcost-push inflations led Gordon (1978) to conclude that the only U.S.inflation since WWI that was cost-push induced was the 1973-75 episoderesulting from oil and raw material price shocks.)
For a variety of reasons, cost-push arguments are not a totallysatisfactory explanation of the Korean inflation of the late 1970s. Outputgrowth was rising not declining during the period 1975-79,/2 although profitmargins were shrinking. This suggests that capital owners were not
/1 Moran (1976) p.199.
/2 After 1979, price inflation exceeded wage inflation, suggesting thatcost-push pressures were not likely to be a primary determinant of pricerises.
completely discouraged by trends in rates of returns. Furthermore, itis difficult to identify any monopoly element bargaining for labor'sposition. The Korean trade union movement was seriously emasculated bygovernment actions throughout the 70s and does not appear to have been in aposition to extract any monopoly rents. Government wage policy on the otherhand, although pro-labor during these years, is unlikely to have been thedominant factor in pushing wage increases beyond productivity gains. In thecompetitive output markets which many Korean firms faced, it is unlikelythat a wage policy which was not designed to be strongly enforced throughinstitutional controls could have maintained the observed wage/productivitywedge over several years. As for wage customs and other wage-settinginstitutions, the responsiveness of wage differentials to overall macro-economic trends, cited earlier, suggests some weakness in wage rigidities aseither a primary source of cost-push pressures or as the chief explanationof price inflation during this per-Lod. By not being able to readily iden-tify the force behind a cost-push drive, this explanation of the wage-pricespiral loses some of its its appeal, regardless of the observed wage/productivity trend.
Setting aside wage based cost-push explanations, the next obviouscandidate is demand-pull. For our purposes, what is of interest is whetherdemand-pull arguments can account for the observed wage/productivity gap andwage-price spiral. Simply stated, if the Korean economy was experiencingtight labor markets in the late 1970s, productivity growth, inherently aphysical not nominal concept, would not have been expected to significantlydeviate from the long run trends. Wage increases, meanwhile, may haveaccelerated as firms bid up labor prices due to the short-run scarcity ofmanpower. Assuming that such behavior was ultimately accomodated bymonetary authorities, a wage/productivity gap could have emerged due to thepressures of excess demand for labor. Once the competitive bidding forlabor began, a wage-price spiral, as maintained by the data, may havefollowed./l
That a widening gap betweien real earnings and measured producti-vity emerged in the late 1970s cannot be denied. That rapid price inflationfollowed this event is also apparent. However, what must be emphasized isthat the ultimate determinant of these trends, the force which set theseevents in motion, need not have originated in the labor market. Althoughcost-push factors at some level were operative -- wages did rise faster thanprices, the escalation in wages may have been due to demand pressuresemanating from firms, rather than from wage demands orchestrated by the
/1 That excess demand bid up wages faster, or at least sooner, than pricesis consistent with both the significant share of output and the growthin demand for Korean exports. lThis external expansionary force firstaffected labor demand and then wages, which in turn may have translatedinto increases in the domestic price level.
- 66 -
suppliers of labor services./l These alternative interpretations must becarefully assessed since the policy implications which follow will vary. Inthe future, if analogous inflationary episodes repeat themselves, a wagepolicy "with teeth" may prove to be effective if cost-push is the ultimatedeterminant of price movements. However, such a policy, although capable ofmaintaining profit shares in the short run, will not address the fundamentalimbalances which are present if excess demand and hence, demandpull forces,initiate the wage-price reactions. Furthermore, a wage policy "with teeth"under conditions of excess demand might produce serious inefficiencies inthe allocation of labor, since the market would no longer be permitted "toration" scarce labor. Firms would be encouraged to find ways of cheatingthe wage guidelines, and bottlenecks resulting from inadequate matching oflabor supplies and demands at the controlled wages might be anticipated. Inthis instance, any gains in reducing price inflation through wage controlscould easily be at the expense of efficiency in factor markets and hence theresulting level of national output. It is unlikely, in the long run, thatsuch a tradeoff would be in the economy's best interest.
/1 Kendrick (1977), one of the recognized experts on productivity, genera-lizes this point. He notes:
i.. t is obvious that in order to have a stable generalprice level, average input prices must rise no more thanin proportion to total factor productivity. When they do,it is of course no proof of cost-push inflation. Even ifincreases in aggregate demand are outrunning increases insupply and pulling product prices up, input prices willstill rise by more in proportion to productivity. This isbecause demand-pull inflation first acts to raise profitmargins, which are reflected in the factor price measures,and subsequently tends to accelerate increases in wage-rates, the major component of factor prices. In otherperiods, however, when demand-pull is not evident, asindicated by excess capacity and stable or falling profitmargins, an increase in factor prices (predominantly wage-rates) greater than the rise in productivity is generallyviewed as evidence of cost push.
ANNEX
_ 67 _
A Final Word on Productivity Trends
Given the importance atltached to measured productivity trends inassessing macroeconomic developments,/1 it is worth considering somemeasurement issues concerning Korea's productivity statistics. According tothe received theory, wage and productivity trends are expected to be wellcorrelated over the long run. For the U.S., the trend in real averagehourly earnings is very close to t:he trend in output per hour for the 30years, 1945-75./2 The theoretical explanation is based on neoclassicalcompetitive equilibrium conditions. In the long run firms are expected toproduce where marginal costs equal average costs, implying that marginalproducts of all factors will equal. their average products. With regard tolabor, average products are the traditional empirical measure of producti-vity. Since profit maximizing firms employ labor to the point where realwages equal marginal products, we expect that real wages will equal produc-tivity in the long run. This equilibrium condition further implies thatreal wage growth will equal productivity growth.
As Figure V suggests and as noted earlier, real wages inmanufacturing and productivity trends in that sector have not been "almostequal" over the 1970s. In the previous section, we considered somemacroeconomic explanations for this observed trend. In this section webriefly discuss some measurement problems./3
The most commonly referred to productivity trend in Korea iscompiled by the Korean Productivity Center. This quasi-government agencyreceives output and input data from a National Bureau of Statistics monthlysurvey of selected establishments. The output index is based on actualquantities produced, not on the vaLue of production. Aggregation is achievedby means of value added weights pertaining to value added in the base year,1975. Multi-product firms pose special problems given this formulation.
/1 One can further appreciate the significance of measured productivitygrowth by realizing that the Korean government's implicit wage guidelinein 1979 was that wage increases should equal national productivityincreases. Needless to say, the economic and political impact ofmeasured productivity, at least in 1979, was considerable.
/2 Kendrick (1977) p. 80.
/3 It should be noted that in Moran's (1976) work on wages and productivity,real compensation per worker exceeded real value added per worker from1967-1974. Prior to 1967, wages and productivity were more closelyaligned. Moran's data, which might extend the observed wage/productivitygap from 1967-80 are, however, based on economy-wide data derived from GDPaccounts while our data refer primarily to manufacturing.
- 68 -FIGURE V
Reol £arnings ond Productivity in manufocturing(i975=100)
2Q00
180 - Productivity
160 Reol Earnings
160JI
ex i
N 120 I
0
100~~~~~~~~~~~~~~~~~~~
80 .,
60
1972 1974 1976 1978 1980
Yeor
ANNEX 2_69 _
The input index is based on man-days of production workers permonth. Unlike the output series which is based on a 5-digit SIC classifica-tion, input data are organized at a 3-digit level. Furthermore, the inputseries is weighted by share of total man-hours in the base year rather thanby the value added weights used in the output series. The ratio of the inputand output series appears as a quarterly estimate of productivity for allindustry/I as well as for approximately 30 industrial disaggregations.
A number of Korean economists and statisticians have pointed outnumerous weaknesses in the measured statistics./2 Unfortunately, the biasesdo not all work in the same direction. For one, the use of differentweighting schemes in the output and input series can cause statistical arti-facts irrespective of any change in output per worker. Second, the use ofman-days rather than man-hours, fails to reflect the impact of overtime work,which, in fact, varies over the business cycle, and hence biases the statis-tics upward during cyclical peaks. Third, the use of 1975 value addedweights fails to capture the significant changes in output composition whichhave taken place since 1975. In fact, those new industries, such as steel,electronics and shipbuilding, which are likely to have had large capitalinvestments and labor productivity growth since 1975, are precisely thoseindustries which contribute little to the aggregate productivity measure dueto their small contribution to value added in 1975. This is likely, on net,to produce a downward bias in the statistic.
As an alternative to the Korean Productivity Center's series onecan compute the trend in real value added per worker based on mining andmanufacturing data. The correlation between the two series equals .88and after 1975 the real value added per worker trend provides anequally poor fit relative to the real earnings trend (see Table A3 below).
What this discussion of productivity measurement is meant toemphasize are the limitations of the available data. Whether Korean pro-ductivity data are less reliable t:han similar data for other nations is opento debate, although some of the Korean computation techniques do stand outas particularly weak. However, a;Ll productivity measures are known to becrude approximations and in a rapidly changing economy like Korea's duringthe '70s, the weaknesses of these measures may be even more profound. Recog-nition of these problems should, at a minimum, reinforce an earlier point,that the observed wage/productivity gap should not be used as the criticalpiece of evidence supporting any particular theory of labor market and macro-economic interactions.
/1 This includes manufacturing, mining and electricity.
/2 See Park (1980) and Yoo (1982).
ANNEX 2
_ 70 -
Table A3: COMPARISON OF PRODUCTIVITY AND EARNINGS MEASURES IN MANUFACTURING(1971-81; 1975 = 100)
(a) Real Earnings = Average monthly earnings for all workers inmanufacturing from Monthly Wage Survey.
(b) Productivity = (i) KPC measure - see text.(ii) Real value added divided by number of employees
in entire manufacturing sector, according toMining and Manufacturing Surveys.
APPENDIX_71 -
THE NATURE OF KOREAN LABOR MARKET DATA
The Appendix reviews available sources of Korean labor marketinformation. The Korean government has amassed an impressive collection ofofficial labor market data spanning, in most instances, the period 1970through the present. The available data make possible a more exhaustiveanalysis of wage and employment trends than could be attempted in many othernations. However, it is important to emphasize the basic limitations of thedata imposed by the coverage of Korean wage and employment surveys. By notreflecting the conditions of the small-scale or informal economy, the dataportray only a percentage of the nonagricultural work force. In order toavoid making inaccurate economy wide generalizations based solely on theseformal economy statistics, this chapter provides estimates of the relativesize of the formal and informal sectors. It also documents the alternativesources of Korean labor market information which are relied upon throughoutthis report.
Most Korean labor market information is summarized in the Ministryof Labor's annual Yearbook of Labor Statistics. This yearbook provides themajor findings of the Ministry's own survey work including the Monthly WageSurvey, Actual Labor Conditions of Establishments (quarterly) and OccupationalWage Survey (annual). The Yearbook additionally provides data compiledfrom the National Bureau of Statistics' Economically Active Population Survey(quarterly). Information on, among other things, prices, productivitytrends and registered labor dispuites is also reported.
The data on earnings are collected solely by the Ministry of Laborwhile employment statistics are generated by several sources. By comparingthe employment profiles from Ministry of Labor reports with the profiles ofmore global surveys, it is possible to determine the boundaries of Ministryof Labor earnings data. In Table 18 information on employment by economicsector from different sources is compared. In the first column, the resultsof the 1979 /1 Economically Active Population Survey (EAPS) are presented.This survey is household based ancl is administered to approximately 15,000families nationwide, yielding responses from some 45,000 civilians 14 yearsand older. If we accept the Economically Active Population Surveyprojection of 14.2 million people falling into this category nationwide, thesurvey translates into roughly a 3 per 1,000 sample.
/1 The year 1979 was chosen for comparison because it is the most recentyear for which a complete set of independent estimates from alternativesources is available. Note also that Population Census data would havebeen an ideal source for conducting the consistency/boundary analysisbeing developed. However, no preliminary results from the 1980 Censusare available.
_ 72 _ APPENDIX
Table 18: EMPLOYMENT BY ECONOMIC SECTOR (1979)ACCORDING TO ALTERNATIVE SOURCES
(In thousands of workers)
Industry EAPS ALCE MWS OWS Other(1) (2) (3) (4) (5)
1. Total employment 13,664 3,345 2,735 2,839 n.a.2. Agriculture /a 4,887 22 n.a. 10 n.a.3. Mining 111 74 67 70 804. Manufacturing 3,126 2,155 1,921 1,999 2,1165. Construction 836 280 86 87 4756. Social overhead capital
and other services 4,704 814 661 673 n.a.7. Electricity /b n.a. 23 21 22 198. Commerce /c n.a. 211 109 113 1,3639. Transport 7d n.a. 250 240 244 40410. Finance /e n.a. 164 148 149 n.a.11. Personal services n.a. 166 143 145 n.a.12. Public sector n.a. n.a. n.a. n.a. 664/f
/a Includes agriculture, forestry, fishing and hunting.lb Includes electricity, water and gas in columns (2), (3) and (4) and only
electricity in column (3)./c Includes wholesale and retail trade as well as hotels and restaurants.Id Includes transport, storage and communication in columns (2), (3) and (4),
and only transport in column (5)/e Includes financing, insurance, real estate and business services./f This figure includes 582,000 employees of the national government as well
as 82,000 public enterprise workers. (The latter statistic was suppliedby the KDI).
Sources: Economically Active Population Survey, National Bureau of Statistics,EPB. Includes civilian and noninstitutional population 14 yearsold and over.
Actual labor conditions at establishment, Ministry of Labor.Includes establishments of 5 or more workers excluding publicemployment.
Monthly Wage Survey, Ministry of Labor. Includes establishments of10 or more workers excluding public employment and agriculture,forestry, hunting and fishing.
Occupational Wage Survey, Ministry of Labor. Includes establishmentsof 10 or more workers excluding public employment.
All figures are reported in Korea: Statistical Yearbook 1981,Bureau of Statistics, EPB. This volume is a compilation of othersurveys. We report employment from the surveys of Mining andManufacturing, Construction, Electricity, Wholesale and RetailTrade, Transportation and Government Administration.
- 73- APPENDIX
In columns 2, 3 and 4 the results of three different Ministry ofLabor surveys are reported. In column 2, employment data from the ActualLabor Conditions of Establishments (ACLE) are presented. This survey coversestablishments of 5 or more workers, excluding all public sector employment.No wage data are reported in this survey. Columns 3 and 4 correspond tothe Monthly Wage Survey (MWS) and Occupational Wage Survey (OWS) respec-tively. These surveys are administered to 3,865 firms, employing 10 or moreworkers,/1 and contain detailed information on earnings by economic sectors.According to the Ministry of Labor, the establishment surveys of firms with10 or more workers are 8.5% samples of the population of registered firms.
Column 5 presents employment estimates obtained from survey andcensus reports of individual government ministries. These data yieldestimates for sectors not covered by the Ministry of Labor (e.g. publicemployment) while they also provide independent consistency checks of otheremployment estimates.
According to row 1 of Table 18, the available earnings data -information contained in only the IMWS and OWS - correspond to only 1/3 oftotal private, nonagricultural employment. In other words, for some 5 1/2million workers we have no corresponding earnings data. Table 18 suggeststhat these workers are most concentrated in the Social Overhead Capital andOther Services sector. In fact, 74% of the workers "missing" earnings dataare in this sector, another 22% are! reported to be in manufacturing with theremaining percentages scattered across other sectors. These data illustratethe extent of the Korean small-scale sector which, by definition, isexcluded from the earnings surveys./2
The significance of the small-scale sector can be furtherdocumented. First, examine row 8 of Table 18 which reports employment in theCommerce sector, i.e. wholesale and retail trade, hotels and restaurants.The 1979 Census of this sector reports that 90% of the sector's 1,363,000workers (column (4)) are emp:Loyed in firms of fewer than 10 persons.Clearly the Ministry of Labor earnings data on formal employment in thissector, representing only slightly more than 100,000 workers (columns (3)and (4)), cannot be construed as representative of the entire sector.Parallel to the larger firms exists a vast informal economy.
/1 The sample is based on stratified random sampling with a larger shareof large firms included in the sample. The sample is redrawn every 3years. Prior to redrawing a new sample, firms which are lost to thesample are replaced through random selection procedures.
/2 Problems of definition and of sampling bias will, of course, affect theactual percentages reported by the cross-survey comparison above and,therefore, the specific numbers should only be considered as suggestiveof formal/informal sector employment shares. However, the basic conclu-sion on the significance of the small-scale sector seems robust.
4- APPENDIX
The small-scale economy is also made apparent by the Economically_6Z-ive Population Survey's reporting of employment by class of workers. In1979 (see Table 19 below), for economically active persons in non-farm house-biolds, which roughly corresponds to non-agricultural employment, close toI/3 of all workers are self-employed or family workers. These individualsconstitute a significant percentage of the informal economy and their earn-ings are not captured by any official survey.
Table 19: PERSONS EMPLOYED BY CLASS OF WORKER (1979)(Non-Farm Households Only; '000 Workers)
Family Regular TemporarySelf-Employed Workers Employees Employees Daily Workers Total
2124 548 3,665 977 994 8,308
Source: EAPS, EPB.
Given the importance of the manufacturing sector in the KoreanecorLOiy, it is worth commenting on the consistency of its employment statis-tics (Table 18, row (4)). The Mining and Manufacturing Survey conducted bychie Economic Planning Board reports total employment of 2,116 thousand-Jorkers in 1979 in firms of at least 5 employees. For firms employing 10O-r more workers the corresponding total is 2,041 thousand. Both figures,ompare favorably with the results of the Monthly and Occupational Wage3Irveys, our primary sources of earnings data,/l with a discrepancy in thert range. The similarity of the employment figures for the formal manu-racturing sector suggests robustness in the data available to portray thisteadThg sector of the economy. The residual estimate of informal manu-
r-aouring employment of almost 1 million workers (row 4, column (1) - (2))points to the significance of the "uncovered" sector.
In an analysis of the size of the informal economy analagous to7-his one Bai (1981) estimates employment, in what he refers to as the urbanr eadir-orial sector, equal to only 50% rather than our 66%, of nonagriculturaleplay>i-nt. His estimate is lower than ours because he subtracts an estimate
oi-naaarm agricultural employment from the Economically Active PopulationS-evs estimate of nonagricultural employment. Although somewhat differ-
ent both estimates of the size of the informal economy do point out theli-itations in generalizing about the entire economy from Ministry of Laborearrings data.
/f Differences between the MWS and OWS can be attributed to differences insampling period. The MWS reports the average monthly experience whiletchc OWS refers only to the actual survey period.
- 75 - APPENDIX
Although representing only 1/3 - 1/2 of total private nonagricu-tural employment, Ministry of Labor earnings data might still be appro-priately used for some economy-wide generalizations if they were believedto be proportionately representative of total employment. Table 20 revealsthat the occupation distribution generated by the Economically Active Popu-lation Survey does not closely correspond with that of the Occupational FWageSurvey (OWS). The latter survey is more heavily weighted toward productionand clerical work, reflecting the occupation structure of the formal economy,which is dominated by manufacturing and by a generally large-scale and morebureaucratic industrial organization.
Table 20: COMPARISON OF OCCUPATIONAL COMPOSITION (1980)NONAGRICULTURAL WORKERS ONLY
Source: Economically Active Population Survey, NationalBureau of Statistics, EPB; Occupational WageSurvey, Ministry of Labor.
The limitations of the avrailable Korean earnings data point up abasic weakness of Korean statisticaLl coverage, namely, the absence of abroadly based, multi-purpose, nationwide household survey./l Bhalla (1979)
/1 It is worth noting that the Family Income and Expenditure survey ofurban housholds does provide some household based data on earnings.However, this survey is primarily used for price index issues and littleearnings information is published. Furthermore, Korean statisticiansfamiliar with the survey did not express confidence in this area of thesurvey. Perhaps in the future this survey could be augmented forimproved earnings data collection.
- 76 - APPENDIX
also points out the need for such a survey in his in-depth review of data onhousehold incomes in Korea. Bhalla's interest is to portray the biasesinherent in analyses of Korea's distribution of income. He notes thatexisting surveys fail to include at least 19-25% of the nation's households.Bhalla concludes that without information on these households, littleconfidence can be placed on the derived estimate of improvements in theKorean distribution of income. Although we share Bhalla's concern, ourproblem is only partially analagous. Confidence can be placed on the datareflecting the formal economy, however, it must be recognized that fewempirical generalizations can be offered on the remaining and rathersubstantial informal sectors.
_ 77 -
Bibliography
Bai, Moo-Ki (1977), "Education, Workers' Behavior and Earnings: A Case Studyof Manufacturing Workers in Korea," The Institute of Economic Research,Seoul National University.
Bai, Moo-Ki (1981), "The Turning Point in the Korean Economy," VisitingResearch Fellow Monograph Series, No. 88, Institute of DevelopingEconomies, Tokyo.
Balassa, Bela (1963), "An Empirical Demonstration of Classical ComparativeCost Theory," Review of Economics and Statistics, (August).
Baumol, William J. (1967), "Macroeconomics of Unbalanced Growth; The Anatomyof Urban Crisis," American Economic Review (June).
Bhalla, Surjit S. (1979), "Aspects of Income Distribution (and Employment)in South Korea," World Bank Paper, Employment and Rural DevelopmentDivision (January).
Clark, Rodney (1979), The Japanese Company (Yale University Press, New Haven).
Cole, Robert E. (1979), Work, Mobility, and Participation (University ofCalifornia Press, Berkeley and Los Angeles).
Cook, Alice H. and Hiroko Hayashi (1980), Working Women in Japan (New YorkState School of Industrial and Labor Relations, Cornell University,Ithaca.
Fei, John C.H. and Gustav Ranis (1975), "A Model of Growth and Employment inthe Open Dualistic Economy: The Cases of Korea and Taiwan," Journal ofDevelopment Studies (January).
Gordon, Robert J. (1978), Macroeconomics Second Edition (Little, Brown andCompany, Boston).
Kendrick, John (1977), Understanding Productivity (Johns Hopkins UniversityPress, Baltimore).
Kim, Hwang Joe (1973), "An AnalysLs of the Interindustry Wage Structure ofMining and Manufacturing Industries in Korea," unpublished Ph.D.dissertation, University of 1Massachusetts.
Kim, Sookon (1978), "Labor Econom:Lc and Industrial Relations in Korea," KoreaDevelopment Institute Working Paper No. 7801 (Seoul, Korea).
- 78 _
Kreuger, Anne 0. (1974), "The Political Economy of the Rent-Seeking Society,"American Economic Review (June).
Lind:auer, David L. (1979), "Labor Market Behavior in Developing Nations,"uinpubli~shed Ph.D. dissertation, Harvard University.
(1983), "Regional Wage Determination and Economic Growthin Korea," Wellesley College Working Paper (Forthcoming).
MacDougall, G.D.A. (1951), "British and American Exports: A Study Suggestedby the Theory of Comparative Costs," Economic Journal (December).
Mason, Edward S. et al, The Economic and Social Modernization of the Republicof Korea, Council on East Asian Studies, Harvard University (HarvardUniversity Press, Cambridge).
Moran, Ricardo (1976), "Labor Availability and Employment, in Parvez Hasan,ed., Korea: Problems and Issues in a Rapidly Growing Economy,(John Hopkins University Press, Baltimore).
Park, Fun Koo (1980), "Estimation of Labor Productivity Index in Korea,"Korea Development Review (December).
___ ___ (1981), "An Analysis of Wage Differentials According to FirmSize," Korea Development Review (December).
Park, Se-Il (1980, "Wages in Korea: Determination of the Wage Levels and the14age Structure in a Dualistic Labor Market," unpublished Ph.D. disserta-tion, Cornell University.
(1981a), "Determinants of Individual Labor Earnings in Korea:An Estimation of Earnings - Function in a Dualistic Labor Market," KoreaDevelopment Institute, Monograph 8104 (Seoul, Korea).
(1981b), "Pay Differentials between Public and Private Sectors,"in Chong Kee Park and Kyu Uck Lee (eds.), Setting National Priority:J981 BudRet, Korea Development Institute (Seoul, Korea).
Park, Young-Ki (1979), "Labor and Industrial Relations in Korea: System andPractice,"' Institute for Labor and Management, Labor and ManagementStudies, No. 6 (Sogang University Press, Seoul).
Reynolds, Lloyd and Cynthia Taft (1956), The Evolution of Wage Structure(Yale University Press, New Haven).
lco. Kyong Jong (1982), Country Paper presented at the Study Meeting on3-du2tivity ueasurement and Aal-ysis, Colomo, Sri Lanka, (Mimeo).
Watid ,azik French: Croissance et emploi en Chine. Oxford Unzversity Press, 1980. 444 pagesEconomica, 1980. ISBN 2-7178-0282-7, (including index).
Publications Stock No. ~'B 0548, $7.95. LC 79-23354. ISBN 0-19-520115-9, hard-Spanish: Crecimiento economico y empleo cover; ISBN 0-19-520116-7, paperback.of Related en China. iEditorial Tecnos, 1980. ISBN Stock Nos. OX 520115, S27.50 hardcover;
Interest 84-309-0871-4, Stock No. IB 0530, S7.95. OX 520116, $12.95 paperback.Household Income or
Employinent Patters and Household Income per CapitaIncome Growth in Welfare ComparisonrJoseph J. Stern and Jeffrey D. Gautam Datta and Jacob Meenman
Staff Staff Working Paper No. 378. 1980. 32Staff Working Paper No. 419. 1980. 70 pages (including 3 appendixes, references).pages (inclulding bibliography, 2 appen- Stock No. WP 0378. $3.dixes).
Stock No. WP 0419., $3. How Segmented is the B3ogotaThe Determinants of LaborMaktEarnings in Developing Employment Policy in Labor Market?Metropolises: Estimates from Developing Countries: A Gary S. FieldsBogota and Cali, Colombia Survey of Issues and Evidence Stpaff Working Paper No. 434. 1'80. 99Rakesh Mohan Lyn Squire Stock No. WP 0434. $3.Staff Working Paper No. 498. 1981. 135 Low rates of growth in industrial em-pages (including 2 appendixes, bibliog- ployment, high rates of unemploy- Incidence of Poverty and eraphy). ment among new entrants to the ur- Characteristics of the Poor inStock No. WP 0498. $5. ban labor dtiviety and remuneraion oPeninsular Malaysia, 19X7
Differences in Incorne, are the three issues addressed in this Pravin VisariaNutrition, and Poverty within study. The author identifies the impor- Staff Working Paper No. 460. 198. 221tant deternminants of labor demand pages (including statistical appendi).Brazil and supply and the extent to which Stock No. WP 0460. $10.Vinod Thomas the growth of labor demand has beenStaff Working Paper No. 505. 1982. 91 constrainecl-and labor supply ad- Income Distribution andpages (including references, map). vanced-by inappropriate policies. On Poverty in MexicoStock No. WP 0505. $3. the demandi side, industrial trade pol- Joel Bergsman
kLy, agricultural growth, and the oper-The Distribution of Income in ation of capital markets are discussed; Staff Working Paper No. 395. 9860, 4613razil on the supply side, attention is fo- pages (including references).Guy P. Pfeffermann and Richard cused on population and education Stock No. WP 0395. $3.C. Webb policy. Income Distribution Polio P-Staff Working Paper No. 356. 1979. 226 Oxford University Press, 1981. 242 pages ynhoe DevelpingCountea:Aptages (incluing 2PapperNdixes). 1716(including bibliography, index).thDeloigCu resApages (including 2 appendixes). LC 81-2844. ISBN 0-Z9-520266-X, hard- Case Study of KoreaStock No. WP 0356. $5. cover; ISBN 0-19-520267-8, paperback. Irma Adelman and Sherman
Economic Growth and Stock Nos. OX 520266, $26.95 hardcover; RobinsonEmployment in China OX 520267, $7.95 paperback. Seeks to answer the question of hovEmployment ~~~~~~~~~~~~~~~~much can actually be done to imrov~ eThomas G. Rawski Growth and Equity in Semi-. income distribution by means of da y-Examines how China's agricultural Industrialized Countries namic general equilibrium model frsector has made significant strides to- Joel Bergsinan investigating the potential impaet of
ward full emplovment for a labor force Staff Working Paper No. 351. 1979. 115 standard policy instruments and prO-of nearly half a billion persons. pages (including references). grams intended to improve the reltnive
Oxford University Press, 1979. 208 pages Stock No. WP 0351. $5 and absolute incomes of the poor(including maps, bibliography, index). Oxford University Press, 1978. 3S4 pagesLC 79-19550. ISBN 0-19-520151-5, hard- Growth with Equity: The (including 6 appendixes, index).cover. ISBN 0-19-520152-3, paperback. Taiwan Case LC 76-14269. ISBN 0-19-920084X, kydStock Nos. OX 520251, $18.95 hardcover; John C. H. Fei, Gustav Ranis, and cover. Stock No. OX 920084, $12.50.OX 520152, S7.95 paperback. Shirley W.Y. Kuo Income Inequality and u
Introduces aI method for tracing the in- Methods ofI Estimation adequality of family income to the ine- Pol Appictionsqualitv of various kinds of factor in- Policy Applications
Prices subject to change without notice come and the shares of factor income Nanak C. Kakwaniand may vary by country. in family int.ome. Deals wtith income distribut or rneth-
ods and their economic applications. Labor Productivity: Un Tour A Model for IncomeOxford University Press, 1980. 432 pages d'Horizon Distribution, Employment, and(including bibliography, indexes). Susan Horton and Timothy King Growth: A Case Study ofLC 80-14229. ISBN 0-19-520227-9, Stock Staff Working Paper No. 497. 29821 72 IndonesiaNo. OX 520227, $12.95 paperback. pages (including bibliography). Syamaprasad Gupta
Inequality and Poverty in Stock No. WP 0497. S3. Presents a quantitative framework toexplore the implications of alternative
MaLlaysia: Measurement and policies for investment, emplovment,
Decomposition NEW income distribution, and fiscal activitySudhir Anand for medium-term and long-termAn account of income inequalities and Labor and Poverty growth.povertv in Malavsia. The research is Michael Lipton The Johns Hopkins University Press, 1977.policv oriented and the findings, to Explores factors that enable poor 138 pages (including 5 appendixes, bibliog-which the author's statistical technique households to transform their capacity raphy).is applied, are thoroughly discussed. to produce income in the labor market. LC 76-53909. ISBN 0-8018-1950-4, StockA riange of issues is covered, from data Discusses effect of dependency on No. JH 1950, $5.50 paperback.problems to conceptual questions aris- wage rates and labor duration on un-ing with respect to measurement. employment rates. Also looks at disad- Patterns in Household DemandOxford University Press, 1982. 384 pages vantage factors such as age, sex, caste, and Saving(including bibliography, index). and health. Suggests that access to Constantin Lluch, Alan A. Powell,LC 81-141 78. ISBN 0-19-520153-1, hard- physical and human assets may need and Ross A. Williamscover Stock No. OX 520253, $27.50. to be redistributed to improve labor Studies the evolution of the structure
markets. ~~~~~~~of consumer preferences as a function
International Migrant Workers' Staff Working Paper No. 616. 1983. 160 of economic development.Remittances: Issues and pages. Oxford University Press, 1977. 312 pages
Prospects ISBN 0-8213-0266-3.Stock No. WP 0616. (including bibliography, indexes).
Gurushri Swamy 5 LC 77-3442. ISBN 0-29-920097-1, hard-
Staff Working Paper No. 481. 2981. 64 cover; ISBN 0-19-920100-5, paperback.pages (including 2 appendixes, bibliog- Stock Nos. OX 920097, $22.50 hardcover;raphy). OX 920100, $12.95 paperback.
Stock No. WP 0481. S3- . Stock No. W 048. 3.Poverty and Growth in Kenya_________ Paul Collier and Deepak Lal
NEW Staff Working Paper No. 389. 1980. 76pages (including 2 appendixes, bibliog-
^ w ~~~~~~raphy).Labor-Based Construction rh.
Programs: A Practical Guide Sfor Planning and Management Poverty and Unemployment inBasil Coukis and others India: An Analysis of RecentSummnarizes the basic technical and or- . Evidenceganizational know-how needed to de- Pravin Visanasign and implement labor-based civilworks projects. In this practical, heav- Manpower and International Staff Working Paper No. 417. 1980. 42ilv illustrated manual, decisionmakers Labor Migration in the Middle pages (including statistical annex).and project managers can examine East and North Africa Stock No. WP 0417. $3.sorne new ways of thinking about con- Ismail Serageldin, James A.stnrction and the complexity of these Socknat, Stace Birks, Bob Li, and Public Expenditure inprojects. Ten years of research and Clive A. Sinclair Malaysia: Who Benefits andfield work in nine countries provide anauthoritative base for this guidebook. This study of labor market trends inOx6ord University Press, New Delhi. the region from 1975 to 1985 analvzes Jacob Meerman29m4 392 UniversitygPress, NewDelhithe demand for and supplv of man- A methodologically novel study of the2984. 392 pages. power bv countrv, sector, occupation, household distribution of public serv-
ISBN 19-561511-5, hardcover; ISBN sex, educational level, and ethnic com- ices in relation to incomes. The study19-561512-3, paperback. Stock Nos. OX position. It indicates the sources and examines public spending for educa-561511, $24.95 hardcover; OX 561512, destinations of workers and examines tion, medical care, agriculture, public$12.95 paperback. the social and economic effects of mi- utilities, and welfare transfers and the
gration for both importers and export- use of these services by households.Labor Migration from ers, particularly the implications for Oxford University Press, 1979. 404 pages
Bangladesh to the Middle East government policy and planning. (including map, bibliography, index).Syed Ashraf Ali and others Oxford University Press. 1983. 152 pages LC 79-1122. ISBN 0-19-520096-9, hard-
Staff Working Paper No. 454. 1981. 396 (including appendixes, index). cover; ISBN 0-19-520097-7, paperback.pages (including appendix). ISBN 0-19-520406-9, hardcover. Stock No. Stock Nos. OX 520096, $27.50 hardcover;
Rural Enterprise and Nonfarm skilled labor by examining market con- Who Benefits fromEmployment ditions that cause a significant spread Govemment Expenditure? ADennis Anderson and Mark between economic and market wages. Case Study of ColombiaLeiserson The Johns Hopokins University press, 1977. Marcelo Seiowskv
Examines the importance of rural non- ages (including 5 appendixes, bibliog- Clearlv identifies which income groupsfarm activities as a source of employ- rap-y), benefit from public expenditures andment and income for the poorest LC 76-47398. ISBN 0-8018-1938-5, hard- attempts to separate the factors behindgroups of the world's rural population. cover; ISBN 0-8018-1949-0, paperback. the supplv of and demand for a publicA World Bank Paper. 1978. 87 pages (in- Stock Nos. i 1938, $14 hardcover; JH service as a means of understandingcluding 25 annexes). 1949, 550 paverback. the present pattern of consumption.Stock Nos. BK 9087 (English). BK 9057 The Urban. Labor Market and Oxford University Press, 1979. 202 pages(French), BK 9059 (Spanish). $5. Income Distribution: A Study (including statistical appendix, bibliog-
of Malaysia raphy, index).NEW Dipak Mazumdar LC 79-16384. ISBN 0-19-520098-5. hard-
cover; ISBN 0-19-520099-3, paperback.An integrated analysis of differences in Stock Nos. OX 520098, S20; OX 520099,Saudis in Transition: The income among urban households, the S9.95.
Challenges of a Changing determinants of employment rates ofLabor Market household members, and the major Women in the Urban LaborNaiem A. Sherbinv, Ismail A. factors affecting personal earmings. Markets of Africa: The Case ofSirageldin, and M. Ismail Oxford University Press, 1981. 392 pages TanzaniaSerageldin (including index). Nwanganga Shields
Presents the first svstematic and com- LC 80-24413. ISBN 0-19-520213-9. hard- Staff Working Paper No. 380. 1980. 136prehensive examination of a rapidly cover; ISBN 0 19-520214-7, paperback. pages (including 5 appendixes).changing labor market in a developing Stock Nos. OX 520213, $26; OX 520214, Stock No. WP 0380. $5country that does not face the typical $995Scapital constraints. Using hitherto un-available data on manv labor activitiesand processes in Saudi Arabia, the a-u-thors examine the push of modermitv StayflWorking Papersand the pull of tradition and measuretheir effects on skill formation, wage Staff Working Papers are documents Some 200 Staff Working Papers notlevels, and geographic and occupa- based on research conducted within available from the Bank are availabletional mobilitv. Thev review the basic the Worll Bank or bv its consultants through the National Technical Infor-conceptual and methodological issues on issues affecting the economic and mation Service (NTIS).involved in the analvsis of the Saudi social development of developinglabor market and present a detailed ac- countries. The texts are released in ancount of the dynamics of labor supplv informal manner to make the results ofand demand and the characteristics of this research available quicklv. On av-both the workers and their emplovers. erage, sixty such working papers areOxford Universiry Press. 1984. About 256 issued annually. The pncepages. of a year's output of
StaffWoraing Papers 1,C_'ISBN 0-19-520457-3. July 1984. $22.50 is $180.hardcover,
Size of Land Holding, LivingStandards and Employment inRural Western India, 1972-73 , tPravin Visaria/
Staff Working Paper No. 459. 1981. 117tpages (Including statistical appendix). If
Stock No. WP 0459. $5.
Some Aspects of RelativePovertv in Sri Lanka, 1969-70Pravin VisariabcStaff Working Paver No. 461. 1981. 254 b-
pages (including 5 annexes).
Stock No. WP 0461. $10.
Unskilled Labor for ; ,Development: Its Economic f /Cost fOrville John McDiarmid (Estimates the economic cost of un-
The World BankPublications Order Form
SEND TO: YOUR LOCAL DISTRIBUTOR O:R TO WORLD BANK PUBLICATIONS(See the other side of this form.) P.O. BOX 37525
WASHINGTON, D.C. 20013 U.S.A.
Date
Name _ Ship to: (Enter if different from purchaser)
Title _ Name
Firm _ Title _
Address _ Firm
City State_ Postal Code_ _ Address
Country Telephone ) - City State_ Postal Code_
Purchaser Reference No. _ Country TIlephone
Check your method of payment.Enclosed is my D Check E International Money Order C Unesco Coupons D International Postal Coupon.Make payable to World Bank Publications for U. S. dollars unless you are ordering from your local distributor.
Charge my l VISA El MasterCard E American Express O Choice. (Credit cards accepted only for orders addressedto World Bank Publications.)
Credit Card Account Number Expiration Date Signature
El Invoice me and please reference my Purchase Order No.
Please ship me the items listed below.
Customer InternalStock Number Author/ Title Routing Code Quantity Unit Price Total Amount $
All prices subject to change. Prices may vary by country. Allow 6-8 weeks for delivery.
Subtotal Cost $ -
Thtal copies __ Air mail surcharge if desired ($2.00 each) $
Postage and handling for more than two complimentary items ($2.00 each) $ -
Thtal $ -
IBRD-0053 Thank you for your order.
Distributors of World INDONESIA Attn:Mr. J.M. Herandez
Bank Publications Attn: Mr. Bambang Wahyudi MadridJ1, Dr. Sam Ratulangi No. 37 SRI LANKA AND THE MALDIVESJakarta Pusat Lake House Bookshop
ARGENTINA IRELAND Attn: Mr. Victor WalataraCarlos Hirsch, SRL, TDC Publishers 41 Wad Ramanayake MawathaAttn: Ms. Monica Bustos Attn: Mr. James Booth Colombo 2Florida 165 40 piso 12 North Frederick Street SWEDENGaleria Guemes Dublin 1 ABCE Fritzes Kungl, Hovbokhandel
13uenos Aires 1307 JAPAN Attn: Mr. Eide SegerbackAUSTRALIA, PAPUA NEW GUINEA, Eastern Book Service Regeringsgatan 12, Box 16356FIJI, SOLOMON ISLANDS, Attn: Mr. Terumasa Hirano S-103 27StockholmWESTERN SAMOA, AND 37-3, Hongo 3-Chome, Bunkyo-ku 113 SWITZERLAND'VANUATU Tokyo Librainie PayotThe Australian Financial Review KY Attn: Mr. Henri de PerrotInformation Service (AFRIS) KENYAAtnMrHeidePro
Attn: Mr. David Jamieson Africa Book Services (E.A.) Ltd. 6, rue Grenuslkttn: Mr. David Jamieson Atn r .Dr1211 Geneva235-243 Jones Street Attn: Mr. M.B. Dar121Gnv
KOREA, REPUBLIC OF Attn: Mr. Anthony TheoboldBELGIUM K Maktaba Road, P.O. Box 5299Publications des Nations Unies Pan Korea Book Corporation Dar es SalaamAttn: Mr. jean de Lannoy Attn: Mr. Yoon-Sun KimDaesaam
av. du Roi 202 ~~~~P.O. Box 101, Kwanghwamun THAILAND16v. du Roi 202 Seoul Central Department Store, Head Office
1060 Brussel sMALAYSIA Attn: Mrs. atanaLeANADA University of Malaya Cooperative 306 Silom RoadAte Diffuseur Ve tt Bookshop Ltd. Bangkok
C.P. 85, Boucherville J4B 5E6 Attn: Mr. Mohammed Fahim Htj Thailand Management AssociationC.ue5,Bec hrvleJ4 E Yacob Attn: Mrs. SunanQuebec P.O. Box 1127, Jalan Pantai Baru 308 Silom RoadCOSTA RICA Kuala Lumpur BangkokLibreria Trejos MEXICO UNITED KINGDOM ANDAttn: Mr. Hugo Chamberlain INFOTEC NORTHERN IRELANDCZalle 11-13, Av. Fernandez Guell Attn: Mr. Jorge Cepeda Microinfo Ltd.San Jose San Lorenzo 153-11, Col. del Valle, Attn: Mr. Roy Selwyn
KRosende pns Alle 11 MBE BV UNITED STATESIDK-1970 Copenhagen V. Attn: Mr. Gerhard van Bussell The World Bank Book StoreEGYPT, Arab Republic of Noorderwal 38, 600 19th Street, N.W.Al Ahram 7241 BL Lochem Washington, D.C. 20433Attn: Mr. Sayed El-Gabri NORWAY (Postal address: P.O. Box 37525Al Galaa Street Johan Grundt Tanum A.S. Washington, D.C. 20013, U.S.A.)Cairo Attn: Ms. Randi Mikkelborg Baker and Taylor Company
FINLAND P.O. Box 1177 Sentrum 501 South Gladiola AvenueAkateeminen Kirjakauppa Oslo 1 Momence, Illinois, 60954Attn: Mr. Kari Litmanen PANAMA 380 Edison WayKeskuskatu 1, SF-00100 Ediciones Libreria Cultural Panamena Reno, Nevada, 89564Helsinki 10 Attn: Mr. Luis Fernandez Fraguela R. 50 Kirby Avenue
]FRANCE Av. 7, Espana 16 Somerville, New Jersey, 08876World Bank Publications Panama Zone 1 Commerce, Georgia 3059966, avenue d'1lna PHILIPPINES Bernan Associates75116 Paris National Book Store 9730-E George Palmer Highway
GERMANY, Federal Republic of Attn: Mrs. Socorro C. Ramos Lanham, Maryland, 20761UNO-Verlag 701 Rizal AvenueAttn: Mr. Joachim Krause Manila Blackwell North America, Inc.Simrockstrasse 23 SAUDI ARABIA 1001 Fries Mill RoadD-5300 Bonn 1 Jarir Book Store Blackwood, New Jersey 08012
HONG KONG, MACAU Attn: Mr. Akram Al-Agil Sidney Kramer BooksA~sia 2000 Ltd. P.O. Box 3196 1722 H Street, N.W.Attn: Ms. Gretchen Wearing Smith Riyadh Washington, D.C. 20006o Fl., 146 Prince Edward Road SINGAPORE, TAIWAN, BURMA United Nations Bookshop.Kowloon Information Publications Private, Ltd. United Nations Plaza
[NDIA Attn: Ms. Janet David New York, N.Y. 10017UBS Publishers' Distributors Ltd. 02-06 1st Floor, Pei-Fu Industrial VENEZUELAAttn: Mr. D.P. Veer Building Libreria del Este5 Ansari Road, Post Box 7015 24 New Industrial Road Attn. Mr. Juan PericasNIew Delhi 110002 Singapore Avda Francisco de Miranda, no. 52'Branch offices in Bombay, Bangalore, SPAIN Edificio Galipan, Aptdo. 60.337Kanpur, Calcutta, and Madras) Mundi-Prensa Libros, S.A. Caracas 1060-A
The World Bank
Headquarters European Office Tokyo Office U1818 H Street, N.W. 66, avenue d'Iena Kokusai BuildingWashington, D.C. 20433, U.S.A 75116 Paris, France 1-1 Marunouchi 3-chomeTelephone: (202) 477-1234 Telephone: (1) 723-54.21 Chiyoda-ku, Tokyo 100, JapanTelex: WUI 64145 WORLDBANK Telex: 842-620628 Telephone: (03) 214-5001