Nigeria Economic Report Document of the World Bank No. 2 July, 2014 Public Disclosure Authorized Public Disclosure Authorized Public Disclosure Authorized Public Disclosure Authorized Public Disclosure Authorized Public Disclosure Authorized Public Disclosure Authorized Public Disclosure Authorized
Transcript
Nigeria Economic ReportDocument of the World Bank
No. 2 July, 2014
Pub
lic D
iscl
osur
e A
utho
rized
Pub
lic D
iscl
osur
e A
utho
rized
Pub
lic D
iscl
osur
e A
utho
rized
Pub
lic D
iscl
osur
e A
utho
rized
Pub
lic D
iscl
osur
e A
utho
rized
Pub
lic D
iscl
osur
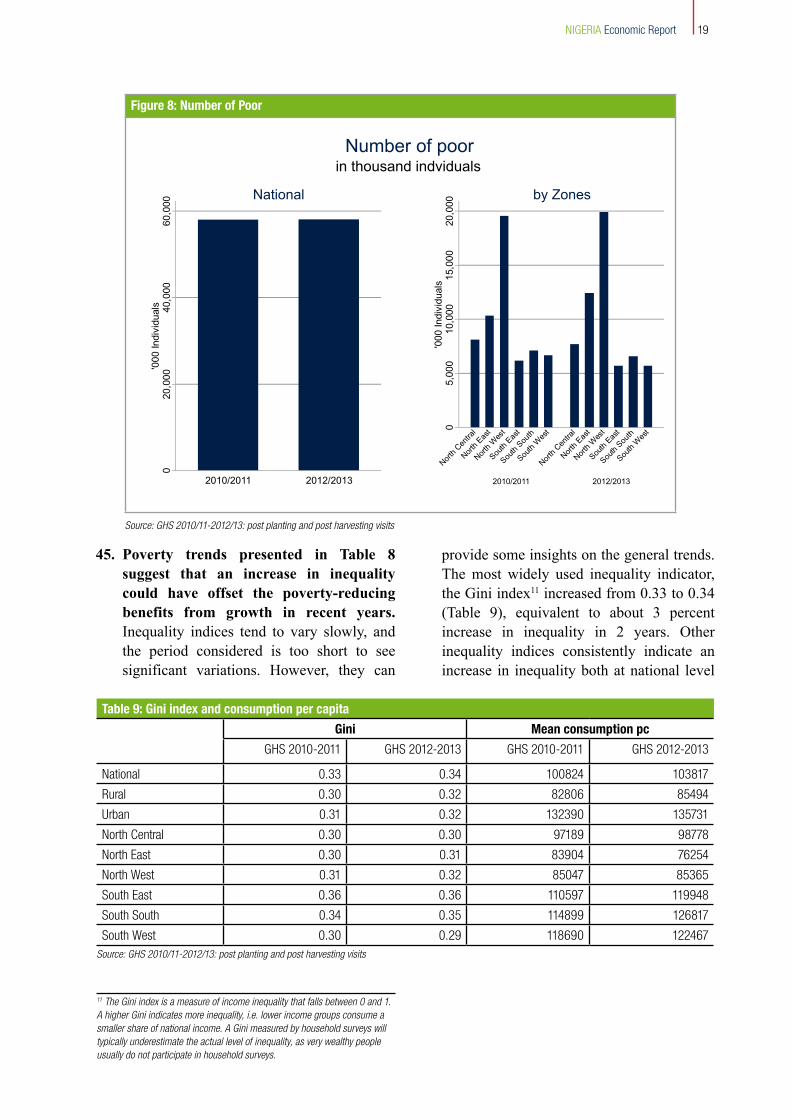
e A
utho
rized
Pub
lic D
iscl
osur
e A
utho
rized
Pub
lic D
iscl
osur
e A
utho
rized
WB469252
Typewritten Text
89630
WB469252
Typewritten Text
WB469252
Typewritten Text
WB469252
Typewritten Text
WB469252
Typewritten Text
WB469252
Typewritten Text
WB469252
Typewritten Text
WB469252
Typewritten Text
WB469252
Typewritten Text
WB469252
Typewritten Text
WB469252
Typewritten Text
WB469252
Typewritten Text
WB469252
Typewritten Text
WB469252
Typewritten Text
WB469252
Typewritten Text
WB469252
Typewritten Text
WB469252
Typewritten Text
WB469252
Typewritten Text
WB469252
Typewritten Text
Nigeria Economic Report
No. 2 July, 2014
Cover photo credit: Bamidele E. Oladokun
IINIGERIA Economic Report
Abbreviations And Acronyms
BoP Balance of PaymentsCBN Central Bank of NigeriaCPI Consumer Price IndexECA Excess Crude Account GDP Gross Domestic ProductGHS General Household SurveyHNLSS Harmonized Nigeria Living Standards SurveyILO International Labor OrganizationIMF International Monetary FundMDA Ministries, Departments and AgenciesNER Nigerian Economic Report NBS National Bureau of Statistics NDHS Nigeria Demographic Health SurveyNNPC Nigerian National Petroleum Corporation OAGF OfficeoftheAccountantGeneraloftheFederationPIB Petroleum Industry BillPPP Purchasing Power Parity SWF Sovereign Wealth FundVAT Value Added Tax
TablesTable 1: Nigeria Gross National Product (Current Prices) ..............................................4 Table 2: Sectoral Shares in Nigeria GDP: 2012 ...........................................................................5Table 3: GDP Growth in Selected Sectors : 2011 – 2013 (New Estimates) ....................................5Table 4: Revenues to the Nigerian Federation Account and VAT Pool ....................................9Table 5: Federal Budgetary Performance: 2012 and 2013 .............................................................11Table 6: The 2014 Federal Budget by MDA Relative to 2013 (Planned and Executed) ............13Table 7: Selected Economic Indicators ........................................................................................14Table8:PovertyRatesPerCapitaFromGHSPanelData...........................................................17Table 9: Gini index and consumption per capita ..............................................................19
FiguresFigure 1: Decomposition of Non-Oil GDP Growth:2013 ...............................................................5Figure 2: Nigeria Oil Production and Exports 2010 – 2012 ..............................................................6Figure 3: Real Crude oil exports .........................................................................................6Figure 4: Nigerian Gross Foreign Reserves ..........................................................................7Figure 5: Gross Direct and Portfolio Foreign Investment in Nigeria: 2010 - 2013 .........................7Figure6:CPIandFoodPriceInflationinNigeria(year-on-year)...................................................8Figure 7: Balance of Nigeria’s Excess Crude Account .......................................................10Figure8:NumberofPoor ..............................................................................................19Figure 9: Distance from poverty line: National and Urban / Rural ...............................20Figure 10: Distance from poverty line by Macro-Region ............................................21
1NIGERIA Economic Report
Nigeria Economic Report
Introductory Note
1. The Nigerian Economic Report (NER) is a regular publication of the World Bank. Each edition of the NER includes a macroeconomic overview and gives special attention to an additional topic of high policy relevance.
2. In addition to macroeconomic performance, this edition of the NER focuses on recent releases of new statistical information. First, newly re-based Gross Domestic Product figures indicate a larger, more diversified, and complex economy in Nigeria than was hitherto reported, with significant contributions to growth coming from manufacturing and some services not captured in previous data. Second, Chapter 2 provides an analysis of recent NBS GHS household survey data, which supports the hypothesis that the larger NBS HNLSS survey of 2009/2010 may have underestimated consumption.
3. NBS GHS surveys from 2010/2011 and 2012/2013 would suggest that the national poverty rate could be significantly lower than indicated by the earlier HNLSS, and that the dynamic of poverty reduction in Nigeria may also be stronger than previously thought. Both the new GDP numbers and GHS-based poverty numbers also support the notion that growth and poverty reduction are primarily an urban phenomenon in Nigeria. It would appear that, in rural areas, growth is slower, poverty is higher, and poverty reduction is slower. The new living standards estimates contained within also imply an even stronger divide between the North and South in Nigeria than do previous figures, with the North experiencing significantly higher poverty and, with the exception of North Central, a lack of recent progress in poverty reduction. In addition, a large number of Nigerians are clustered around the poverty line, implying a high degree of vulnerability for a large part of the population.
4. Together, these new sources of information give a clearer and more consistent story of growth and poverty reduction in Nigeria relative to previous data. It should be noted, however, that this analysis should be considered only partial and preliminary. The conclusions in this Report concerning poverty and living standards will need to be confirmed or refuted by the next comprehensive household budget survey (HNLSS) of 2014-2015 to be conducted by the NBS with assistance from the World Bank and other development partners. The new re-based GDP figures may also undergo further refinement in the near future.
5. This report was prepared by a World Bank team led by John Litwack (Lead Economist). Vasco Molini (Economist) provided the primary analysis for Chapter 2. Contributions were also made by Gloria Joseph-Raji (Economist), and Olayinka Babalola (Economist-Consultant). Nani Makonnen, Ifedolapo Borisade, and Helen Okeke provided technical support.
2NIGERIA Economic Report
Chapter 1: Macroeconomic Overview
Summary
1. Nigeria has faced recent challenges to macroeconomic management related to weakening oil revenues and volatile short-term capital flows. Gross foreign and fiscal reserves declined steadily from April 2013 into the first quarter of 2014. The Government met these challenges with prudent fiscal, monetary, and exchange rate policies, which succeeded in maintaining economic stability, reducing the pace of inflation, and contributing to investor confidence and a stabilization of the balance of payments position in the second quarter of 2014. The planned Revenue Framework and Federal Budget for 2014 suggest a resolve to maintain fiscal prudence in light of lower oil revenues, despite growing pressures in the pre-election environment.
2. A statistical reassessment of national accounts data in the form of a GDP re-basing indicates a quite different size, structure, and sectoral distribution of growth in the Nigerian Economy. The Nigerian economy now appears more diversified, with important sources of growth coming from manufacturing (especially food and beverages) and previously undocumented services (including the entertainment industry). Slower assessed growth in agriculture in the newly re-based GDP figures is consistent with apparently slow recent progress in poverty reduction in rural areas.
3. The oil sector remains a primary source of macroeconomic uncertainty. Given the high dependence of the budgetary and balance of payments positions of the country on oil, changes in prices or in the performance of the oil sector can have a major impact on the macroeconomic picture. A combination of regulatory uncertainty and increasing security challenges in the Niger Delta have limited investment and output in the oil sector in recent years. Declining oil revenues relative to the size of the Nigerian economy are already necessitating fiscal adjustment. Fortunately, the performance of the oil sector and oil revenues has been stronger in the first half of 2014 than during the particularly difficult year of 2013.
4. Despite remaining risks, the prospects for macroeconomic stability are generally good. The stabilization of the balance of payments position and budgetary revenues in the second quarter of 2014 is welcome, and could be perpetuated in part by continual signals from the Government and Central Bank of the maintenance of the current macroeconomic policy stance. On the other hand, the combination of a vulnerable current account due to slow growth in (oil) exports, combined with potentially volatile short term capital flows, imply that the macroeconomic risks in Nigeria remain high. This situation is particularly vulnerable to any large shock to oil prices or output. Accelerated growth and job creation, together with increased State revenues from the non-oil economy, remain critical challenges for stability and welfare improvements over the medium and longer term.
3NIGERIA Economic Report
GDP and Economic Growth
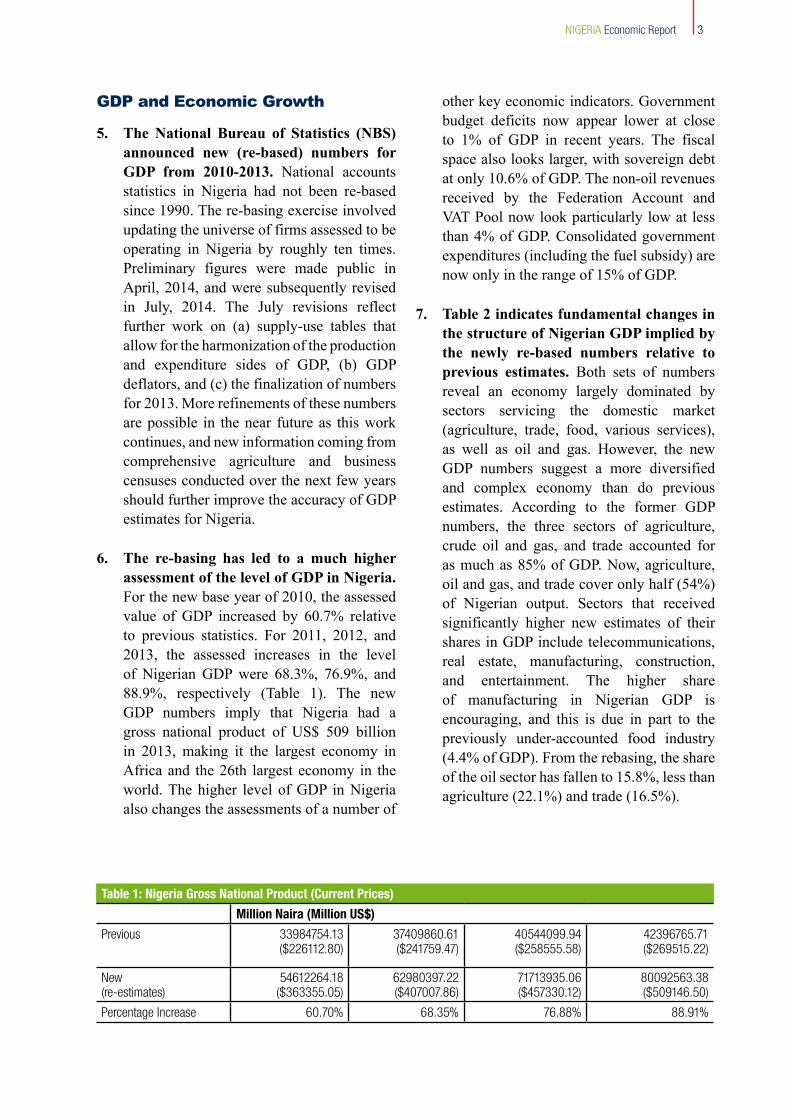
5. The National Bureau of Statistics (NBS) announced new (re-based) numbers for GDP from 2010-2013. National accounts statistics in Nigeria had not been re-based since 1990. The re-basing exercise involved updating the universe of firms assessed to be operating in Nigeria by roughly ten times. Preliminary figures were made public in April, 2014, and were subsequently revised in July, 2014. The July revisions reflect further work on (a) supply-use tables that allow for the harmonization of the production and expenditure sides of GDP, (b) GDP deflators, and (c) the finalization of numbers for 2013. More refinements of these numbers are possible in the near future as this work continues, and new information coming from comprehensive agriculture and business censuses conducted over the next few years should further improve the accuracy of GDP estimates for Nigeria.
6. The re-basing has led to a much higher assessment of the level of GDP in Nigeria. For the new base year of 2010, the assessed value of GDP increased by 60.7% relative to previous statistics. For 2011, 2012, and 2013, the assessed increases in the level of Nigerian GDPwere 68.3%, 76.9%, and88.9%, respectively (Table 1). The newGDP numbers imply that Nigeria had a gross national product of US$ 509 billion in 2013, making it the largest economy in Africa and the 26th largest economy in the world. The higher level of GDP in Nigeria also changes the assessments of a number of
other key economic indicators. Government budget deficits now appear lower at close to 1% of GDP in recent years. The fiscal space also looks larger, with sovereign debt at only 10.6% of GDP. The non-oil revenues received by the Federation Account and VAT Pool now look particularly low at less than 4% of GDP. Consolidated government expenditures (including the fuel subsidy) are now only in the range of 15% of GDP.
7. Table 2 indicates fundamental changes in the structure of Nigerian GDP implied by the newly re-based numbers relative to previous estimates. Both sets of numbers reveal an economy largely dominated by sectors servicing the domestic market (agriculture, trade, food, various services), as well as oil and gas. However, the new GDP numbers suggest a more diversified and complex economy than do previous estimates. According to the former GDP numbers, the three sectors of agriculture, crude oil and gas, and trade accounted for asmuchas85%ofGDP.Now,agriculture,oil and gas, and trade cover only half (54%) of Nigerian output. Sectors that received significantly higher new estimates of their shares in GDP include telecommunications, real estate, manufacturing, construction, and entertainment. The higher share of manufacturing in Nigerian GDP is encouraging, and this is due in part to the previously under-accounted food industry (4.4% of GDP). From the rebasing, the share oftheoilsectorhasfallento15.8%,lessthanagriculture (22.1%) and trade (16.5%).
Table 1: Nigeria Gross National Product (Current Prices)
Million Naira (Million US$)
Previous 33984754.13 ($226112.80)
37409860.61 ($241759.47)
40544099.94 ($258555.58)
42396765.71 ($269515.22)
New (re-estimates)
54612264.18 ($363355.05)
62980397.22 ($407007.86)
71713935.06 ($457330.12)
80092563.38 ($509146.50)
Percentage Increase 60.70% 68.35% 76.88% 88.91%
4NIGERIA Economic Report
8. The magnitude and structure of growth in the Nigerian economy in the newly re-based GDP figures also demonstrate some major differences from previous estimates (Table 3). GDP growth for 2011, 2012, and 2013 in Nigeria is now assessed at 5.3%, 4.2%, and 5.5%, respectively. Non-oil growthaccelerated toanestimated8.4%in2013, but the strong decline in oil and gas (-13.1%) brought down the overall growth rate for the year. The re-based GDP numbers reveal much less concentration of growth in agriculture and telecommunications since 2011 than had been estimated previously, and prescribe higher growth to many other sectors. Notably, this includes manufacturing and the large Nigerian food industry. A number of sectors in manufacturing other than food (plastics and rubber, chemicals, metals) also have high newly estimated growth rates, although the share of these sectors other than food in GDP is still quite small. Plastics and rubber products posted annual growth rates over 30% during 2011-2013. Although this sector still accounts for less than 1% of GDP, it has been an
important source of exports other than oil and gas. Growth in trade and transportation slowed notably in 2012, but revived in 2013. This likely reflects the particular challenges that these sectors faced in 2012: higher transportation costs (reduction in the fuel subsidy), a national strike, heightened security challenges in many parts of the country, and severe flooding in a number of regions.
9. The slower pace of growth in agriculture in the new GDP estimates is consistent with what appears to be slow progress in poverty reduction and welfare improvements in rural areas in Nigeria. Previous estimates of average annual growth in (small scale) agriculture of close to 6% appeared inconsistent with slow poverty reduction in rural areas. This poverty/growth puzzle was highlighted in the previous Nigeria Economic Report of 2013. Following the rebasing, the average annual growth in agriculture from 2011-2013 is now assessed at 4.2%. Growth in agriculture was estimated at 2.9% in each of 2011 and 2013. Considering that population growth
Table 2: Sectoral Shares in Nigeria GDP: 2012
A Comparison of Newly Re-Based and Older GDP Estimates
New Old
Agriculture 22.1 33.1
Crude Oil and Gas) 15.8 37Trade 16.5 15.5Manufacturing 7.4 1.9 of which food & tobacco 4.4 -Construction 3.1 1.3Transportation 1.3 1.6Telecommunications 8.3 0.8
Electricity and Gas 0.5 0.2Finance and Insurance 2.8 1.6Real Estate 7.7 4.5Entertainment, Broadcasting, Motion Pictures, Music
2.0 -
Public Administration 3.1 -Prof., Scientific, and tech. services 3.7 -Other 5.7 2.5
Source: NBS
Table 3: GDP Growth in Selected Sectors : 2011 – 2013 (New Estimates)
A Comparison of Newly Re-Based and Older GDP Estimates
2011 2012 2013
Total 5.3 4.2 5.5
Non-Oil GDP 5.8 5.8 8.4Agriculture 2.9 6.7 2.9Crude Oil and Gas 2.3 -4.9 -13.1Manufacturing 17.8 13.5 21.8 including food, beverages, tobacco
7.3 6.6 11.8
Electricity, Gas, and Utilities 39.5 14.6 14.6Construction 15.7 9.4 14.2
Trade 7.2 2.2 6.6Transportation 6.0 -3.4 3.8Telecommunications and Info Services
1.2 3.7 4.7
Entertainment, Broadcasting, Movies, Music
10.5 1.9 24.1
Real Estate 0.4 5.6 12.0Source: NBS
5NIGERIA Economic Report
The Oil Sector
11. While the re-basing has reduced the estimate of the share of oil and gas in GDP, this sector still accounts for a strong majority of exports and budgetary revenues in the country, and is therefore critical to macroeconomic and budgetary stability. The oil sector has faced a number of challenges in recent years in slower output growth, vandalism and theft, an uncertain regulatory environment, and low levels of investment. The Petroleum Industry Bill, which was intended to clarify and improve regulatory conditions in the industry, has still not been passed into law in light of long standing controversies surrounding various PIB drafts under consideration in the National Assembly.
12. 2013 was a difficult year for the oil and gas sector. Figures provided by the National Oil Company (NNPC), the Central Bank, and the Accountant General of the Federation show oil output and exports to be in steady decline since 2010. 2013 was a particularly difficult year, as several pipelines were temporarily shut down in light of problems related to oil theft. The output of natural gas
in Nigeria is believed to be close to 3%, the new estimates are more consistent with what appears to be persistently high rural poverty.
10. The more diversified structure of Nigerian GDP and the sectoral growth rates in Table 3 imply a more complex story of GDP growth in the country. Figure 1 illustrates the new implied structure of non-oil GDP growth for the year 2013. This can be contrasted with previous estimates that assigned 80% of GDP growth to thethree sectors of trade, agriculture, and telecommunications. As in past estimates, the share of trade remains significant, but has fallen to 13% of non-oil GDP growth. Manufacturing now emerges as the single largest contributing sector to non-oil GDP growth in 2013 (22.1%). Real Estate is the third largest contributor at 11%. The contribution of agriculture is similar to that of the entertainment, broadcasting, movies, and music (7%). Nollywood and the entertainment industry are now thus properly recognized as a significant contributor to GDP growth. A large share of non-oil GDP growth (26%) comes from “other” sectors that comprise mostly services of various types.
Figure 1: Decomposition of Non-Oil GDP Growth:2013
Sources: NBS, World Bank calculations
9
8
7
6
5
4
3
2
1
0GDP Growth 2013
1.9
1.1
0.9
0.60.60.50.40.2
2.2
Manufacturing
Trade
Real Estate
Entertainment, Broadcasting, Movies, Music
Agriculture
Construction
Telecommunications
Finance
Other
was also affected, which had repercussions for electricity production. NNPC assesses crude oil output in 2013 to have averaged 2.18 millionbarrels a day, 5.8% lowerthan the average of 2.39 million barrels a day in 2012, and 9% lower than levels achieved in 2010 (Figure 2). The declining trend concerns exports, as the crude oil handled domestically by NNPC has remained at 450,000 barrels a day. The very strong decline of 13.1% for the oil and gas sector reported in the GDP data above may reflect rising unit costs in the industry due to heightened security concerns
6NIGERIA Economic Report
that could cause value added in oil to fall faster than output.
13. While the decline in oil output in 2013, together with weaker oil prices, is consistent with severe shortfalls in oil revenues to the Federation, as discussed below, trade data tell what might appear to be a different story. Available export
data (FOB/FOB) from the balance of payments would also suggest stronger export performance than indicated by Figure 2. According to this data, the dollar value of oil exports actually increased slightly in 2013 relative to 2012. Since the average export price (Bonny Light) received by Nigerian exporters was weaker in 2013 ($111 dollars a barrel) than in 2012 ($114), this would imply an increase in real oil exports in 2013 by roughly 3.5%. As shown in Figure 3 below, the customs-based export data for oil are largely consistent with the negative dynamic documented in Figure 2, with the notable exception of very high oil exports reported in customs data for the second quarter of 2013. One possible explanation for the discrepancy in the customs export data and the export data reported by NNPC and the Central Bank is that a larger share of the 450000 barrels a day received by NNPC for the domestic market could have actually been exported. Indeed, some of this oil is reportedly exported, including as part of swap agreements for imported refined petroleum. This question should receive further clarification.
The Balance of Payments
14. Following a difficult first part of the year, the Nigerian balance of payments position stabilized in the beginning of the second quarter of 2014. The confidence of investors improved, prompting Fitch to issue a “stable” rating for the country in April. Money demand stabilized and gross external reservesremainedatroughlyUS$38billionduring April and early May. They declined to $37 billion by June, but then increased back to US$ 38 billion in early July. Thisstabilization came after the Naira had come under some pressure earlier in the year.
Figure 2: Nigeria Oil Production and Exports 2010 – 2012 (Million Barrels a Day: Average)
3.02.52.01.51.00.50.0
2010 2011 2012 2013
Domestic market
Exports
Sources: Central Bank and NNPC
Sources: Central Bank BoP data
Figure 3: Real Crude oil exports
120.0100.0
80.060.040.020.0
0.0
Q1
20
10
Q2
20
10
Q3
20
10
Q4
20
10
Q1
20
11
Q2
20
11
Q3
20
11
Q4
20
11
Q1
20
12
Q2
20
12
Q3
20
12
Q4
20
12
Q1
20
13
Q2
20
13
Q3
20
13
Q4
20
13
15. After a period of surplus from September 2011 to March, 2013, the balance of payments moved into deficit for approximately one year through March, 2014. During this time, the gross foreign reserves of the country declined from US$ 49billiontoUS$38billion(Figure4).Thebreakdown in balance of payments data in Nigeria is difficult to interpret, due to very large negative errors and omissions that include both hidden imports and capital flows. However, it would appear that underlying pressures have been coming from the current account due to higher growth in imports than (oil) exports. Since the second half of 2013, pressures also came from a weakening capital account. The pace of reserve depletion increased in early 2014. At that time, auctions of hard currency by the Central Bank at the official exchange rate were consistently oversubscribed, leading to much higher interbank and street exchange rates.
7NIGERIA Economic Report
Figure 5: Gross Direct and Portfolio Foreign Investment in Nigeria: 2010 - 2013
Source: CBN BoP statistics
Figure 4 : Nigerian Gross Foreign Reserves
Source: CBN
0.000
10.000
20.000
30.000
40.000
50.000
60.000(US$ billions)
22
-Dec
-11
22
-Jan
-12
22
-Feb
-12
22
-Mar
-12
22
-Ap
r-1
2
22
-May
-12
22
-Ju
n-1
2
22
-Ju
l-1
2
22
-Au
g-1
2
22
-Sep
-12
22
-Oct
-12
22
-No
v-1
2
22
-Dec
-12
22
-Jan
-13
22
-Feb
-13
22
-Mar
-13
22
-Ap
r-1
3
22
-May
-13
22
-Ju
n-1
3
22
-Ju
l-1
3
22
-Au
g-1
3
22
-Sep
-13
22
-Oct
-13
22
-No
v-1
3
22
-Dec
-13
22
-Jan
-14
22
-Feb
-14
22
-Mar
-14
22
-Ap
r-1
4
22
-May
-14
22
-Ju
n-1
4
16. Other than slow (negative) growth in oil exports, the primary balance of payments development in Nigeria in recent years concerns portfolio investment. The combination of commitment by the Central Bank to a high degree of exchange rate stability and double digit interest rates has made Nigeria a major destination for portfolio
investors since the second half of 2012. As shown in Figure 5, estimated gross portfolio investment to Nigeria amounted to US$ 2.5 billion in 2011, but the size of these inflows mushroomed to US$ 17.2 billion in 2012 and US$ 20.3 billion in 2013. After investing an estimated US$ 13.3 billion in Nigerian debt and equity in the first half of 2013, investors became visibly more cautious in the second half of the year, limiting gross portfolio inflows to US$ 7 billion. Gross reported portfolio outflows also increased somewhat in the second half of 2013, amounting to close to US$ 3 billion. Thus, declines in
portfolio inflows were a major reason why the Nigerian balance of payments slipped into deficit in the second half of 2013 and the Naira came under increasing pressure. Despite weakening oil exports, the huge portfolio inflows in the second half of 2012 and first half of 2013 kept the balance of payments in surplus. However, this
changed as of the second half of 2013. Potentially highly volatile short-term capital flows present an additional macroeconomic risk to Nigeria since 2012. The Central Bank has been considering adjustments in its policies that could reduce volatility in portfolio investment flows.
17. The stabilization of foreign reserves reflects greater confidence among investors. Following a year of decline, foreign reserves stabilized in April-May, 2014 in the context of improved confidence of investors. The precise causes of this stabilization will need to be assessed further when more data becomes available. Yet the partial stabilization of expectations of investors concerning oil prices, fiscal policy, and the commitment of the Central Bank to defending the exchange rate is clearly important. Expectations about the performance of the oil sector have improved
(US$ billions)
8NIGERIA Economic Report
in general, bolstered by increases in oil revenues accruing to Government.
Inflation
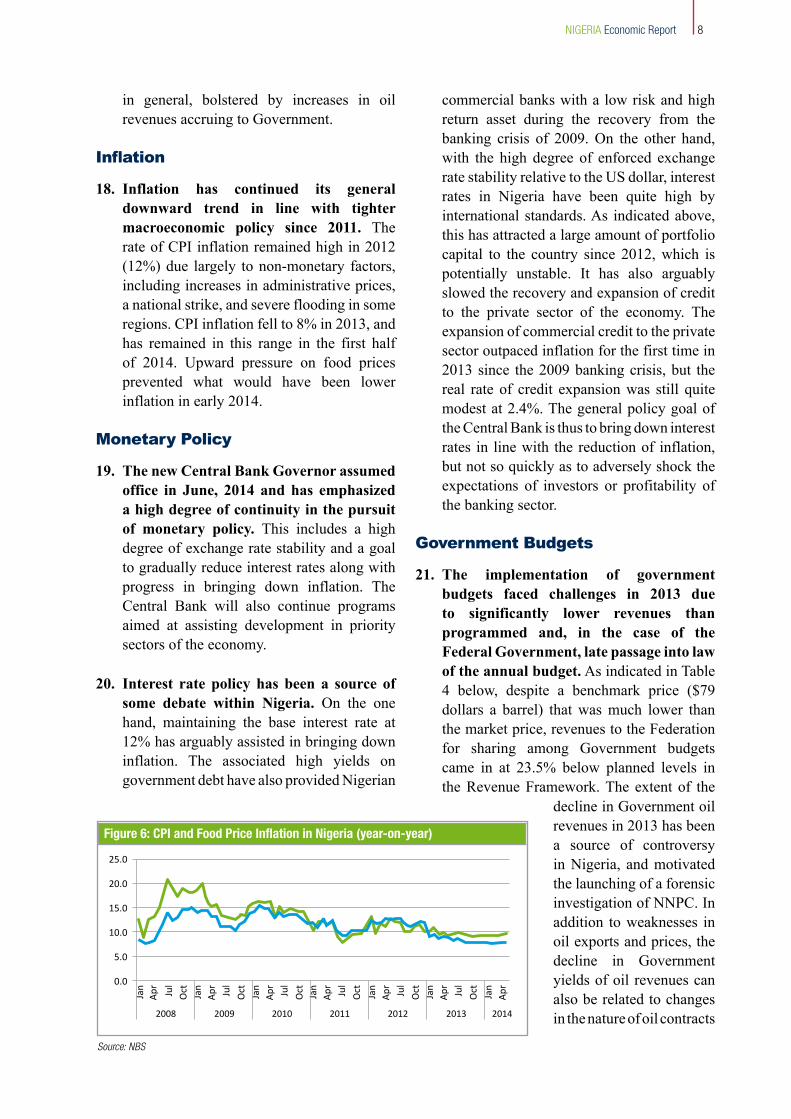
18. Inflation has continued its general downward trend in line with tighter macroeconomic policy since 2011. The rate of CPI inflation remained high in 2012 (12%) due largely to non-monetary factors, including increases in administrative prices, a national strike, and severe flooding in some regions.CPIinflationfellto8%in2013,andhas remained in this range in the first half of 2014. Upward pressure on food prices prevented what would have been lower inflation in early 2014.
Monetary Policy
19. The new Central Bank Governor assumed office in June, 2014 and has emphasized a high degree of continuity in the pursuit of monetary policy. This includes a high degree of exchange rate stability and a goal to gradually reduce interest rates along with progress in bringing down inflation. The Central Bank will also continue programs aimed at assisting development in priority sectors of the economy.
20. Interest rate policy has been a source of some debate within Nigeria. On the one hand, maintaining the base interest rate at 12% has arguably assisted in bringing down inflation. The associated high yields on government debt have also provided Nigerian
commercial banks with a low risk and high return asset during the recovery from the banking crisis of 2009. On the other hand, with the high degree of enforced exchange rate stability relative to the US dollar, interest rates in Nigeria have been quite high by international standards. As indicated above, this has attracted a large amount of portfolio capital to the country since 2012, which is potentially unstable. It has also arguably slowed the recovery and expansion of credit to the private sector of the economy. The expansion of commercial credit to the private sector outpaced inflation for the first time in 2013 since the 2009 banking crisis, but the real rate of credit expansion was still quite modest at 2.4%. The general policy goal of the Central Bank is thus to bring down interest rates in line with the reduction of inflation, but not so quickly as to adversely shock the expectations of investors or profitability of the banking sector.
Government Budgets
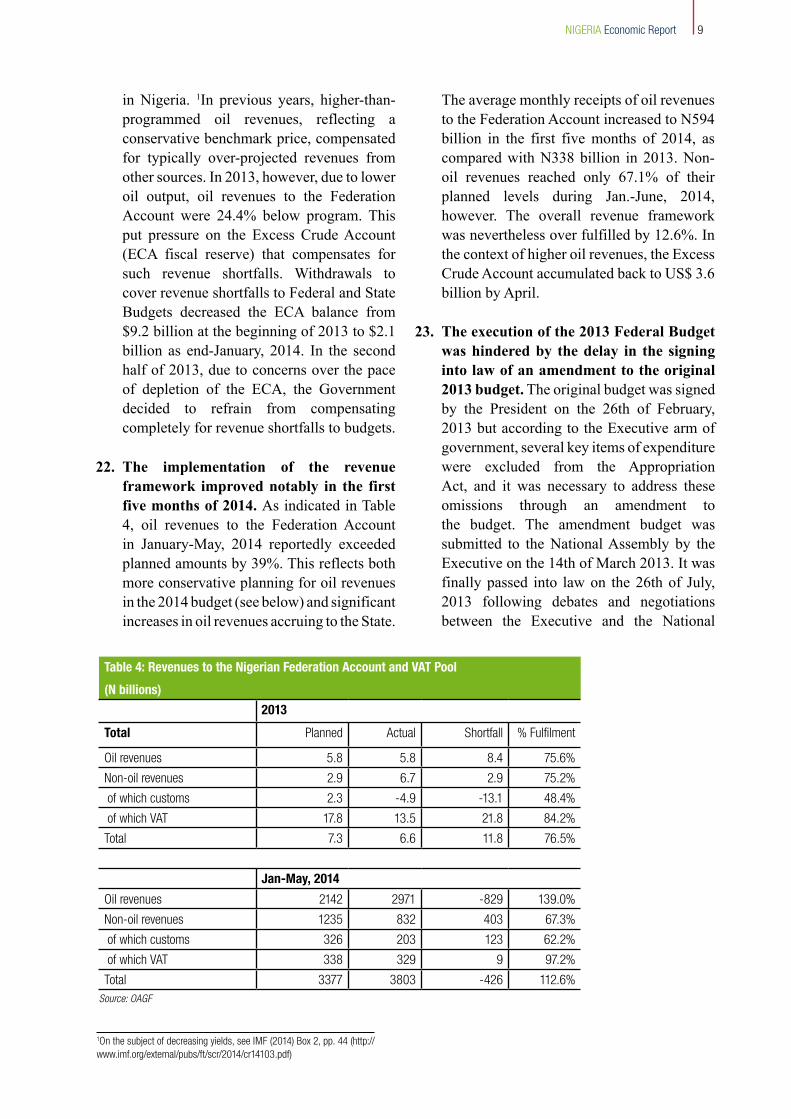
21. The implementation of government budgets faced challenges in 2013 due to significantly lower revenues than programmed and, in the case of the Federal Government, late passage into law of the annual budget. As indicated in Table 4 below, despite a benchmark price ($79 dollars a barrel) that was much lower than the market price, revenues to the Federation for sharing among Government budgets came in at 23.5% below planned levels in the Revenue Framework. The extent of the
Figure 6: CPI and Food Price Inflation in Nigeria (year-on-year)
Source: NBS
25.0
20.0
15.0
10.0
5.0
0.0
Jan
Ap
r
Jul
Oct
Jan
Ap
r
Jul
Oct
Jan
Ap
r
Jul
Oct
Jan
Ap
r
Jul
Oct
Jan
Ap
r
Jul
Oct
Jan
Ap
r
Jul
Oct
Jan
Ap
r
2008 2009 2010 2011 2012 2013 2014
decline in Government oil revenues in 2013 has been a source of controversy in Nigeria, and motivated the launching of a forensic investigation of NNPC. In addition to weaknesses in oil exports and prices, the decline in Government yields of oil revenues can also be related to changes in the nature of oil contracts
9NIGERIA Economic Report
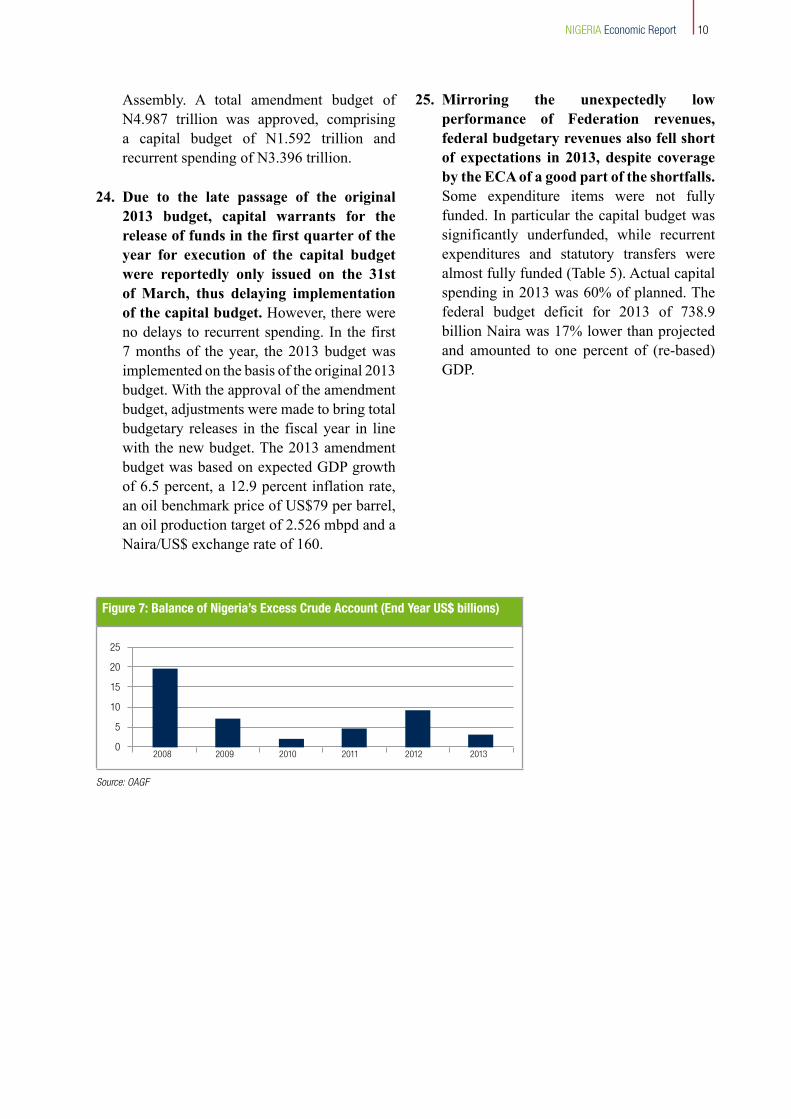
in Nigeria. 1In previous years, higher-than-programmed oil revenues, reflecting a conservative benchmark price, compensated for typically over-projected revenues from other sources. In 2013, however, due to lower oil output, oil revenues to the Federation Account were 24.4% below program. This put pressure on the Excess Crude Account (ECA fiscal reserve) that compensates for such revenue shortfalls. Withdrawals to cover revenue shortfalls to Federal and State Budgets decreased the ECA balance from $9.2 billion at the beginning of 2013 to $2.1 billion as end-January, 2014. In the second half of 2013, due to concerns over the pace of depletion of the ECA, the Government decided to refrain from compensating completely for revenue shortfalls to budgets.
22. The implementation of the revenue framework improved notably in the first five months of 2014. As indicated in Table 4, oil revenues to the Federation Account in January-May, 2014 reportedly exceeded planned amounts by 39%. This reflects both more conservative planning for oil revenues in the 2014 budget (see below) and significant increases in oil revenues accruing to the State.
The average monthly receipts of oil revenues to the Federation Account increased to N594 billion in the first five months of 2014, as comparedwithN338billion in2013.Non-oil revenues reached only 67.1% of their planned levels during Jan.-June, 2014, however. The overall revenue framework was nevertheless over fulfilled by 12.6%. In the context of higher oil revenues, the Excess Crude Account accumulated back to US$ 3.6 billion by April.
1On the subject of decreasing yields, see IMF (2014) Box 2, pp. 44 (http://www.imf.org/external/pubs/ft/scr/2014/cr14103.pdf)
Table 4: Revenues to the Nigerian Federation Account and VAT Pool
(N billions)
2013
Total Planned Actual Shortfall % Fulfilment
Oil revenues 5.8 5.8 8.4 75.6%Non-oil revenues 2.9 6.7 2.9 75.2% of which customs 2.3 -4.9 -13.1 48.4% of which VAT 17.8 13.5 21.8 84.2%Total 7.3 6.6 11.8 76.5%
Jan-May, 2014
Oil revenues 2142 2971 -829 139.0%Non-oil revenues 1235 832 403 67.3% of which customs 326 203 123 62.2% of which VAT 338 329 9 97.2%Total 3377 3803 -426 112.6%
Source: OAGF
23. The execution of the 2013 Federal Budget was hindered by the delay in the signing into law of an amendment to the original 2013 budget. The original budget was signed by the President on the 26th of February, 2013 but according to the Executive arm of government, several key items of expenditure were excluded from the Appropriation Act, and it was necessary to address these omissions through an amendment to the budget. The amendment budget was submitted to the National Assembly by the Executive on the 14th of March 2013. It was finally passed into law on the 26th of July, 2013 following debates and negotiations between the Executive and the National
10NIGERIA Economic Report
25. Mirroring the unexpectedly low performance of Federation revenues, federal budgetary revenues also fell short of expectations in 2013, despite coverage by the ECA of a good part of the shortfalls. Some expenditure items were not fully funded. In particular the capital budget was significantly underfunded, while recurrent expenditures and statutory transfers were almost fully funded (Table 5). Actual capital spending in 2013 was 60% of planned. The federal budget deficit for 2013 of 738.9billion Naira was 17% lower than projected and amounted to one percent of (re-based) GDP.
Figure 7: Balance of Nigeria’s Excess Crude Account (End Year US$ billions)
Source: OAGF
2008 2009 2010 2011 2012 2013
25
20
15
10
5
0
Assembly. A total amendment budget of N4.987 trillion was approved, comprisinga capital budget of N1.592 trillion and recurrent spending of N3.396 trillion.
24. Due to the late passage of the original 2013 budget, capital warrants for the release of funds in the first quarter of the year for execution of the capital budget were reportedly only issued on the 31st of March, thus delaying implementation of the capital budget. However, there were no delays to recurrent spending. In the first 7 months of the year, the 2013 budget was implemented on the basis of the original 2013 budget. With the approval of the amendment budget, adjustments were made to bring total budgetary releases in the fiscal year in line with the new budget. The 2013 amendment budget was based on expected GDP growth of 6.5 percent, a 12.9 percent inflation rate, an oil benchmark price of US$79 per barrel, an oil production target of 2.526 mbpd and a Naira/US$ exchange rate of 160.
11NIGERIA Economic Report
Table 5: Federal Budgetary Performance: 2012 and 2013In Billions of Naira
Billions of Dollars
20122013
20122013
FGNBudget
Actual Budget
Actual as share of budget (%
)Budget
Actual Budget
Actual as share of budget (%
)Budget
Actual Budget (Jan Sept)
Actual as share of budget (%
)Budget
Actual Budget (Jan-Sept)
Actual as share of budget (%
)
Revenue
Share of Federation Account (48.5%
)2,656.43
1,933.6073%
3,228.122,935.17
91%16.60
12.0973%
20.1818.34
91%
Share of VAT Pool (14%)
107.9070.74
66%127.05
106.9384%
0.670.44
66%0.79
0.6784%
Independent Revenue446.78
123.2228%
455.78274.35
60%2.79
0.7728%
2.851.71
60%
Others 1349.90
456.46130%
289.23505.45
175%2.79
2.85130%
1.813.16
175%
Total Inflows
3,561.022,584.03
73%4,100.18
3,821.9193%
22.2616.15
73%25.63
23.8993%
Expenditure
Non-debt Recurrent Expenditure
2,425.051,791.19
74%2,415.74
2,386.8399%
15.1611.19
74%15.10
14.9299%
Personnel Costs1,805.43
1,382.4277%
1,718.231,861.04
108%11.28
8.6477%
10.7411.63
108%
Overheads619.62
408.7766%
697.52525.79
75%3.87
2.5566%
4.363.29
75%
Debt Service 559.58
490.6788%
591.76828.10
140%3.50
3.0788%
3.705.18
140%
Statutory Transfers372.59
235.5363%
388.05387.87
100%2.33
1.4763%
2.432.42
100%
Capital Expenditure1,339.99
445.5633%
1591.66958.00
60%8.37
2.7833%
9.955.99
60%
Total Outflows
4,367.212,962.94
63%4,987.22
4,560.8191%
28.3618.52
63%31.17
28.5191%
Fiscal Balance(1,136.19)
(378.92)33%
(887.04)(738.90)
83%(7.10)
(2.37)33%
5.54(4.62)
83%
Financing Items
1,136.19939.38
83%887.04
1,207.64136%
7.105.87
83%5.54
7.55136%
Domestic Borrowing
744.44694.29
93%577.04
706.74122%
4.654.34
93%3.61
4.42122%
Sharing from ECA
306.76163.59
53%225.00
195.8687%
1.921.02
53%1.41
1.2287%
Others2
85.0081.50
96%85.00
305.04359%
0.530.51
93%0.53
1.91359%
Source: OAGF
12NIGERIA Economic Report
26. The 2014 budget and 2014-2016 Medium Term Fiscal Framework, which were first submitted in draft form to the National Assembly in September, 2013, propose a significant budget tightening in light of recent problems on the revenue side of the budget. The 2014 budget lowers the projection of oil production to 2.39 million barrels a day, as opposed to 2.53 million in the 2013 budget. A benchmark price has been set at US$ 77.5 a barrel. Due to these assumptions, oil revenues for 2014 are programmed at 7.6% lower than in 2013, thereby implying a budgetary tightening at federal and subnational levels. Federal expenditures for 2014 are planned at 6% lower in nominal terms than in the 2013 Federal Budget.
27. The 2014 Federal Budget imposes nominal cuts of 30% in capital budget allocations relative to the Federal Budget of 2013, but planned capital spending is still 16% higher than the actual executed capital budget in 2013. As shown in Table 6, if fully implemented, the 2014 Federal Capital Budget will actually exceed the executed 2013 Federal Capital Budget by 16%. The 30% cuts in planned federal capital allocations in 2014 relative to the 2013 Budget vary from 17.5% (Health) to 47.9% (Ministry of Police Formations and Command). As indicated in Table 6, however, if the 2014 capital budget would be executed 100%, capital spending would actually increase by more than 40% in each of the key Ministries of Health, Education, Agriculture, Transport, Water, Power, Science and Technology, and Works. Planned Federal capital spending in 2014 is lower than the executed Federal Capital Budget in 2013 only for the Ministries of Aviation, Defense, and Police, as well as “Other MDAs, Commissions, and State Bodies.” Capital budget implementation during the first quarter of 2014 was reportedly slow, with only N 165.5 billion of an annual capital budget of N1119.6 billion being released, and N 107.6 billion utilized by MDAs.
Employment and Job Creation
28. The National Bureau of Statistics (NBS) has temporarily ceased publishing figures on unemployment in Nigeria, pending a decision on the adoption of a new official methodology. Previous official estimates of unemployment increased steadily to 23.9% of the active labor force by 2011. However, the official definition of unemployment was quite unusual, including all members of the work force who had not worked 40 hours during the previous week. This definition, which was adopted in 2001 by the National Consultative Committee on Statistics, is currently in the process of being revised.
29. The NBS is now monitoring job creation in the country. A survey conducted by the NBS revealed that the Nigerian economy generated 1,167,740 jobs in 2013. Fifty four percent of these jobs were created in the informal sector, 37% in the formal (private) sector, and 9% in the public sector. The fastest growth in job creation in the formal sector came from trade, real estate, and housing services.
30. The unemployment rate in Nigeria according to a usual (ILO) definition is likely lower than 10%.2 This is the conclusion that comes from unofficial assessments, including that of the NBS, and does not contradict the fact that the scarcity of jobs is economic problem number one in Nigeria. As in many other developing countries, most Nigerians cannot afford to be completely unemployed. Those without good productive employment therefore typically engage in various low productivity and low paying tasks for survival. The employment problem in Nigeria may be better understood as an underemployment problem corresponding to a scarcity of high productivity jobs, and in many cases of highly qualified candidates to fill those jobs. These additional jobs and
2 The internationally accepted ILO definition of unemployment concerns members of the active labor population who are looking for work, and were available for work, but did not work, during a previous reference period (often one week).
13NIGERIA Economic Report
Table 6: The 2014 Federal Budget by MDA Relative to 2013 (Planned and Executed)
APPROVED 2014 BUDGET
Allocations to Ministries, Departm
ents and Agencies (MDAs)
2014
S/NM
DA RECURREN
TCAPITAL
TOTAL ALLOCATION
2014 RECURREN
T AS SHARE OF M
DA ALLOCATION
2014 RECURREN
T AS SHARE OF M
DA ALLOCATION
TOTAL 2014 MDA
ALLOCATION AS SHARE OF N
ATIONAL
BUDGET
CHANGE IN TOTAL BUDGET 2014 BUDGET TO 2013 BUDGET)
CHANGE IN CAPITAL BUDGET (2014 BUDGET TO 2013 BUDGET)
CHANGE IN CAPITAL BUDGET (2014 BUDGET TO 2013 EXECUTED BUDGET)
Billions of Naira%
Percentage
1M
inistry of Health214.95
49.54264.48
81%19%
6%-6.4%
-17.5%48.5%
2M
inistry of Education373.53
50.78424.31
88%12%
9%-3.0%
-28.7%49.1%
3M
inistry of Agriculture31.49
35.5567.04
47%53%
1%-20.0%
-29.9%42.7%
4M
inistry of Transport8.19
31.8140.00
20%80%
1%-24.3%
-28.6%59.5%
5M
inistry of Water Resources
7.7144.21
51.9115%
85%1%
-41.2%-45.0%
47.3%
6M
inistry of Power3.40
59.8163.21
5%95%
1%-18.5%
-18.5%51.2%
7M
inistry of Mines & Steel Developm
ent 10.58
2.1812.76
83%17%
0%-7.0%
-35.6%12.6%
8M
inistry of Petroleum Resources
55.716.22
61.9390%
10%1%
1.7%-27.5%
145.5%
9M
inistry of Aviation6.15
26.1632.31
19%81%
1%-41.1%
-45.9%-8.1%
10M
inistry of Science & Technology23.92
13.0136.94
65%35%
1%-4.5%
-20.4%68.4%
11Defence/M
OD/Army/Air force/ Navy
314.3535.36
349.7190%
10%7%
-4.0%-40.3%
-11.2%
12M
inistry of Police Formations & Com
mand
295.567.34
302.9098%
2%6%
-3.7%-47.9%
-8.4%
13M
inistry of Youth Development
75.965.04
80.9994%
6%2%
-7.3%-37.6%
28.1%
14M
inistry of Works
27.41106.32
133.7320%
80%3%
-30.1%-35.4%
45.6%
15M
inistry of Environment
14.148.97
23.1161%
39%0%
-15.2%-33.3%
185.2%
16Allocation to other M
DAs, Comm
issions and State bodies 502.56
242.87745.43
67%33%
16%-11.0%
-28.7%-38.5%
17Allocation for Debt Service
n/an/a
712.00n/a
n/a15%
20.3%n/a
n/a
18Allocation for Statutory Transfers
n/an/a
408.69n/a
n/a9%
5.3%n/a
n/a
19Consolidated Revenue Fund Charges (Service W
ide Votes, Capital Supplem
entation, Pension & Gratuities) 489.29
394.44883.73
55%45%
19%-11.1%
-26.2%76.5%
Grand Total2,454.89
1,119.614,695.19
52%24%
100%-6%
-30%16%
Source: OAGF
14NIGERIA Economic Report
qualifications need to be created in Nigeria through accelerated private sector growth in the cities and improvements in the country’s education system.
Economic Outlook
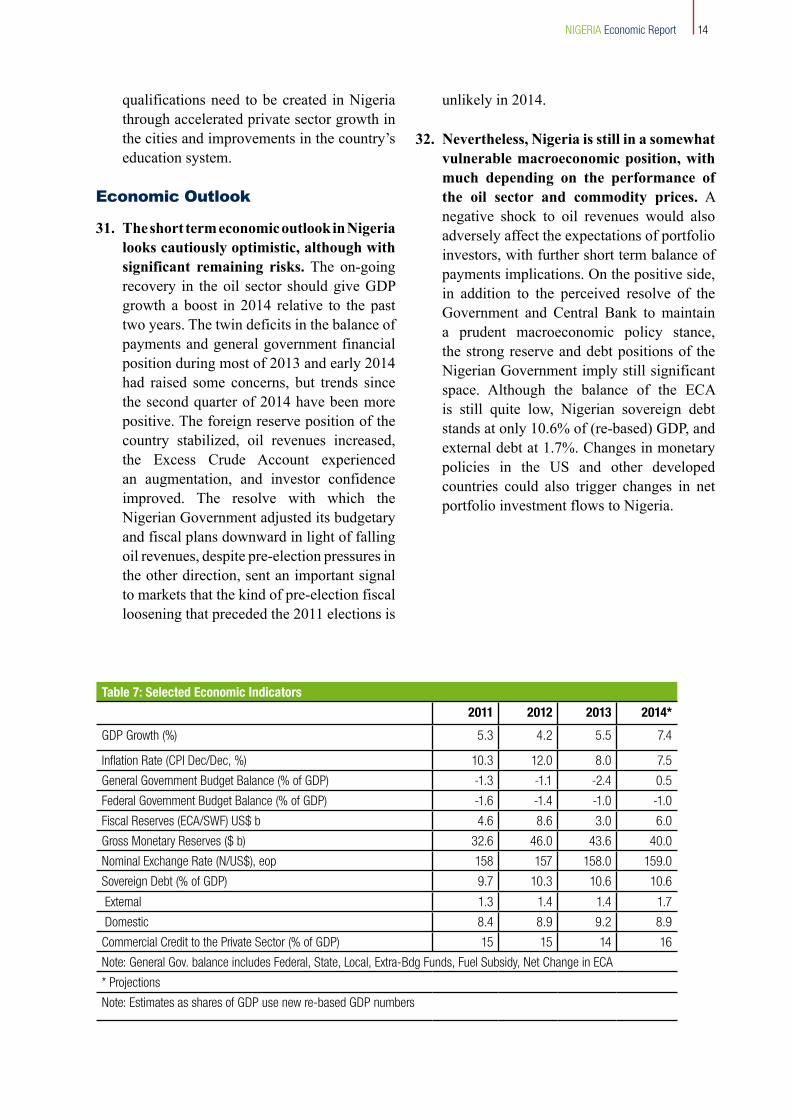
31. The short term economic outlook in Nigeria looks cautiously optimistic, although with significant remaining risks. The on-going recovery in the oil sector should give GDP growth a boost in 2014 relative to the past two years. The twin deficits in the balance of payments and general government financial position during most of 2013 and early 2014 had raised some concerns, but trends since the second quarter of 2014 have been more positive. The foreign reserve position of the country stabilized, oil revenues increased, the Excess Crude Account experienced an augmentation, and investor confidence improved. The resolve with which the Nigerian Government adjusted its budgetary and fiscal plans downward in light of falling oil revenues, despite pre-election pressures in the other direction, sent an important signal to markets that the kind of pre-election fiscal loosening that preceded the 2011 elections is
unlikely in 2014.
32. Nevertheless, Nigeria is still in a somewhat vulnerable macroeconomic position, with much depending on the performance of the oil sector and commodity prices. A negative shock to oil revenues would also adversely affect the expectations of portfolio investors, with further short term balance of payments implications. On the positive side, in addition to the perceived resolve of the Government and Central Bank to maintain a prudent macroeconomic policy stance, the strong reserve and debt positions of the Nigerian Government imply still significant space. Although the balance of the ECA is still quite low, Nigerian sovereign debt stands at only 10.6% of (re-based) GDP, and external debt at 1.7%. Changes in monetary policies in the US and other developed countries could also trigger changes in net portfolio investment flows to Nigeria.
Table 7: Selected Economic Indicators
2011 2012 2013 2014*
GDP Growth (%) 5.3 4.2 5.5 7.4
Inflation Rate (CPI Dec/Dec, %) 10.3 12.0 8.0 7.5General Government Budget Balance (% of GDP) -1.3 -1.1 -2.4 0.5Federal Government Budget Balance (% of GDP) -1.6 -1.4 -1.0 -1.0Fiscal Reserves (ECA/SWF) US$ b 4.6 8.6 3.0 6.0Gross Monetary Reserves ($ b) 32.6 46.0 43.6 40.0Nominal Exchange Rate (N/US$), eop 158 157 158.0 159.0Sovereign Debt (% of GDP) 9.7 10.3 10.6 10.6
External 1.3 1.4 1.4 1.7 Domestic 8.4 8.9 9.2 8.9Commercial Credit to the Private Sector (% of GDP) 15 15 14 16Note: General Gov. balance includes Federal, State, Local, Extra-Bdg Funds, Fuel Subsidy, Net Change in ECA* ProjectionsNote: Estimates as shares of GDP use new re-based GDP numbers
15NIGERIA Economic Report
33. Over the medium and longer term, Nigeria’s future prosperity will depend critically on improvements in non-oil growth and non-oil government revenues. While Nigeria still possesses substantial oil and gas reserves, oil revenues will likely continue to shrink relative to the size of the Nigerian economy over the medium term. As concluded in the previous Nigeria Economic Report, this should occur even in the event of an optimistic scenario with respect to oil output and prices. However, current consensus expectations are for weaker oil prices over the medium term, and the prospects for a sustained recovery in oil
output are currently uncertain. Maintaining or increasing the finance of public services in Nigeria will entail rapid growth of non-oil sources of revenues. The Nigerian economy has experienced substantial economic growth in recent years. The quality and quantity of this growth has nevertheless proved so far insufficient to generate the productive jobs needed by a young and rapidly growing population. Chapter 2 of this Report, which examines patterns in poverty and living standards in Nigeria, supports the primary importance of urban growth for achieving this goal.
16NIGERIA Economic Report
Chapter 2: Poverty In Nigeria: A Partial Reassessment34. Recently announced re-based GDP
figures that increase the estimated size of the Nigerian economy have again drawn attention to official poverty statistics. Data from the last comprehensive household survey (NHLSS) in 2009/2010 indicated that the official poverty rate3 remained stubbornly high at 46% of the population (adult equivalent approach)4, or 62% in strictly per capita terms. This indicates only a slight decline from 48% and 64%, respectively,that were recorded from the NHLSS in 2003/2004. These poverty numbers raise two major economic questions. Firstly, why has the rapid economic growth in Nigeria not generated greater poverty reduction? Second, how could an economy of the size and wealth of Nigeria have such high poverty rates? The country’s performance is at odds with the general international trend of poverty reduction, in particular in other countries experiencing rapid economic growth like Nigeria.
35. It appears increasingly likely that consumption of Nigerians was underestimated in the 2009/2010 NHLSS. A World Bank report of 20135 raised the hypothesis that consumption may have been significantly underestimated in the 2009/2010 NHLSS. This report noted an unusual sharp decline in monthly consumption in this
survey in early 2010 relative to the second half of 2009 that would seem to have little economic rationale. The newly re-based GDP numbers increase suspicions in this regard, as the average level of consumption reported in this survey would appear to be inconsistent with the newly estimated size of the Nigerian economy.
36. This Chapter provides a partial reassessment of poverty in Nigeria based on recent information. This note makes use of new National Bureau of Statistics (NBS) data has become available on the web from two smaller General Household Surveys (GHS) in panel format6 conducted in 2010/2011 and 2012/2013. It should be emphasized that this reassessment is only a very partial analysis, and its confirmation or refutation will need to come from the next comprehensive HNLSS in 2014/2015 by NBS.
37. For the GHS-panel survey used for the estimations below, 5000 households were interviewed. The sample is representative at the macro-regional level in the same sense as the HNLSS. It is not representative at the State level, however. There are also some important differences in methodology that prevent the direct comparison of results from the GHS with the HNLSS. For example, the HNLSS gathers consumption data from households for an entire year, whereas the GHS covers activities only at two times: post planting (Sept.-Oct.) and post harvesting (April-May)7. In addition, consumption data were collected for the GHS using a 7-day recall period, whereas the HNLSS uses a diary. To calculate final aggregates, consumption figures were averaged over the two visits in order to proxy households’ annual consumption patterns irrespective of
3 The national poverty line in 2010 was about 53674 Naira based on consumption of 3000 calories a day. 4 The adult equivalent approach accounts for the fact that children need less calories than adults. 5 See “Where Has All the Growth Gone? A Poverty Update for Nigeria” WB. 2013. 6 The same households were interviewed in both rounds 7 Consumption figures were averaged over the two visits in order to proxy households’ annual consumption patterns irrespective of seasonal variations. Averaging consumption over the two visits has one important limitation in reducing substantially the standard deviation of the distributions. Therefore,the Gini index and all the inequality measures should be considered as lower bound estimates.
17NIGERIA Economic Report
seasons, and then deflated spatially using a zone level price deflator calculated from the GHS survey itself.
38. A poverty line was calculated from the GHS panel data based on the same number of calories (3000) as used for the official Nigerian definition of poverty. This generated a poverty line at 180Nairaper capita per day in 20108. If an adjustment is made for purchasing power parity (PPP), the line becomes 1.4 dollars per capita per day, very close to the 1.25 dollars PPP line used by the World Bank for international comparisons.
Poverty and inequality in the GHS panel
39. Poverty figures computed from the GHS panel (Table 8) support the hypothesis that poverty rates in Nigeria are significantly lower than estimates based on the 2009/2010 HNLSS. At the national level, the GHS-computed per capita poverty rate registers at 35.2 and 33.1 percent of the population in 2009/2010 and 2012/2013, respectively. This can be compared with the 2009/2010 per capita estimate of 62% based on the HNLSS. Reflecting significantly higher GDP per capita in Nigeria, these new poverty rates, in contrast to previous estimates, are lower than those in neighboring countries such as Benin and Niger.9
Box 1: Household Surveys Conducted by the National Bureau of Statistics
Short Name
Full Name Periodicity Sample Size Consumption Data
HNLSS Part A (Welfare) Part B (Consumption)
Every 5 years (2003/4, 2009/10) Every 5 years (2003/4, 2009/10)
77,400 HH (100 per LGA) 38,700 HH (50 per LGA)
One-year diary
GHS GHS Survey GHS-Panel
Every year Every other year
22,000 HH 5,000 HH (10 HH per 500 EA)
Information collected twice
Table 8: Poverty Rates Per Capita From GHS Panel Data (% of Population)
Poverty headcount Diff Poverty gap Poverty severity Poverty headcount
Source GHS 2010/11-2012/13: post planting and post harvesting visits *Data are not directly comparable to GHS results. They are presented just for illustrative purposes.
8 On an annual basis, the line is 65804 Naira per capita in 2010 prices 9 The last available poverty rates using the $1.25 line per capita are for Niger 43.6% (2008) and Benin 47.3% (2003).
18NIGERIA Economic Report
40. The new estimates suggest a strong divide between the North and South of Nigeria in poverty and poverty reduction. As indicated inTable8,theGHSdatawouldsuggestthatall three Southern macro-regions, together with the North Central region, experienced declines in estimated poverty rates between 2010-2013. By contrast, poverty increased in the North East and remained largely unchanged in the North West. The contrast in absolute levels of poverty in different macro-regions is also striking, with the South West experiencing the lowest poverty rate of 16% in 2012-2013, while an estimated 50.2% of the population lives below the poverty line in the North East. The North West and North East together account for the majority (52%)of poor Nigerians. Adding also the North Central, it appears that about 66% of the poor reside in the Northern part of the country.
41. The contrast between urban and rural areas in the new estimates with respect to poverty is also striking. As indicated in Table8,urbanareasinNigeriaonaggregateexperience both a significantly lower poverty rate and measurable progress in poverty reduction, while poverty remains high in rural areas. The interpretation of these results is complicated by the fact that the last urban-rural classification in Nigeria dates from 1991. A number of areas classified as rural in 1991 may be urban today. Nevertheless, this result fits very well the State-by-State patterns in the HNLSS that suggest urbanization and urban growth to be a primary driver of poverty reduction in Nigeria.
42. Slow progress in poverty reduction in rural areas is consistent with revised agricultural growth rates from the GDP rebasing. A particular puzzle identified in the previous Nigeria Economic Report concerns the contrast between very rapid estimated growth in (small scale) agriculture in the last decade of close to 6% and apparent little progress in poverty reduction in rural areas. The GDP rebasing has so far produced new growth rates for the years 2011-2013, and suggests that growth in agriculture averaged
4.2 percent during this period. Growth fell to under 3% in each of 2011 and 2013, close to national population growth rate.
43. The number of Nigerians living in poverty is not decreasing. Due to rapid annual population growth averaging about 3 percent, Nigeria needs to experience a strong reduction in the poverty rate in order to reduce the absolute number of the poor. The new estimates presented above would imply that the number of poor Nigerians did not decrease between 2010/2011 and 2012/2013, remaining at 58 million (Figure 8). Inaddition, the number of poor people living in the Northern part of Nigeria is increasing, while the number of poor in Southern Nigeria is decreasing.
44. As with the previous HNLSS estimates, analysis based on the GHS panel data indicates an increase in inequality and income polarization in Nigeria.10 This is the subject of an additional forthcoming World Bank report. In the last decade, while average per capita consumption increased, income distribution became more unequal. Also, a clear rise in polarization is detected. Compared to 10 years ago, the concentration of households in the middle of the Nigerian income distribution diminished, with increased clustering in the highest and lowest deciles. This change had a clear spatial characterization. Northern households increasingly occupied bottom deciles of the national income distribution while Southern households increasingly moved upward. The overall impact was a general hollowing out of the distribution center and a further accentuation of the North/South divide, with relatively well-off households living in the South and relatively poorer concentrating the North.
10 In income-polarized societies, people cluster around group means and tend to be far from the mean/median of the overall distribution. As a consequence, the middle class in polarized societies struggles to consolidate its position.
19NIGERIA Economic Report
45. Poverty trends presented in Table 8 suggest that an increase in inequality could have offset the poverty-reducing benefits from growth in recent years. Inequality indices tend to vary slowly, and the period considered is too short to see significant variations. However, they can
provide some insights on the general trends. The most widely used inequality indicator, the Gini index11 increased from 0.33 to 0.34 (Table 9), equivalent to about 3 percent increase in inequality in 2 years. Other inequality indices consistently indicate an increase in inequality both at national level
Figure 8: Number of Poor
Source: GHS 2010/11-2012/13: post planting and post harvesting visits
020,0
00
40,0
00
60,0
00
'000
Indiv
iduals
2010/2011 2012/2013
National
05,0
00
10,0
00
15,0
00
20,0
00
'000
Indiv
iduals
2010/2011 2012/2013
Nor
thCen
tral
Nor
thEas
t
Nor
thW
est
South
East
South
South
South
Wes
t
Nor
thCen
tral
Nor
thEas
t
Nor
thW
est
South
East
South
South
South
Wes
t
by Zones
in thousand indviduals
Number of poor
11 The Gini index is a measure of income inequality that falls between 0 and 1. A higher Gini indicates more inequality, i.e. lower income groups consume a smaller share of national income. A Gini measured by household surveys will typically underestimate the actual level of inequality, as very wealthy people usually do not participate in household surveys.
National 0.33 0.34 100824 103817Rural 0.30 0.32 82806 85494Urban 0.31 0.32 132390 135731North Central 0.30 0.30 97189 98778North East 0.30 0.31 83904 76254North West 0.31 0.32 85047 85365South East 0.36 0.36 110597 119948South South 0.34 0.35 114899 126817South West 0.30 0.29 118690 122467
Source: GHS 2010/11-2012/13: post planting and post harvesting visits
20NIGERIA Economic Report
and in rural areas. The Gini also increased in the North West and North East, both areas that experience high poverty. By contrast, the South West apparently experienced some reduction in inequality. This is consistent with the official HNLSS data that indicated very rapid and inclusive consumption growth in Lagos State.
46. The lack of progress in poverty reduction in the North West and North East can be related to both a stagnation in average consumption and increasing inequality. According to the GHS panel data, between 2010/2011 and 2012/2013, the average real consumption of Nigerians grew by less than 3%, and again exhibited a high variance across macro-regions. Average real consumption in the South South grew in real terms by 10%, theSouthEastexperienced8%growth,andSouth West about 4%. On the other hand, the other two upper Northern zones did not experience growth in average consumption and inequality increased, which explains the
worsening of poverty figures. In the North East, average consumption declined.
47. A significant number of Nigerians live close to the poverty line, particularly in rural areas. Figure 9 presents the full distribution of living standards as implied by the analysis of the GHS panel. These distributions are quite similar for 2010/2011 and 2012/2013. The horizontal axis represents consumption measured as a percentage of the poverty line. The vertical axis represents the share of the population. Thus, a distribution farther to the right indicates higher welfare for the population.
48. A large share of the Nigerian population appears vulnerable to poverty. As indicated bythenationallineinFigure9,58%ofthepopulation lives under 140% of the poverty line. In rural areas, this number reaches almost 70%. By contrast, this number for urban areas is 30%, and some improvement is visible in 2012/2013 relative to 2010/2011.
Figure 9: Distance from poverty line: National and Urban / Rural
Source: GHS 2010/11-2012/13: post planting and post harvesting visits
0.2
.4.6
.81
20 40 60 80 100 120 140 160 180 200 220 240
% of Poverty Line
2011 2013
National
0.2
.4.6
.81
20 40 60 80 100 120 140 160 180 200 220 240
% of Poverty Line
Rural 11 Rural 13
Urban 11 Urban 13
Urban and Rural
Consumption per capita
Distance from poverty line
21NIGERIA Economic Report
If converted into internationally comparable PPP terms, 140% of the poverty line is close to $2 a day. Thus, for the case of national and rural populations, a small standard of living shock could potentially put many more Nigerians in this group below the poverty line. Conversely, a large share of the Nigerian poor are close to the poverty line, implying that small standard of living increases for this group could reduce the estimated poverty rate significantly.
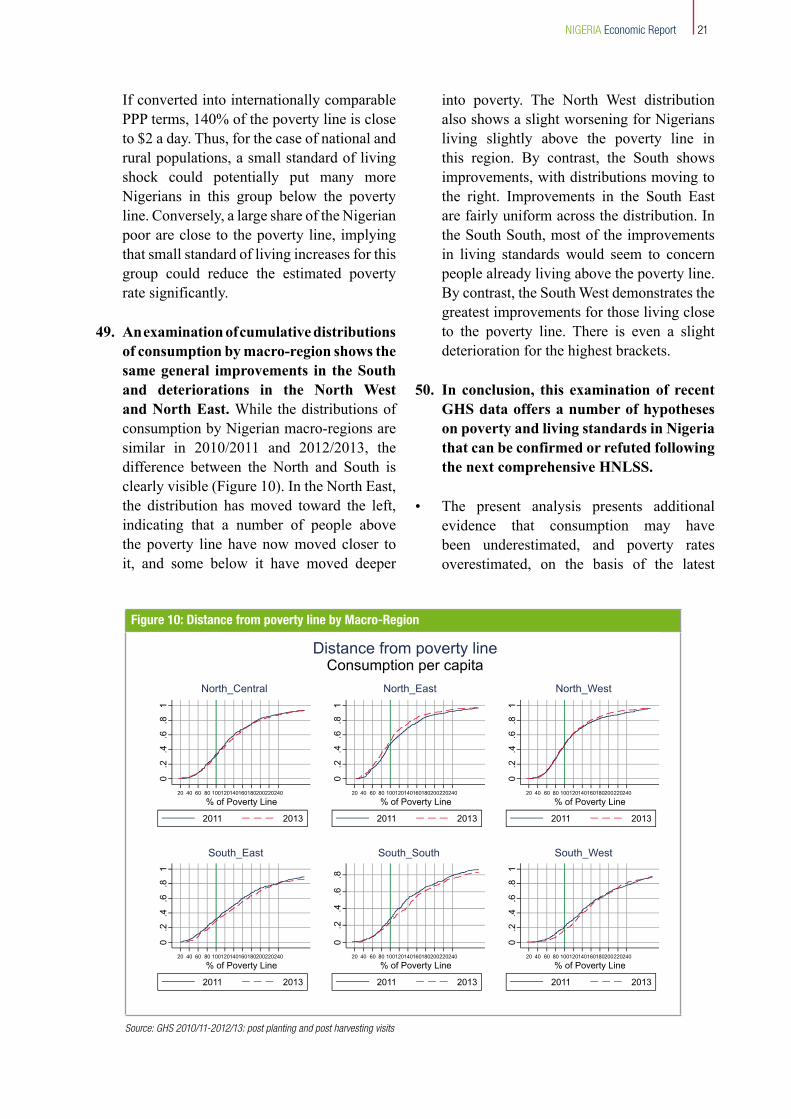
49. An examination of cumulative distributions of consumption by macro-region shows the same general improvements in the South and deteriorations in the North West and North East. While the distributions of consumption by Nigerian macro-regions are similar in 2010/2011 and 2012/2013, the difference between the North and South is clearly visible (Figure 10). In the North East, the distribution has moved toward the left, indicating that a number of people above the poverty line have now moved closer to it, and some below it have moved deeper
into poverty. The North West distribution also shows a slight worsening for Nigerians living slightly above the poverty line in this region. By contrast, the South shows improvements, with distributions moving to the right. Improvements in the South East are fairly uniform across the distribution. In the South South, most of the improvements in living standards would seem to concern people already living above the poverty line. By contrast, the South West demonstrates the greatest improvements for those living close to the poverty line. There is even a slight deterioration for the highest brackets.
50. In conclusion, this examination of recent GHS data offers a number of hypotheses on poverty and living standards in Nigeria that can be confirmed or refuted following the next comprehensive HNLSS.
• The present analysis presents additionalevidence that consumption may have been underestimated, and poverty rates overestimated, on the basis of the latest
Figure 10: Distance from poverty line by Macro-Region
Source: GHS 2010/11-2012/13: post planting and post harvesting visits
0.2
.4.6
.81
20 40 60 80 100120140160180200220240
% of Poverty Line
2011 2013
North_Central
0.2
.4.6
.81
20 40 60 80 100120140160180200220240
% of Poverty Line
2011 2013
North_East
0.2
.4.6
.81
20 40 60 80 100120140160180200220240
% of Poverty Line
2011 2013
North_West
0.2
.4.6
.81
20 40 60 80 100120140160180200220240
% of Poverty Line
2011 2013
South_East
0.2
.4.6
.8
20 40 60 80 100120140160180200220240
% of Poverty Line
2011 2013
South_South
0.2
.4.6
.81
20 40 60 80 100120140160180200220240
% of Poverty Line
2011 2013
South_West
Consumption per capitaDistance from poverty line
22NIGERIA Economic Report
2009/2010 HNLSS survey. Poverty rates estimated from GHS data are significantly lower than current official rates based on the HNLSS. These rates are more consistent with the size, wealth, and growth of the Nigerian economy
• The GHS data would also suggest thatpoverty reduction in Nigeria is primarily an urban phenomenon, with significant poverty concentrated in rural areas. This is also consistent with what would appear to be slower estimated growth rates in agriculture coming out of the GDP rebasing exercise.
• Thepresentanalysisechoesandstrengthensthe conclusions coming out of the HNLSS data on strong disparities between the Northern and Southern parts of the country. While the HNLSS data show much higher poverty in the North, the GHS data suggest that the South may be experiencing a much more positive dynamic in poverty reduction, and that the North East has experienced a significant worsening in poverty and living standards.
• The SouthWest region appears to be in aparticularly advantageous position, with a significantly lower poverty rate, the fastest poverty reduction dynamic, and a more equitable distribution of income (at least excluding the super-rich who are not in the GHS sample).
51. An emerging possibly clearer picture of the evolution of poverty and living standards in Nigeria has implications for economic policy and development in the country. This topic is largely out of the scope of this Chapter, but several preliminary observations can be made:
• The North/South divide in poverty andpoverty reduction is a regrettable trend that can hopefully be reversed. The current deterioration or stagnation in poverty reduction in the North East and North West
is likely related to the security situation in this part of the country. This particularly concerns the visible deterioration in living standards in the North East. The much higher absolute levels of poverty in the North also reflect other differences: (a) a relatively low level of many public services and (b) a relative remoteness from ports and current points of economic agglomeration in Nigeria. Research in economics continues to stress the high value of basic education for increasing the probability of productive employment. Over 90% of children in the Southern part of Nigeria between ages 6-16 attend school, while this is only true for less than half of children in the North West and North East.12 Health indicators show a similar divide. For example, immunization rates of 14% and 21% in the North West and North East, respectively, can be compared with over 70% immunization rates in the South. Infrastructure that could better connect markets in Nigeria or measures to facilitate higher productivity in agriculture could also have a measurable impact on poverty reduction in the North.
• The prime importance of urban growth inNigeria for poverty reduction is clear. As emphasized in the previous NER, Lagos State remains an illustrative example of a strong urban growth agglomeration that has produced jobs, generated inclusive growth, and brought millions out of poverty. To reduce the absolute number of poor and generate the productive jobs desperately needed for the growing ranks of young Nigerians, at least a handful of cities in Nigeria other than Lagos will need to experience the same type of take off into rapid urban growth. As stressed in the previous NER, a better connectivity of markets through roads and other infrastructure will be key to increasing the viability of other Nigerian cities for investors seeking to serve a larger national or international market.
12 “Federal Republic of Nigeria Education and Skills Policy Notes: Policy Note 1: Education Access, Equity and Quality in Nigeria” pp. 24-25, World Bank, June 10, 2013 13 Nigeria Demographic Health Survey (NDHS), 2013
23NIGERIA Economic Report
• Poverty reduction in rural areas canbe strengthened through urban growth (migration to cities) and measures to increase the viability of agricultural markets. Evidence from the GHS surveys indicates that migration from rural to urban areas may already be increasing agricultural productivity (yields relative to number of people on household farms) in some areas in Nigeria.14 Thus, strong urban growth that provides opportunities for migrants in cities is also a key to rural poverty reduction. The
Agricultural Transformation Agenda also holds promise in Nigeria for increasing agricultural productivity through increasing the viability of markets for key value chains. The potential for rural poverty reduction is large.
14 This will be clarified in a series of forthcoming World Bank studies on the labor market