Page 1
SURVEY COST OF DOING BUSINESS 2015
Chisinau, January 2016
Developed by: NGO Rural Economic Development Center PROMO-TERRA
103720P
ublic
Dis
clos
ure
Aut
horiz
edP
ublic
Dis
clos
ure
Aut
horiz
edP
ublic
Dis
clos
ure
Aut
horiz
edP
ublic
Dis
clos
ure
Aut
horiz
ed
Page 2
2 Contents
Cost of Doing Business 2015
Competitiveness Enhancement Project (CEP II) AOCDER Promo-Terra
Contents
ABBREVIATIONS .......................................................................................................................................................................................... 7
EXECUTIVE SUMMARY ................................................................................................................................................................................. 8
PURPOSE OF THE STUDY ...........................................................................................................................................................................11
METHODOLOGY .........................................................................................................................................................................................12
1. OVERALL INDICATORS ........................................................................................................................................................................14
Regulatory environment – general considerations ............................................................................................................. 14
General time indicator ........................................................................................................................................................ 15
General perception of the changes in the business environment ........................................................................................ 16
General assessment of various business aspects ................................................................................................................. 17
2. REGISTRATION PROCEDURE ...............................................................................................................................................................18
Regulatory framework ........................................................................................................................................................ 18
Amount of time required to complete registration procedures ........................................................................................... 19
Costs of registration procedures ......................................................................................................................................... 20
Perception of procedures .................................................................................................................................................... 21
Summary of analysis .......................................................................................................................................................... 21
3. CONSTRUCTIONS .................................................................................................................................................................................23
Regulatory framework ........................................................................................................................................................ 23
Costs and time spent to obtain construction authorisations ................................................................................................ 24
Perception of procedures .................................................................................................................................................... 25
Summary of analysis .......................................................................................................................................................... 26
4. LICENSING ............................................................................................................................................................................................27
Regulatory framework ........................................................................................................................................................ 27
Number of licenses ............................................................................................................................................................. 28
Costs to obtain a license ..................................................................................................................................................... 28
Perception of procedures .................................................................................................................................................... 29
Summary of analysis .......................................................................................................................................................... 30
5. OBTAINING AUTHORISATIONS ............................................................................................................................................................31
Overall regulatory framework ............................................................................................................................................ 31
Costs to obtain authorisations ............................................................................................................................................. 32
Perception of procedures to obtain an authorisation ........................................................................................................... 33
Summary of analysis .......................................................................................................................................................... 34
6. EQUIPMENT .........................................................................................................................................................................................35
7. TRADING ACROSS BORDERS ................................................................................................................................................................36
Regulatory framework ........................................................................................................................................................ 36
Import transactions ............................................................................................................................................................. 37 Certification costs of imported goods ............................................................................................................................ 37 Customs costs ................................................................................................................................................................ 37
Page 3
3 Contents
Cost of Doing Business 2015
Competitiveness Enhancement Project (CEP II) AOCDER Promo-Terra
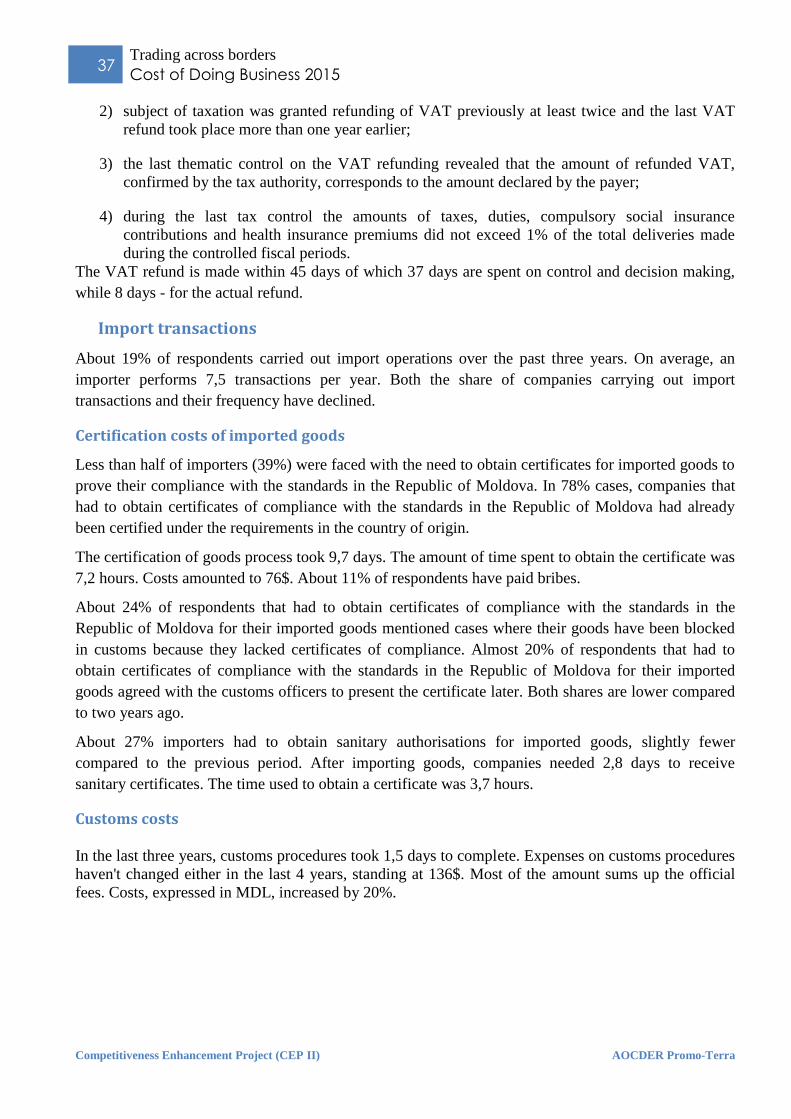
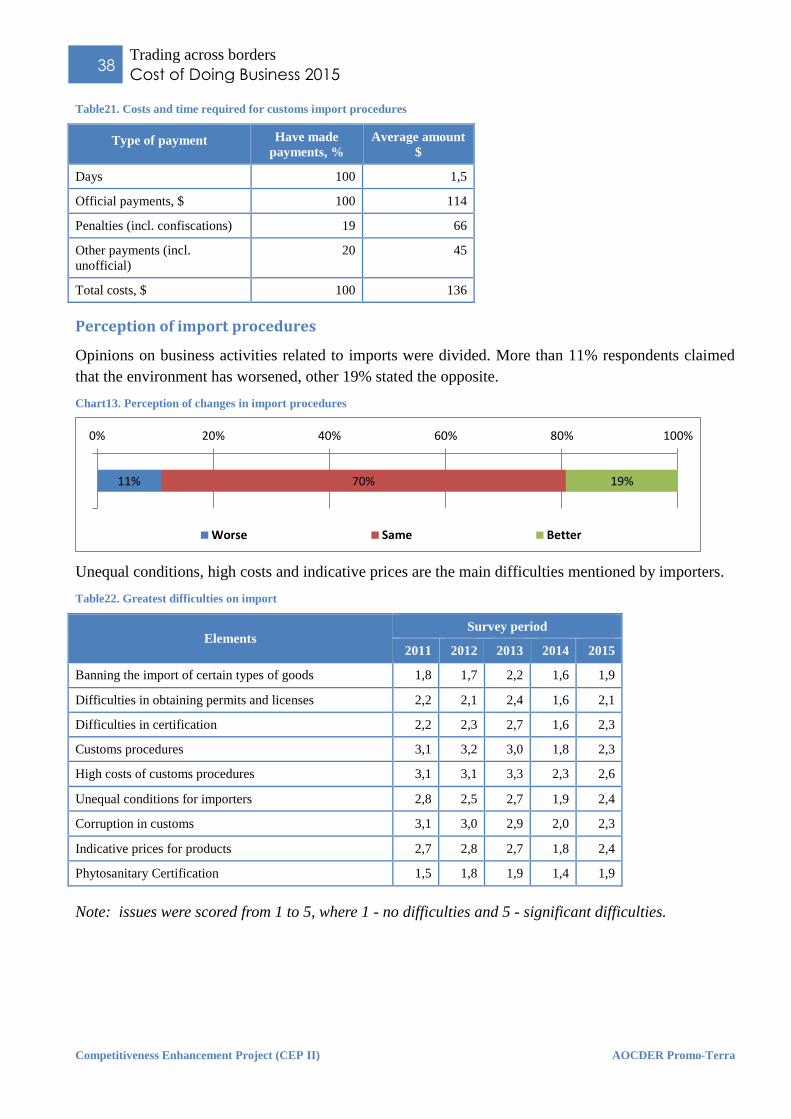
Perception of import procedures .................................................................................................................................... 38
Export transactions ............................................................................................................................................................. 39 Costs of customs procedures .......................................................................................................................................... 39 VAT return ..................................................................................................................................................................... 39 Assessment of export procedures ................................................................................................................................... 39
Summary of analysis .......................................................................................................................................................... 40
8. CERTIFICATION OF GOODS AND SERVICES ..........................................................................................................................................41
Regulatory framework ........................................................................................................................................................ 41
Certification costs ............................................................................................................................................................... 41
Perception of certification procedures ................................................................................................................................ 42
Summary of analysis .......................................................................................................................................................... 43
9. SANITARY CERTIFICATION ..................................................................................................................................................................44
Regulatory framework ........................................................................................................................................................ 44
Procedure for obtaining health certificates ......................................................................................................................... 44
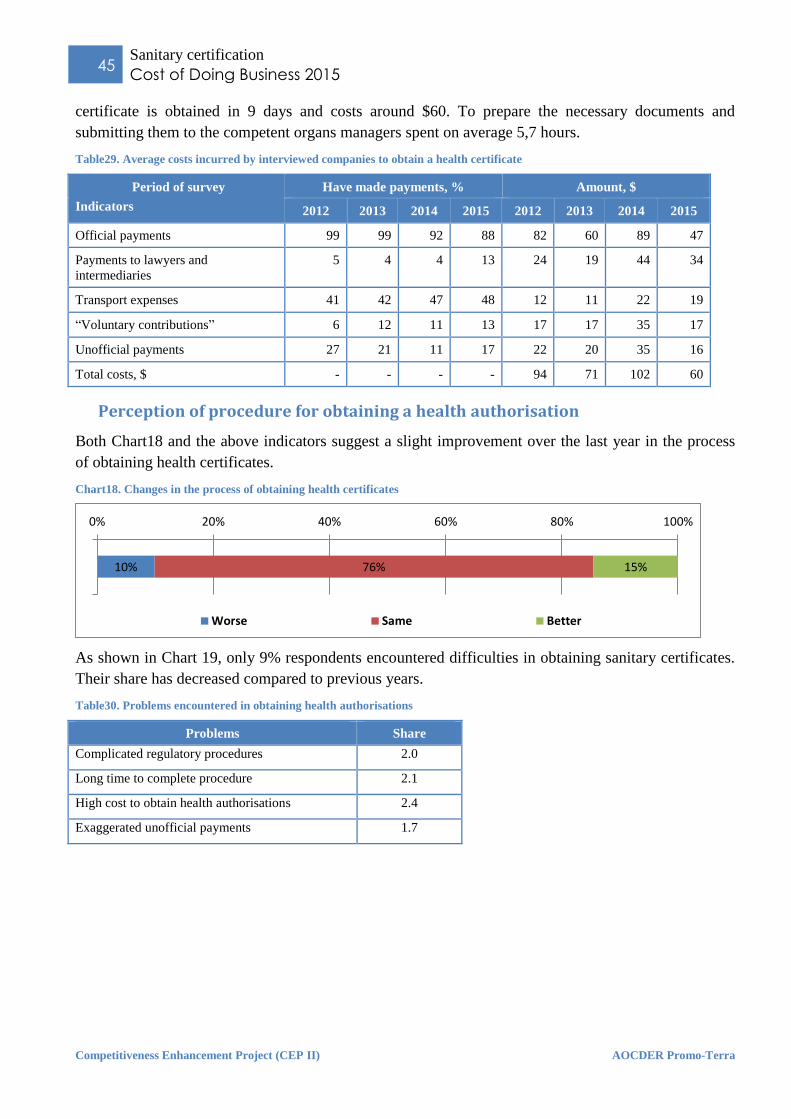
Perception of procedure for obtaining a health authorisation ............................................................................................. 45
Summary of analysis .......................................................................................................................................................... 46
10.INSPECTIONS .......................................................................................................................................................................................47
Regulatory framework ........................................................................................................................................................ 47
Number and duration of inspections ................................................................................................................................... 47
Expenses incurred after the inspections.............................................................................................................................. 48
Perception of number of inspections and difficulties ......................................................................................................... 48
Summary of analysis .......................................................................................................................................................... 49
11.TAXES ..................................................................................................................................................................................................52
Regulatory framework ........................................................................................................................................................ 52
Administration of taxes ...................................................................................................................................................... 52
Major problems in paying taxes ......................................................................................................................................... 53
Summary of the analysis .................................................................................................................................................... 54
12.PRICE REGULATION ............................................................................................................................................................................55
Regulatory framework ........................................................................................................................................................ 55
Price regulation status today ............................................................................................................................................... 55
Perception of price regulation ............................................................................................................................................ 55
Summary of the analysis .................................................................................................................................................... 55
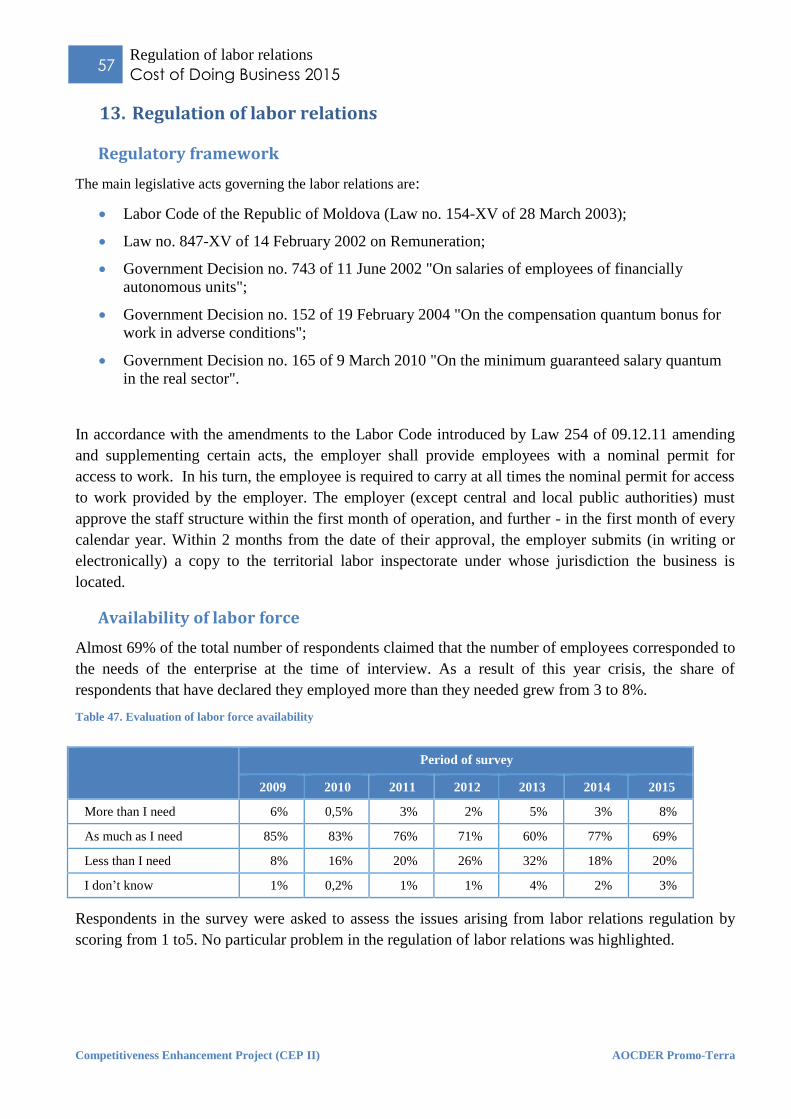
13.REGULATION OF LABOR RELATIONS ...................................................................................................................................................57
Regulatory framework ........................................................................................................................................................ 57
Availability of labor force .................................................................................................................................................. 57
Summary of the analysis .................................................................................................................................................... 58
14.EXECUTION OF CONTRACTS ................................................................................................................................................................59
15.PROMOTION OF PERSONAL INTERESTS OF PUBLIC EMPLOYEES ........................................................................................................60
16.EVALUATION OF THE JUDICIARY SYSTEM ..........................................................................................................................................61
Regulatory framework ........................................................................................................................................................ 61
Methods used to settle disputes .......................................................................................................................................... 61
Page 4
4 Contents
Cost of Doing Business 2015
Competitiveness Enhancement Project (CEP II) AOCDER Promo-Terra
Assessing the efficiency of using courts............................................................................................................................. 62
Summary of the analysis .................................................................................................................................................... 62
17.PHYTOSANITARY CERTIFICATION ......................................................................................................................................................63
Regulatory framework ........................................................................................................................................................ 63
Procedure for obtaining phytosanitary permits (certificates and permits) .......................................................................... 63
Perception of the sanitary permit obtaining procedure ....................................................................................................... 64
Summary of the analysis .................................................................................................................................................... 65
CONCLUSIONS ............................................................................................................................................................................................66
Page 5
5 Tables and Figures
Cost of Doing Business 2015
Competitiveness Enhancement Project (CEP II) AOCDER Promo-Terra
List of Tables:
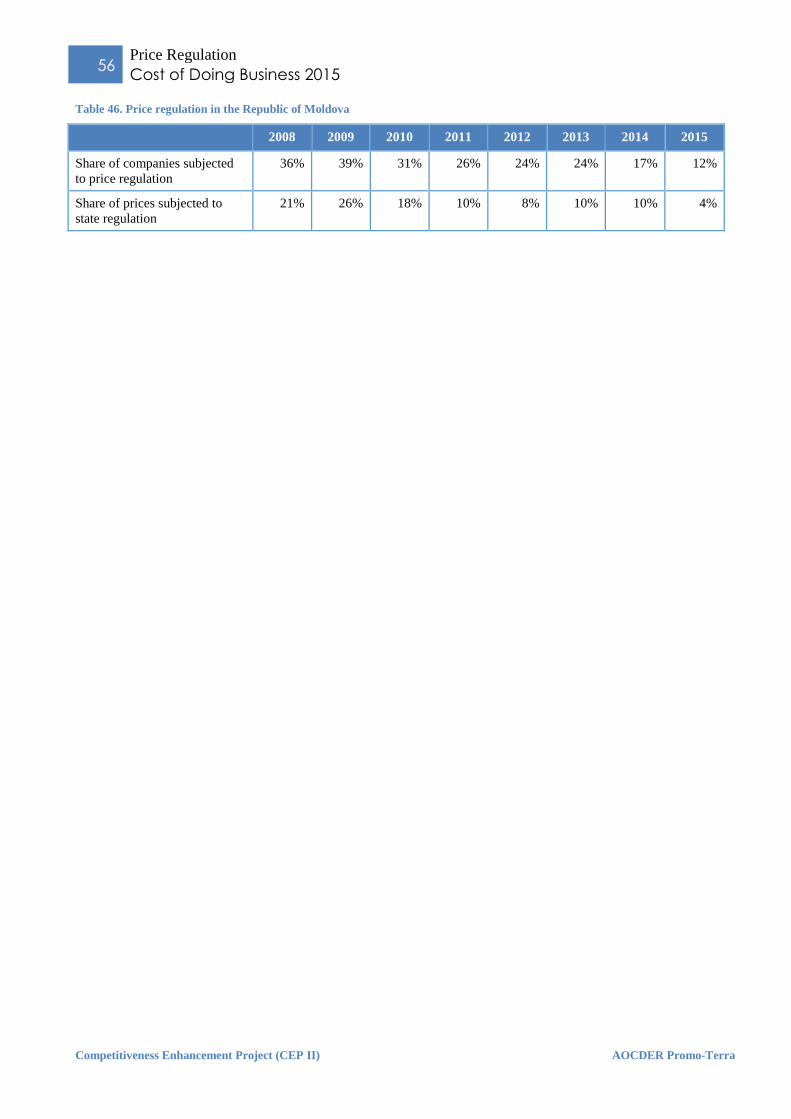
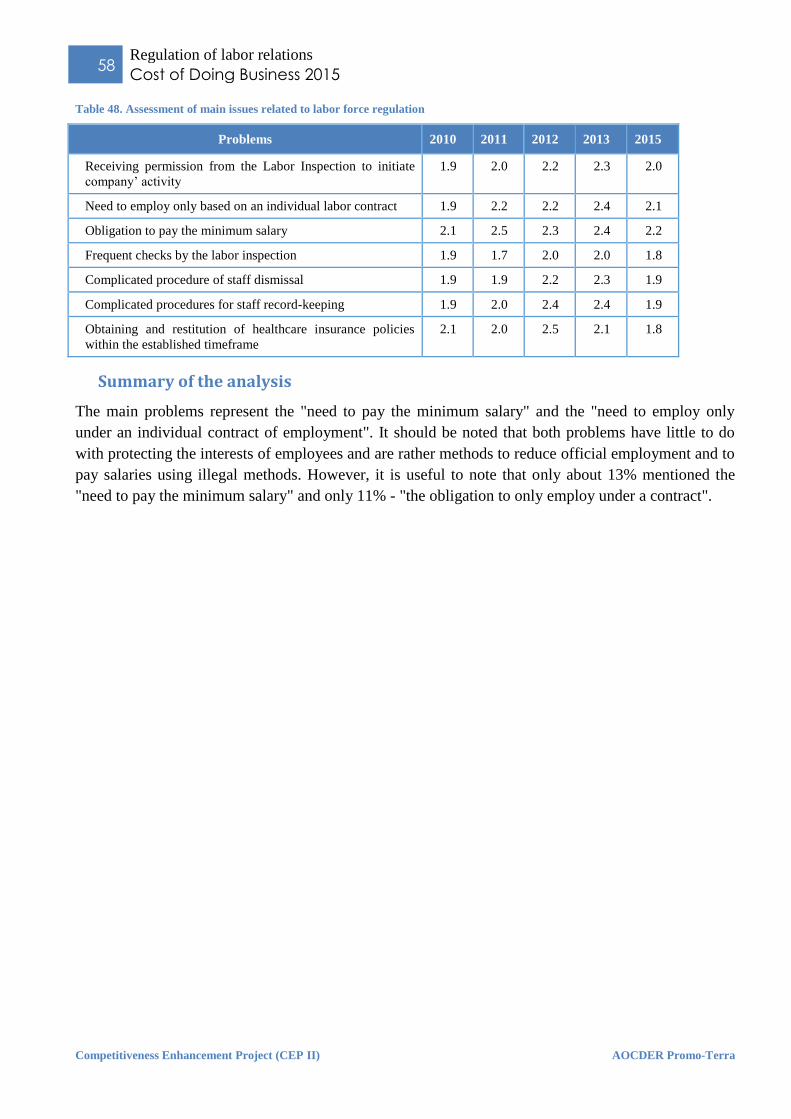
Table 1. Companies participating in the survey distributed by regions .................................................................................. 14 Table 2. Sample distribution by legal form of business .......................................................................................................... 15 Table 3. Sample structure by number of employees ............................................................................................................... 15 Table 4. Sample distribution by type of business operations .................................................................................................. 15 Table 5. Average time spent on registration process in the last three years ............................................................................ 20 Table 6. Time to complete the primary registration procedure, by government institutions, in the last three years............... 20 Table 7. Time on the procedure to modify in the incorporation documents, by government body, in the last three years .... 20 Table 8. Registration-related issues ........................................................................................................................................ 21 Table 9. Time and registration costs in recent years ............................................................................................................... 22 Table 10. Time and costs to obtain authorisations to commence reconstruction works ......................................................... 25 Table 11. Time and costs for obtaining authorisations to place into service the reconstruction works .................................. 25 Table 12. Issues relating to obtaining authorisations for reconstruction and repairs .............................................................. 26 Table 13. Average amount of time to obtain an authorisation, days ....................................................................................... 26 Table 14. Average costs of obtaining a license ....................................................................................................................... 29 Table 15. Difficulties concerning the licensing process ......................................................................................................... 29 Table 16. Evolution of costs related to licensing activities ..................................................................................................... 30 Table 17. Average costs incurred by the interviewed companies to obtain an authorisation .................................................. 33 Table 18. Problems arising from the process of obtaining authorisations .............................................................................. 33 Table 19. Costs to obtain authorisations ................................................................................................................................. 34 Table 20. Comparing the time and costs for obtaining an authorisation for equipment ......................................................... 35 Table 21. Costs and time required for customs import procedures ......................................................................................... 38 Table 22. Greatest difficulties on import ................................................................................................................................ 38 Table 23. The most important issues related to export ........................................................................................................... 40 Table 24. Evolution of procedures and regulations on import-export procedures .................................................................. 40 Table 25. Certification costs ................................................................................................................................................... 41 Table 26. Average costs of certification ................................................................................................................................. 42 Table 27. Problems encountered in the certification process .................................................................................................. 42 Table 28. Evolution of product certification procedures ........................................................................................................ 43 Table 29. Average costs incurred by interviewed companies to obtain a health certificate .................................................... 45 Table 30. Problems encountered in obtaining health authorisations ....................................................................................... 45 Table 31. Evolution of procedures for obtaining a health authorisation ................................................................................. 46 Table 32. Number and average time of controls ..................................................................................................................... 47 Table 33. Share of companies that made payments following inspections over the last year ................................................. 48 Table 34. Objectivity of public employees ............................................................................................................................. 48 Table 35. Purposes of the inspection visits ............................................................................................................................. 49 Table 36. Evolution of the share of inspected companies ....................................................................................................... 49 Table 37. Evolution of the frequency of inspections (calculated only for companies verified by respective authority) ........ 50 Table 38. Evolution of inspection frequency (calculated for all companies included in the sample) ..................................... 50 Table 39. Evolution of inspections ......................................................................................................................................... 51 Table 40. Number of accountants required to ensure timely and accurate payment of taxes ................................................. 52 Table 41. Time spent to submit a report, hours ...................................................................................................................... 53 Table 42. Taxes generating more problems ............................................................................................................................ 53 Table 43. Problems faced in the taxation system .................................................................................................................... 54 Table 44. Comparison of the tax administration system ......................................................................................................... 54 Table 45. Methods of state intervention in price formation .................................................................................................... 55 Table 46. Price regulation in the Republic of Moldova .......................................................................................................... 56 Table 47. Evaluation of labor force availability ..................................................................................................................... 57 Table 48. Assessment of main issues related to labor force regulation .................................................................................. 58 Table 49. Monitoring execution of contracts in the Republic of Moldova ............................................................................. 59 Table 50. Methods to solve problems ..................................................................................................................................... 61 Table 51. Reasons for not addressing the courts ..................................................................................................................... 62 Table 52. Efficiency of addressing the courts ......................................................................................................................... 62
Page 6
6 Tables and Figures
Cost of Doing Business 2015
Competitiveness Enhancement Project (CEP II) AOCDER Promo-Terra
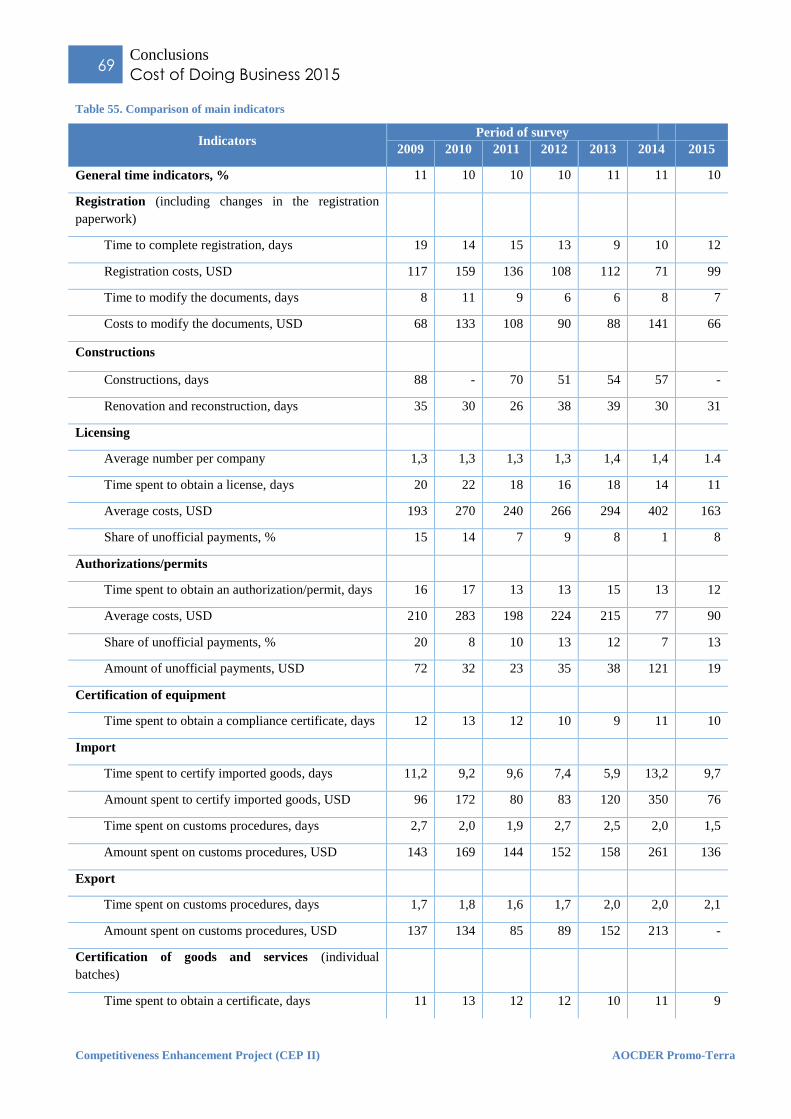
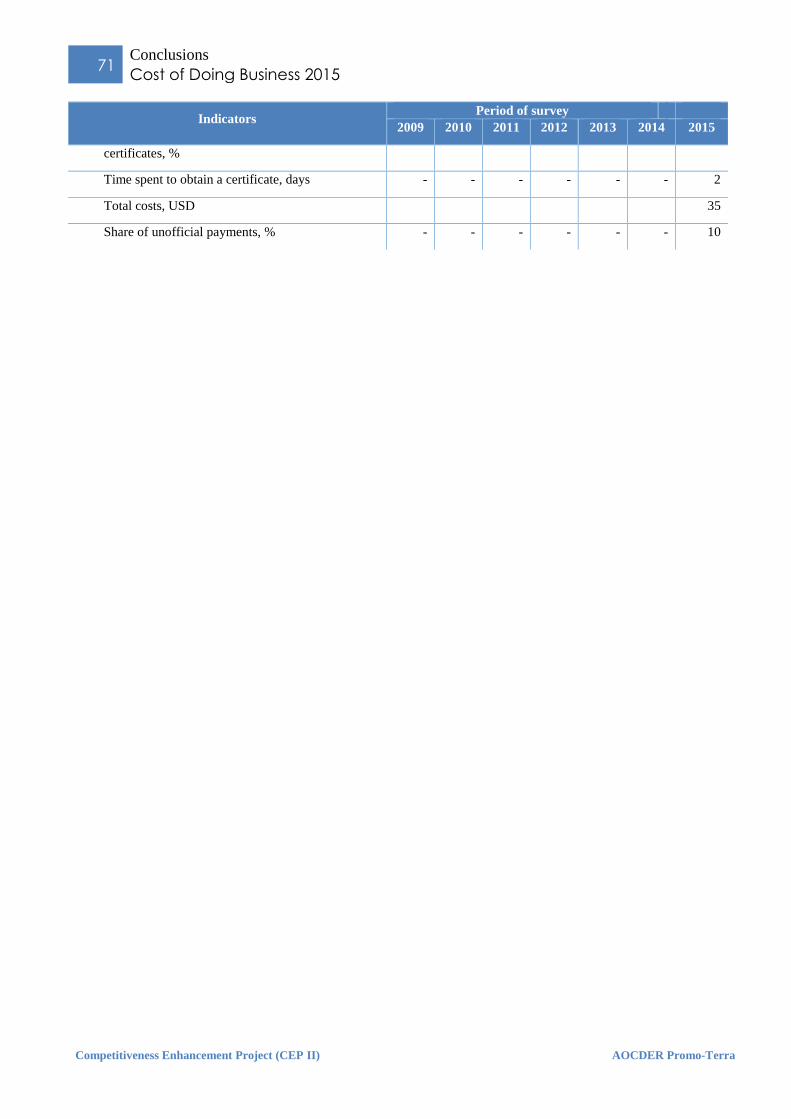
Table 53. Average costs incured by the businesses interviewed in order to obtain a phytosanitary permit .......................... 64 Table 54. Problems faced during the process of obtaining phytosanitary permits .................................................................. 64 Table 55. Comparison of main indicators ............................................................................................................................... 69
List of figures:
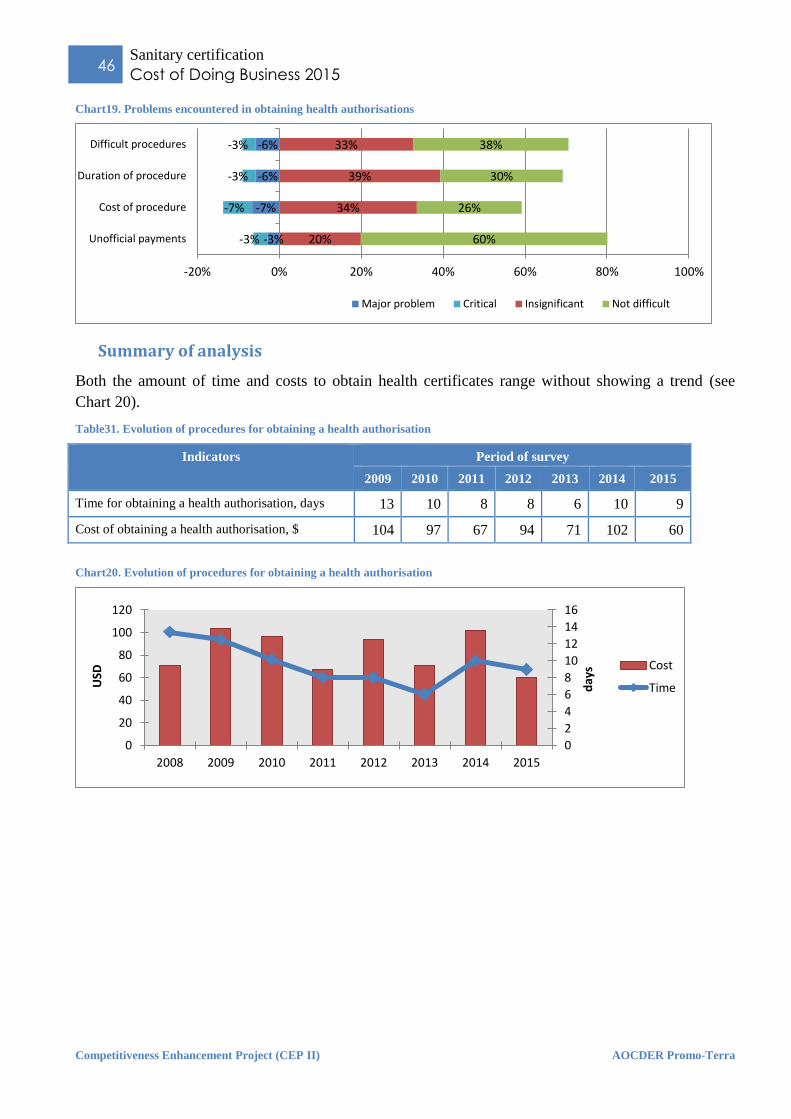
Chart 1. Share of time spent to satisfy regulatory compliance ............................................................................................... 16 Chart 2. Assessment of changes in the business environment ................................................................................................ 16 Chart 3. Difficulties encountered ............................................................................................................................................ 17 Chart 4. Share of enterprises that have turned to the State Registration Chamber over the last three years ........................... 19 Chart 5. Problems faced by business entities upon the registration procedure over the last three years ................................ 21 Chart 6. Perception of changes in procedures governing the use of premises ........................................................................ 25 Chart 7. Issues relating to obtaining authorisations for construction and repair ..................................................................... 26 Chart 8. Changes in the number of licenses ............................................................................................................................ 28 Chart 9. Perception of changes in the licensing process, % .................................................................................................... 29 Chart 10. Issues related to licensing ....................................................................................................................................... 30 Chart 11. Perception of changes in the authorisation obtaining process ................................................................................. 33 Chart 12. Problems arising from the process of obtaining authorisations .............................................................................. 34 Chart 13. Perception of changes in import procedures ........................................................................................................... 38 Chart 14. Perception of difficulties related to import transactions ......................................................................................... 39 Chart 15. Perception of changes in export procedures ............................................................................................................ 39 Chart 16. Evolution of changes in the certification procedures .............................................................................................. 42 Chart 17. Exporters' perception of difficulties related to certification procedures ................................................................. 43 Chart 18. Changes in the process of obtaining health certificates .......................................................................................... 45 Chart 19. Problems encountered in obtaining health authorisations ....................................................................................... 46 Chart 20. Evolution of procedures for obtaining a health authorisation ................................................................................. 46 Chart 21. Evolution of the number of inspections .................................................................................................................. 48 Chart 22. Evolution of procedures related to inspections ....................................................................................................... 49 Figure 23. Taxes generating more problems ........................................................................................................................... 53 Figure 24. Evolution of taxation system ................................................................................................................................. 54 Figure 25. Companies that had to settle disputes .................................................................................................................... 61 Figure 26. Changes in the process of obtaining a sanitary permit .......................................................................................... 64 Figure 27. Problems faced in the process of obtaining phytosanitary permits ........................................................................ 65
Page 7
7 Abbreviations
Cost of Doing Business 2015
Competitiveness Enhancement Project (CEP II) AOCDER Promo-Terra
Abbreviations
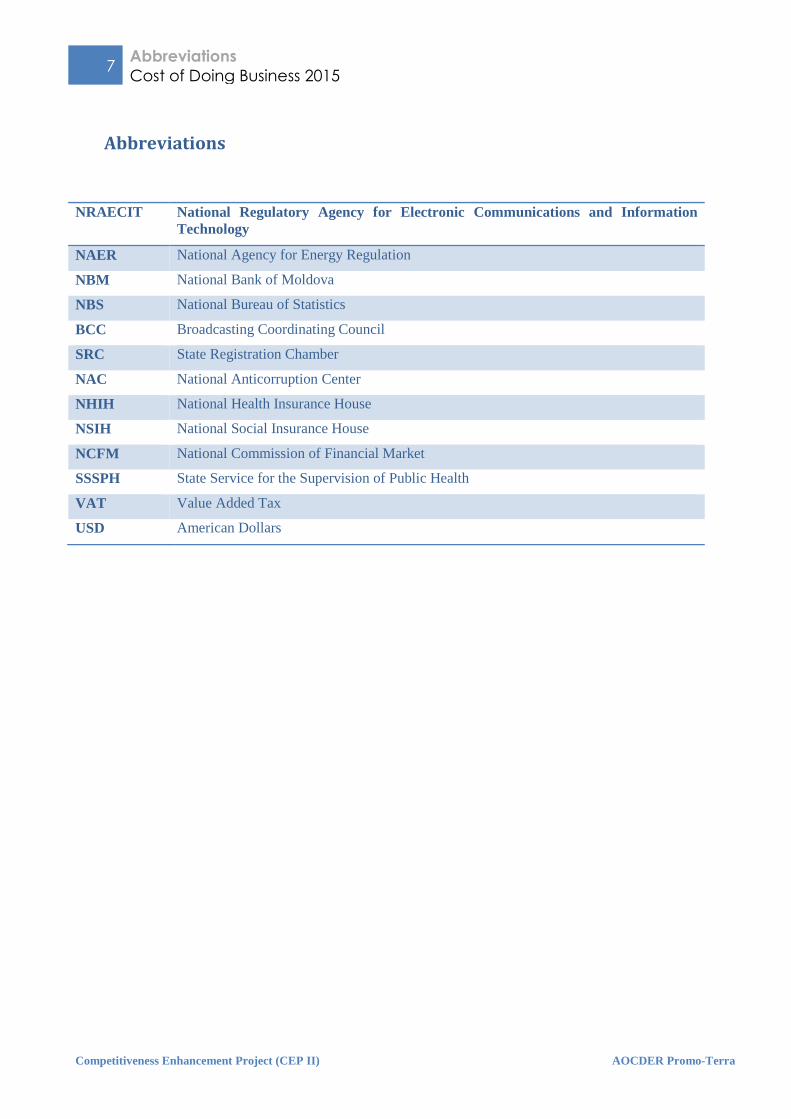
NRAECIT National Regulatory Agency for Electronic Communications and Information
Technology
NAER National Agency for Energy Regulation
NBM National Bank of Moldova
NBS National Bureau of Statistics
BCC Broadcasting Coordinating Council
SRC State Registration Chamber
NAC National Anticorruption Center
NHIH National Health Insurance House
NSIH National Social Insurance House
NCFM National Commission of Financial Market
SSSPH State Service for the Supervision of Public Health
VAT Value Added Tax
USD American Dollars
Page 8
8 Executive summary
Cost of Doing Business 2015
Competitiveness Enhancement Project (CEP II) AOCDER Promo-Terra
Executive summary
Survey timeframe
This research was conducted with the support of the Ministry of Economy, according to the
methodology provided by the World Bank. Similar studies have been carried out annually since 2002.
The data was collected throughout October-November 2015. The research timeframe covers:
registration, constructions, foreign trade, and purchase of equipment - the last three years, legal
environment - the last two years. Other areas - the year past or the time of questioning.
Method
Initial data were collected based on structured questionnaires approved in advance by our partners.
Managers were asked questions in face-to-face interviews set up at their business offices.
Businesses have been randomly selected from the total number of companies in Moldova, currently
functioning.
The data was analysed based on the SPSS software. To ensure the representativeness of the obtained
results, the high dispersion series outliers were removed. In some cases the median was used to
distinguish the central tendency.
Indicators were calculated by overall country, region, type and size of business. The report contains
only relations bearing some sort of relevance. Average indicators with values displaying very large
dispersions due to the low number of respondents were not included in the report.
Sample
The sample covers 634 companies, excluding agricultural enterprises, individuals and banking
institutions. The sample does not contain enterprises located on the left bank of Nistru river.
Representativeness has been verified by four criteria: legal form, number of employees, field of
activity and geographic location.
More than 67% of the surveyed businesses were located in Chisinau. Most entities (94%) are limited
liability companies. Companies employing more than 10 people accounted for 80% of the total.
General time indicator
The general time indicator is an overall estimate of government's involvement in the activity of
businesses, as perceived by business managers. In 2015 the indicator fell to 10,4%. Throughout 2009-
2015 this indicator has not changed significantly, fluctuating between 9,9-11,3%.
Registration
The study showed an increase in the time spent on the primary registration of a company with the
required institutions, from 10 to 12 days. However, registration modifications in the incorporation
documents take 1,3 days fewer compared to 2013. The amount of time also includes the post-
registration operations. Registering with SRC takes on average 7 days, modifications take 5 days.
The registration costs have not confirmed a trend in recent years.
Page 9
9 Executive summary
Cost of Doing Business 2015
Competitiveness Enhancement Project (CEP II) AOCDER Promo-Terra
Constructions
Only 29% respondents have moved to new premises, of which only 7% have built them (2% of the
total). 75% of companies have turned to planning offices for various coordination, obtaining
permissions, and support in releasing the premises into use. Thus, only 0,5% of the surveyed
companies were faced with the need to obtain permits by themselves, this field becoming one with
limited impact.
Licensing
Around 47% of the businesses surveyed had licenses at the time of questioning. Their share tends to
decrease in the last six years. The average number of licenses has almost not changed throughout 2009
to 2015– 1,4 per company.
Both the time ( from 14 to 11 days) and the cost to obtain a license have declined. About 8% said they
had paid bribes to facilitate the process of obtaining a license.
Authorisations
Almost half (49%) of businesses in Moldova have to obtain an authorisation for their current activity.
Compared to previous years, the share dropped significantly.
The time spent to obtain an authorisation has slightly decreased from 13 to 12 days (15 days in 2013).
Costs have increased slightly from 77 to 90 US dollars, but are well below the year 2013 - 215 USD.
Certification of equipment
Only 2% of respondents had to obtain certificates to start using the equipment. Time spent on getting
an authorisation for this has been stable in 2012-2015.
Import
Importers needed 9,7 days to certify their goods. The procedure took less time compared to 2014, but
longer than in 2012-2013. The cost of obtaining the certificate was 76 USD, similar to its cost in 2013.
The average time spent on a customs procedure decreased in 2012-2015 from 2,7 to 1,5 days. Related
costs stood at 136 USD.
Export
Procedures required for export transactions took an average 2,1 days, without changes over the last
two years. The procedures cost 37 USD.
Certification of goods and services
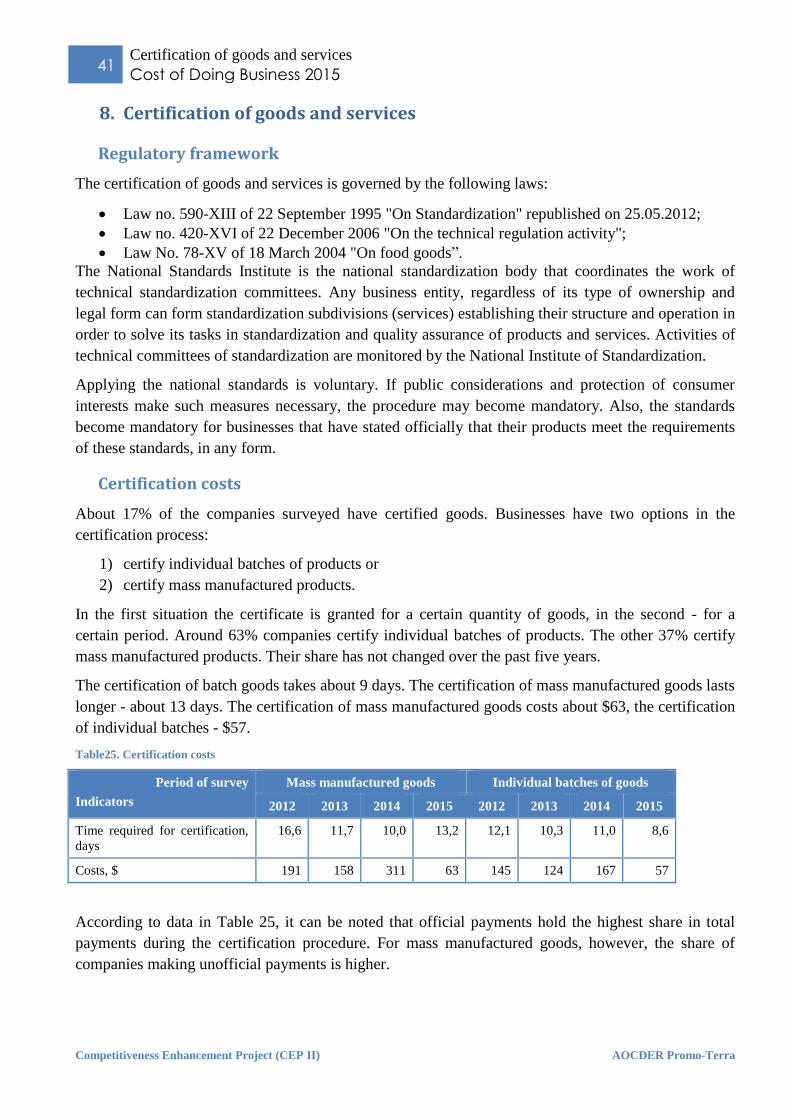
Almost 11% of the surveyed companies had certified batches of goods. The certification procedure
took, on average, 8,6 days - 3,5 days faster than in 2012. Costs stood at 57 USD, the lowest level
throughout 2011-2015.
About 6% of the companies surveyed have certified batch manufactured goods. The certificate took
13,2 days to obtain - 1,5 days longer than in 2013. The cost stood at 63 dollars, considerably lower
compared to 2011-2013.
Sanitary certification
A third of respondents had to obtain sanitary (health) certificates. Their share has declined
continuously over the past five years. The certificate is obtained in 9 days, 1,4 days faster than in 2014.
Page 10
10 Executive summary
Cost of Doing Business 2015
Competitiveness Enhancement Project (CEP II) AOCDER Promo-Terra
Controls
In 2015 the average number of visits to a company decreased from 6,5 to 3,8 visits. However, the
cumulative time spent by inspectors at a company has increased from 4,5 to 7,6 days.
Taxes
Almost 64% of the enterprises surveyed employ full-time accountants to calculate and pay all taxes on
time. The average number of full-time accountants was 1,2. Both indicators have not changed
compared to 2013.
Price regulation
The share of enterprises subject to price regulation has declined continuously since 2010. Only 12% of
managers said that the government intervenes in pricing the company's products. The sales volume at
regulated prices decreased twice compared to 2013.
Regulation of labour relations
Regulation of labour relations does not pose major problems. About 8% of respondents mentioned
staff surplus, the highest level in 2009-2015.
Contract monitoring
In about 5% of cases the government intervened in the process of contract signings. With small
deviations, this share was seen at the same level over the past eleven years.
Legal system
Around 21% of participants had to settle some disputes over the past two years. The share has
increased compared to 2014.
46% of them took to the courts to deal with conflicts. In 34% of cases they have resorted to various
informal, but legal methods. In 14% of cases companies were forced to resort to illegal methods to
settle the conflicts.
Phytosanitary certification
The phytosanitary certification has a much smaller involvement compared to the sanitary (health) or
compliance certificates. Only 7% of respondents had to obtain phytosanitary certificates. The process
took 2 days, entailing a cost of 35 USD. It is worth mentioning that agricultural companies were
excluded from the sample, which could have increased the share of companies affected by the
respective regulatory field.
Page 11
11 Purpose of the study
Cost of Doing Business 2015
Competitiveness Enhancement Project (CEP II) AOCDER Promo-Terra
Purpose of the study
The main purpose of this study is to monitor the business environment and assess the impact
government policies and the regulatory requirements have on businesses operating in Moldova. The
project was carried out based on the following goals:
Providing the Government of the Republic of Moldova and the national and international
institutions with quantitative data on the cost incurred by businesses to comply with
government regulations.
Provide support to the Government of Moldova on quality policy analysis with a view to
implement the necessary decisions to improve business and investment climates in Moldova.
Assist the civil society institutions that make recommendations and need to monitor their
impact.
Establish a tool to monitor the evolution of business environment and the impact of the
measures taken to reduce barriers and corruption in business.
Page 12
12 Methodology
Cost of Doing Business 2015
Competitiveness Enhancement Project (CEP II) AOCDER Promo-Terra
Methodology
Selection of companies
With a view to select businesses for interview a database was created comprising all companies
operating at the time of questioning, excluding companies engaged mainly in agriculture, financial
institutions and individual enterprises. The database does not contain legal persons that do not carry
out economic activities: nongovernmental organizations, community associations, educational
institutions, housing associations and others. The selection of companies to be excluded was carried
out based on CAEM-2 codes. The regulatory framework of these companies is specific and does not
comply with the purpose of this study.
Using the SPSS programme, a sample of 600 companies was randomly generated for the survey. Each
company had equal chances to be selected. The sample was tested in terms of representativeness, using
four criteria: region (rayon), field of activity, legal & organizational form and number of employees.
In several instances, no representatives of the company could be found at the legal address. Using the
information found on the internet or the landline telephone numbers, interviewers travelled to the
premises where the activity itself was carried out. Businesses that could not be found at both addresses
were excluded from the sample.
In some cases at the company premises could not be found a person entitled to provide information or
the representative refused to talk to the interviewers.
In all cases, companies where the interviewing was not possible were excluded from the sample and
replaced by another without affecting its structure.
The refusal rate was 47%, almost half of which were businesses that had not been found at the
specified address. The rate has not changed significantly in the last 10 years: in 2006 it stood at 48%,
in 2014 - at 49%. A higher refusal rate is found in the Municipality of Chisinau.
Interviewing
The interviewing was conducted by trained persons in face-to-face discussions, at the headquarters of
the companies surveyed. Where possible, respondents were informed in advance about the
interviewer's visit. The interviews unfolded based on questionnaires structured by areas of interest.
Respondents were informed about the purpose of the study.
Verifying the quality of the data collection
In order to ensure the quality of the data collection process, around 10% of the businesses surveyed
were contacted randomly. Following a short conversation on the phone, it was verified that:
1. The interviewer has indeed discussed with an official of the company
2. The answers to some questions correspond with those noted in the questionnaire.
Data processing
Page 13
13 Methodology
Cost of Doing Business 2015
Competitiveness Enhancement Project (CEP II) AOCDER Promo-Terra
The statistical data in the survey was analysed using the SPSS software. The average data was
calculated only for respondents who provided answers to the questions. For example, the average cost
of transport was calculated only for respondents who incurred such expenses. The average total cost is
the average of component costs, weighted by the number of respondents who incurred such expenses.
Where reasonable, the indicators were calculated both countrywide, by regions, type of activity,
business size. The report presents only classifications that suggest some type of correlation. Indicators
with incomplete answers or non-representative indicators were not included in the report. For areas
such as "export regulation", "obtaining a construction authorisation" and "regulation of purchase and
use of production equipment", where the respondent volume is insignificant, only the synthetic indices
were calculated countrywide.
Exchange rate, MDL for 1 U.S. Dollar
The following exchange rates established by the National Bank were used in the study:
2013 - 12,59
2014 - 14,04
january-november 2015 - 18,72
october-november 2015 - 19,95
Page 14
14 Overall Indicators
Cost of Doing Business 2015
Competitiveness Enhancement Project (CEP II) AOCDER Promo-Terra
1. Overall Indicators
Regulatory environment – general considerations
On January 1, 2008 entered into effect the Law no. 235 of 20.07.2006 on "Basic principles governing
business operations" (Guillotine II).
Under this law were set out important principles aimed at reducing the burden of entrepreneurship
management:
1. The tacit approval to start and run a business - where the public administration authority and/or
other authorized regulatory and control institutions do not send a notice on the issue or renewal
of the authorisation/license within the deadline set by law.
2. Control of business activities, except for financial and tax, is only advisory and can only occur
in cases established by law.
3. Costs of services and documentation issued by government authorities and other regulatory and
supervisory institutions are set out by laws.
4. Technical and health conditions, standards and other documents are compulsory if set out by
laws.
5. Handling doubts of law enforcements in favour of the entrepreneur.
In order to amend and supplement the regulatory framework in compliance with Law no. 235, the
Parliament developed and approved Law no. 280-XVI of 14.12.2007 and Law no. 281-XVI of
14.12.2007.
Law no. 160 of June 22, 2011 on "Regulation through authorisation of business activity" and Law no.
162 of 22 July 2011 on “Amendment and Supplement of certain legislative acts” establish the
Nomenclature of permissive documents, as well as sanctions against persons in key positions who
delay the release of permissions or require measures that are not set out in the Nomenclature
(Guillotine II+).
Sample
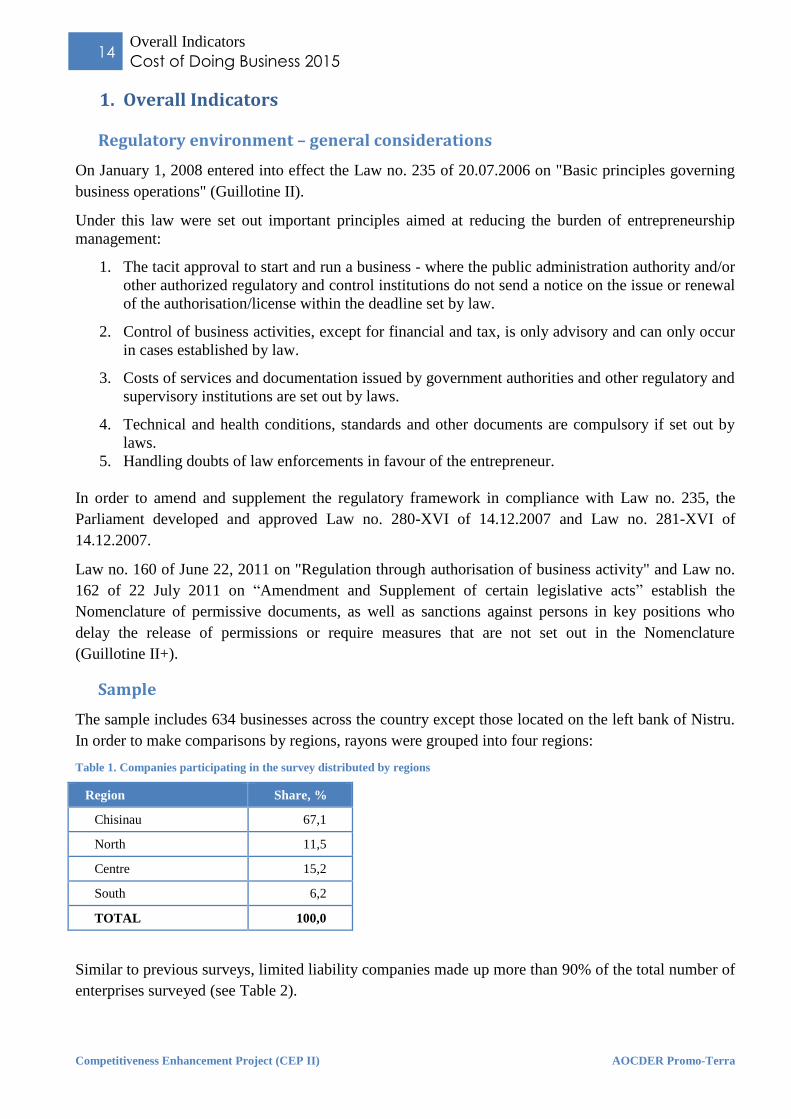
The sample includes 634 businesses across the country except those located on the left bank of Nistru.
In order to make comparisons by regions, rayons were grouped into four regions:
Table 1. Companies participating in the survey distributed by regions
Region Share, %
Chisinau 67,1
North 11,5
Centre 15,2
South 6,2
TOTAL 100,0
Similar to previous surveys, limited liability companies made up more than 90% of the total number of
enterprises surveyed (see Table 2).
Page 15
15 Overall Indicators
Cost of Doing Business 2015
Competitiveness Enhancement Project (CEP II) AOCDER Promo-Terra
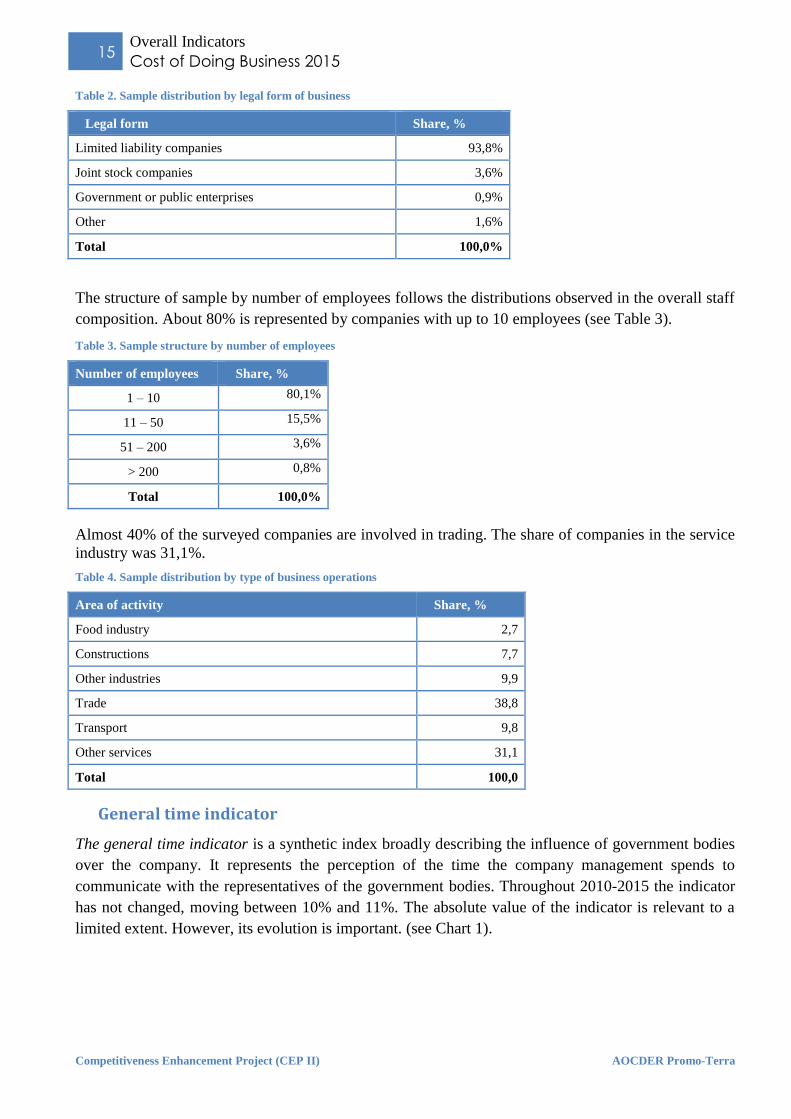
Table 2. Sample distribution by legal form of business
Legal form Share, %
Limited liability companies 93,8%
Joint stock companies 3,6%
Government or public enterprises 0,9%
Other 1,6%
Total 100,0%
The structure of sample by number of employees follows the distributions observed in the overall staff
composition. About 80% is represented by companies with up to 10 employees (see Table 3).
Table 3. Sample structure by number of employees
Number of employees Share, %
1 – 10 80,1%
11 – 50 15,5%
51 – 200 3,6%
> 200 0,8%
Total 100,0%
Almost 40% of the surveyed companies are involved in trading. The share of companies in the service
industry was 31,1%.
Table 4. Sample distribution by type of business operations
Area of activity Share, %
Food industry 2,7
Constructions 7,7
Other industries 9,9
Trade 38,8
Transport 9,8
Other services 31,1
Total 100,0
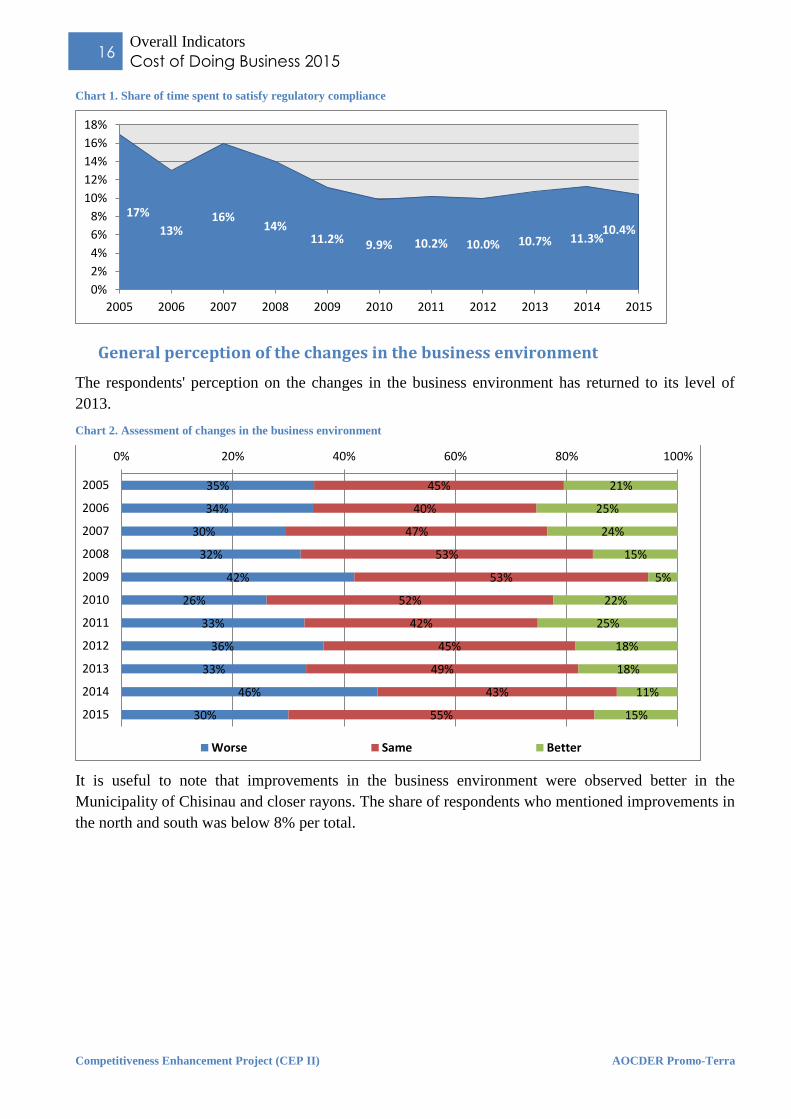
General time indicator
The general time indicator is a synthetic index broadly describing the influence of government bodies
over the company. It represents the perception of the time the company management spends to
communicate with the representatives of the government bodies. Throughout 2010-2015 the indicator
has not changed, moving between 10% and 11%. The absolute value of the indicator is relevant to a
limited extent. However, its evolution is important. (see Chart 1).
Page 16
16 Overall Indicators
Cost of Doing Business 2015
Competitiveness Enhancement Project (CEP II) AOCDER Promo-Terra
Chart 1. Share of time spent to satisfy regulatory compliance
General perception of the changes in the business environment
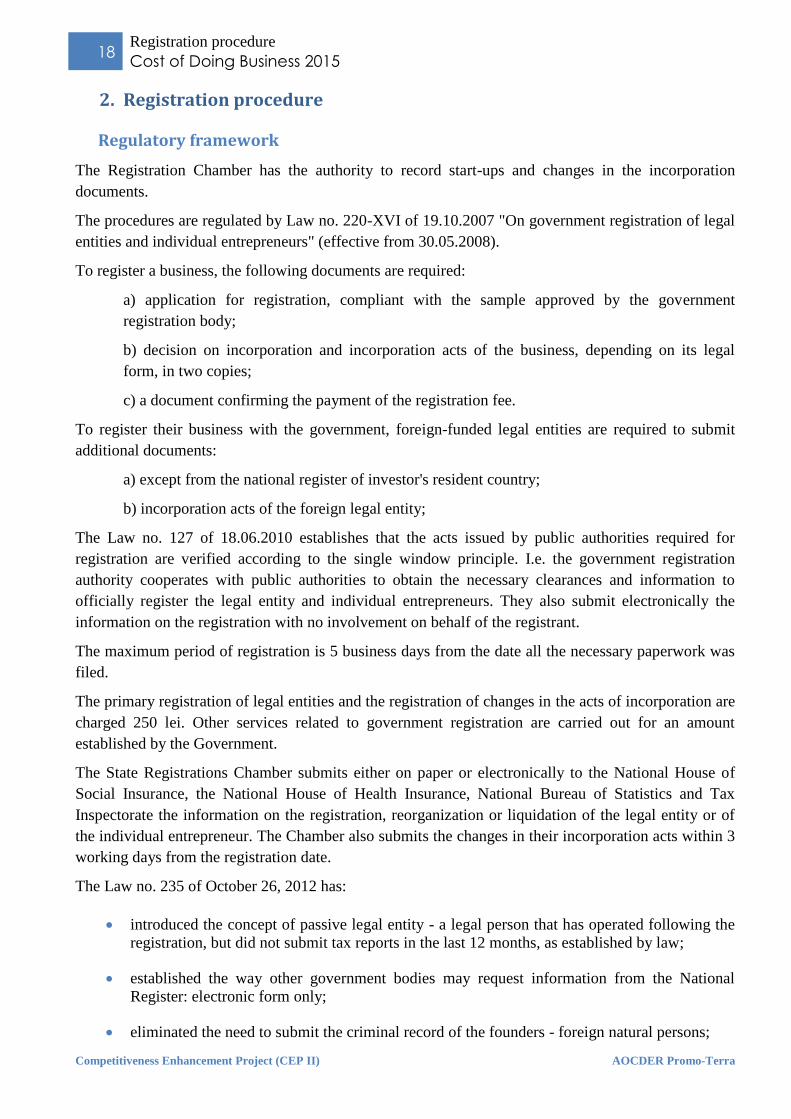
The respondents' perception on the changes in the business environment has returned to its level of
2013.
Chart 2. Assessment of changes in the business environment
It is useful to note that improvements in the business environment were observed better in the
Municipality of Chisinau and closer rayons. The share of respondents who mentioned improvements in
the north and south was below 8% per total.
17%
13%16%
14%11.2% 9.9% 10.2% 10.0% 10.7% 11.3%
10.4%
0%
2%
4%
6%
8%
10%
12%
14%
16%
18%
2005 2006 2007 2008 2009 2010 2011 2012 2013 2014 2015
35%
34%
30%
32%
42%
26%
33%
36%
33%
46%
30%
45%
40%
47%
53%
53%
52%
42%
45%
49%
43%
55%
21%
25%
24%
15%
5%
22%
25%
18%
18%
11%
15%
0% 20% 40% 60% 80% 100%
2005
2006
2007
2008
2009
2010
2011
2012
2013
2014
2015
Worse Same Better
Page 17
17 Overall Indicators
Cost of Doing Business 2015
Competitiveness Enhancement Project (CEP II) AOCDER Promo-Terra
General assessment of various business aspects
Companies were asked to assess the difficulties incurred, by key features of business environment, on
a scale of 1 to 5, where 1 - incur no difficulties, 5 - incur significant difficulties. The importance of
issues has barely changed over the last year.
The chart below shows the development over the last four years of the regulatory fields in terms the
impact on businesses.
Chart 3. Difficulties encountered
The biggest problems arise from the process of obtaining authorisations and the tax system, in
particular the frequent changes in the legislation.
The evaluation was requested from all companies and reflects the general opinion, not only of the
companies that have been affected by respective regulations.
2.52.3
2.72.4
3.12.8
2.1 2.22
2.6 2.52.9
2.7
0
0.5
1
1.5
2
2.5
3
3.5
4
Lice
nsi
ng
Re
gist
rati
on
Au
tho
risa
tio
ns
Co
nst
ruct
ion
s
Tax
syst
em
Insp
ect
ion
s
Pro
mo
tin
g p
ub
lic
emp
loye
es’
inte
rest
s
Ce
rtif
icat
ion
of
goo
ds
Pu
blic
em
plo
yee
sre
qu
est
ing
favo
urs
Law
ap
plie
d s
ele
ctiv
ely
The
nee
d t
o m
ake
un
off
icia
l pay
men
ts
Fre
qu
en
t ch
ange
s in
legi
slat
ion
Un
fair
co
mp
eti
tio
n
2012 2013 2014 2015
Page 18
18 Registration procedure
Cost of Doing Business 2015
Competitiveness Enhancement Project (CEP II) AOCDER Promo-Terra
2. Registration procedure
Regulatory framework
The Registration Chamber has the authority to record start-ups and changes in the incorporation
documents.
The procedures are regulated by Law no. 220-XVI of 19.10.2007 "On government registration of legal
entities and individual entrepreneurs" (effective from 30.05.2008).
To register a business, the following documents are required:
a) application for registration, compliant with the sample approved by the government
registration body;
b) decision on incorporation and incorporation acts of the business, depending on its legal
form, in two copies;
c) a document confirming the payment of the registration fee.
To register their business with the government, foreign-funded legal entities are required to submit
additional documents:
a) except from the national register of investor's resident country;
b) incorporation acts of the foreign legal entity;
The Law no. 127 of 18.06.2010 establishes that the acts issued by public authorities required for
registration are verified according to the single window principle. I.e. the government registration
authority cooperates with public authorities to obtain the necessary clearances and information to
officially register the legal entity and individual entrepreneurs. They also submit electronically the
information on the registration with no involvement on behalf of the registrant.
The maximum period of registration is 5 business days from the date all the necessary paperwork was
filed.
The primary registration of legal entities and the registration of changes in the acts of incorporation are
charged 250 lei. Other services related to government registration are carried out for an amount
established by the Government.
The State Registrations Chamber submits either on paper or electronically to the National House of
Social Insurance, the National House of Health Insurance, National Bureau of Statistics and Tax
Inspectorate the information on the registration, reorganization or liquidation of the legal entity or of
the individual entrepreneur. The Chamber also submits the changes in their incorporation acts within 3
working days from the registration date.
The Law no. 235 of October 26, 2012 has:
introduced the concept of passive legal entity - a legal person that has operated following the
registration, but did not submit tax reports in the last 12 months, as established by law;
established the way other government bodies may request information from the National
Register: electronic form only;
eliminated the need to submit the criminal record of the founders - foreign natural persons;
Page 19
19 Registration procedure
Cost of Doing Business 2015
Competitiveness Enhancement Project (CEP II) AOCDER Promo-Terra
eliminated the need to submit the authorization to relevant authorities where the legal person
was set up by reorganization of a state enterprise, companies whose registered capital has a
quota of government property, business unions, associations, holdings, transnational
corporations, industrial-financial groups, financial institutions, educational institutions,
museums, theaters, circuses, concert organizations, science and innovation organizations,
health and balneo-sanatorial institutions.
The Law no. 90 of May 29, 2014 (published on 27.06.2014) simplifies procedures of ceasing activity,
reorganization and liquidation of a company. The Law also reduced the waiting period from the
moment the notice has been published in the Official Gazette.
Amount of time required to complete registration procedures
Around 22,2% companies had contacted the State Registration Chamber over the last 3 years.
About 40% of them had registered their business and 60% have made changes to the incorporation
documents.
Some 33,8% had used intermediaries to register or amend the incorporation documents. The share has
insignificantly changed compared to previous periods.
During the analyzed period the registration process took 12,1 days. Managers spent 10,6 hours on
registration procedures.
Chart 4. Share of enterprises that have turned to the State Registration Chamber over the last three years
The amount of time required to make changes in the registration documents was 6,9 days. Procedures
took 7,3 hours to complete.
The above figures measure the time starting from the moment the documents have been officially filed
with the State Registration Chamber, specifically the moment the SRC representative decided that the
documents comply with the laws. These figures do not cover the cases where companies have turned
to an intermediary.
Registration9%
Modifications
13%
Have not filed for anything
78%
Page 20
20 Registration procedure
Cost of Doing Business 2015
Competitiveness Enhancement Project (CEP II) AOCDER Promo-Terra
Table 5. Average time spent on registration process in the last three years
Procedure Share of respondent
economic entities, %
Time, days Time, hours
Registration 40% 12,1 10,6
Changes in the registration documents 60% 6,9 7,3
It took about 7 days from the moment the paperwork was filed with the Registration Chamber to
obtain the registration documents.
Most of the managers registering a new business had to register the company with all institutions -
State Registration Chamber, Department of Statistics and Sociology, Tax Inspectorate, National Health
Insurance House and National Social Insurance House.
Table 6. Time to complete the primary registration procedure, by government institutions, in the last three years
Duration Time spent
Government body Reported, % days Reported, % hours
State Registration Chamber 97 7,1 91 4,8
Statistics and Sociology Department 58 2,2 61 2,0
Tax Inspectorate 80 2,0 74 2,7
National Health Insurance House 67 1,7 72 2,2
National Social Insurance House 64 1,9 67 2,2
The amount of time spent to make changes in the incorporation documents was considerably lower -
5,0 days.
Most of the changes in the incorporation documents had to be registered only with the State
Registration Chamber.
Table 7. Time on the procedure to modify in the incorporation documents, by government body, in the last three years
Duration Time spent
Government body Reported, % days Reported, % hours
State Registration Chamber 86 5,0 91 3,9
Department of Statistics and Sociology 22 2,4 26 2,0
Tax Inspectorate 41 2,6 53 3,1
National Health Insurance House 22 2,0 30 2,6
National Social Insurance House 22 2,2 30 2,7
Most of the time spent by managers during the registration process was with the State Registration
Chamber - 5 hours. Registering entries with other institutions took 2-3 hours each.
Modifications in the documents took less time - 3,9 hours with the State Registration Chamber. Less
time was spent with other institutions: between 2 and 3,1 days.
Costs of registration procedures
Primary registration of a company with the State Registration Chamber cost owners around 99$. An
insignificant number of respondents mentioned payments to other institutions.
Page 21
21 Registration procedure
Cost of Doing Business 2015
Competitiveness Enhancement Project (CEP II) AOCDER Promo-Terra
Costs incurred to make changes in the registration documents are lower. In the past 3 years managers
have paid around 66$ to the State Registration Chamber.
Perception of procedures
Respondents who registered or modified incorporation documents during the last three years were
asked to assess the problems encountered by scoring from 1 to 5, where 1 - no issues and 5 - major
issues. The table below illustrates the assessment of business registration issues.
Table 8. Registration-related issues
Problems 2012 2013 2014 2015
Difficult registration procedures 2,3 2,2 1,7 1,9
High costs of the procedure 2,6 2,3 1,8 2,0
Required amount of registered capital 2,3 2,5 1,6 1,8
Need to prove the address of the legal entity 2,2 2,3 1,3 2,0
The need to make unofficial payments 1,3 1,9 1,2 1,7
The data represent the opinion of respondents that have registered or made changes to the
incorporation documents over three years: the survey period and two previous years.
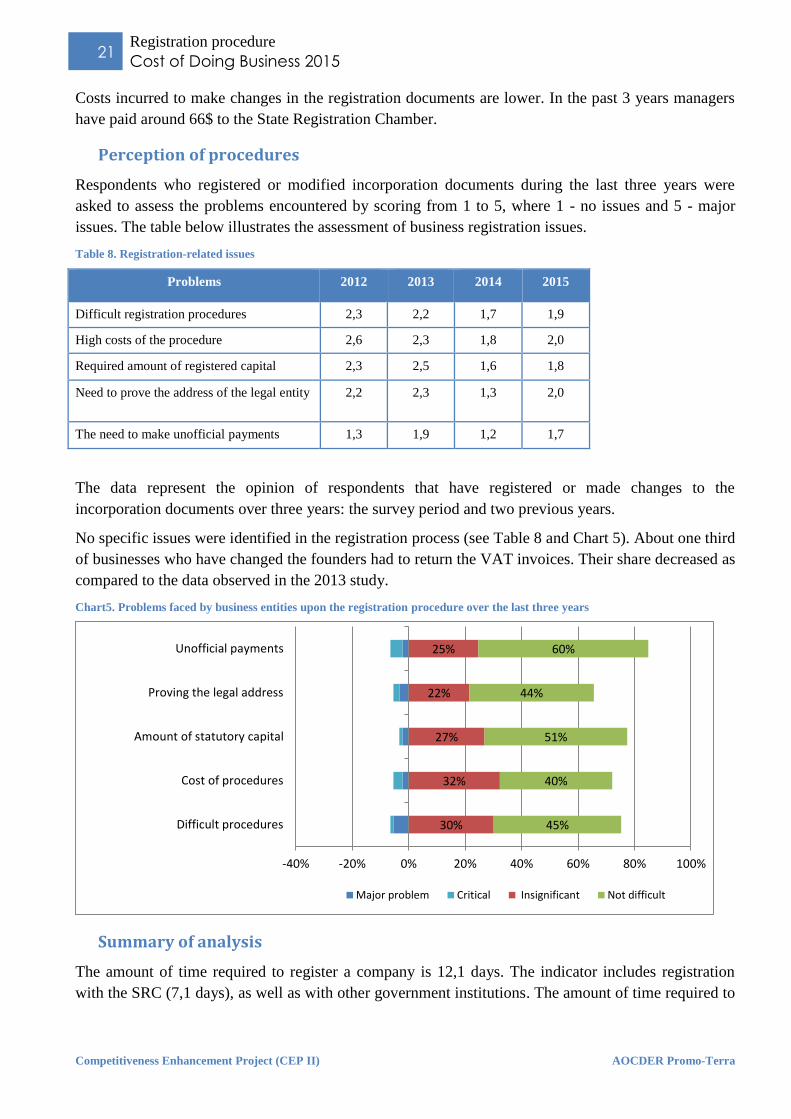
No specific issues were identified in the registration process (see Table 8 and Chart 5). About one third
of businesses who have changed the founders had to return the VAT invoices. Their share decreased as
compared to the data observed in the 2013 study.
Chart5. Problems faced by business entities upon the registration procedure over the last three years
Summary of analysis
The amount of time required to register a company is 12,1 days. The indicator includes registration
with the SRC (7,1 days), as well as with other government institutions. The amount of time required to
30%
32%
27%
22%
25%
45%
40%
51%
44%
60%
-40% -20% 0% 20% 40% 60% 80% 100%
Difficult procedures
Cost of procedures
Amount of statutory capital
Proving the legal address
Unofficial payments
Major problem Critical Insignificant Not difficult
Page 22
22 Registration procedure
Cost of Doing Business 2015
Competitiveness Enhancement Project (CEP II) AOCDER Promo-Terra
modify the incorporation documents - 6,9 days, out of which 5 days are spent with the State
Registration Chamber.
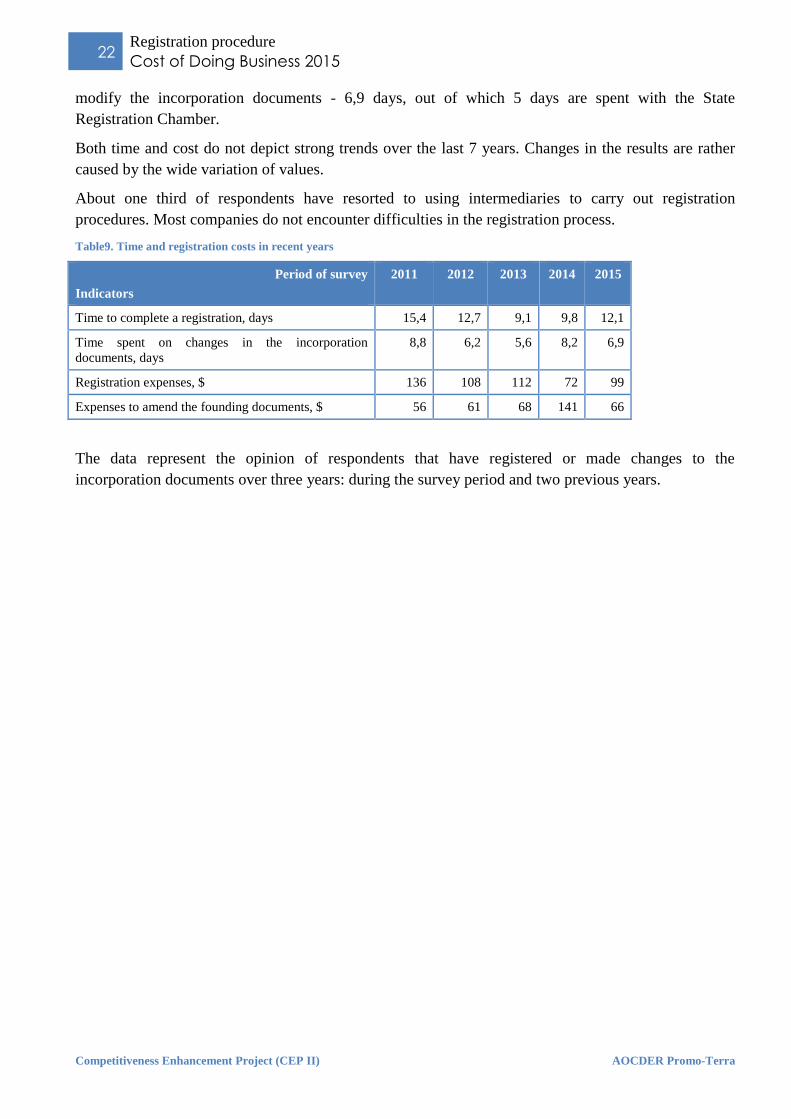
Both time and cost do not depict strong trends over the last 7 years. Changes in the results are rather
caused by the wide variation of values.
About one third of respondents have resorted to using intermediaries to carry out registration
procedures. Most companies do not encounter difficulties in the registration process.
Table9. Time and registration costs in recent years
Period of survey
Indicators
2011 2012 2013 2014 2015
Time to complete a registration, days 15,4 12,7 9,1 9,8 12,1
Time spent on changes in the incorporation
documents, days
8,8 6,2 5,6 8,2 6,9
Registration expenses, $ 136 108 112 72 99
Expenses to amend the founding documents, $ 56 61 68 141 66
The data represent the opinion of respondents that have registered or made changes to the
incorporation documents over three years: during the survey period and two previous years.
Page 23
23 Constructions
Cost of Doing Business 2015
Competitiveness Enhancement Project (CEP II) AOCDER Promo-Terra
3. Constructions
Regulatory framework
The operations carried out by legal and natural persons in constructions are regulated by Law no. 721-
XII of 2 February 1996 on Quality in Constructions. The law refers to new constructions and
upgrading works, modifications, transformations, repairs and strengthening.
According to the amendments introduced by Law no.153 of 30.07.2015, a construction may
commence only after the project has been verified by project verifiers certified with the authorised
institutions.
Compliant with this law there were approved two Government Decisions on 25 June 1996: no. 360 on
Government Control of Construction Quality and Government Decision no. 361 on Construction
Quality Assurance.
Decision no. 360 approves three regulations aimed at quality control in constructions:
The regulation establishes ways to exercise government control on quality in constructions;
Regulation of Building Inspection Agency;
Regulation on the control over the use of public investments in construction.
Decision no. 361 approves the Regulation on project verifications and performing of constructions. It
also approves the technical expertise of the projects and constructions. The Regulation stipulates the
procedures for verification and technical expertise of the project as well as verification techniques of
the construction process.
The final approval is governed by Regulation on clearance of constructions and related facilities,
approved 23 May 1996 by Government Decision no. 285. The Regulation stipulates that the investor
must submit to the acceptance commission the opinion of fire safety and sanitation services,
Department of Environmental Protection and other control bodies accompanied by an opinion on the
actual completion of the work.
The main responsibilities in placing the construction into service following the final approval are
stipulated in the Regulation on monitoring the construction's performance, interventions over time and
post-use of construction, approved 24 April 1997 by Government Decision no. 382.
Law no. 835/1996 "On urban planning and territorial development" of 17 May 1996 exhaustively
establishes the procedure on the issue of planning certificate and construction authorisation:
Planning certificates and construction authorisations are issued by local administration
authorities. The application is accompanied by documents provided by the regulations
governing the procedure for issuance of planning certificate and of the construction
authorisation. The request of other documents is prohibited.
The local administration authority decides on the issue of the planning certificate and of the
construction authorisation or their refusal within 15 days from the filing date. The applicant is
notified about the decision on the issue of the planning certificate and of the constructions
authorisation not later than the day following the decision date.
If the public administration authority remains silent for the time prescribed by law, the
planning certificate and the construction authorisation will be deemed granted. If the applicant
does not receive a written notification on the reasons for the registration denial and/or for the
Page 24
24 Constructions
Cost of Doing Business 2015
Competitiveness Enhancement Project (CEP II) AOCDER Promo-Terra
rejection of the application for authorisation/planning certificate, the construction may
commence.
The deadlines for issuing planning certificates and building or dissolution authorisations, as well as
payments incurred for these are set forth in Law no. 163 of 09.07.2010 regarding the authorisation of
construction works. The costs for the issue of a planning certificate or of an informative planning
certificate are established annually by the decision of the local council. The cost cannot exceed 50 lei.
Costs for a building/demolition authorisation cannot exceed 100 lei. Extending the validity period of
the planning certificate and of the building/construction authorisation requires no additional payment.
The main provisions contained in the regulation on constructions are:
The use of land plots and planning can be performed only after planning certificate has been
obtained.
Construction works are performed only according to a plan developed either by an authorized
natural or legal person.
Constructions can commence only following the issue of the building authorisation.
The quality of constructions of any use, regardless of their type of ownership and source of
funding, as well as construction works, reconstructions, upgrading and major repairs,
manufacture of construction materials and items are subject to government control.
The Government Construction Inspection carries out the quality of construction verifications in
all stages of the construction (planning, design, authorisation, building progress, performance,
post-use, decisive phases and manufacture of building materials and items).
Costs and time spent to obtain construction authorisations
According to the survey, 29% of the interviewed companies have moved into new premises in the past
three years. About 7% of them had built these facilities, 22% have repaired or adjusted them, while
71% used them without making any changes.
Almost 75% of respondents have turned to design companies to obtain the required permissions and
advice to commence the construction works.
The number of respondents who build by themselves has declined considerably in recent years. Given
the small size of the sub-sample, an analysis is impossible to make:
9 companies have built new premises, turning to design companies to obtain authorisations;
3 companies have built new premises, filing by themselves for an authorisation to build or
place into service.
In order to obtain relevant data on the cost and amount of time required to obtain construction
authorisations, we recommend that a survey be conducted among a minimum of 100 units, covering
only companies that have built new premises.
Obtaining permits for readjustment of premises took on average 14,4 days. Managers spent about 9,1
hours for this process.
Page 25
25 Constructions
Cost of Doing Business 2015
Competitiveness Enhancement Project (CEP II) AOCDER Promo-Terra
Table10. Time and costs to obtain authorisations to commence reconstruction works
Have
reported
Amount,
USD
Formal payments 80% 87
Payments for notary services 18% -
Payments to lawyers and
intermediaries
18% -
Transportation expenses 45% 15
“Voluntary contributions” 20% -
Unofficial payments 18% -
After the repairs have been completed, the surveyed companies had spent 12 hours to obtain all
authorisations required to place into service the renovated spaces. The total amount of time spent on
procedures was 17 days.
Table11. Time and costs for obtaining authorisations to place into service the reconstruction works
Have
reported
Amount,
USD
Formal payments 83% 79
Payments for notary services 25% -
Payments to lawyers and
intermediaries
13% -
Transportation expenses 43% 16
“Voluntary contributions” 15% -
Unofficial payments 20% -
Around 26% of the companies that used premises without modifying them, had to obtain permissions
to use them.
Perception of procedures
About 72% respondents stated that they did not notice any changes, for good or for worse, in the
construction sector. Nearly 20% said that the situation has worsened. (Chart6).
Chart6. Perception of changes in procedures governing the use of premises
Only 7% respondents released into service premises without obtaining the necessary authorisations to
begin construction. Only two companies said they had obtained authorisation by "unofficial means".
18 72 10
0% 20% 40% 60% 80% 100%
Worse Same Better
Page 26
26 Constructions
Cost of Doing Business 2015
Competitiveness Enhancement Project (CEP II) AOCDER Promo-Terra
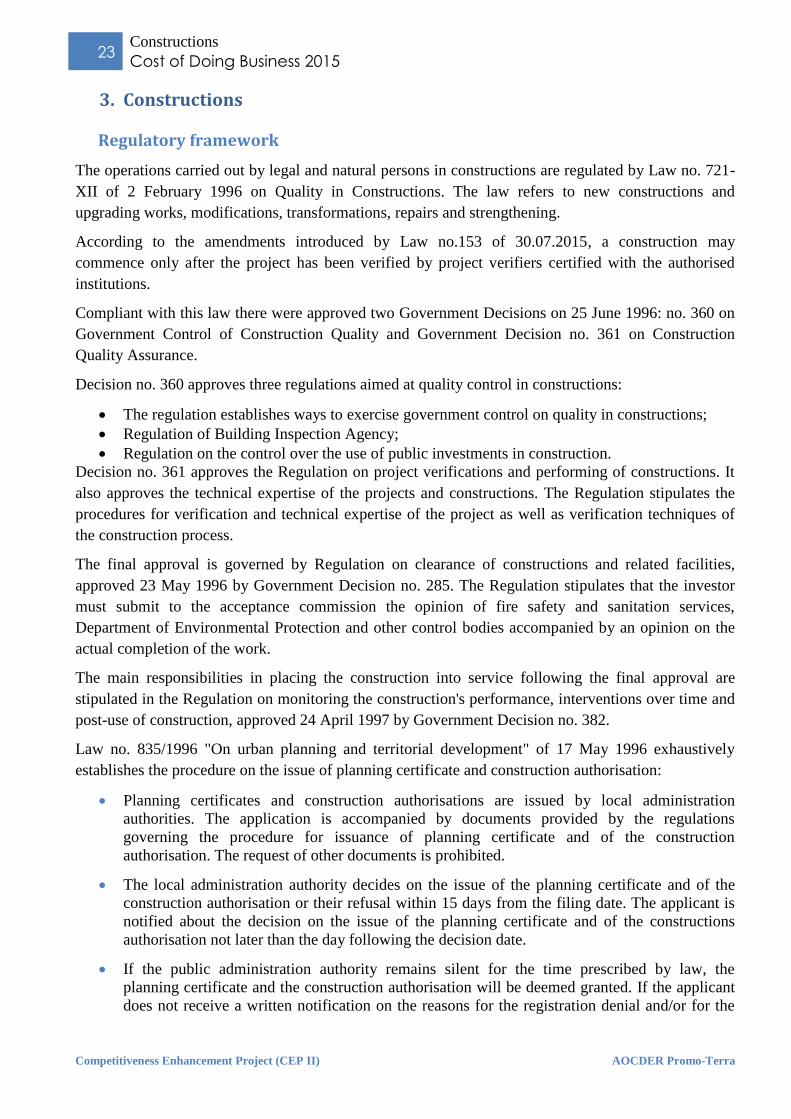
Respondents who started using premises in the last three years were asked to assess the issues related
to obtaining construction permits by scoring from 1 to 5, where 1 - no issues and 5 - major issues.
As shown in Table 12, there are no specific issues relating to obtaining authorisations. The share of
those who have experienced difficulties is higher than in other regulatory areas.
Table12. Issues relating to obtaining authorisations for reconstruction and repairs
Problems Share
Difficult procedures 2,7
Procedures taking too long 2,9
High costs 2,9
The need to make unofficial payments 2,4
Chart7. Issues relating to obtaining authorisations for construction and repair
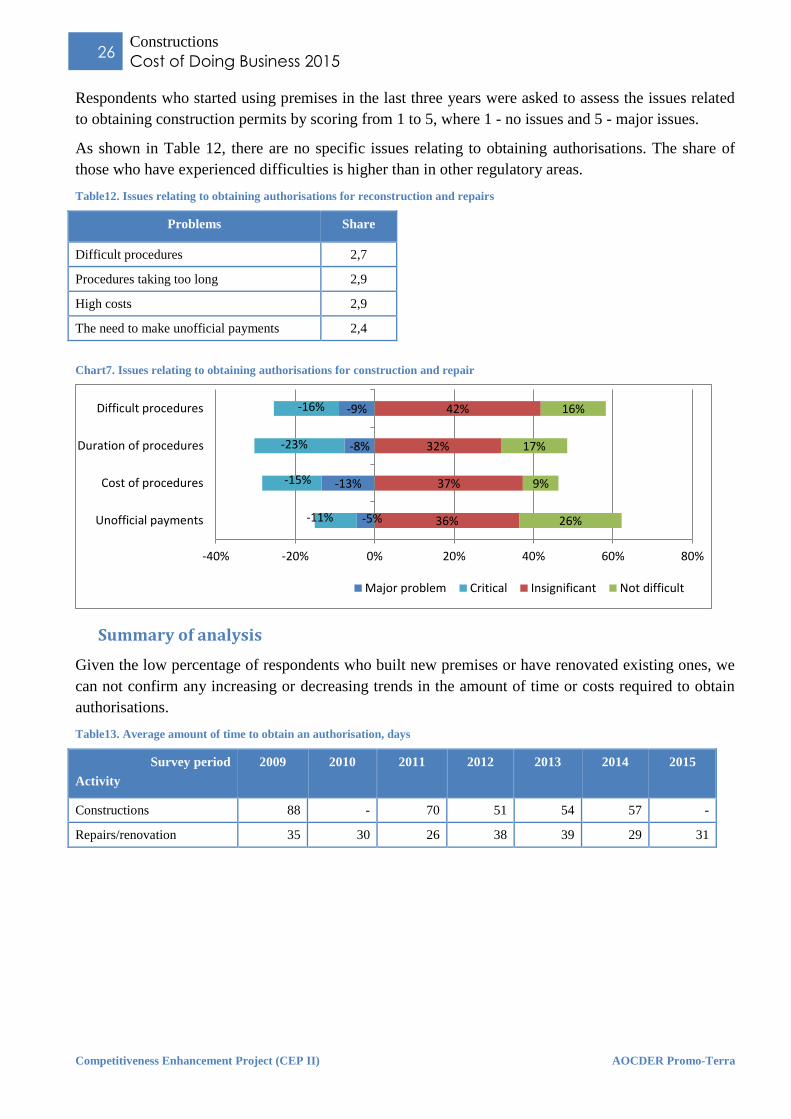
Summary of analysis
Given the low percentage of respondents who built new premises or have renovated existing ones, we
can not confirm any increasing or decreasing trends in the amount of time or costs required to obtain
authorisations.
Table13. Average amount of time to obtain an authorisation, days
Survey period
Activity
2009 2010 2011 2012 2013 2014 2015
Constructions 88 - 70 51 54 57 -
Repairs/renovation 35 30 26 38 39 29 31
-5%
-13%
-8%
-9%
-11%
-15%
-23%
-16%
36%
37%
32%
42%
26%
9%
17%
16%
-40% -20% 0% 20% 40% 60% 80%
Unofficial payments
Cost of procedures
Duration of procedures
Difficult procedures
Major problem Critical Insignificant Not difficult
Page 27
27 Licensing
Cost of Doing Business 2015
Competitiveness Enhancement Project (CEP II) AOCDER Promo-Terra
4. Licensing
Regulatory framework
The licensing system in Moldova is regulated by the framework Law no. 451-XV of 30 July 2001 on
Licensing of Entrepreneurship, substantially amended by Law no. 281 of 14 December 2007.
According to the Law no. 451/2001, holding a license is compulsory in performing 44 types of
business. These licenses are issued by the following licensing bodies:
Licensing Chamber (32 types of businesses);
National Bank of Moldova (1 type of business);
National Commission of Financial Market (5 types of business);
National Energy Regulatory Agency (3 types of business);
National Regulatory Agency for Electronic Communications and Information
Technology (2 types of business);
Broadcasting Coordination Council (1 type).
Law no. 281/2007 of 20.06.2008 introduced the notions of:
tacit approval – a license is deemed granted or renewed if the licensing authority does not
notify the applicant within the set time limits;
single window– procedure whereby the licensing authority verifies the authenticity of the
information presented by the applicant/licensee without involving him/her in the process.
The present study does not cover companies whose activity is regulated through licenses granted by
the National Bank of Moldova and the National Commission of Financial Market.
Documents required to obtain a license
To obtain a license, the company files a default application with the concerned authority, containing:
a) general information on business;
b) type of business;
c) the applicant signs an affidavit to conduct the type of business for which the license was
issued and the for the authenticity of the submitted paperwork.
In addition to the application for license, the following documentation is being attached:
a) a copy of the certificate of state registration of the enterprise or organization;
b) additional documents as provided by legislative acts regulating the licensed type of business
for which the license is requested.
The request of documents other than those contained in this article is prohibited.
The data in the documents and the information submitted is checked through the single window
procedure.
The application for the license issue/renewal and the documents attached are recorded into the register.
A copy of the register is sent (handed) to the license applicant, indicating the application date,
authenticated by signature of the licensing authority.
Issue of license or rejection of the application for obtaining a license
The licensing authority decides on the issue or rejection of the application based on the application and
the documents attached, within a maximum of 5 days from the registration date.
Page 28
28 Licensing
Cost of Doing Business 2015
Competitiveness Enhancement Project (CEP II) AOCDER Promo-Terra
If the application for obtaining a license is rejected, the applicant may file a second application after
removing the causes that led to rejection.
The license shall be deemed granted if the licensing authority does not notify the applicant within the
terms provided by law. If the cumulative deadline set to notify the applicant on the rejection or
approval of the licensing application or on its registration expires, the applicant may start to operate
the business s/he requested the license for, provided there was no written notice on the refusal grounds.
Tacit approval procedure applies to all licenses except those issued by regulatory authorities in the
financial sector (banking and non-banking), in businesses trading firearms, ammunition and
explosives.
License fees
The standard license fee is 3 250 MDL.
License validity period
Most often (29 out of 44 types), licenses are issued for a period of 5 years. Some licenses are issued for
1 year (3 types) and 3 years (1 type). The validity of licenses for businesses that do not fall under the
jurisdiction of the Licensing Chamber is established by laws governing the named license activity.
Law no. 26 of 13.03.2014 has introduced the e-licensing procedure. This allows the applicant, via a
web interface, to send online applications of issue/renewal or requests to reissue a license. The
approval or rejection of the application is also received electronically.
Number of licenses
Nearly half (47%) of the surveyed companies held a license at the time of questioning. In 13% of these
cases the companies had two or more licenses. The average number of licenses per company is 1,4 the
same as in previous years.
Most license holders believe that their number per company has not changed over the last year.
Chart8. Changes in the number of licenses
The average validity period has not changed over the past year – 3,7 years.
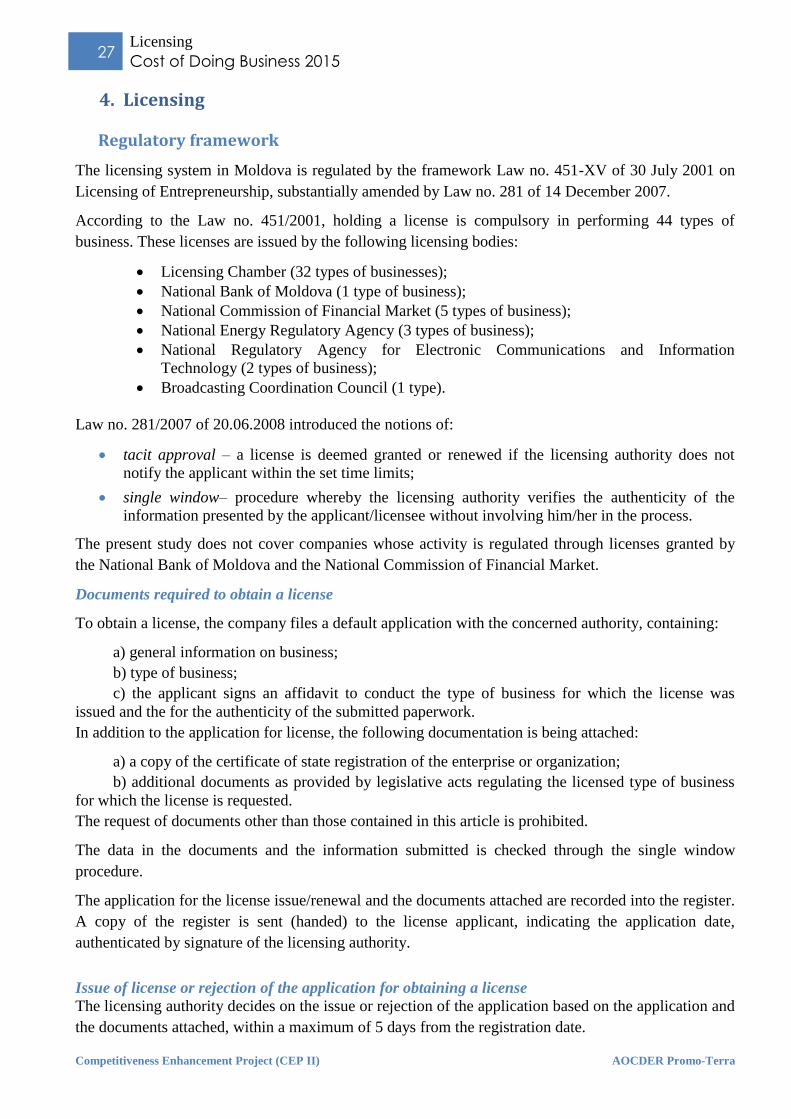
Costs to obtain a license
The average amount of time required to obtain a license is around 10,6 days. The costs amount to
$163, of which $139 is the fee for the issue of license. Time spent by managers to obtain a license has
been relatively short - about 7,4 hours.
8% 82% 10%
0% 20% 40% 60% 80% 100%
More Same Fewer
Page 29
29 Licensing
Cost of Doing Business 2015
Competitiveness Enhancement Project (CEP II) AOCDER Promo-Terra
Table14. Average costs of obtaining a license
Category of payment Have made
payments, %
Amount,
$
Official payments / license fee 89% 139
Expertise and evaluation 23% 35
Notary services 23% 16
Lawyers and intermediaries 11% 32
Unofficial payments 15% 17
Transportation payments 45% 14
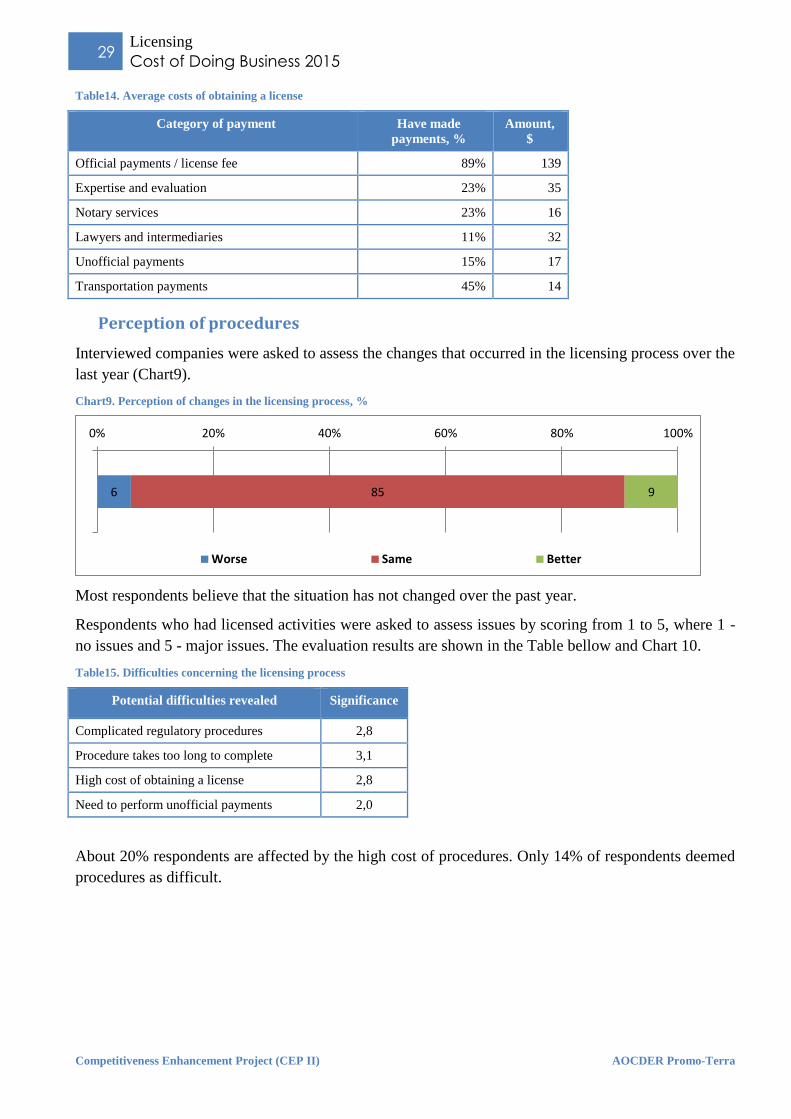
Perception of procedures
Interviewed companies were asked to assess the changes that occurred in the licensing process over the
last year (Chart9).
Chart9. Perception of changes in the licensing process, %
Most respondents believe that the situation has not changed over the past year.
Respondents who had licensed activities were asked to assess issues by scoring from 1 to 5, where 1 -
no issues and 5 - major issues. The evaluation results are shown in the Table bellow and Chart 10.
Table15. Difficulties concerning the licensing process
Potential difficulties revealed Significance
Complicated regulatory procedures 2,8
Procedure takes too long to complete 3,1
High cost of obtaining a license 2,8
Need to perform unofficial payments 2,0
About 20% respondents are affected by the high cost of procedures. Only 14% of respondents deemed
procedures as difficult.
6 85 9
0% 20% 40% 60% 80% 100%
Worse Same Better
Page 30
30 Licensing
Cost of Doing Business 2015
Competitiveness Enhancement Project (CEP II) AOCDER Promo-Terra
Chart10. Issues related to licensing
Summary of analysis
The license fee has decreased over the past year (Table16), on the account of the Dollar rising against
Moldovan Leu. The share of respondents who noticed improvements in this area is higher than that of
respondents who say otherwise. The amount of time to obtain a license has decreased in the last 2
years.
Table16. Evolution of costs related to licensing activities
2008 2009 2010 2011 2012 2013 2014 2015
Share of enterprises subject to licensing 68% 71% 61% 61% 52% 49% 37% 47%
Average number of licenses 1.6 1,3 1,3 1,3 1,3 1,4 1,4 1,4
Time to obtain a license, days 18 20 22 18 16 18 14 11
Average cost, $ 301 193 270 240 266 294 401 163
Share of respondents who made
unofficial payments, %
10% 15% 14% 7% 9% 8% 1% 8%
-5%
-14%
-12%
-10%
-1%
-6%
-5%
-4%
25%
30%
29%
39%
46%
21%
16%
21%
-30% -20% -10% 0% 10% 20% 30% 40% 50% 60% 70% 80%
Unofficial payments
Cost of procedures
Duration of procedures
Difficult procedures
Major problem Critical Insignificant Not difficult
Page 31
31 Obtaining authorisations
Cost of Doing Business 2015
Competitiveness Enhancement Project (CEP II) AOCDER Promo-Terra
5. Obtaining authorisations
Overall regulatory framework
The notion of authorisation includes: authorisations, permits, certificates, clearances, approvals,
coordination, patents, certificates of qualification issued by public authorities or the institutions legally
authorized with regulatory and control functions.
This chapter reviews operating authorisations, not included in other chapters. The operation
authorisation is defined as a separate administrative act certifying the right to practice trading,
indicating the location of the business unit or of the place open for sale. The notion of operation
authorisation does not overlap the notion of license for the operations that are licensed, as required by
law.
Most authorisations are governing the trading operations. Pursuant to Law no. 231 of 23.09.2010 on
Domestic Trade, trading operations are authorized by the first local administration authority or by the
municipality of Chisinau, where the trader operates.
To obtain an authorisation, the applicant files an application plus the following documents submitted
in original:
a document confirming the state registration of the business entity under the applied legislation;
documents certifying the professional training of individuals (private entrepreneurs) issued by
trading (economic)-profiled institutions, as authorized by law; a certification of skills acquired
following the work experience in these institutions;
documents confirming the right to own or lease the business unit;
the location plan of the business (for booths, stalls and other mobile units);
consent by the sales area administrator to trade in airports, railway stations, stations and other
public areas;
tenancy agreement or the authentication title of the land owner;
the operating hours of the commercial unit;
affidavit of compliance with the authorisation requirements;
catering units are required additionally to have a sanitary authorisation; animal or agricultural
markets trading fresh animal products within premises need to submit a veterinary health
authorisation.
The local public administration authorities shall examine, within 20 calendar days, the application and
other documents specified, along with the jurisdictional public authorities. Documents are to be
verified on their compliance with legal provisions, under the principle of "single window".
Law no. 101 of 13 December 2012 introduced the concept of combined trading.
Law no. 231 of 23.09.2010 provides for the issue of operating authorisations for:
Page 32
32 Obtaining authorisations
Cost of Doing Business 2015
Competitiveness Enhancement Project (CEP II) AOCDER Promo-Terra
a) business units selling non-food goods or providing trading services (except catering), holding
an ownership title for an indefinite period (for the operating period);
b) business units selling food goods, including mixed selection; public catering units holding an
ownership title for a 5 year period;
c) business units located in leased premises - for the period set in the lease agreement, but not
exceeding the period stipulated in point b) early termination of the lease agreement entails the
termination of the operating authorisation;
d) for mobile business units - 1 year.
Authorisations in the municipality of Chisinau are issued under the Regulation on the issue of
operating authorisations to trading units and businesses rendering social services throughout the
municipality. This Regulation was approved by decision no. 13/4 of 27 December 2007 by Chisinau
Municipal Council.
The Regulation was not updated under the laws in force in the Republic of Moldova, in particular,
under the Law no. 231 of 23.09.2010 on Domestic Trade.
Contrary to Law no. 231 of 23.09.2010, the Regulation of the Chisinau Municipal Council provides for
the request of:
- sanitary authorisations for all trading units;
- contract on transportation of solid waste;
- a notice from the district praeture and from the general Department of architecture, urbanism
and land relations;
- a notice from the state supervisory body against fires for shopping centres, fuel stations, units
trading flammable goods, dance clubs, discos, disco-bars, saunas;
According to the decision by the municipal Council, the authorisation specifies the working program.
Companies have to apply for another authorisation if they make changes in the working program.
The reasons why the Town Hall can refuse to issue the authorisation or decide to withdraw it is
contradictory to the Law no. 231 of 23.09.2010.
Costs to obtain authorisations
Almost half (49%) of businesses in Moldova are obliged to obtain authorisations for their current
activity. Most of them (73%) are issued by local authorities. In order to obtain an authorisation,
managers have spent on average 6,4 hours. The authorisation was obtained in 11,9 days.
The cost for obtaining authorisations is approximately $90. The table below represents the distribution
of costs for obtaining an authorisation by type of payment.
Page 33
33 Obtaining authorisations
Cost of Doing Business 2015
Competitiveness Enhancement Project (CEP II) AOCDER Promo-Terra
Table17. Average costs incurred by the interviewed companies to obtain an authorisation
Payment type Have made
payments, %
Amount,
$
Official payments/authorisation fee 88% 85
Expertise and evaluation 16% 23
Notary services payments 14% 17
Payments to lawyers and intermediaries 11% 19
Unofficial payments 13% 19
Transport payments 49% 10
The highest share in total expenses to obtain an authorisation is held by the official payments.
According to Law no. 231 of 23.09.2010 the issue of authorisations is not taxed.
Perception of procedures to obtain an authorisation
The interviewed businesses were asked to assess the changes in the process of obtaining an
authorisation over the last year. Responses are presented in Chart 11.
Chart11. Perception of changes in the authorisation obtaining process
Most respondents have not noticed significant changes in the conditions to obtain an authorisation. The
share of those who think that the situation has improved slightly exceeds the percentage of those who
say otherwise.
Respondents who obtained authorisations were asked to assess the difficulties posed by these
procedures by scoring from 1 to 5, where 1 - no difficulties and 5 - major difficulties. The evaluation
results are shown in Chart12.
Table18. Problems arising from the process of obtaining authorisations
Problems Share
Difficult regulatory procedures 2,4
Long time to complete procedure 2,5
High costs to obtain authorisations 2,7
Exaggerated unofficial payments 1,8
Although the procedures for obtaining authorisations generate fewer problems compared to previous
years, they remain too difficult (Chart12). About 18% think that procedures are difficult, and 19% -
that they take too long.
13% 70% 17%
0% 20% 40% 60% 80% 100%
Worse Same Better
Page 34
34 Obtaining authorisations
Cost of Doing Business 2015
Competitiveness Enhancement Project (CEP II) AOCDER Promo-Terra
Chart12. Problems arising from the process of obtaining authorisations
Summary of analysis
In recent years, the situation regarding procedures for obtaining authorisations has slightly improved.
Both the share of companies having to obtain authorisations and the time to obtain them have declined.
Lower costs for procedures were influenced by the MDL depreciation.
Table19. Costs to obtain authorisations
2009 2010 2011 2012 2013 2014 2015
Share of companies requiring authorisations 78% 78% 80% 71% 71% 63% 49%
Time to obtain an authorisation, days 16 17 13 13 15 13 12
Average cost, $ 210 283 198 224 215 77 90
According to the Law no. 231 from 23.09.2010, companies that rent spaces could request the trade
authorization for a period not higher than the rent contract validity. The rent contracts for a period of
three years and higher should be registered at the cadastral office, a fact that is avoided in almost all
cases. Usually, the rent contracts have the validity of two years and 10-11 months. Most of small
companies do not have own premises and have to request trade authorizations for a maximum period
of three years.
-3%
-9%
-8%
-10%
-4%
-14%
-11%
-8%
24%
31%
34%
38%
52%
20%
22%
26%
-40% -20% 0% 20% 40% 60% 80% 100%
Unofficial payments
Cost of procedures
Duration of procedures
Difficult procedures
Major problem Critical Insignificant Not difficult
Page 35
35 Equipment
Cost of Doing Business 2015
Competitiveness Enhancement Project (CEP II) AOCDER Promo-Terra
6. Equipment
About 38% of all respondents have purchased equipment over the last three years. Around 66% of
them hold certificates of equipment compliance with the standards of the Republic of Moldova.
Over 7% of companies holding certificates had obtained them by themselves. In all other situations the
certificates have come with the equipment.
Obtaining the certificate of compliance with the standards in the Republic of Moldova takes about 9,8
days. The total time spent by managers to obtain a certificate of compliance was 6,3 hours.
The number of companies that had certified equipment has declined significantly. Therefore, in the
current survey, only 11 companies said that they had certified by themselves the purchased equipment.
The average amount of time required to obtain the certificate had a relatively low dispersion, the data
being presented in Table below.
Table20. Comparing the time and costs for obtaining an authorisation for equipment
Survey period
Type of payments
2008 2009 2010 2011 2012 2013 2014 2015
Time to obtain a certificate of compliance
with the standards in the Republic of
Moldova, days
12 12 13 12 10 9 11 10
The regulation on purchase and placing into service of equipment is not a widespread practice and is
not perceived as an important issue.
Page 36
36 Trading across borders
Cost of Doing Business 2015
Competitiveness Enhancement Project (CEP II) AOCDER Promo-Terra
7. Trading across borders
Regulatory framework
General provisions on customs procedures are included in the Customs Code of the Republic of
Moldova, approved by Law no. 1149-XIV of 20.07.2000, reissued on 1.1.2007.
All import and export procedures can be operated only after their duly registration with the Customs
Service in the Republic of Moldova.
The Customs Code establishes the rights and obligations of the customs broker, as well as the situations
where the license of a customs broker may be withdrawn.
The customs broker is not responsible for:
a) failure to comply with customs destination terms appointed by the person passing goods and/or
vehicles;
b) violation of rules on labeling goods with excise stamps;
c) performing foreign exchange operations related to the transit of goods and/or means of transport
across the customs border of the Republic of Moldova;
d) other actions s/he is not culpable of.
Law no. 221 of 19.10.2012 introduced the mandatory vignette - road tax in Moldova for vehicles not
registered in the Republic of Moldova.
Repatriation of funds is a procedure also covered by import-export operations. Even if not directly
related to customs procedures, it is a requirement imposed by Law, which affects the import-export
process.
The Law no. 1466-XIII of 29 January 1998 on "Regulation of repatriation of money funds, goods and
services originating from foreign external economic transactions" refers to the notion of "repatriation
of money funds". Repatriation of funds is the collection of money from non-resident businesses related
to exports of goods, provision of services/works to non-residents. The term also comprises other
foreign operations and transactions in accounts opened with banks licensed in the Republic of
Moldova. The amount of funds must be shown in the customs declaration, while the costs of services
and works - in the confirming documents (contracts, deeds of works performed or services rendered,
invoice).
Businesses mostly carrying out export operations face another procedure - recovery of VAT.
The refund of value added tax is regulated by Government Decision no. 93 of 01.02.2013. The
company has the right to choose the method of repayment: extinction of tax liability by offsetting
and/or money refund.
The tax authority is obliged to adopt the decision on the procedure for the refund, relying on the risk
criteria stipulated in the Decision. The decision must be taken within 3 working days from the date of
the application for refund was filed.
The tax authority initiates the thematic control following the filing of application on behalf of the
taxable subject. Applicants who meet the following four conditions are exempt from control:
1) subject of taxation has been active for at least two years;
Page 37
37 Trading across borders
Cost of Doing Business 2015
Competitiveness Enhancement Project (CEP II) AOCDER Promo-Terra
2) subject of taxation was granted refunding of VAT previously at least twice and the last VAT
refund took place more than one year earlier;
3) the last thematic control on the VAT refunding revealed that the amount of refunded VAT,
confirmed by the tax authority, corresponds to the amount declared by the payer;
4) during the last tax control the amounts of taxes, duties, compulsory social insurance
contributions and health insurance premiums did not exceed 1% of the total deliveries made
during the controlled fiscal periods.
The VAT refund is made within 45 days of which 37 days are spent on control and decision making,
while 8 days - for the actual refund.
Import transactions
About 19% of respondents carried out import operations over the past three years. On average, an
importer performs 7,5 transactions per year. Both the share of companies carrying out import
transactions and their frequency have declined.
Certification costs of imported goods
Less than half of importers (39%) were faced with the need to obtain certificates for imported goods to
prove their compliance with the standards in the Republic of Moldova. In 78% cases, companies that
had to obtain certificates of compliance with the standards in the Republic of Moldova had already
been certified under the requirements in the country of origin.
The certification of goods process took 9,7 days. The amount of time spent to obtain the certificate was
7,2 hours. Costs amounted to 76$. About 11% of respondents have paid bribes.
About 24% of respondents that had to obtain certificates of compliance with the standards in the
Republic of Moldova for their imported goods mentioned cases where their goods have been blocked
in customs because they lacked certificates of compliance. Almost 20% of respondents that had to
obtain certificates of compliance with the standards in the Republic of Moldova for their imported
goods agreed with the customs officers to present the certificate later. Both shares are lower compared
to two years ago.
About 27% importers had to obtain sanitary authorisations for imported goods, slightly fewer
compared to the previous period. After importing goods, companies needed 2,8 days to receive
sanitary certificates. The time used to obtain a certificate was 3,7 hours.
Customs costs
In the last three years, customs procedures took 1,5 days to complete. Expenses on customs procedures
haven't changed either in the last 4 years, standing at 136$. Most of the amount sums up the official
fees. Costs, expressed in MDL, increased by 20%.
Page 38
38 Trading across borders
Cost of Doing Business 2015
Competitiveness Enhancement Project (CEP II) AOCDER Promo-Terra
Table21. Costs and time required for customs import procedures
Type of payment Have made
payments, %
Average amount
$
Days 100 1,5
Official payments, $ 100 114
Penalties (incl. confiscations) 19 66
Other payments (incl.
unofficial)
20 45
Total costs, $ 100 136
Perception of import procedures
Opinions on business activities related to imports were divided. More than 11% respondents claimed
that the environment has worsened, other 19% stated the opposite.
Chart13. Perception of changes in import procedures
Unequal conditions, high costs and indicative prices are the main difficulties mentioned by importers.
Table22. Greatest difficulties on import
Elements Survey period
2011 2012 2013 2014 2015
Banning the import of certain types of goods 1,8 1,7 2,2 1,6 1,9
Difficulties in obtaining permits and licenses 2,2 2,1 2,4 1,6 2,1
Difficulties in certification 2,2 2,3 2,7 1,6 2,3
Customs procedures 3,1 3,2 3,0 1,8 2,3
High costs of customs procedures 3,1 3,1 3,3 2,3 2,6
Unequal conditions for importers 2,8 2,5 2,7 1,9 2,4
Corruption in customs 3,1 3,0 2,9 2,0 2,3
Indicative prices for products 2,7 2,8 2,7 1,8 2,4
Phytosanitary Certification 1,5 1,8 1,9 1,4 1,9
Note: issues were scored from 1 to 5, where 1 - no difficulties and 5 - significant difficulties.
11% 70% 19%
0% 20% 40% 60% 80% 100%
Worse Same Better
Page 39
39 Trading across borders
Cost of Doing Business 2015
Competitiveness Enhancement Project (CEP II) AOCDER Promo-Terra
Chart14. Perception of difficulties related to import transactions
Export transactions
Only 6,9% respondents carried out export operations in the past three years.
Costs of customs procedures
Customs procedures on export take 2,1 days, similar to previous years.
Companies pay 37$ to complete the entire customs procedure. However, a potential comparison with
previous years is risky due to the high dispersion caused by a low number of respondents.
VAT return
Almost 33% respondents have officially requested a VAT refund. About 36% of them used the amount
of VAT to offset against other tax liabilities, a simpler procedure compared to a refund. The other 64%
only sometimes resort to this procedure.
Assessment of export procedures
Around one third of respondents said that the business environment relating to exports has worsened
over the last three years. Their share is quite high and has not changed in the past three years.
Chart15. Perception of changes in export procedures
-40% -20% 0% 20% 40% 60% 80%
Phytosanitary certification
Indicative prices
Corruption
Unequal conditions
High costs of procedures
Customs clearances
Certification
Licenses and permissions
Ban on certain goods
-12%
-10%
-8%
-13%
-10%
-9%
-6%
-7%
-7%
-11%
-10%
-13%
22%
23%
25%
25%
27%
33%
25%
21%
31%
52%
33%
36%
32%
23%
28%
33%
39%
47%
Major problem Critical Insignificant Not difficult
33% 56% 12%
0% 20% 40% 60% 80% 100%
mai rău la fel mai bine
Page 40
40 Trading across borders
Cost of Doing Business 2015
Competitiveness Enhancement Project (CEP II) AOCDER Promo-Terra
The most important issue mentioned by businesses is the need of repatriation of funds within the
deadline set by Law. Difficulties were assessed using a scale of 1 to 5, where 1 - no difficulties and 5 -
great difficulties.
Table23. The most important issues related to export
Indicators Average
mark
Ban on export of certain goods 1,8
Problems related to obtaining permits and licenses 2,2
Difficulties related to certification under the laws in Moldova 2,2
Problems concerning the customs procedures 2,3
High costs of customs procedures 1,9
Traffic of influence in customs procedures 2,1
Corruption in customs system 2,0
The need to sell products only via Stock Exchange Market 1,7
Difficulties with VAT reimbursement 2,1
Difficulties in repatriation of money within the deadline set by the NBM 2,4
Summary of analysis
The amount of time and costs related to customs procedures on import have declined in the last year
(see
Table24).
Costs of customs procedures on export have decreased considerably in 2015. However, we can not
speak of an increasing or decreasing tendency, given the following:
1. The reduction in the number of companies carrying out import-export operations, which led to
an insufficient number of observations to estimate with an acceptable probability an increase or
decrease tendency of costs.
2. The amount of tax for customs procedures is directly proportional to the invoice value.
Table24. Evolution of procedures and regulations on import-export procedures
Indicators Period of survey
2009 2010 2011 2012 2013 2014 2015
Time spent on a customs procedure on import,
days per transaction
2,7 2,0 1,9 2,7 2,5 2,0 1,5
Cost of customs procedures on import, $ per
transaction
143 169 144 152 158 261 136
Time to complete customs procedures on export,
days per transaction
1,7 1,8 1,6 1,7 2,0 2,0 2,1
Cost of customs procedures on export, $ per
transaction
137 134 85 89 152 213 37
Page 41
41 Certification of goods and services
Cost of Doing Business 2015
Competitiveness Enhancement Project (CEP II) AOCDER Promo-Terra
8. Certification of goods and services
Regulatory framework
The certification of goods and services is governed by the following laws:
Law no. 590-XIII of 22 September 1995 "On Standardization" republished on 25.05.2012;
Law no. 420-XVI of 22 December 2006 "On the technical regulation activity";
Law No. 78-XV of 18 March 2004 "On food goods”.
The National Standards Institute is the national standardization body that coordinates the work of
technical standardization committees. Any business entity, regardless of its type of ownership and
legal form can form standardization subdivisions (services) establishing their structure and operation in
order to solve its tasks in standardization and quality assurance of products and services. Activities of
technical committees of standardization are monitored by the National Institute of Standardization.
Applying the national standards is voluntary. If public considerations and protection of consumer
interests make such measures necessary, the procedure may become mandatory. Also, the standards
become mandatory for businesses that have stated officially that their products meet the requirements
of these standards, in any form.
Certification costs
About 17% of the companies surveyed have certified goods. Businesses have two options in the
certification process:
1) certify individual batches of products or
2) certify mass manufactured products.
In the first situation the certificate is granted for a certain quantity of goods, in the second - for a
certain period. Around 63% companies certify individual batches of products. The other 37% certify
mass manufactured products. Their share has not changed over the past five years.
The certification of batch goods takes about 9 days. The certification of mass manufactured goods lasts
longer - about 13 days. The certification of mass manufactured goods costs about $63, the certification
of individual batches - $57.
Table25. Certification costs
Period of survey
Indicators
Mass manufactured goods Individual batches of goods
2012 2013 2014 2015 2012 2013 2014 2015
Time required for certification,
days
16,6 11,7 10,0 13,2 12,1 10,3 11,0 8,6
Costs, $ 191 158 311 63 145 124 167 57
According to data in Table 25, it can be noted that official payments hold the highest share in total
payments during the certification procedure. For mass manufactured goods, however, the share of
companies making unofficial payments is higher.
Page 42
42 Certification of goods and services
Cost of Doing Business 2015
Competitiveness Enhancement Project (CEP II) AOCDER Promo-Terra
Table26. Average costs of certification
Mass manufactured goods Individual batches of goods
Indicators Have made
payments
Amount, $ Have made
payments
Amount, $
Official payments 100% 49,6 100% 46,3
Transport expenses 85% 10,1 64% 13,2
Unofficial payments 38% 13,2 4% 66,2
Total 63,2 57,4
The values obtained in this study have a high degree of dispersion. The central tendency for costs was
determined based on the median, not the arithmetic average.
On average, a company certifies products 2,4 times per year. Their average period of validity is 12,7
months.
Perception of certification procedures
Over the past year respondents noted minor changes in the conditions for certification.
Chart16. Evolution of changes in the certification procedures
Table27. Problems encountered in the certification process
Problems Share
Long procedures for obtaining certificates 2,3
High costs to obtain certificates 2,5
High requirements for company's products 2,3
About 16% respondents encounter difficulties in meeting the requirements imposed by official
standards.
12% 81% 7%
0% 20% 40% 60% 80% 100%
Worse Same Better
Page 43
43 Certification of goods and services
Cost of Doing Business 2015
Competitiveness Enhancement Project (CEP II) AOCDER Promo-Terra
Chart17. Exporters' perception of difficulties related to certification procedures
Summary of analysis
About 17% of interviewed companies had to certify their goods, the same result as in the last three
years. In 2015 both the amount of time and costs required to obtain the compliance certificates for
individual batches of goods have decreased.
Table28. Evolution of product certification procedures
Indicators Period of survey
2009 2010 2011 2012 2013 2015
Time spent for obtaining a certificate for
mass manufactured products, days 17,8 13,6 13,0 16,6 11,7 13,2
Costs for obtaining a certificate for mass
manufactured products, $ 217 192 158 191 158 63
Time for obtaining a certificate for
individual batches of goods, days 11,2 13,3 11,7 12,1 10,3 8,6
Cost of obtaining a certificate for
individual batches of goods, $ 174 160 83 145 124 57
-10%
-2%
-1%
-6%
-8%
-8%
36%
34%
43%
26%
16%
20%
-30% -20% -10% 0% 10% 20% 30% 40% 50% 60% 70%
High requirements for company products
High costs to obtain certificates
Long procedures to obtain certificates
Major problem Critical Insignificant Not difficult
Page 44
44 Sanitary certification
Cost of Doing Business 2015
Competitiveness Enhancement Project (CEP II) AOCDER Promo-Terra
9. Sanitary certification
Regulatory framework
The government health (sanitary) and epidemiological regulation is governed by Law no. 10-XVI of 3
February 2009 on Government supervision of public health. Health rules establish safety and security
criteria in relation to the environment and occupational factors, products and services, requirements to
ensure favorable life and health conditions. These rules are governed by health regulations issued by
the Ministry of Health and approved by the Government. The law sets out the compulsory adjustment
of regulations to the EU requirements.
The National Public Health Supervision Service (NPHSS) is the competent authority to supervise
public health, including health certification. The service is subordinated to the Ministry of Health.
Before being placed on the market, products are subject to approval by NPHSS. The list of products
subject to health authorisation is approved through health regulations. Businesses carrying out
operations with impact on public health are subject to health approval.
Products and services are subject to the following forms of health authorisation:
a) Notification: procedure to inform the authority responsible for supervision of public health on
the marketing of a new product or service and on its features relevant to the public health;
b) Health approval: concerning the following operations, document projects, products and
services:
b.1) allocation of land for construction / reconstruction;
b.2) construction / reconstruction projects;
b.3) final approval of constructed / reconstructed buildings;
b.4) standards for products and services;
b.5) production technologies.
c) State registration: compulsory with the products and services potentially hazardous to human
health and life - chemical, radioactive, biological, new food products, medicines,
microbiological diagnostic systems, diagnostics, nutrient media, chemical reagents, etc.;
d) Health certification: is an assessment procedure of the batch of products conformity with the
applicable health regulations. The health certification implies laboratory investigations of the
batch of goods.
The sanitary authorisation of products and services shall be based on the applications submitted by
natural or legal persons concerned, also based on medical expertise of the documents, products,
services and/or operations.
The health authorisation implies a paid health expertise as per the list and tariffs for public health
services approved by the Government. Health opinions, registration certificates, health certificates and
health authorisations are issued free of charge.
The trading of products and services subject to health authorisation under the applicable laws, but yet
unauthorized, is prohibited.
Procedure for obtaining health certificates
Around 34% respondents had to obtain health certificates. Their share declined continuously over the
past five years. On average, companies carry out this procedure 1,3 times per year. The health
Page 45
45 Sanitary certification
Cost of Doing Business 2015
Competitiveness Enhancement Project (CEP II) AOCDER Promo-Terra
certificate is obtained in 9 days and costs around $60. To prepare the necessary documents and
submitting them to the competent organs managers spent on average 5,7 hours.
Table29. Average costs incurred by interviewed companies to obtain a health certificate
Period of survey
Indicators
Have made payments, % Amount, $
2012 2013 2014 2015 2012 2013 2014 2015
Official payments 99 99 92 88 82 60 89 47
Payments to lawyers and
intermediaries
5 4 4 13 24 19 44 34
Transport expenses 41 42 47 48 12 11 22 19
“Voluntary contributions” 6 12 11 13 17 17 35 17
Unofficial payments 27 21 11 17 22 20 35 16
Total costs, $ - - - - 94 71 102 60
Perception of procedure for obtaining a health authorisation
Both Chart18 and the above indicators suggest a slight improvement over the last year in the process
of obtaining health certificates.
Chart18. Changes in the process of obtaining health certificates
As shown in Chart 19, only 9% respondents encountered difficulties in obtaining sanitary certificates.
Their share has decreased compared to previous years.
Table30. Problems encountered in obtaining health authorisations
Problems Share
Complicated regulatory procedures 2.0
Long time to complete procedure 2.1
High cost to obtain health authorisations 2.4
Exaggerated unofficial payments 1.7
10% 76% 15%
0% 20% 40% 60% 80% 100%
Worse Same Better
Page 46
46 Sanitary certification
Cost of Doing Business 2015
Competitiveness Enhancement Project (CEP II) AOCDER Promo-Terra
Chart19. Problems encountered in obtaining health authorisations
Summary of analysis
Both the amount of time and costs to obtain health certificates range without showing a trend (see
Chart 20).
Table31. Evolution of procedures for obtaining a health authorisation
Indicators Period of survey
2009 2010 2011 2012 2013 2014 2015
Time for obtaining a health authorisation, days 13 10 8 8 6 10 9
Cost of obtaining a health authorisation, $ 104 97 67 94 71 102 60
Chart20. Evolution of procedures for obtaining a health authorisation
-3%
-7%
-6%
-6%
-3%
-7%
-3%
-3%
20%
34%
39%
33%
60%
26%
30%
38%
-20% 0% 20% 40% 60% 80% 100%
Unofficial payments
Cost of procedure
Duration of procedure
Difficult procedures
Major problem Critical Insignificant Not difficult
0
2
4
6
8
10
12
14
16
0
20
40
60
80
100
120
2008 2009 2010 2011 2012 2013 2014 2015
day
s
USD
Cost
Time
Page 47
47 Inspections
Cost of Doing Business 2015
Competitiveness Enhancement Project (CEP II) AOCDER Promo-Terra
10. Inspections
Regulatory framework
On 1 April 2003 the Government adopted the Decision no. 395 on Regulation of inspections, which
states that controlling authorities shall organize the supervision and inspection of companies as
follows:
Up to one inspection over two calendar years to verify the results of economic and financial
operations;
Up to one inspection during a calendar year to verify the compliance of goods manufacturers
with the norms, technical, technological, hygienic, health, work organization conditions and
other measures.
Number and duration of inspections
The average number of visits to a company decreased from 6,5 to 3,8. The figures do not include
checks by road police on vehicles. The cumulative duration of inspectors' visits to the company
increased from 4,5 days to 7,6 days. The average number and time length of inspections, by control
bodies, are shown in Table below.
Table32. Number and average time of controls
Period of survey
Control bodies
Share of inspected
companies, %
Frequency Number of days per
visit
2013 2014 2015 2013 2014 2015 2013 2014 2015
Tax Inspectorate 54 58 51 1,4 1,9 1,4 2.8 1,5 0,5
Fire department (emergency situations) 42 56 35 1,2 1,4 1,2 0,4 0,3 0,2
Sanitary Epidemiological Service 18 48 22 1,6 1,9 1,3 0,4 0,4 0,2
Police 22 41 19 1,5 3,9 1,5 0,3 0,3 0,2
Traffic police 20 10 18 3,8 6,1 5,0 0,1 0,4 0,1
Price monitoring bodies 8 5 11 1,5 1,1 1,1 1,1 0,8 0,3
Standard monitoring bodies 10 18 13 1,3 1,3 1,1 1,3 0,5 0,2
Environmental Control Bodies 13 22 16 1,2 1,4 1,3 0,4 0,3 0,2
Licensing bodies 9 12 11 1,1 1,2 1,3 0,9 0,3 0,1
National Anticorruption Center 11 8 8 1,1 1,8 1,1 2,3 2,3 0,2
Other ministries and departments 19 10 12 1,2 1,5 1,3 1,3 2,6 0,1
Local authorities 24 20 17 1,3 2,7 1,2 0,4 0,5 0,1
Work inspection 48 40 32 1,2 1,4 1,3 1,7 0,6 0,4
38% of respondents who own a means of transport have claimed that the Road Police have stopped
their vehicle without any legal reason, in order to verify the legality of documents or cargo. Compared
to three years ago, its share almost halved.
Page 48
48 Inspections
Cost of Doing Business 2015
Competitiveness Enhancement Project (CEP II) AOCDER Promo-Terra
Expenses incurred after the inspections
Most often, bribes are paid to the employees of the Tax Inspectorate, Labor inspection, local
authorities and police.
Table33. Share of companies that made payments following inspections over the last year
Fines, % Unofficial payments, %
Share per
total
Share from
inspected
companies
Share per
total
Share from
inspected
companies
Tax Inspectorate 18 44 7 14
Fire department (emergency situations) 6 14 4 8
Sanitary Epidemiological Service 6 20 2 7
Police 5 14 5 16
Traffic police 9 34 3 9
Price monitoring bodies 1 4 1 2
Standard monitoring bodies 2 8 1 4
Environmental control bodies 3 10 1 2
Licensing bodies 2 5 1 4
National Anticorruption Center 2 7 2 6
Other ministries and departments 4 13 3 11
Local authorities 4 14 4 13
Work inspection 6 15 4 11
Most often businesses are fined by the Tax Inspectorate.
Perception of number of inspections and difficulties
Companies' perception on how the number of inspections has evolved confirms the above data on their
decline in 2015. About 30% respondents revealed that the number of inspections has decreased
compared to the previous year.
Chart21. Evolution of the number of inspections
About 38% respondents believe that the law is applied selectively, depending on the attitude of public
figures. Only 19% respondents believe that companies are treated equally before the law.
Table 34. Objectivity of public employees
15% 55% 30%
0% 20% 40% 60% 80% 100%
More Same Fewer
Page 49
49 Inspections
Cost of Doing Business 2015
Competitiveness Enhancement Project (CEP II) AOCDER Promo-Terra
Yes Partly No Do not
know
All companies are treated equally before the law 19% 32% 28% 21%
The law is applied selectively 38% 23% 14% 25%
According to respondents, in most cases, the visits were "planned and legally justified". The number of
respondents claiming that inspections have been carried out with the intention of taking bribes or
“voluntary” contributions has increased.
Table35. Purposes of the inspection visits
Purpose 2010 2011 2012 2013 2014 2015
Inspections have been justified, previously planned 3,4 3,4 3,4 3,0 2,1 2,7
Investigation of violations 2,2 2,0 2,2 2,2 1,4 2,0
Receiving bribes and "voluntary contributions" 2,0 1,9 2,3 2,1 1,4 2,2
Attempts to put pressure on management to take economic
decisions
1,4 1,5 1,5 1,6 1,2 1,7
Abuse of power for unfair competition 1,3 1,7 1,6 1,5 1,2 1,9
Political reasons 1,5 1,4 1,3 1,4 1,1 1,8
Other subjective reasons 1,6 1,5 1,7 1,7 1,1 1,8
Most companies consider that control procedures have not changed over the last year (see Chart22).
Chart22. Evolution of procedures related to inspections
Summary of analysis
Over the year past, the average number of inspections in a company has declined from 6,5 to 3,8 visits.
The time spent by inspectors per company has increased significantly from 4,5 to 7,6 days per year.
Table36. Evolution of the share of inspected companies
13% 74% 14%
0% 20% 40% 60% 80% 100%
Worse Same Fewer
Page 50
50 Inspections
Cost of Doing Business 2015
Competitiveness Enhancement Project (CEP II) AOCDER Promo-Terra
Period of survey
Control bodies
2010 2011 2012 2013 2014 2015
Tax Inspectorate 81 67 74 54 58 51
Fire department (emergency situations) 58 54 53 42 56 35
Sanitary and epidemiologic service 33 23 31 18 48 22
Police 27 23 31 22 41 19
Traffic police 28 20 23 20 10 18
Price monitoring bodies 17 7 11 8 5 11
Standard monitoring bodies 27 9 16 10 18 13
Environment monitoring bodies 16 6 17 13 22 16
Licensing bodies 38 27 15 9 12 11
National Anticorruption Center 31 14 22 11 8 8
Other ministries and departments 24 13 13 19 10 12
Local authorities 19 14 27 24 20 17
Work inspection 53 35 54 48 40 32
As shown in the table above, in recent years, the share of companies inspected by the Tax Inspectorate,
emergency situations Service and licensing bodies have decreased.
Table37. Evolution of the frequency of inspections (calculated only for companies inspected by respective authority)
Period of survey
Control bodies
2010 2011 2012 2013 2014 2015
Tax inspectorate 1,9 1,5 1,7 1,4 1,9 1,4
Fire department (emergency situations) 1,4 1,2 1,3 1,2 1,4 1,2
Sanitary epidemiologic services 2,1 1,5 1,6 1,6 1,9 1,3
Police 1,9 1,9 1,7 1,5 3,9 1,5
Traffic police 7,7 3,0 2,8 3,8 6,1 5,0
Price monitoring bodies 1,8 1,8 1,2 1,5 1,1 1,1
Standard monitoring bodies 2,1 1,5 1,1 1,3 1,3 1,1
Environment monitoring bodies 1,6 1,3 1,2 1,2 1,4 1,3
Licensing bodies 1,7 1,3 1,1 1,1 1,2 1,3
National Anticorruption Center 2,1 1,3 1,3 1,1 1,8 1,1
Other ministries and departments 2,6 1,5 1,4 1,2 1,5 1,3
Local authorities 1,9 1,7 1,5 1,3 2,7 1,2
Work inspection 1,8 1,4 1,4 1,2 1,4 1,3
Most often, businesses are inspected by the State Tax Inspectorate, fire department (emergency
situations department) and labor inspection.
Table38. Evolution of inspection frequency (calculated for all companies included in the sample)
Page 51
51 Inspections
Cost of Doing Business 2015
Competitiveness Enhancement Project (CEP II) AOCDER Promo-Terra
Period of survey
Control bodies
2010 2011 2012 2013 2014 2015
Tax inspectorate 1,5 1,0 1.3 0.8 1,1 0,7
Fire department (emergency situations) 0,8 0,6 0.7 0.5 0,8 0,4
Sanitary epidemiologic services 0,7 0,3 0.5 0.3 0,9 0,3
Police 0,5 0,4 0.5 0.3 1,6 0,3
Traffic police 2,2 0,6 0.6 0.8 0,6 0,9
Price monitoring bodies 0,3 0,1 0.1 0.1 0,1 0,1
Standard monitoring bodies 0,6 0,1 0.2 0.1 0,2 0,1
Environment monitoring bodies 0,3 0,1 0.2 0.2 0,3 0,2
Licensing bodies 0,6 0,4 0.2 0.1 0,1 0,1
National Anticorruption Center 0,7 0,2 0.3 0.1 0,1 0,1
Other ministries and departments 0,6 0,2 0.2 0.2 0,2 0,2
Local authorities 0,4 0,2 0.4 0.3 0,5 0,2
Work inspection 1,0 0,5 0.8 0.6 0,6 0,4
Table39. Evolution of inspections
Period of survey
Indicators
2007 2008 2009 2010 2011 2012 2013 2014 2015
Average number of inspections per
company 8,7 9,0 8,2 7,9 4,2 5,2 3,6 6,5 3,8
Number of days per year per company 16 19 10 15 6,5 6,3 4,7 4,5 7,6
Page 52
52 Taxes
Cost of Doing Business 2015
Competitiveness Enhancement Project (CEP II) AOCDER Promo-Terra
11. Taxes
Regulatory framework
The tax system in Moldova is regulated by several laws and regulations. The key document is,
however, the Tax Code approved on 24.04.1997 and amended thereafter. Currently it comprises nine
titles:
1. General provisions
2. Income tax
3. Value added tax
4. Excises
5. Fiscal administration
6. Real estate tax
7. Local taxes
8. Taxes on natural resources
9. Road taxes
Administration of taxes
In accordance with the opinion of the respondents, an average of 6 types of taxes is paid in the
Republic of Moldova. The number of taxes did not change compared to last year.
Nearly 64 percent of businesses surveyed employ full-time accountants to calculate and pay all taxes
in due time (see Table 40). The share of those keeping their accounts by themselves practically did not
change in recent years. About 5% of those which have full-time accountants also hire part-time
accountants.
Table 40. Number of accountants required to ensure timely and accurate payment of taxes
Period of survey
Resources
2008 2009 2010 2011 2012 2013 2014 2015
Hire accountants, full time 81% 75% 78% 74% 67% 64% 73% 64%
Average number of full-time
accountants
1.5 1.3 1.2 1.2 1.2 1.2 1.3 1.2
Part time accountants 12% 23% 28% 26% 35% 37% 19% 32%
Keep tax records on their own 7% 2% 2% 9% 5% 8% 8% 9%
Almost 80% of respondents said that they pay all taxes. Those who do not pay taxes entirely mention
that they pay on average 77% of taxes.
About 39% of the profit obtained in 2014by the enterprises surveyed was reinvested.
Based on all the reports submitted, like in the previous year, it takes longest to submit the report on
corporate income tax: about 3.3hours.
Page 53
53 Taxes
Cost of Doing Business 2015
Competitiveness Enhancement Project (CEP II) AOCDER Promo-Terra
Table 41. Time spent to submit a report, hours
Tax type hours
Value added tax 2.8
Personal Income Tax 2.4
Corporate Income Tax 3.3
Contributions to the National Social Insurance Fund 2.2
Landscaping 1.6
Payments for mandatory healthcare insurance 1.8
Major problems in paying taxes
The procedure applied for calculating, reporting and paying income tax by legal entities (corporate
income tax) gives rise to most problems (see Table 42). About 22% face difficulty in paying this tax.
Table 42. Taxes generating more problems
Problems 2009 2010 2011 2012 2013 2014 2015
Value added tax 2.84 2.87 2.7 2.5 2.7 1.7 2.4
Personal income tax 2.59 2.59 2.5 2.5 2.6 1.6 2.4
Corporate income tax 2.59 2.59 2.5 2.9 3.0 1.8 2.7
Contributions to the National Social Insurance Fund 2.81 2.35 2.2 2.5 2.5 1.7 2.5
Landscaping 1.70 1.95 1.8 1.9 1.9 1.4 1.8
Payments for mandatory healthcare insurance - 2.26 2.1 2.3 2.2 1.6 2.1
Figure 23. Taxes generating more problems
-6%
-3%
-11%
-9%
-9%
-5%
-4%
-10%
-11%
-7%
-6%
29%
29%
28%
31%
35%
37%
41%
50%
28%
17%
25%
23%
-40% -20% 0% 20% 40% 60% 80% 100%
Contributions to NHIH
Landscaping
Contributions to NSIH
Income (legal persons)
income (natural persons)
VAT
Major problem Critical Insignificant Not difficut
Page 54
54 Taxes
Cost of Doing Business 2015
Competitiveness Enhancement Project (CEP II) AOCDER Promo-Terra
As shown in Figure 24, three quarters of all respondents did not mention any improvements or
deteriorations in the taxation system. About 13% of respondents mentioned improvements and an
equal number of respondents believe that it became more difficult.
Figure 24. Evolution of taxation system
Respondents who participated in the survey were asked to assess the problems related to taxation
procedures by giving a score from 1 to 5 (see Table 43). Excessive sanctioning in case of errors has
become the most important issue faced by the businesses. Like in the previous years, businesses are
unsatisfied with the instability in the field of taxation and high level of taxes.
Table 43. Problems faced in the taxation system
Period of survey
Problems
2010 2011 2012 2013 2014 2015
Impossibility to project the future number of taxes 2.88 2.7 3.0 3.3 2.2 2.4
Overall the taxation and accounting procedures are
complicated and unclear
3.29 2.8 3.1 3.5 2.4 2.8
High sanctions for errors 3.23 3.0 3.5 3.8 2.8 2.9
Lack of stable rules 2.78 2.3 2.8 3.1 2.2 2.4
Total dependence on tax inspectors, lack of respect 2.36 2.5 2.8 3.0 2.0 2.2
High rate of taxes 3.14 3.2 3.7 3.6 3.3 2.9
Exaggerated unofficial payments 1.72 1.7 2.1 2.3 1.3 1.9
Summary of the analysis
During recent years, VAT calculation and reporting generates fewer problems for businesses. The
procedure for calculating the Income tax by legal entities has become the most complicated procedure
compared to filing other taxes.
Table 44. Comparison of the tax administration system
Indicators Period of survey
2009 2010 2011 2012 2013 2014 2015
Average number of taxes 6.7 6.1 6.1 7.1 7.0 7.5 5.9
Number of full-time accountants 1.3 1.2 1.2 1.2 1.2 1.3 1.2
12% 75% 13%
0% 20% 40% 60% 80% 100%
More difficult Same Easier
Page 55
55 Price Regulation
Cost of Doing Business 2015
Competitiveness Enhancement Project (CEP II) AOCDER Promo-Terra
12. Price Regulation
Regulatory framework
The main document regulating prices is Government Decision no. 547 of 4 August 1995 "On
State coordination and regulation of prices and tariffs ".
In most situations, the products can be sold at market prices. The government keeps the right to
regulate the prices for socially important domestic and imported goods that are sold at a mark-up not
exceeding 20%. Exceptions were set for bread and bakery products for which the mark-up shall not
exceed 10% and for construction materials with 30% added to the delivery price). Operating expenses,
including transportation costs of construction materials and other expenses related to the purchase and
sale of goods is covered from the mark-up.
Price regulation status today
Only 12% of managers stated that the State intervenes in the formation of prices for their companies’
products. The majority of respondents were conducting sales both at regulated prices, as well as at free
prices. Only 0.6% of the businesses surveyed said that all sales are made at regulated prices.
On average, 3.8% of total sales of the businesses were made at prices regulated by the state.
Perception of price regulation
Limiting the mark-up is a method by which the state usually intervenes in the formation of prices of
enterprises (see Table 45).
Table 45. Methods of state intervention in price formation
Methods 2008 2009 2010 2011 2012 2013 2015
By limiting profitability 15% 20% 21% 11% 19% 20% 19%
By limiting prices 48% 34% 19% 21% 24% 23% 34%
By limiting the mark-up 37% 46% 61% 68% 57% 57% 47%
Summary of the analysis
Over the last two years, a considerable decrease in the share of enterprises subjected to price regulation
was registered. As a result, the share of products which prices are subjected to price regulation by the
state also decreased from 10 to 4%.
Usually, price regulation is conducted by limiting the mark-up.
Page 56
56 Price Regulation
Cost of Doing Business 2015
Competitiveness Enhancement Project (CEP II) AOCDER Promo-Terra
Table 46. Price regulation in the Republic of Moldova
2008 2009 2010 2011 2012 2013 2014 2015
Share of companies subjected
to price regulation
36% 39% 31% 26% 24% 24% 17% 12%
Share of prices subjected to
state regulation
21% 26% 18% 10% 8% 10% 10% 4%
Page 57
57 Regulation of labor relations
Cost of Doing Business 2015
Competitiveness Enhancement Project (CEP II) AOCDER Promo-Terra
13. Regulation of labor relations
Regulatory framework
The main legislative acts governing the labor relations are:
Labor Code of the Republic of Moldova (Law no. 154-XV of 28 March 2003);
Law no. 847-XV of 14 February 2002 on Remuneration;
Government Decision no. 743 of 11 June 2002 "On salaries of employees of financially
autonomous units";
Government Decision no. 152 of 19 February 2004 "On the compensation quantum bonus for
work in adverse conditions";
Government Decision no. 165 of 9 March 2010 "On the minimum guaranteed salary quantum
in the real sector".
In accordance with the amendments to the Labor Code introduced by Law 254 of 09.12.11 amending
and supplementing certain acts, the employer shall provide employees with a nominal permit for
access to work. In his turn, the employee is required to carry at all times the nominal permit for access
to work provided by the employer. The employer (except central and local public authorities) must
approve the staff structure within the first month of operation, and further - in the first month of every
calendar year. Within 2 months from the date of their approval, the employer submits (in writing or
electronically) a copy to the territorial labor inspectorate under whose jurisdiction the business is
located.
Availability of labor force
Almost 69% of the total number of respondents claimed that the number of employees corresponded to
the needs of the enterprise at the time of interview. As a result of this year crisis, the share of
respondents that have declared they employed more than they needed grew from 3 to 8%.
Table 47. Evaluation of labor force availability
Respondents in the survey were asked to assess the issues arising from labor relations regulation by
scoring from 1 to5. No particular problem in the regulation of labor relations was highlighted.
Period of survey
2009 2010 2011 2012 2013 2014 2015
More than I need 6% 0,5% 3% 2% 5% 3% 8%
As much as I need 85% 83% 76% 71% 60% 77% 69%
Less than I need 8% 16% 20% 26% 32% 18% 20%
I don’t know 1% 0,2% 1% 1% 4% 2% 3%
Page 58
58 Regulation of labor relations
Cost of Doing Business 2015
Competitiveness Enhancement Project (CEP II) AOCDER Promo-Terra
Table 48. Assessment of main issues related to labor force regulation
Problems 2010 2011 2012 2013 2015
Receiving permission from the Labor Inspection to initiate
company’ activity
1.9 2.0 2.2 2.3 2.0
Need to employ only based on an individual labor contract 1.9 2.2 2.2 2.4 2.1
Obligation to pay the minimum salary 2.1 2.5 2.3 2.4 2.2
Frequent checks by the labor inspection 1.9 1.7 2.0 2.0 1.8
Complicated procedure of staff dismissal 1.9 1.9 2.2 2.3 1.9
Complicated procedures for staff record-keeping 1.9 2.0 2.4 2.4 1.9
Obtaining and restitution of healthcare insurance policies
within the established timeframe
2.1 2.0 2.5 2.1 1.8
Summary of the analysis
The main problems represent the "need to pay the minimum salary" and the "need to employ only
under an individual contract of employment". It should be noted that both problems have little to do
with protecting the interests of employees and are rather methods to reduce official employment and to
pay salaries using illegal methods. However, it is useful to note that only about 13% mentioned the
"need to pay the minimum salary" and only 11% - "the obligation to only employ under a contract".
Page 59
59 Execution of contracts
Cost of Doing Business 2015
Competitiveness Enhancement Project (CEP II) AOCDER Promo-Terra
14. Execution of contracts
Nearly 5% of respondents said that the state intervened in the conclusion and execution of contracts.
With small fluctuations, the average was at the same level during 2005-2015.
This area of regulation has a low impact on business activity(see Table 49).
Table 49. Monitoring execution of contracts in the Republic of Moldova
2007 2008 2009 2010 2011 2012 2013 2014 2015
Share of enterprises whose
contracts were monitored 5% 7% 10% 4% 3% 6% 6% 4% 5%
Page 60
60 Promotion of personal interests of public employees
Cost of Doing Business 2015
Competitiveness Enhancement Project (CEP II) AOCDER Promo-Terra
15. Promotion of personal interests of public employees
One of the questions of the survey aimed at involving public employees in the business activity to
promote their personal interests. In almost 8% of cases, the managers said that public employees
interfered in the activity of the enterprise.
In 72% of cases, the public employees were the initiators of the inference. In 13% of the cases where
involvement was ascertained, the public employees held a share in the company’s capital.
About 27% of the enterprises in which have inferred civil servants, mentioned that the involvement
level increased over the previous year. Over 12% of them mentioned a decrease in involvement.
Page 61
61 Evaluation of the Judiciary System
Cost of Doing Business 2015
Competitiveness Enhancement Project (CEP II) AOCDER Promo-Terra
16. Evaluation of the Judiciary System
Regulatory framework
The settlement of disputes between companies in the Republic of Moldova is carried out through
courts, according to Law no. 225-XV of 30 may 2003 on the Code of Civil Procedure or arbitration
courts, according to Law no. 23 of 22 February 2008 on Arbitration.
Disputes with government authorities are regulated by "Law on Administrative Contentious" (no. 793-
XIV of 10 February 2000), republished on 3 October 2006).
Methods used to settle disputes
In the last two years, almost 21% of participants to the survey had to settle disputes with state
authorities and partners. After the continuous increase during 2007-2013, their share decreased
substantially in 2014, with a slight increase in 2015.
Figure 25. Companies that had to settle disputes
In75% of cases, companies had conflicts with other business entities, in 25% of cases -with state
authorities.
Almost half of respondents used courts for dispute settlement.In25% of cases, companies appealed to
the state authorities and, in34% of cases -unofficial methods. In14% of the cases, the respondents
resorted to illegal methods to solve problems.
Table 50. Methods to solve problems
2009 2010 2011 2012 2013 2014 2015
Addressed the state authorities 46 26 31 35 48 14 25
Addressed the court 74 62 52 61 49 69 46
Illegal methods 14
Different unofficial methods, but legal 34
16.2
21.2 19.9
23.4
31.7 31.5
35.8
1821
0
5
10
15
20
25
30
35
40
2007 2008 2009 2010 2011 2012 2013 2014 2015
%
Year of Survey
Page 62
62 Evaluation of the Judiciary System
Cost of Doing Business 2015
Competitiveness Enhancement Project (CEP II) AOCDER Promo-Terra
This year, the lowest rate of using courts was recorded.
Assessing the efficiency of using courts
The main reasons why businesses do not address the courts is the long waiting period for the decision
making and corrupt judiciary system. Table51 shows the results of assessing the reasons by scoring
from 1 to5, where 1-the least important reason and 5- the most important reason.
Table 51. Reasons for not addressing the courts
Reasons 2013 2014 2015
Long waiting period 4.0 3.1 2.7
Decision will be incorrect due to the fact that courts are corrupt 2.7 2.9 2.4
Decision will be incorrect due to the fact that the court is
incompetent
2.6 2.3 1.8
High costs for court services 3.2 2.7 1.8
High costs for legal services 3.5 2.7 2.0
Less important problems 3.5 3.5 2.7
Other methods are more efficient 3.2 3.5 2.2
Court decision is not enforced 2.3 2.4 1.8
About 31% of companies that addressed the courts were satisfied, other38%-not satisfied. On average,
the respondents rated their satisfaction level at 2.83 points based on a scale from 1 to5 points possible,
similar to the previous year.
Summary of the analysis
During the last two years, about 21% of the interviewed companies had to settle disputes (with
partners, clients or state authorities). In less than half of the cases they filed a lawsuit.
Table 52. Efficiency of addressing the courts
2013 2014 2015
Respondents who had to settle disputes,% 36 18 21
Respondents satisfied in case of addressing the courts,% 49 33 31
Addressed the courts, level of satisfaction 3,25 2,90 2,83
Addressed the courts, level of satisfaction, % 56 48 46
The level of satisfaction of respondents who required legal assistance to settle disputes is steadily
decreasing, reaching 2.83pointson a scale from1 to 5pointsor46%.
Page 63
63 Phytosanitary certification
Cost of Doing Business 2015
Competitiveness Enhancement Project (CEP II) AOCDER Promo-Terra
17. Phytosanitary certification
Regulatory framework
The phytosanitary regulation is regulated by Law no.228 of 23 September 2010 “on plant protection
and phytosanitary quarantine”.
If the importing countries impose such a requirement, the phytosanitary control body shall issue
phytosanitary certificates. The phytosanitary certificate shall be issued to the exporter by the
subdivision of the phytosanitary control body under which jurisdiction the goods subject to quarantine
are produced. In case of goods subject to obtaining the phytosanitary certificate, the exporter, shall
submit at least 24 hours prior to shipment, a number of documents:
a) application requesting a phytosanitary certificate;
b) certificate on the use of phytosanitary products, at the request of the importing country;
c) phytosanitary certificate of the country of origin;
d) quarantine expertise certificate for the plant and vegetable products subject to phytosanitary
quarantine to be exported, issued by a legal entity authorized by the central administrative
authority in the field of agriculture;
e) copy of the sale and purchase contract or another civil legal act based on which the export or
re-export of the plants, plant products and related goods subject to phytosanitary quarantine is
done;
f) copy of the tax bill or invoice for shipping of cargo;
g) act on phytosanitary inspection of cargo units and other related goods subject to phytosanitary
quarantine.
The validity of phytosanitary certificate is 14 days from the date of issuance. If, the inspection
establishes that phytosanitary requirements have been observed, instead of phytosanitary certificate
a plant passport to ensure free movement of plants and plant products imported shall be issued.
The phytosanitary control body issues the plant import (transit) phytosanitary permit. In order to
obtain a plant import (transit) phytosanitary permit, the cargo owner shall, at least 10 days before
import (transit) submit the following to the phytosanitary control body:
a) application requesting the plant import (transit) phytosanitary permit;
b) copy of the sale and purchase contract or another civil legal act based on which the importation
and / or transit of plants, plant products and related goods subject to phytosanitary quarantine is
done;
c) act of phytosanitary control of the room where the imported cargo is to be stored.
The time required for issuing a phytosanitary import (transit) permit is of 5 days from the date of
application submission.
The payment for issuance of phytosanitary import (transit) permit is directly proportional to the lot
size.
Procedure for obtaining phytosanitary permits (certificates and permits)
About 7% of respondents had to obtain phytosanitary permits. On average, the companies shall
undergo the respective procedure 31 times per year.
Page 64
64 Phytosanitary certification
Cost of Doing Business 2015
Competitiveness Enhancement Project (CEP II) AOCDER Promo-Terra
The time for obtaining the phytosanitary permit is of 2 days1. In order to prepare the requested
documents and to submit them to the competent bodies, the managers spent on average 3.51 hours.
The costs for obtaining the phytosanitary permit constitute about USD 35.
Table 53. Average costs incurred by the businesses interviewed in order to obtain a phytosanitary permit
Made
payments, %
Amount,
USD
Official payments 90 24
Payments to lawyers and
intermediaries
20 -
Transportation costs 54 16
“Voluntary contributions” 27 9
Unofficial payments 10 24
Total costs, USD - 35
Perception of the sanitary permit obtaining procedure
According to the respondents’ opinion, during the last year, there were no enhancements in the process
of obtaining the sanitary permits.
Figure 26. Changes in the process of obtaining a sanitary permit
According to the data presented in Figure 27, only 11% of respondents faced difficulties in the process
of obtaining a phytosanitary permit. In general, this area does not generate any important problems for
the business community. The most important impediments are the cost of obtaining permits, both
official and unofficial.
Table 54. Problems faced during the process of obtaining phytosanitary permits
Problems Share
Complicated Regulatory Procedures 2.0
Long-lasting procedure 2.1
High cost of obtaining sanitary permits 2.3
Exaggerated unofficial payments 2.1
1 Due to the large dispersion of data, the central trend was calculated based on the median.
17% 88% 12%
0% 20% 40% 60% 80% 100%
Worse Same Better
Page 65
65 Phytosanitary certification
Cost of Doing Business 2015
Competitiveness Enhancement Project (CEP II) AOCDER Promo-Terra
Figure 27. Problems faced in the process of obtaining phytosanitary permits
Summary of the analysis
Both the duration and costs of obtaining a phytosanitary permit are usually lower than in the case of
other regulatory areas.
-8%
-7%
-3%
-10%
-10%
-8%
-8%
20%
15%
20%
33%
50%
42%
43%
43%
-40% -20% 0% 20% 40% 60% 80%
Unofficial payments
Cost of procedures
Duration of procedures
Difficult procedures
Major problem Critical Insignificant Not difficult
Page 66
66 Conclusions
Cost of Doing Business 2015
Competitiveness Enhancement Project (CEP II) AOCDER Promo-Terra
Conclusions
The general time indicator practically remained unchanged during 2009-2015. Small fluctuations were
due to natural dispersion rather than any improvement or deterioration in perception.
Registration procedure
Compared with two years ago, the registration procedures lasted longer. The cost of the proceedings
expressed in USD, decreased by 15-30%. The time period increased rather due to time lost for
registration in other state bodies than the State Registration Chamber. Paradoxically, however, the
recent efforts in simplifying the registration procedures had to have the opposite effect.
Very few respondents mentioned any problems that would be faced in the process of company
registration.
Regulation in Constructions
The number of those who have moved to new premises continuously decreased. In particular, the
number of companies that build their premises by themselves substantially decreased. Even those who
decided to do so, hoping to save some financial resources, have asked for the help of a design or other
intermediaries to comply with state requirements in construction.
In this way, only 0.5% of respondents had to obtain construction permits by their own.
The number of those who changed the premises purpose is greater. The duration of obtaining a proper
authorization has not changed compared to the previous year.
Licensing
Almost half of the respondents had to have a license, even though their share has decreased steadily
throughout 2009-2015. During 2013-2015, the duration of obtaining licenses reduced from 18 to 11
days. Similarly, the costs were reduced by about 40% compared to 2013, but this may be due to the
currency depreciation rather than actual reduction in expenditures.
Lately, fewer respondents perceive licensing procedures as complicated. In 2015, their share fell to
14%.
Getting authorizations/permits
Important changes in the process of obtaining permits have not been identified. The duration remained
practically at the level of 2011. The costs have increased compared to 2014, but are lower compared to
previous years. The reduction in the share of those that need to have permits in order to operate is
welcome. If in 2011, almost 80% needed a permit, their share fell to 49% in 2015.
Regulation on equipment
Obtaining permits for commissioning procured equipment is an area with little impact on business
development. The share of enterprises, which have certified equipment is small - 2% of all enterprises
surveyed. The time for obtaining the certificates remained at the level of 2012.
Regulation of imports
Duration of import procedures maintained a downward trend since 2012. The costs are practically at
the last six years level. Almost 20% of respondents have noticed improvements in the area.
Page 67
67 Conclusions
Cost of Doing Business 2015
Competitiveness Enhancement Project (CEP II) AOCDER Promo-Terra
Regulation of exports
The time needed for customs procedures for export remained at the past two years level, a bit over the
level registered during 2009-2012. The costs have decreased, but these, as in case of imports, are
proportionate to the value of goods. Almost a third of respondents believe that the procedures have
worsened in the past year.
Conformity certification of goods and services
The time needed for the certification procedures changed substantially in the last year. The time for
certification of individual batches of goods decreased, but it grew for certification of product lines. The
costs decreased in both cases. Similarly, the share of those who have problems because of too high
requirements towards certified products decreased from 39 to 16% in the last two years.
Sanitary certification
The share of those who need sanitary certificates has decreased in the past five years, reaching 34% in
2015. Both the duration and costs had oscillations in recent years. However, no increase or decrease
trend can be established. Very few (9%) mentioned that they faced difficulties in obtaining sanitary
certificates.
Inspections
The frequency of inspections has decreased, but the positive effect was canceled by the increase in
time spent by inspectors at a company. About 30% of respondents stated that the number of
inspections has decreased. The vast majority (74%) stated that the inspection procedures are as
difficult as in previous years.
Taxation system
Over the last year, the conditions on the procedures of registration and taxation have not changed. The
main indicators remained at the level of last year, as confirmed by the neutral perception of 75% of
respondents versus those proceedings.
Price regulation
For the second consecutive year, the share of those who said that the company’s products or services
are subject to price regulation decreased. Compared to 2009, the share dropped more than three times,
from 39 to12%.
Regulation of labor relations
Regulation of labor relations is not an obstacle in the business operation. As a result of the economic
crisis, the number of companies facing over staffing has increased.
Execution of contracts
State involvement in the conclusion and execution of contracts is a rare practice. The share of
companies whose contracts were checked by representatives of the state remained at last year level
without showing a clear trend of change over the years 2005-2015.
Page 68
68 Conclusions
Cost of Doing Business 2015
Competitiveness Enhancement Project (CEP II) AOCDER Promo-Terra
Judicial system
Only 46% of those who had to settle disputes addressed in court. The indicator is at its lowest level in
the recent seven years. This can be explained by the low satisfaction of those addressing the court: 2.8
out of 5.
About14% had to resort to illegal methods to solve their problems.
Phytosanitary certification
A small number of respondents - 7% of the total - had to obtain phytosanitary certificates. Both the
duration and cost of obtaining phytosanitary certificates are lower than for other types of certificates.
Page 69
69 Conclusions
Cost of Doing Business 2015
Competitiveness Enhancement Project (CEP II) AOCDER Promo-Terra
Table 55. Comparison of main indicators
Indicators Period of survey
2009 2010 2011 2012 2013 2014 2015
General time indicators, % 11 10 10 10 11 11 10
Registration (including changes in the registration
paperwork)
Time to complete registration, days 19 14 15 13 9 10 12
Registration costs, USD 117 159 136 108 112 71 99
Time to modify the documents, days 8 11 9 6 6 8 7
Costs to modify the documents, USD 68 133 108 90 88 141 66
Constructions
Constructions, days 88 - 70 51 54 57 -
Renovation and reconstruction, days 35 30 26 38 39 30 31
Licensing
Average number per company 1,3 1,3 1,3 1,3 1,4 1,4 1.4
Time spent to obtain a license, days 20 22 18 16 18 14 11
Average costs, USD 193 270 240 266 294 402 163
Share of unofficial payments, % 15 14 7 9 8 1 8
Authorizations/permits
Time spent to obtain an authorization/permit, days 16 17 13 13 15 13 12
Average costs, USD 210 283 198 224 215 77 90
Share of unofficial payments, % 20 8 10 13 12 7 13
Amount of unofficial payments, USD 72 32 23 35 38 121 19
Certification of equipment
Time spent to obtain a compliance certificate, days 12 13 12 10 9 11 10
Import
Time spent to certify imported goods, days 11,2 9,2 9,6 7,4 5,9 13,2 9,7
Amount spent to certify imported goods, USD 96 172 80 83 120 350 76
Time spent on customs procedures, days 2,7 2,0 1,9 2,7 2,5 2,0 1,5
Amount spent on customs procedures, USD 143 169 144 152 158 261 136
Export
Time spent on customs procedures, days 1,7 1,8 1,6 1,7 2,0 2,0 2,1
Amount spent on customs procedures, USD 137 134 85 89 152 213 -
Certification of goods and services (individual
batches)
Time spent to obtain a certificate, days 11 13 12 12 10 11 9
Page 70
70 Conclusions
Cost of Doing Business 2015
Competitiveness Enhancement Project (CEP II) AOCDER Promo-Terra
Indicators Period of survey
2009 2010 2011 2012 2013 2014 2015
Costs, $ 174 160 83 145 124 167 57
Share of unofficial payments, % 20 16 10 14 11 4 4
Certification of goods and services (mass
manufactured products)
Time to obtain a certificate, days 18 14 13 17 12 10 13
Costs, USD 217 192 158 191 158 311 63
Share of unofficial payments, % 18 16 10 14 21 8 38
Sanitary Certification
Share of respondents that got sanitary certificates,
% 61 50 61 60 53 47 34
Time spent to obtain a certificate, days 13 10 8 8 6 10 9
Total costs, USD 104 97 67 94 71 210 60
Share of unofficial payments, % 18 17 17 27 21 11 27
Inspections
Average number of inspections per company 8,2 7,9 4,2 5,2 3,6 6,5 3,8
Average annual time of inspections, days 10 15 7 6 5 5 8
Administration of taxes
Average number of taxes 6,7 6,1 6,1 7,1 7,0 7,5 6,0
Number of full-time accountants 1,3 1,2 1,2 1,2 1,2 1,3 1,2
Price regulation
Companies subject to price regulation, % 39 31 26 24 24 17 12
Average share of prices regulated by the state 26 18 10 8 10 10 4
Execution of contracts
Companies subject to regulation of contracts, % 10 4 3 6 6 4 5
Judiciary system
Share of respondents that turned to government
institutions to settle disputes with companies, % 46 26 31 35 48 14 25
Share of respondents who turned to courts to
address disputes with companies, % 74 62 52 61 49 69 46
Share of respondents who used informal methods
to address disputes with companies, % 22 32 22 28 36 21 -
Share of respondents that turned to illegal methods
to settle disputes with companies, % - - - - - - 14
Share of respondents that turned to unofficial
methods, but legal to settle the disputes with
companies, %
- - - - - - 34
Phytosanitary certification
Share of respondents that obtained phytosanitary - - - - - - 7
Page 71
71 Conclusions
Cost of Doing Business 2015
Competitiveness Enhancement Project (CEP II) AOCDER Promo-Terra
Indicators Period of survey
2009 2010 2011 2012 2013 2014 2015
certificates, %
Time spent to obtain a certificate, days - - - - - - 2
Total costs, USD 35
Share of unofficial payments, % - - - - - - 10