24
WORLD CERAMIC TILE FORUM NOVEMBER 2014

WORLD CERAMIC TILE FORUM NOVEMBER 2014

ECONOMY CONSTRUCTION CERAMIC TILE INDUSTRY
ENERGY STANDARDS FUTURE CHALLENGES
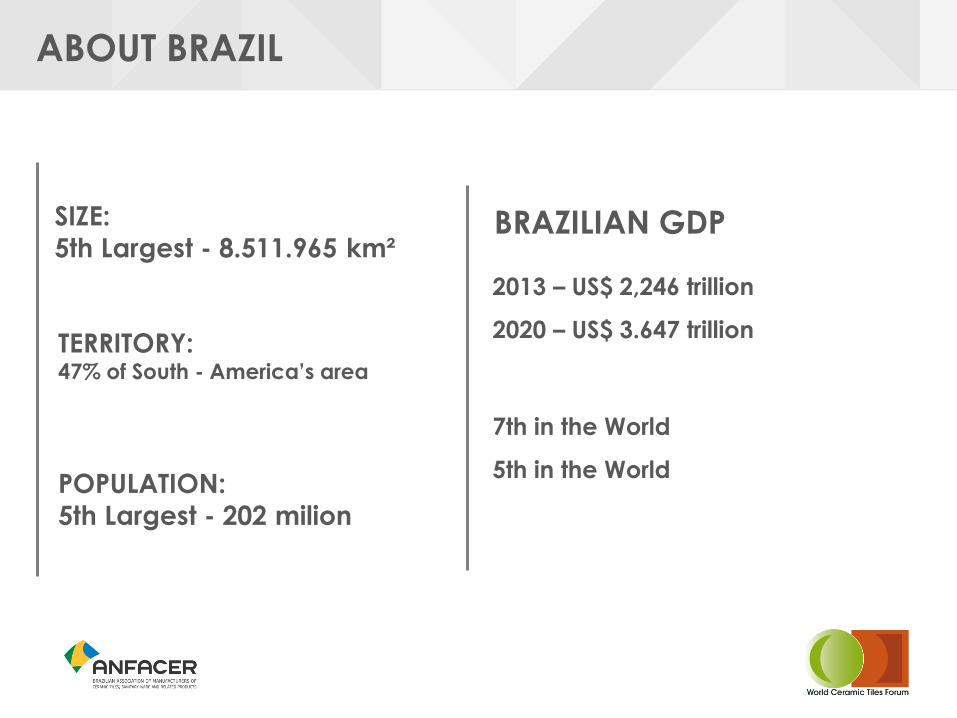
ABOUT BRAZIL
SIZE:
5th Largest - 8.511.965 km²
POPULATION:
5th Largest - 202 milion
TERRITORY: 47% of South - America’s area
BRAZILIAN GDP
2013 – US$ 2,246 trillion
2020 – US$ 3.647 trillion
7th in the World
5th in the World

• Our energy matrix is the cleaner and most renewable in the world;
• 5th larger territory in length, with 8 million square kilometers;
• 2nd largest food exporter;
• 1st producer of soybeans, coffee, sugar, orange juice, beef and chicken;
• 3rd manufacturer of commercial aircrafts;
• 7th largest producer of vehicles;
• 4th largest shipbuilding industry;
• 2nd largest generator of hydroelectric power;
• 1st producer of ethanol;
• 3rd largest market of personal computers;
• 5th in international reserves (US $ 377 billion).
ABOUT BRAZIL

Sou
rce:
Wo
rld
Ban
k
BRAZILIAN GDP GROWTH PER YEAR (%) AND FORECAST

So
urc
e: IB
GE
a
nd
IL
O
BRAZILIAN UNEMPLOYMENT RATE (%) EVOLUTION AND FORECAST

So
urc
e: B
razili
an
Ce
ntr
al B
an
k a
nd
De
loitte
-
10,000
20,000
30,000
40,000
50,000
60,000
70,000
2000 2001 2002 2003 2004 2005 2006 2007 2008 2009 2010 2011 2012 2013 2014(f)
32,779
22,457
16,590
10,144
18,146
15,066
18,822
34,585
45,058
25,949
48,506
66,660 65,272
64,000
60,000
FOREIGN DIRECT INVESTIMENT EVOLUTION - US$ BILLION

ECONOMY CONSTRUCTION CERAMIC TILE INDUSTRY
ENERGY STANDARDS FUTURE CHALLENGES

BRAZILIAN CONSTRUCTION INDUSTRY 2013
• 5th Largest Industry in Brazil
• 5,4 % of the country’s total GDP
GDP variation compared to the previous year 1,6%

-
50.000
100.000
150.000
200.000
250.000
300.000
Un
idad
es F
inan
ciad
as
Operações Contratadas com Recursos de Poupança SBPE - UnidadesConstrução, Aquisição Reforma e Material para Construção
Construção Aquisição Total
National Indicators of Real Estate Market – ABCIP
Real Estate Financing for Construction – Number of Units - SBPE Resources:
The number of units financed under the SBPE in the first semester of 2014 grew 6.5% Construction, 3.8% Acquisition and 4.6% Total regarding the first semester of 2013.
Resource: ABCIP set-2014
Transactions with features of SBPE savings - Units
Construction, Acquisition, Remodeling and Construction Material
Fin
ance
d U
nit
s
Construction Acquisition Total

ECONOMY CONSTRUCTION CERAMIC TILE INDUSTRY ENERGY STANDARDS FUTURE CHALLENGES

Sou
rce
: A
NFA
CER
PRODUCTION CAPACITY EVOLUTION
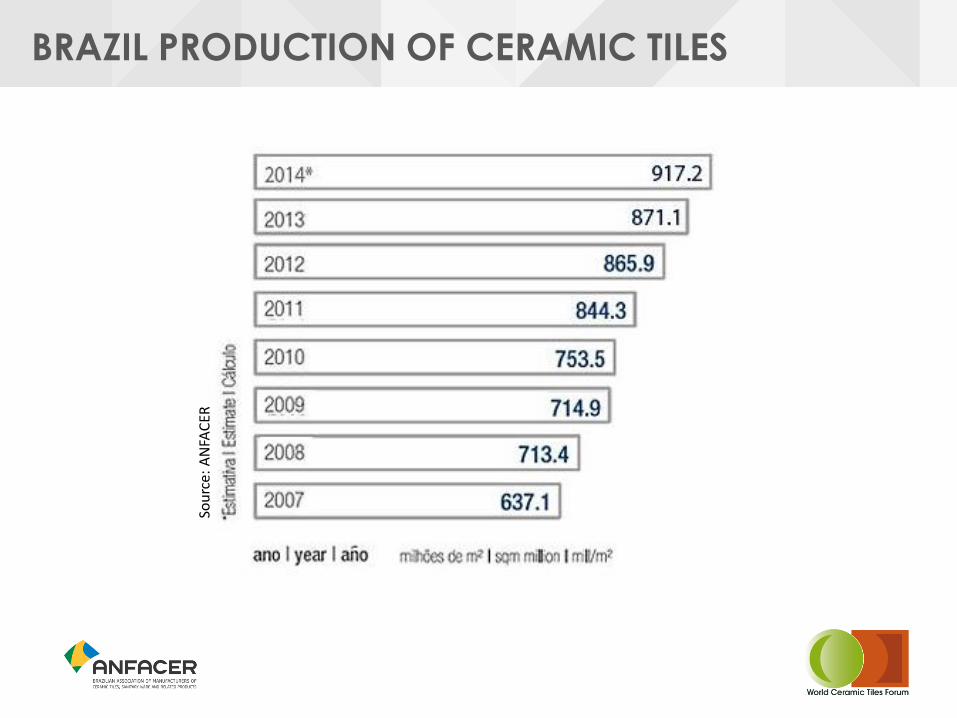
BRAZIL PRODUCTION OF CERAMIC TILES
Sou
rce:
AN
FAC
ER

CERAMIC TILES – DOMESTIC MARKET SALES
Sou
rce
: A
NFA
CER

Sou
rce:
AN
FAC
ER
CERAMIC TILES – EXPORTS
2014* 67.4

Sou
rce:
AN
FAC
ER
BRAZILIAN EXPORTS 2013 - MARKETS

TYPES OF PRODUCT
Sou
rce
: A
NFA
CER
Piso
Floor Tile
3,2%*
*Average Annual
Growth Rate[%]
Do
me
stic P
rod
uctio
n
Parede
Wall Tile
Pared
5,2%*
Fachada
Façade
3,4%*
Porcelanato Esmaltado
Glazed Porcelain Tile
17,1%*
Porcelanato Técnico
Unglazed Porcelain Tile
8,2%*
milh
õe
s d
e m
² | sq
m m
illio
n | m
ill/m
²
20
14
: E
stim
ativa
| E
stim
ate
| C
álc
ulo

ECONOMY CONSTRUCTION CERAMIC TILE INDUSTRY
ENERGY STANDARDS FUTURE CHALLENGES

NATURAL GAS CONSUMPTION
BRAZIL - BIGGEST INDUSTRIAL CONSUMERS BY SECTOR - 2013
Percentage % 106 m3/day
CHEMICAL 20,92% 6,34
CERAMICS 13,90% 4,21
PIG-IRON AND STEEL 10,47% 3,18
NON FERROUS/OTHER METALLURGICAL 9,67% 2,93
PULP & PAPER 8,31% 2,52
FOOD & BEVERAGES 7,06% 2,14
MINING/PELLETIZATION 6,51% 1,97
TEXTILES 3,21% 0,97
CEMENT 0,32% 0,10
OTHERS 19,64% 5,95
TOTAL INDUSTRIAL CONSUMPTION 100,00% 30,32

NATURAL GAS PRICES EVOLUTION
0
5
10
15
20
25
2003 2004 2005 2006 2007 2008 2009 2010 2011 2012 2013 2014
NATURAL GAS PRICES EVOLUTION - US$ per MM BTU
Brazilian city-gate Bolivian Brent EUA UK
BRAZIL AVERAGE PRICE
U$ 14 – U$ 19 / MM BTU Increase of more than 250% from 2004 to 2014
Sou
rce
: A
BR
AC
E

ECONOMY CONSTRUCTION CERAMIC TILE INDUSTRY
ENERGY STANDARDS FUTURE CHALLENGES

• ABNT NBR 13.818 - CERAMIC TILES - SPECIFICATIONS AND TEST METHODS
• ABNT NBR 13.817 - CERAMIC TILE - CLASSIFICATION
• ABNT NBR 13.816 - CERAMIC TILES - TERMINOLOGY
• ABNT NBR 15.463 - CERAMIC TILES - PORCELAIN
• ABNT NBR 15.825 - CERAMIC TILE - INSTALLER
• ABNT NBR 15.873 - MODULAR COORDINATION FOR CONSTRUCTION MATERIALS
• ABNT NBR 15.575 - PERFORMANCE FOR EDIFICATIONS
• ABNT NBR 15.825 – TILE INSTALLER
STANDARDS AND REGULATIONS

ECONOMY CONSTRUCTION CERAMIC TILE INDUSTRY
ENERGY STANDARD FUTURE CHALLENGES

Country
Investment on infrastructure
Reduce industrial taxation
Increase educational levels
Address housing deficit
Advance in Competitiveness
Expand markets
Internationalization of the sector
Compliance control with the technical
standards of products
Ensure the practice of fair trade
Ceramic Tile Sector
FUTURE CHALLENGES


