World Health Organization. Collaborating Center in Reproductive Health. Promoting Healthy Birth Outcomes October 27-28, 2009 Emory University Woodruff Health Sciences Center The National Centers for Disease Control and Prevention (CDC) Georgia Department of Human Resources - PowerPoint PPT Presentation
World Health Organization Collaborating Center in Reproductive Health Promoting Healthy Birth Outcomes October 27-28, 2009 Emory University Woodruff Health Sciences Center The National Centers for Disease Control and Prevention (CDC) Georgia Department of Human Resources Division of Public Health Alfred W. Brann, Jr., MD, Director Woodruff Health Sciences Center Emory University Brian McCarthy, MD, Principal Investigator The National Centers for Disease Control and Prevention
Transcript
World Health OrganizationCollaborating Center in Reproductive
HealthPromoting Healthy Birth Outcomes
October 27-28, 2009
Emory UniversityWoodruff Health Sciences Center
The National Centers for Disease Control and Prevention (CDC)Georgia Department of Human Resources
Division of Public Health
Alfred W. Brann, Jr., MD, DirectorWoodruff Health Sciences CenterEmory University
Brian McCarthy, MD, Principal InvestigatorThe National Centers for Disease Control
and Prevention
WHO Collaborating CenterCountries Receiving HSR Support
PAHO• Guatemala• Honduras• Mexico• Cuba• Grenada• Argentina• Columbia• Ecuador• United States - Georgia - Mississippi
SEARO• India• Indonesia• South Korea
WPRO• China• Philippines
UNRWA For Palestinian Refugees• Gaza• West Bank
The systematic study of whether current medical and other relevant knowledge has been brought to bear to improve the health of a community under a set of existing conditions.
Health Services Research
Expertise required-*Clinical Practice *P.H. Program Management *Epidemiology *Cultural and Social
*Behavioral Science Aspects of Health*Public Policy *Country or state-specific Knowledge
Infant Mortality and Per Capita GNP
Objectives• Objective 1 – List the largest contributor to infant
mortality.
• Objective 2 – Describe a new indicator for the status of health of a community.
• Objective 3 – Describe an approach to a quantified recurrent public health risk.
• Objective 4 – Describe four critical questions that are critical for reproductive-aged women.
Georgia Perinatal Surveillance
• Total cohort accountability begins with the reporting of all products of
conception.
Georgia Perinatal Surveillance
• Feto-infant mortality (FIMR) is used as the measure of mortality rather than infant mortality.
Georgia Perinatal Surveillance
• Five hundred grams (500gm) or twenty week gestation is used as the starting point for counting feto-infant deaths.
Georgia Perinatal Surveillance
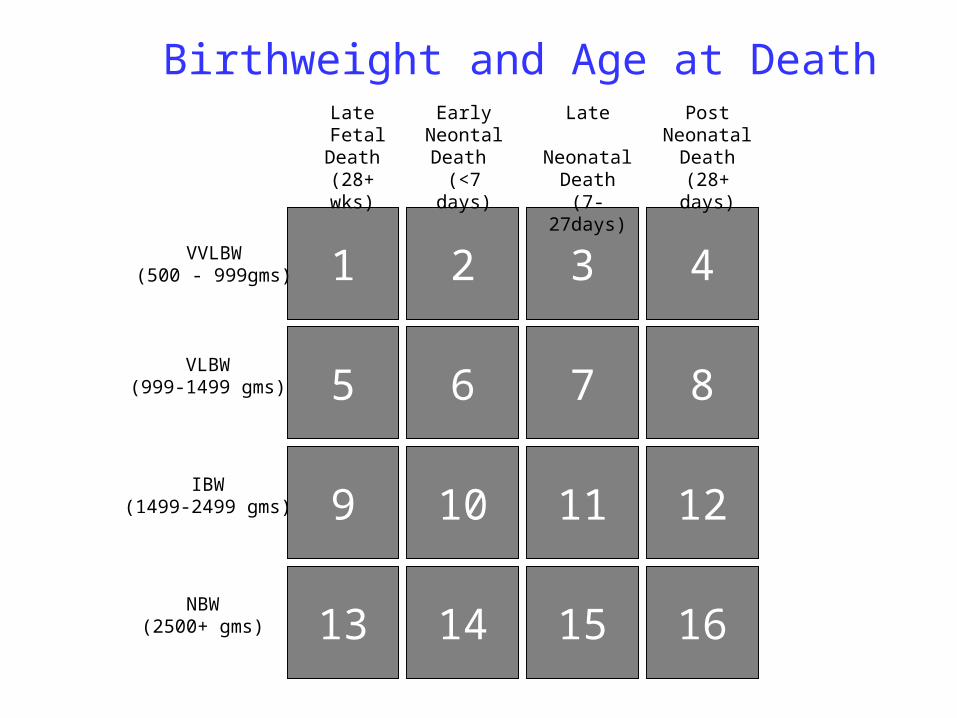
• Birth weight and age of death are used to classify each death two-dimensionally in order to identify pockets of excess feto-infant deaths, along with the most effective strategies for reducing these excess deaths.
Georgia Perinatal Surveillance
• Sociodemographic (SD) groups are used to identify disparities as follows:
Group 1: ≥ 20 years of age, ≥13 years of education
Group 2: ≥ 20 years of age, <13 years of education
Group 3: < 20 years of age, <13 years of education
Georgia Perinatal Surveillance
• The opportunity gap is based on a comparison between the “standard” feto-infant mortality in Georgia (the lowest rate achieved by one SD group in a defined geographical area) with the rates experienced by the remaining SD groups.
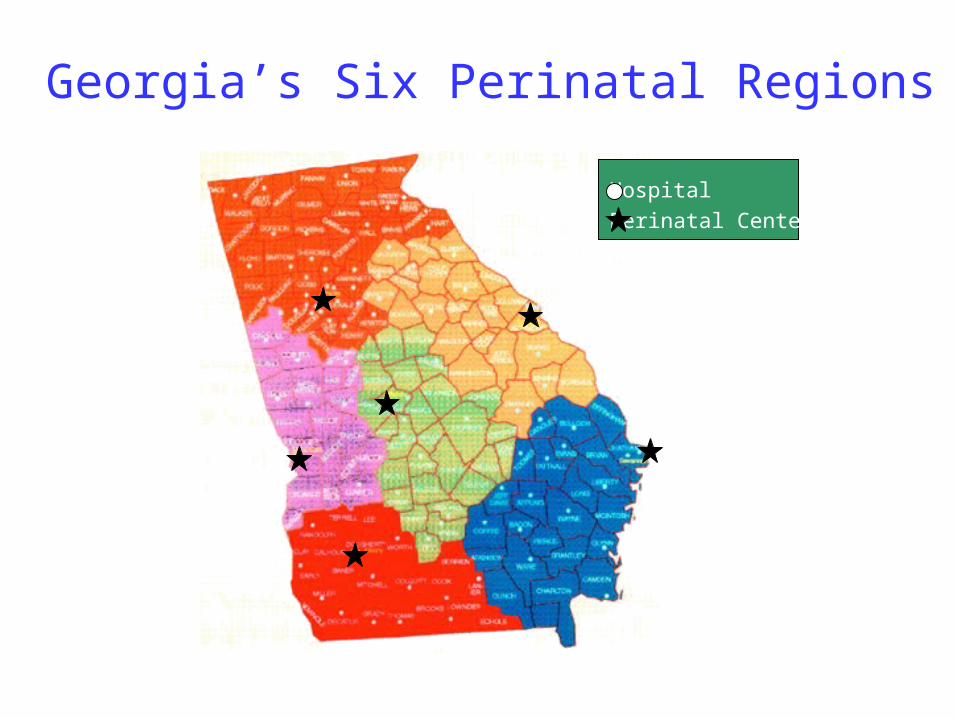
Georgia’s Six Perinatal Regions
Hospital
Perinatal Center
TotalDeaths
3936
Number of Feto-Infant Deaths
Data Rich, Information Poor
TotalDeaths
3936
Number of Feto-Infant DeathsData Rich, Information Poor
• Clean Delivery• Resuscitation• Thermal Control• Breast Feeding• “ART” for the At-Risk-Infant• “Baby Friendly” Concept• Parenting Skill Education
Infant CareInterventions:
• Parenting Skill Education• Child Health Supervision Breastfeeding/nutrition Immunization Growth/Development Monitoring Anticipatory Guidance A.R.I. D.D. Injury Control “ART” for the At-Risk-Infant
•Community Services
Georgia’s Six Perinatal Regions
Hospital
Perinatal Center
4.3
3.2
4.6
4.2
4.1
7.4
Atlanta Augusta Macon
Columbus Savannah Albany
1.40.3
0.7 1.01.2
1.80.5
1.0
2.5
2.4
1.11.02.6
0.80.3
1.5
0.90.6
Total=5.6 Total=8.2 Total=11.4
Total=7.3 Total=8.3 Total=8.6
Excessive Mortality Rate by RegionGeorgia, 1991-1993
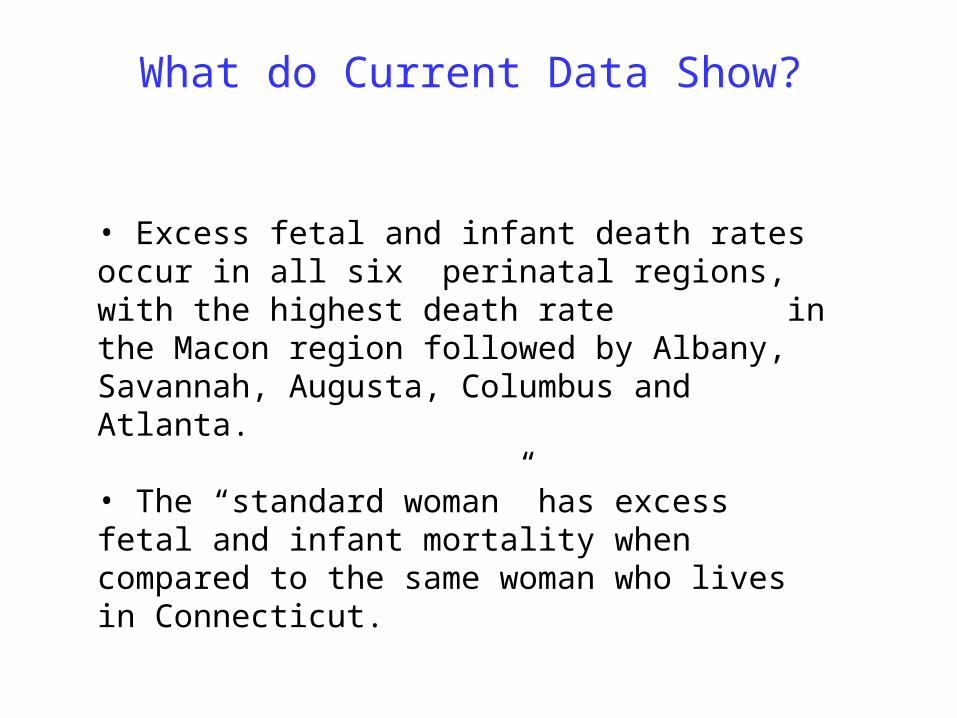
What do Current Data Show?
• Excess fetal and infant death rates occur in all six perinatal regions, with the highest death rate in the Macon region followed by Albany, Savannah, Augusta, Columbus and Atlanta.
• The “standard woman” has excess fetal and infant mortality when compared to the same woman who lives in Connecticut.
The “Opportunity Gap”- The potential for reduction in excessive mortality based on a comparison between rates already achieved by one sub-population in a defined geographical area with those experienced by the remaining population.
Analysis of Sociodemographic Risks
Sub-group Age Education DeathRate
ExcessRate
White Group 1 >20 >13 years 5.7 .7
White Group 2 >20 <13 years 9.0 4.1
White Group 3 ≤19 <13 years 13.3 8.3
Black Group 1 >20 >13 years 14.0 9.0
Black Group 2 >20 <13 years 19.0 14.0
Black Group 3 ≤19 <13 years 19.6 14.6
Deaths per 1,000 live births
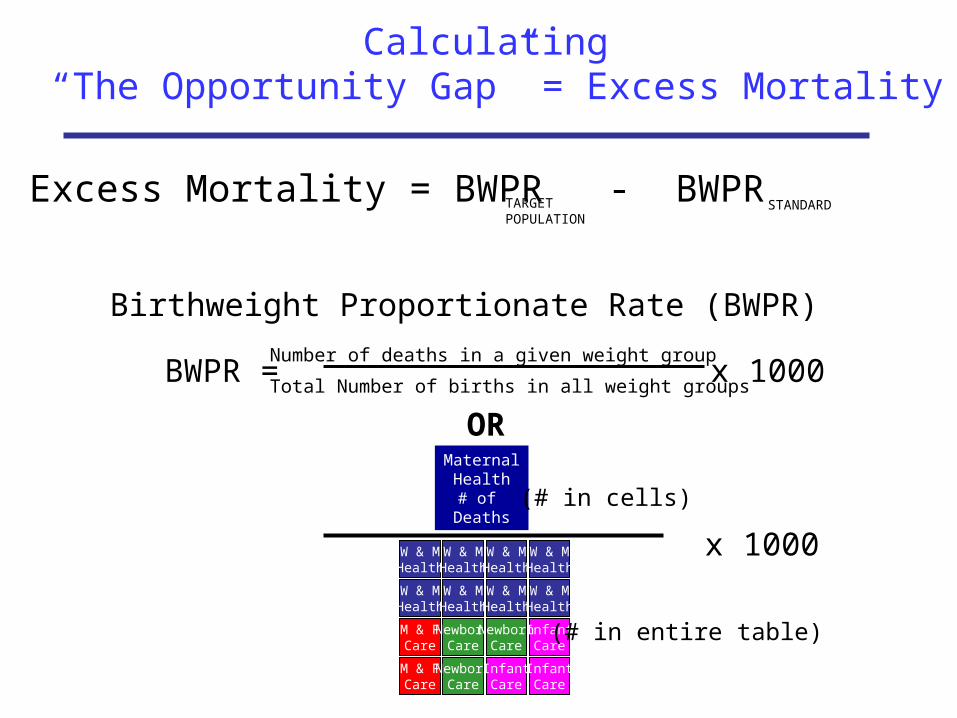
Calculating “The Opportunity Gap” = Excess Mortality
Excess Mortality = BWPR TARGETPOPULATION
- BWPRSTANDARD
Birthweight Proportionate Rate (BWPR)
BWPR =Number of deaths in a given weight group
Total Number of births in all weight groupsx 1000
ORMaternalHealth# of
Deaths
W & MHealth
W & MHealth
M & FCare
M & FCare
W & MHealth
W & MHealth
NewbornCare
NewbornCare
W & MHealth
W & MHealth
W & MHealth
W & MHealth
InfantCare
NewbornCare
InfantCare
InfantCare
(# in cells)
(# in entire table)
x 1000
Analysis of Sociodemographic Risks
Sub-group Age Education DeathRate
ExcessRate
White Group 1 >20 >13 years 5.7 .7
White Group 2 >20 <13 years 9.0 4.1
White Group 3 ≤19 <13 years 13.3 8.3
Black Group 1 >20 >13 years 14.0 9.0
Black Group 2 >20 <13 years 19.0 14.0
Black Group 3 ≤19 <13 years 19.6 14.6
Deaths per 1,000 live births
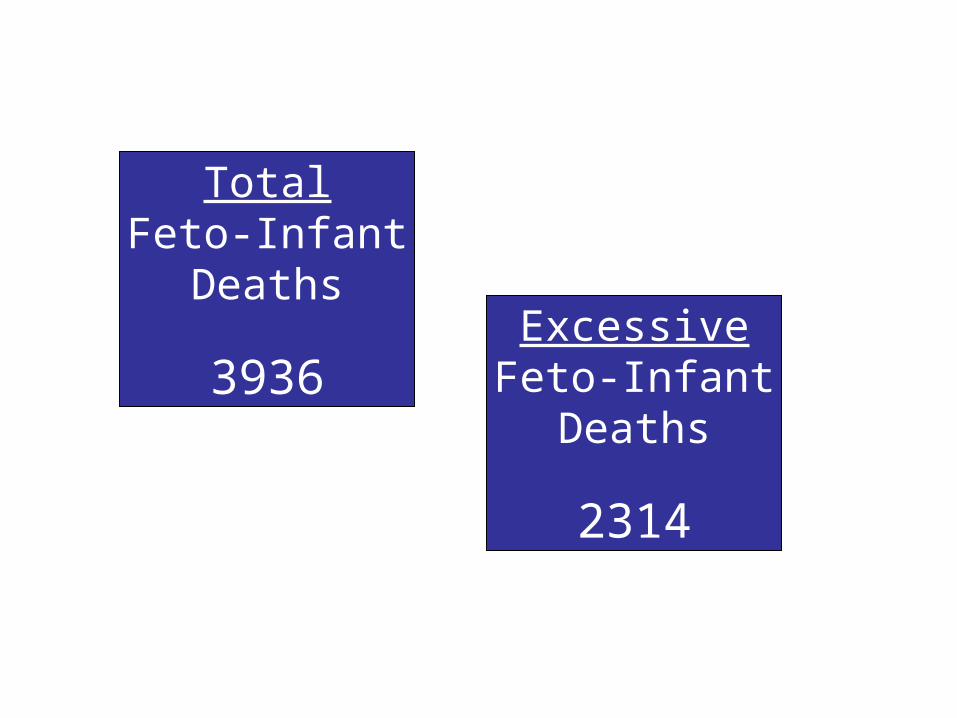
TotalFeto-Infant
Deaths
3936ExcessiveFeto-Infant
Deaths
2314
Calculating “The Opportunity Gap” = Excess Mortality
Excess Mortality = BWPR TARGETPOPULATION
- BWPRSTANDARD
Birthweight Proportionate Rate (BWPR)
BWPR =Number of deaths in a given weight group
Total Number of births in all weight groupsx 1000
ORMaternalHealth# of
Deaths
W & MHealth
W & MHealth
M & FCare
M & FCare
W & MHealth
W & MHealth
NewbornCare
NewbornCare
W & MHealth
W & MHealth
W & MHealth
W & MHealth
InfantCare
NewbornCare
InfantCare
InfantCare
(# in cells)
(# in entire table)
x 1000
2.1
0.8
1.20.9
Total = 5.0
Feto-Infant Mortality RateWhite Group I, Atlanta Region
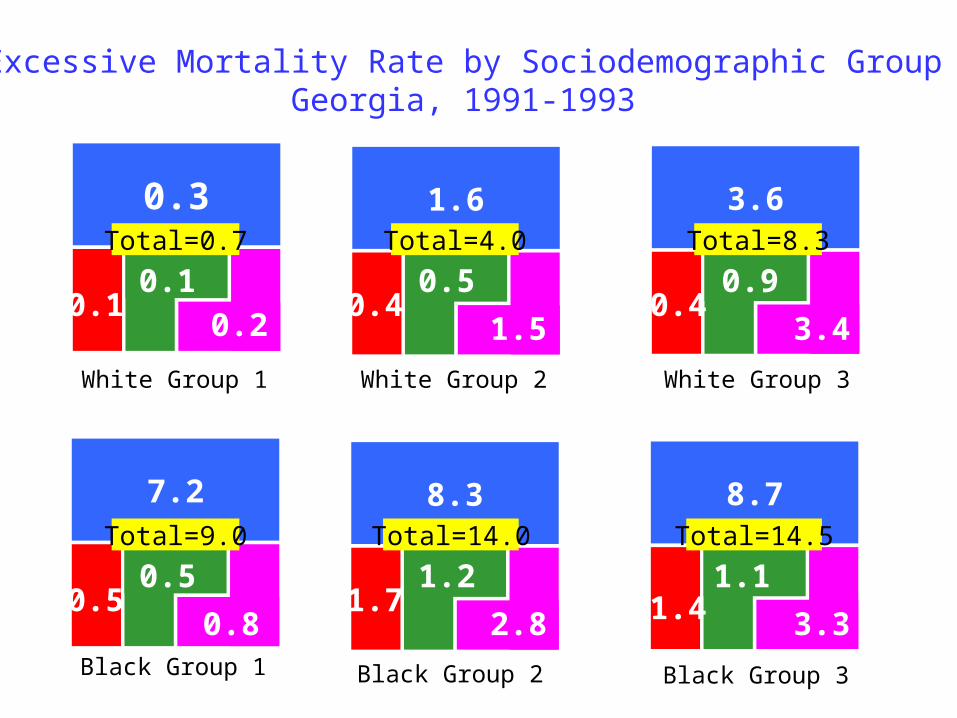
7.2
0.3
8.3
1.6
8.7
3.6
Excessive Mortality Rate by Sociodemographic GroupGeorgia, 1991-1993
White Group 1 White Group 2 White Group 3
Black Group 1 Black Group 2 Black Group 3
0.20.1
0.1 0.40.5
1.50.4
0.9
3.4
3.3
1.11.42.8
1.21.7
0.8
0.50.5
Total=0.7 Total=4.0 Total=8.3
Total=9.0 Total=14.0 Total=14.5
Interventions for Reducing Mortality
Women’s and Maternal Health
Maternal and Fetal Care
Neonatal Care
Infant Care
Georgia’s Six Perinatal Regions
Hospital
Perinatal Center
Areas of Concentration to Reduce Infant Mortality
Area Potential for Improvement
WOMEN’S & MATERNAL HEALTH 60%
Maternal Fetal Care 10%
Neonatal Intensive Care 9%
POSTNATAL CARE 21%
LOW HIGH
Figure 1: Percent of Births According to Sociodemographic group for Georgia, 1981-83, 1991-93, 2001-03
0%
5%
10%
15%
20%
25%
30%
35%
40%
Age 20+, Educ.13+ yrs.
Age 20+, Educ.<13 yrs.
Age <20, Educ.<13 yrs.
Age 20+, Educ.13+ yrs.
Age 20+, Educ.<13 yrs.
Age <20, Educ.<13 yrs.
White NH Grp 1 White NH Grp 2 White NH Grp 3 Black NH Grp 1 Black NH Grp 2 Black NH Grp 3
Sociodemographic Group
Perc
ent o
f birt
hing
pop
ulat
ion
1981 - 1983
1991 - 1993
2001 - 2003
Time Period:
Figure 2: Comparison of Sociodemographic Group Specific Feto-Infant (20+ Weeks) Moratlity Rates for Georgia, 1981-83, 1991-93, 2001-03
12.8
18.8
26.228.4
35.739.1
24.6
7.711.9
18.122.1
26.028.7
16.7
5.19.8
12.3 11.5
18.0 17.9
10.5
0
5
10
15
20
25
30
35
40
45
50
Age 20+, Educ.13+ yrs.
Age 20+, Educ.<13 yrs.
Age <20, Educ.<13 yrs.
Age 20+, Educ.13+ yrs.
Age 20+, Educ.<13 yrs.
Age <20, Educ.<13 yrs.
White NH Grp 1 White NH Grp 2 White NH Grp 3 Black NH Grp 1 Black NH Grp 2 Black NH Grp 3 Total
Sociodemographic Group
FIM
R pe
r 100
0
1981-83
1991-93
2001-03
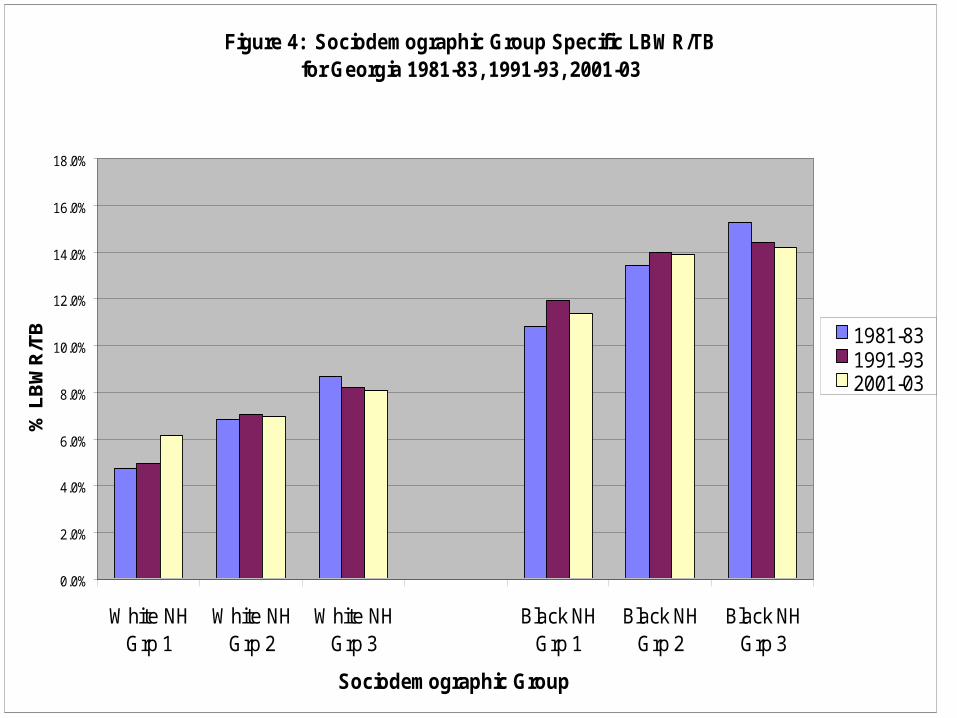
Figure 4: Sociodemographic Group Specific LBWR/TB for Georgia 1981-83, 1991-93, 2001-03
0.0%
2.0%
4.0%
6.0%
8.0%
10.0%
12.0%
14.0%
16.0%
18.0%
White NHGrp 1
White NHGrp 2
White NHGrp 3
Black NHGrp 1
Black NHGrp 2
Black NHGrp 3
Sociodemographic Group
% L
BW
R/T
B 1981-831991-932001-03
Figure 4: SES Group Specific Birthweight Specific Mortality Rates
• Clean Delivery• Resuscitation• Thermal Control• Breast Feeding• “ART” for the At-Risk-Infant• “Baby Friendly” Concept• Parenting Skill Education
Infant CareInterventions:
• Parenting Skill Education• Child Health Supervision Breastfeeding/nutrition Immunization Growth/Development Monitoring Anticipatory Guidance A.R.I. D.D. Injury Control “ART” for the At-Risk-Infant
•Community Services
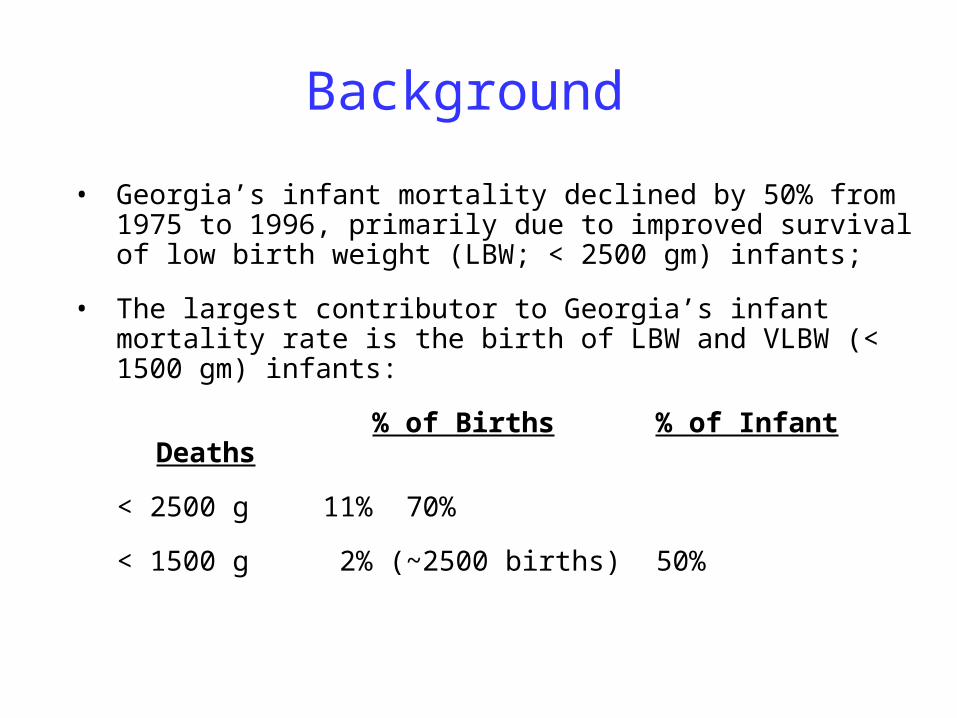
Background
• Georgia’s infant mortality declined by 50% from 1975 to 1996, primarily due to improved survival of low birth weight (LBW; < 2500 gm) infants;
• The largest contributor to Georgia’s infant mortality rate is the birth of LBW and VLBW (< 1500 gm) infants:
% of Births % of Infant Deaths
< 2500 g 11% 70%
< 1500 g 2% (~2500 births) 50%
Background
• African-American women in Georgia have twice the rate of LBW and 3-4 times the rate of VLBW delivery compared to Caucasian women, resulting in twice the rate of infant mortality (1).
• Survival of VLBW infants has significantly improved in the last 25 years, but the prevalence of cerebral palsy has not changed.
Background
• No obstetrical or prenatal assessment or intervention has been successful in predicting or preventing a woman’s first preterm/LBW delivery (4);
• The single best predictor of a preterm/VLBW delivery is a history of a previous preterm/VLBW delivery (5).
• White women – 8%
• African-American women – 13%
Background
• Experience and a growing body of evidence link the delivery of a VLBW infant to aspects of a woman's health status, including (1):
– Unrecognized and poorly-controlled medical problems;
– Reproductive tract infections (including BV and STI’s);