25
Petr Lupač, Ph.D. Jan Sládek, M.A. Department of Sociology Faculty of Arts Charles University in Prague The Czech Republic
| Date post: | 16-Jul-2015 |
| Category: |
Science |
| Upload: | petr-lupac |
| View: | 61 times |
| Download: | 1 times |

Petr Lupač, Ph.D.Jan Sládek, M.A.
Department of SociologyFaculty of Arts
Charles University in PragueThe Czech Republic
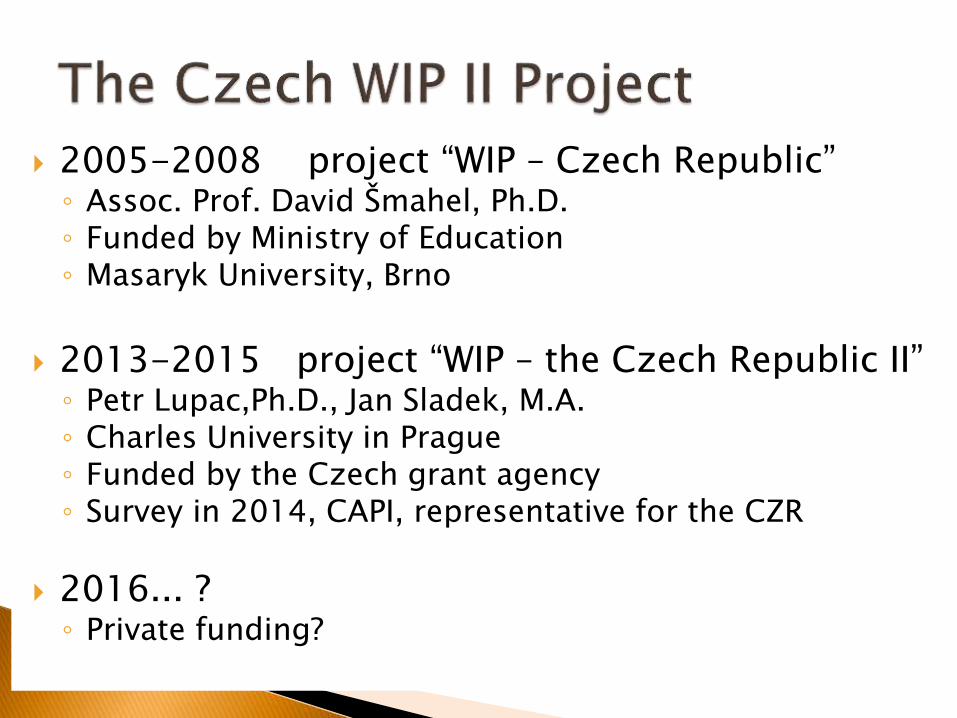
2005-2008 project “WIP – Czech Republic”◦ Assoc. Prof. David Šmahel, Ph.D.◦ Funded by Ministry of Education◦ Masaryk University, Brno
2013-2015 project “WIP – the Czech Republic II” ◦ Petr Lupac,Ph.D., Jan Sladek, M.A.◦ Charles University in Prague◦ Funded by the Czech grant agency◦ Survey in 2014, CAPI, representative for the CZR
2016... ?◦ Private funding?

Pilot study in May
Data collected in May and June 2014 by a specialized agency
Method of data collection ◦ CAPI F2F interviews◦ Stratified random sampling combined with quota sampling ◦ Measures taken to include parts of the population with lower probability of being
interviewed Respondents declaring no or very low interest in being interviewed pre-recruited from CAWI
panel (cca 8 % of the sample)
Trained experienced interviewers instructed to deal with soft-rejection
Financial incentives (computed or estimated from wage)
100 % of the interviews were recorded, controlled and problematic respondents were excluded
1316 respondents in the final sample
Weighted sample representative for the population of the Czech Republic, age 15+
A good fit of results with other data sources (WIP I, CZSO, Facebook)

Problem: We do not know the share of non-questioned busy people in a general population -> four steps to balance the sample
I. Weighting 92% of the sample (that was not pre-recruited) to fit the sociodemographic structure of the Czech population
II. Finding the relations between sociodemographics and Internet use/nonuse as well as the “pure” percentage of Internet users
III. Resulting Internet use added as a fixing variable to the weighting procedureIV. Weighting the whole sample by the following auxiliary variables
Region (14 categories – NUTS3) Size of municipality (5 categories) Gender (2 categories) Age (6 categories) Education (4 categories) Age x education (30 categories) Employment status (6 categories) Attended 2013 elections (2 categories)
◦ 5 iterations, weighting range: 0,5 – 2,0

WIP Core Questions
Digital skills◦ Operational, information, [strategic]
Social capital◦ proxy use, binding, bridging, network, structural holes, sociability
Cultural capital◦ Emerging, high-brow, reading books, active foreign language use
Political capital and behavior Innovativeness Internet indispensability Time online weekly Preference of online communication Experience with the Internet use/nonuse affecting quality
of life in 11 dimensions
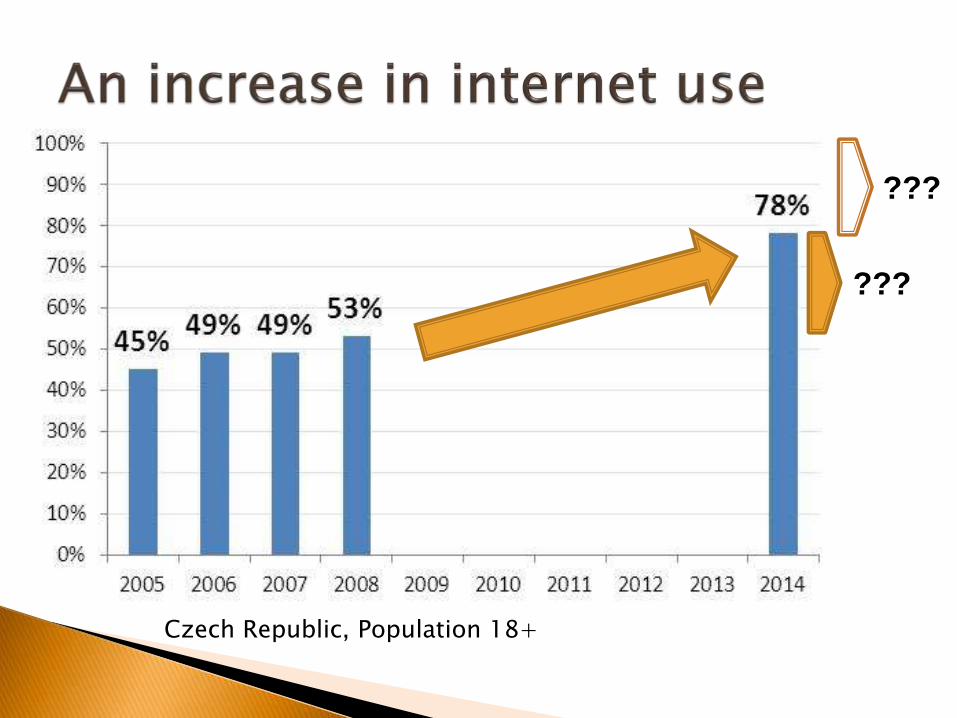
Czech Republic, Population 18+
???
???
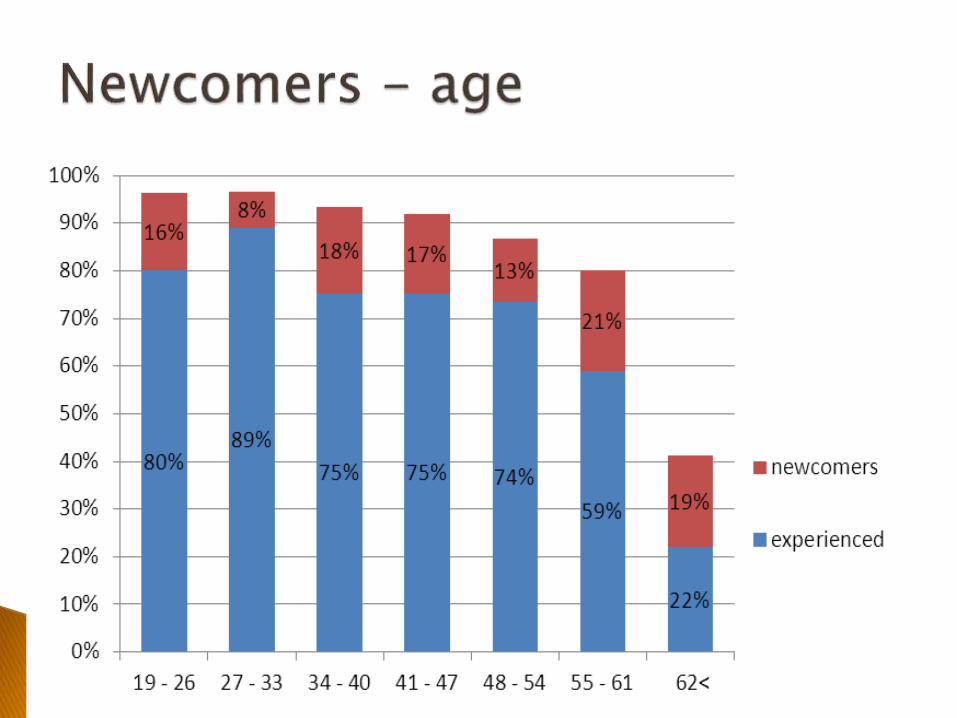
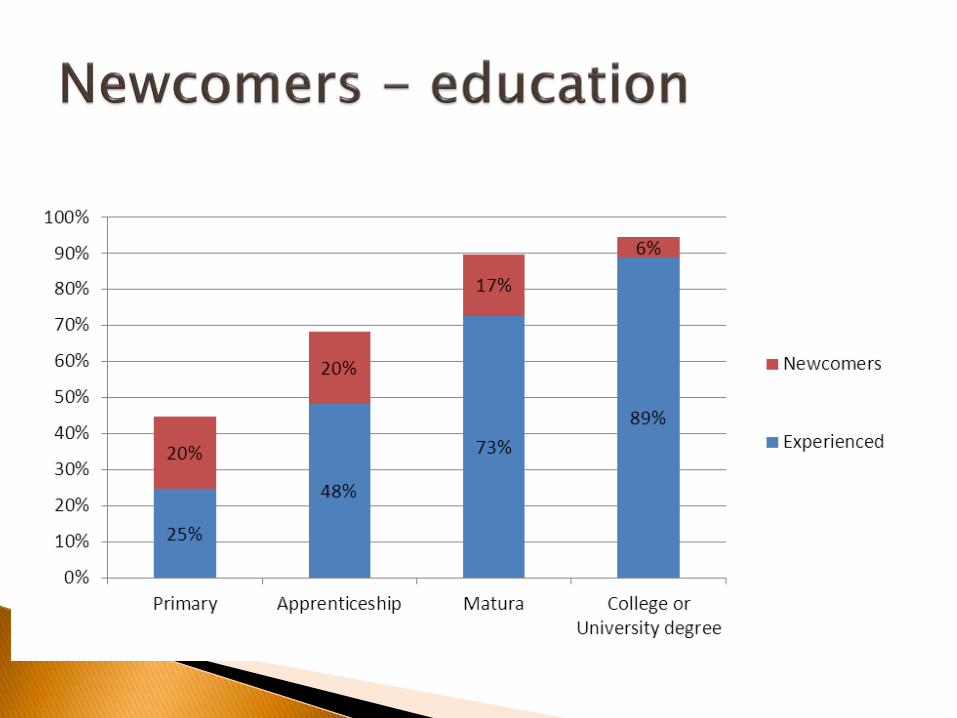

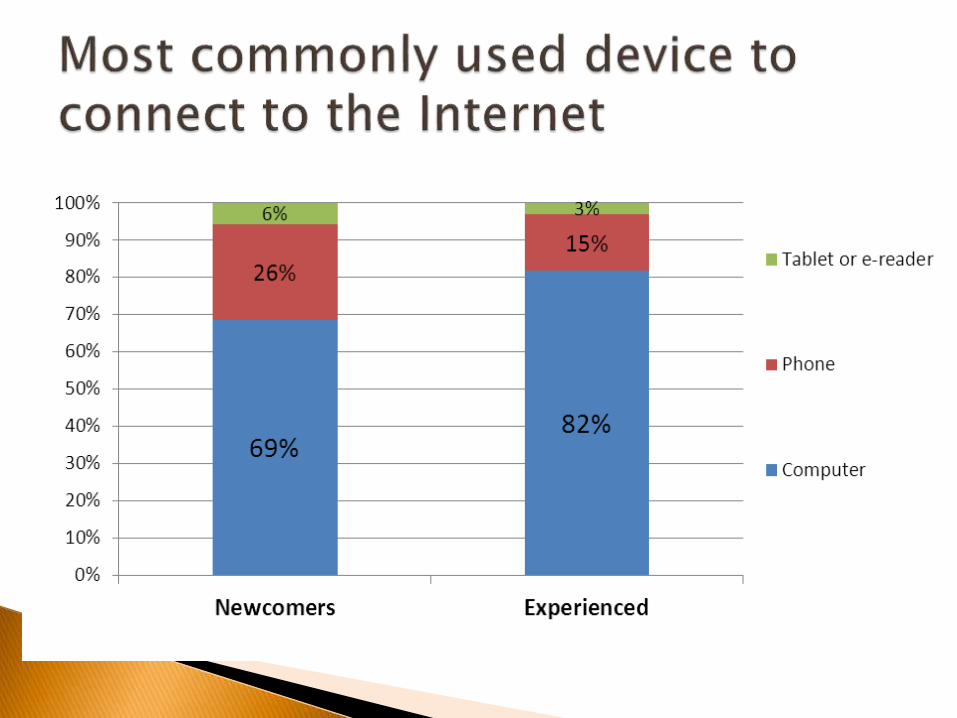

Experienced Newcomers
At home 10 (13; 12) 5 (10; 13)
At work 8 (12; 12) 3 (4; 4)
Elsewehere 2 (3; 5) 2 (2; 2)
On the move 2 (5; 8) 2 (8; 12)
Total 29 (52; 40) 25 (20; 17)
Median (mean; std. dev)
Age group 30-44 - > 5 (13;16)
+ Women -> 10(18; 17)

Coming mostly from◦ Older age groups◦ With lower education◦ Women
There are almost twice as much people mostly using tablet or mobile for Inet connection among newcomers
Spend less time online in general BUT on the move, female newcomers who are 30-44 years old beat all other age groups

65 % of nonusers do not know anyone (relative or acquaintance) who could help them set up or solve technical problem with Internet connection
30 % of nonusers do not know anyone who could order something for them via the Internet
28 % of nonusers do not know anyone who could send an email, fill an online form or find something online for them
31 % of nonusers asked someone to do so at least several times

Having proxy No proxy
Age 66 (63; 13) 73 (73; 14)
Nr of people living in the household 2 (2,03; 12) 1 (1,63; 4)
Ind. income/month 2/17 (2; 3) 2/17 (2; 2)
Nr of close friends 3 (4; 3) 1 (2; 3)
Share of soc. environment using
the Internet30 % (40 %; 30 %) 0 % (20 %; 30 %)
Life satisfaction 2/10 (3; 3) 4/10 (4; 3)
Median (mean; std. dev)

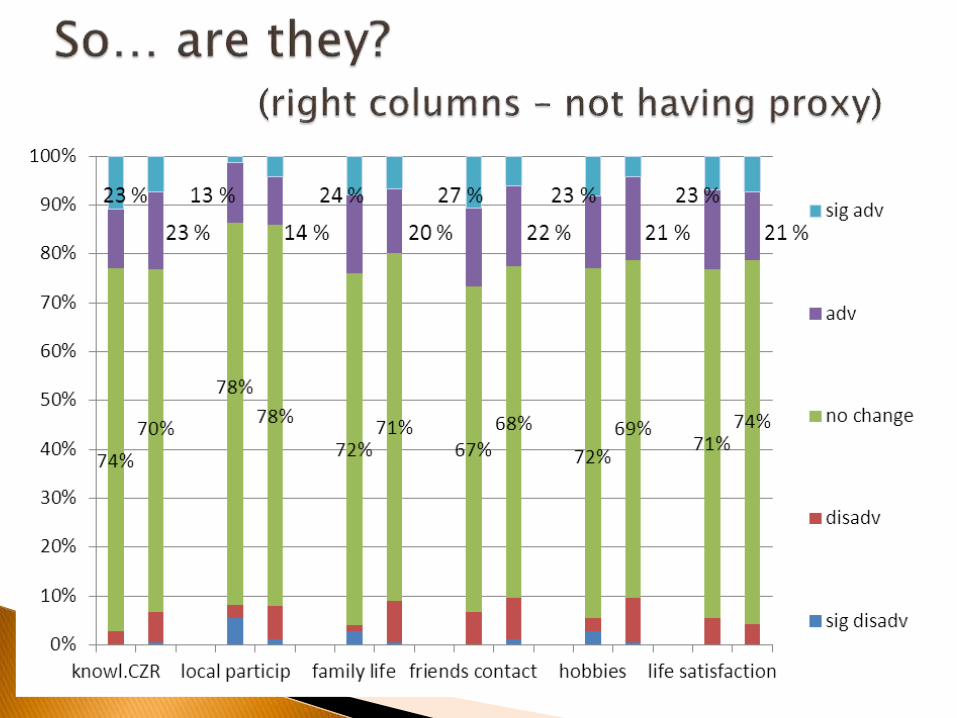
Q: Not-using the Internet can be both advantage and disadvantage. When you think about your personal experience in the last years, how much does the fact that you are not using the Internet affected your life in thefollowing areas? Please, answer with the help of a scale: {interviewers instructed to explain the Q if needed}
-5 0 +5 significant worsening - no change - significant improvement

Your knowledgeability of what's going on in the Czech republic
Your understanding of what's going on in othercountries
Your understanding of what's going on in your locality Your involvement in public life in your local community Dealing with state authorities {getting subsidy, welfare,
submitting documents, etc.} Contact with your family and your family life Contact with your friends and acquiantences Building up your career and your success on labor
market Your overall financial situation (incl. shopping and
selling things) Pursue and develop your hobbies Your overall satisfaction with your life

Voting activity◦ Frequent elections in CZR (2010, 2012, 2013x2, 2014x2)
◦ Declining participation, yet municipal rather high
◦ No. 1 reason for non-voting: Disinterest in politics (45% of nonvoters), no. 2: Not know who to vote (17%)
Expressing ideas◦ 10-20% admit fear of expressing their political ideas
online, more than half is okay with others expressing extreme ideas
Social contacts◦ ¼ states that an active politician is amongst their close
relatives or friends, ½ discusses politics

1/3 never looked for local info, 1/3 does so rarely, 1/3 regurarly on weekly basis
87% never used the ICT to contact local politicians (x direct democracy)


3 % Engaged in online volunteer campaigning
10 % Emailed family and friend to convince them
10 % Expressed their preferrence online
25 % factchecked politicians
10 % checked the party campaign expenses online
60 % stated no influence of online content on the decision to vote; the rest equally divided between positive/negative impact
Turning information into action (passivity)
Internet is necessary yet not sufficient
No „dangerous“ barriers in political use of the Internet

Petr Lupač, Ph.D. Jan Sládek, M.A.
[email protected] [email protected]
@PetrLupac @JanSladek
Department of Sociology
Charles University in Prague, Faculty of Arts
Celetna 13
The Czech Republic


