28
Geographical Access and Quality of Primary Schools - A Case Study of South 24 Parganas District of West Bengal Jhuma Halder
| Date post: | 08-Sep-2018 |
| Category: |
Documents |
| Upload: | phungkhuong |
| View: | 214 times |
| Download: | 0 times |

Geographical Access andQuality of Primary Schools- A Case Study of South24 Parganas District ofWest Bengal
Jhuma Halder

ISBN 978-81-7791-213-5
© 2016, Copyright Reserved
The Institute for Social and Economic Change,Bangalore
Institute for Social and Economic Change (ISEC) is engaged in interdisciplinary researchin analytical and applied areas of the social sciences, encompassing diverse aspects ofdevelopment. ISEC works with central, state and local governments as well as internationalagencies by undertaking systematic studies of resource potential, identifying factorsinfluencing growth and examining measures for reducing poverty. The thrust areas ofresearch include state and local economic policies, issues relating to sociological anddemographic transition, environmental issues and fiscal, administrative and politicaldecentralization and governance. It pursues fruitful contacts with other institutions andscholars devoted to social science research through collaborative research programmes,seminars, etc.
The Working Paper Series provides an opportunity for ISEC faculty, visiting fellows andPhD scholars to discuss their ideas and research work before publication and to getfeedback from their peer group. Papers selected for publication in the series presentempirical analyses and generally deal with wider issues of public policy at a sectoral,regional or national level. These working papers undergo review but typically do notpresent final research results, and constitute works in progress.

GEOGRAPHICAL ACCESS AND QUALITY OF PRIMARY SCHOOLS – A CASE
STUDY OF SOUTH 24 PARGANAS DISTRICT OF WEST BENGAL
Jhuma Halder∗
Abstract Provision of schooling facilities within walking distance is one of the key components of universal elementary education. Schooling facilities do not indicate only set up of schools but also provision of infrastructure in the schools. Even after twelve years’ of implementation of Sarva Sikhshya Abhiyan (SSA) and five years implementation of Right to Education Act, there are still widespread disparities in terms of both school set-up and infrastructure in primary schools. Enrolment has increased manifold indicating parental aspiration to send their children to schools. But supply related variables have lagged behind. This disparity is very prominent in the regions which are geographically backward. Using primary and secondary data, a case study has been carried out to explore the scenario of location of schools, habitation wise distribution of schools, infrastructure of schools and attainment of students in schools. The study finds that attainment of children in schools is very much related to quality of schools.
1. Introduction India is a land of diversities in its geographical features, in terms of its mountain ranges, valleys, desert
regions, forests, fertile plains, dry plateaus, coastal areas etc. It is a country with the second largest
population in the world. Due to the burgeoning numbers of population, density of population in the
country is rising leading to much population pressure, and the remote geographical areas of the country
are no exception. Understandably, in these remote geographical areas, mostly inhabited by socially
deprived sections, the performance of students is much below the levels elsewhere.
The dictionary meaning of geographical access indicates the ability to reach a particular place
from another place. These two ends in this study are; children and primary school or specifically, the
location of the school and location of the habitation where the students reside. Geographical
accessibility to schools is related to three variables—location of schools, location of habitations and
intermediated road network. Several studies have revealed the negative link between remoteness of
habitations and educational development (Duflo, 2001; Jalan and Glinskaya, 2003; Filmer, 2007).
Worldwide, there are millions of people who do not have access to basic services and education, which
comes from having a higher degree of accessibility and mobility (Shyam, 2007). Geographical distance
to school is cited as a major barrier to schooling of rural children in India (UNICEF, 2006; Ward, 2007).
The time and the physical discomfort especially in hot summers and monsoons involved in accessing
schools cannot be used either for productive activities or for leisure (Mukherjee, 2011).Therefore, the
basic question is: how far does a child travels to access good schooling.
The access norm as mandated by RTE Act is to ensure that all children have access to primary
school within one km of their habitation, and all children have access to upper primary school within
three kilometres of the habitation. There are state level modifications in the RTE norm, such as in West
Bengal, where the area or limits of neighbourhood within which a school has to be established by the
State Government shall be 1 km for primary schools and 2 km for upper primary schools in rural areas.
∗
2
There is no bar to having more than one primary school within the radius of 1km from the habitation
provided it is justified in terms of accessibility and need based requirement (Kolkata Gazette,
Extraordinary, March 2009). The maximum number of student strength shall not exceed 300 for a
primary school and 500, for an upper primary school. The implementation of this policy depends on
residential pattern and geographical accessibility of the area.
The term schooling indicates not only having a school in a nearby location but also the quality
of infrastructure in the schools, and most importantly whether the school can attract children or not.
However, having a school within the stipulated distance cannot attract children for schooling. Parental
decision to send their children to school is governed largely by the supply related variables like provision
of physical infrastructure in primary schools. Several studies have revealed that poor quality of schools
is pushing children out of the folds of formal learning (Lewin, 2007; Sinha and Reddy, 2010; Govinda
and Bandyopadhyay, 2011).Many children, who have initial access to school, attend irregularly due to
inadequate infrastructure, facilities and resources (Govinda and Bandyopadhyay, 2008). Some of the
basic facilities needed to facilitate effective education in an institution are classroom, drinking water
facility, toilet facility, library and other ancillary facilities. Without basic infrastructure, a school cannot
run. The RTE Act has mandated some of the infrastructural factors for running quality school.
Therefore, it is important to investigate the gap between actual and optimal conditions of infrastructure
in any primary school.
This paper is part of a broader study that aims to investigate the situation of school location
and their infrastructural quality. The objective of the study is to understand the actual spread of
schools, infrastructural quality and student’s attainment in different schools.
1.1. Data and Methodology
Data for the present study have been collected from District Report Cards, School Report Cards
published by DISE (District Information System on Education) for the years of 2006-07 and 2013-14
and Census of India reports. In order to study geographical access, school mapping exercise was
carried out. The location of all schools in the selected panchayats was collected through GPS survey and
later plotted on the satellite imagery through GIS mapping.
To study the physical infrastructure in primary schools, data regarding the different
components of physical infrastructure (e.g. classrooms, common toilet, girl’s toilets, blackboards, etc.)
have been reduced to a comprehensive ‘Index of Physical Infrastructure.’ Ranking method has been
used to create a composite index of Physical infrastructure with the aid of SPSS software. Appropriate
bivariate analyses like Spearman’s ranking Correlation have been used to show the relation between
educational attainment and the aggregative index of physical infrastructure.
1.2. Study Area
The area selected for the study is the South 24 Parganas district of West Bengal, which stretches from
the metropolitan Kolkata to the remote riverine villages up to the mouth of the Bay of Bengal (Figure
1.1). Apart from its staggering size and population, the district administration has to contend with
problems typical to metropolitan life in the urban area—such as high population density and overloaded

3
civic infrastructure—and in complete contrast, in the rural areas, the lack of transport and
communication facilities and weak delivery systems. Spread over an area of 8165 sq. km, the district of
South 24 Parganas covers almost 9 per cent of the total landmass of the state of West Bengal. The
southern part of the district is covered by thick mangrove forest named ‘Sundarban’. This region is
mainly a delta region of Hugli River and contains 37 islands. The tract of Sundarban has experienced
calamities and devastation due to natural disaster and human interventions, many a time resulting in
de-population. However, the very rich natural resources have always attracted people not only from
neighbouring tracts but also from countries abroad. The district has challenging geographical features
and over 84 per cent of the population lives in rural areas. Since 27.02 per cent of the population in this
region is in 0 to 14 years of age group, it is imperative to investigate its schooling situation.
The district has two types of geographical areas- forested blocks (13 blocks) and non-forested
blocks (16 blocks). Taking this into consideration, four blocks have been selected for the study
consisting of two blocks from the forested area and two blocks from the non-forested area. The
selected non-forested blocks are Diamond Harbour-I and Magrahat-I and the selected forested blocks
are Mathurapur-II and Basanti. From these blocks, 11 panchayats have been selected randomly for
detailed study.
Figure 1.1: Location of Study Area
1.2.1. Growth of Primary Schools in the Study Area
Primary education in West Bengal is mainly served by two types of institutions – regular primary schools
and Sishu Sikha Kendras. The primary schools are run by the Department of education, and the SSKs
are run by the Department of Panchayat and Rural Development, Government of West Bengal. The
SSKs are a special programme designed by the State Government in 1997-98 in these areas to cater to
the disadvantaged children. The SSKs are located in Scheduled Caste, Scheduled Tribe and Muslim
inhabited areas.

4
Among the two types of geographical regions in the study area, there has been higher
expansion of government schools in the forested region, particularly in the Basanti block in the last few
years (Table 1.1). Twenty-two new schools were added in the selected panchayats of Basanti block
between 2005-06 and 2013-14, followed by Mathurapur-II (15 schools), Magrahat-I (11 schools) and
Diamond Harbour-I (7 schools). Further analysis of the government schools reveals that increase in the
number of regular primary schools has been very low in the last 8 years; only one new regular primary
school was established in the non-forested region and 4 schools in the forested region consisting of two
in each block. However, a large number SSKs were established during this period; a much higher
number of SSKs were established in the forested region (33 SSKs) as against 17 SSKs in the non-
forested region. On the other hand, private players prefer the more developed localities of the non-
forested regions, and hence the increasing number of private schools in the area. In the non-forested
region, every panchayat has 3-4 private schools. However, in panchayats in the forested region, private
schools are a rarity, particularly in the remote villages surrounded by the forest.
Further, the study has estimated the size of the schools in terms of enrolment. Table 1.2 maps
the changes in school size over time. The number of government schools increased from 38 to 58 in the
non-forested region and 63 to 102 in the Sundarban forest region in the period under review. It may be
observed that the proportion of schools with less than 50 enrolments has doubled in the non-forested
blocks. There were no schools with less than 50 enrolments in 2005-06 in the forested blocks but within
8 years, there appeared a 35 per cent increase in the number of schools in this category. It may be
further observed that most of these schools with below 50 enrolments were SSKs. In the non-forested
region, 56 per cent SSKs have enrolments below 50. Specifically, in Diamond Harbour-I block, 88 per
cent SSKs have enrolment below 50. In the forested blocks, 28 percent fall in this category. But within
the forested region, Mathurapur-II block has 73 per cent schools fall in the small category, below 50
enrolments.
1.2.2. Road Network
There is a sharp disparity in road network between the two types of region in the study area. The
forested blocks are primarily island blocks with hardly any surface road network. Recently, there has
been some improvement in mainland connectivity in Basanti, with the building of a bridge, but the
overall the situation however is not good. The non-forested blocks are better endowed than forested
blocks, in that these have at least kutcha (non-metalled) roads within the villages and metalled roads
connecting the other villages.
The south 24 Parganas Human Development Report (2009) has identified some of the blocks
(5 blocks) in the forested region as deserving special understanding of the disposition of the people
here, their livelihood and threat perceptions. Basanti, a sample block in the study is one among them.
The same report also states that some of the blocks (7 administrative blocks) are now part of the
mainland. These blocks have been gradually linked with the mainland over time, and are now connected
by roads and also have some infrastructural facilities. But in comparison to the rest of the blocks in the
district, the infrastructure in these ‘not-so-remote’ Sundarban blocks is poor and sample block
Mathurapur-II is one such block with below par infrastructure. Hence, there are inter-regional disparities
5
between non-forested region and forested region and there is also substantial intra-regional variation in
accessibility level within blocks in the forested region.
The road network of the study area can be summed up as follows: All villages in the sample
have paved approach road and mud approach road. In the island block Basanti, 35 percent villages are
bordered by river and have navigable river approach. The length of surface road in non-forested region
of the sample is 4.03 km. per sq. km. and in forested region is 1.40 km. per sq. km. Block wise, the
highest surface road length is in Magrahat-I Block (5.00 km.per sq.km) and lowest in Basanti block
(0.80 km. per sq. km). Basanti block is situated on the boundary of the reserve forest. There was no
road communication connecting Basanti blocks to the mainland till 2011. River channels were the only
mode of transport. In 2011 a bridge was built connecting the block to the mainland. Other modes of
transport in this island are cycle-van and motor-van. Many habitations do not have any mode of
transport at all.
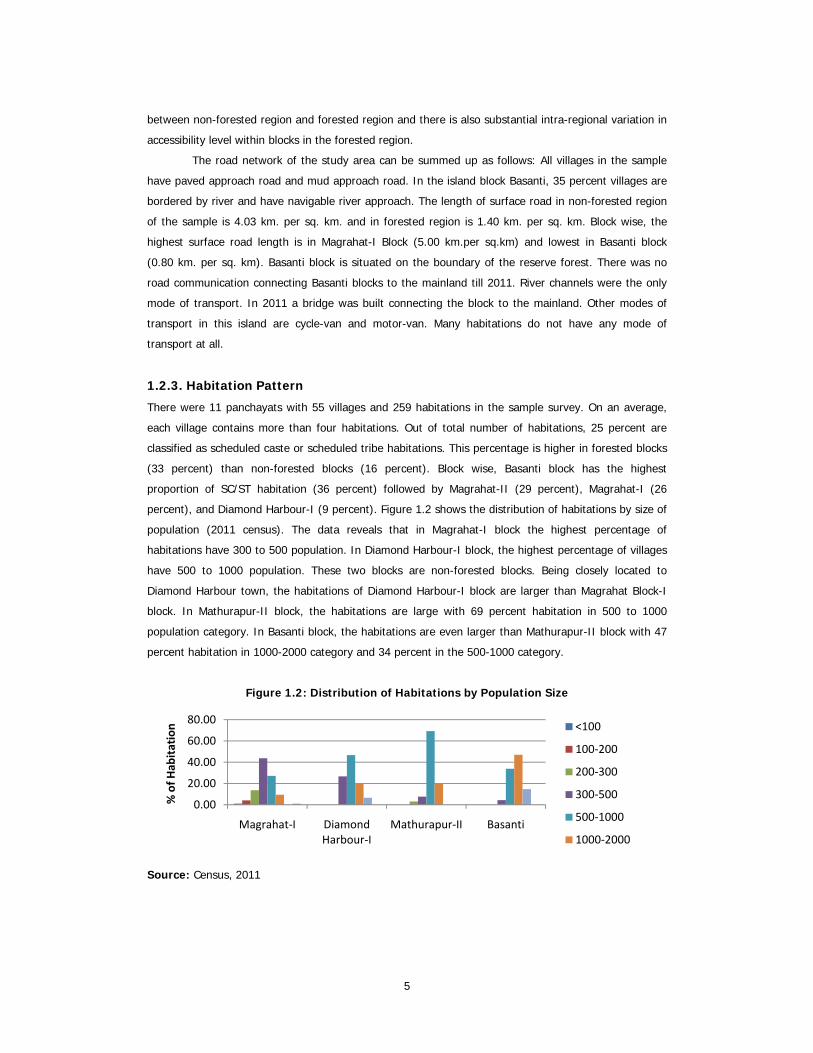
1.2.3. Habitation Pattern
There were 11 panchayats with 55 villages and 259 habitations in the sample survey. On an average,
each village contains more than four habitations. Out of total number of habitations, 25 percent are
classified as scheduled caste or scheduled tribe habitations. This percentage is higher in forested blocks
(33 percent) than non-forested blocks (16 percent). Block wise, Basanti block has the highest
proportion of SC/ST habitation (36 percent) followed by Magrahat-II (29 percent), Magrahat-I (26
percent), and Diamond Harbour-I (9 percent). Figure 1.2 shows the distribution of habitations by size of
population (2011 census). The data reveals that in Magrahat-I block the highest percentage of
habitations have 300 to 500 population. In Diamond Harbour-I block, the highest percentage of villages
have 500 to 1000 population. These two blocks are non-forested blocks. Being closely located to
Diamond Harbour town, the habitations of Diamond Harbour-I block are larger than Magrahat Block-I
block. In Mathurapur-II block, the habitations are large with 69 percent habitation in 500 to 1000
population category. In Basanti block, the habitations are even larger than Mathurapur-II block with 47
percent habitation in 1000-2000 category and 34 percent in the 500-1000 category.
Figure 1.2: Distribution of Habitations by Population Size
Source: Census, 2011
0.00
20.00
40.00
60.00
80.00
Magrahat‐I Diamond Harbour‐I
Mathurapur‐II Basanti
% of H
abitation <100
100‐200
200‐300
300‐500
500‐1000
1000‐2000
6
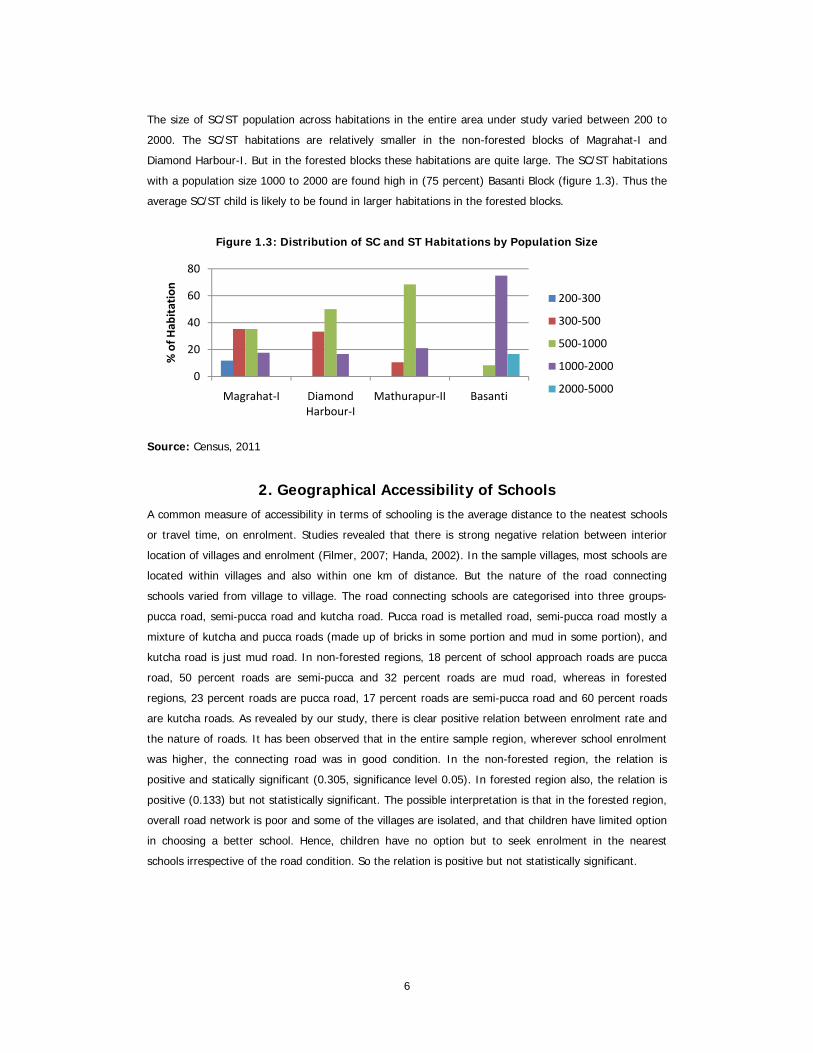
The size of SC/ST population across habitations in the entire area under study varied between 200 to
2000. The SC/ST habitations are relatively smaller in the non-forested blocks of Magrahat-I and
Diamond Harbour-I. But in the forested blocks these habitations are quite large. The SC/ST habitations
with a population size 1000 to 2000 are found high in (75 percent) Basanti Block (figure 1.3). Thus the
average SC/ST child is likely to be found in larger habitations in the forested blocks.
Figure 1.3: Distribution of SC and ST Habitations by Population Size
Source: Census, 2011
2. Geographical Accessibility of Schools A common measure of accessibility in terms of schooling is the average distance to the neatest schools
or travel time, on enrolment. Studies revealed that there is strong negative relation between interior
location of villages and enrolment (Filmer, 2007; Handa, 2002). In the sample villages, most schools are
located within villages and also within one km of distance. But the nature of the road connecting
schools varied from village to village. The road connecting schools are categorised into three groups-
pucca road, semi-pucca road and kutcha road. Pucca road is metalled road, semi-pucca road mostly a
mixture of kutcha and pucca roads (made up of bricks in some portion and mud in some portion), and
kutcha road is just mud road. In non-forested regions, 18 percent of school approach roads are pucca
road, 50 percent roads are semi-pucca and 32 percent roads are mud road, whereas in forested
regions, 23 percent roads are pucca road, 17 percent roads are semi-pucca road and 60 percent roads
are kutcha roads. As revealed by our study, there is clear positive relation between enrolment rate and
the nature of roads. It has been observed that in the entire sample region, wherever school enrolment
was higher, the connecting road was in good condition. In the non-forested region, the relation is
positive and statically significant (0.305, significance level 0.05). In forested region also, the relation is
positive (0.133) but not statistically significant. The possible interpretation is that in the forested region,
overall road network is poor and some of the villages are isolated, and that children have limited option
in choosing a better school. Hence, children have no option but to seek enrolment in the nearest
schools irrespective of the road condition. So the relation is positive but not statistically significant.
0
20
40
60
80
Magrahat‐I Diamond Harbour‐I
Mathurapur‐II Basanti
% of H
abitation
200‐300
300‐500
500‐1000
1000‐2000
2000‐5000

7
2.1. Density of Schools
The state of primary school density gives some idea regarding the efficient coverage in terms of
distance. The density of schools has been calculated in terms of number of schools per sq. km. Non-
forested regions have higher density of schools than the Sundarban forested region. Table 2.1 shows
the density of school in different blocks. According to population projection (2010), Basanti block would
have the highest number of children of the age group 5 to 9 years (primary school age-group children),
followed by Magrahat-I, Mathurapur-II and Diamond Harbour-I block in 2013-2014. But Basanti block
has the lowest density of schools. Similarly, Diamond Harbour-I block has lowest number of school age
children but highest density of schools.
Table 2.1: Density of Schools
Block Projected Population (5yrs-9yrs) 2010
2013-14
Primary school Density of Schools
Diamond Harbour I 12309 103 2.54
Magrahat I 22008 144 1.5
Mathurapur II 17134 183 1.49
Basanti 29734 274 0.99 Source: DISE Data and Department of School Education, Govt of West Bengal
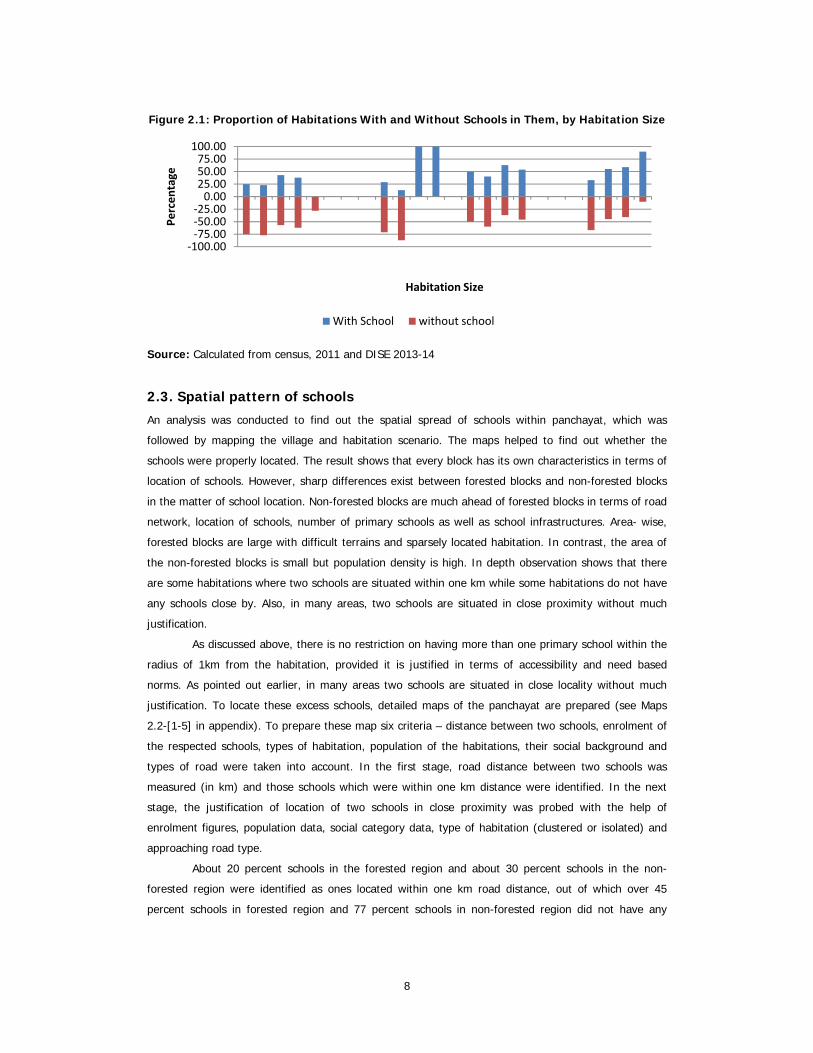
2.2. Habitation Patternand Schools
The next important thing is to find out the habitation-wise schooling scenario, i.e. how many habitations
had school within the prescribed norm. Figure 2.1 summarizes the availability of a school within
habitations, according to which the number of school-less habitations with 500 and above population is
quite high. Forested blocks had a higher percentage of school- less (24 percent) habitations than non-
forested blocks (10 percent). Block-wise, Basanti had the highest share of such schools, followed by
Mathurapur-II, Magrahat-I and Diamond Harbour-I. Among the SC/ST habitations, 23 percent in
Basanti, 24.0 percent in Mathurapur-II, 25 percent in Diamond Harbour-I and 33 percent in Magrahat-I
did not have schools within habitations with 500 and above population. The data also reveals that
SC/ST habitations in the non-forested region had less number of primary schools compared to other
areas. As SC/ST children are likely reside in larger habitations in the forested region, they are likely to
get more opportunity for schooling than their non-forested counterparts. This shows that Government
had prioritised the SC/ST habitations of the forested region over the non-forested regions in the matter
of establishing primary schools.
8
Figure 2.1: Proportion of Habitations With and Without Schools in Them, by Habitation Size
Source: Calculated from census, 2011 and DISE 2013-14
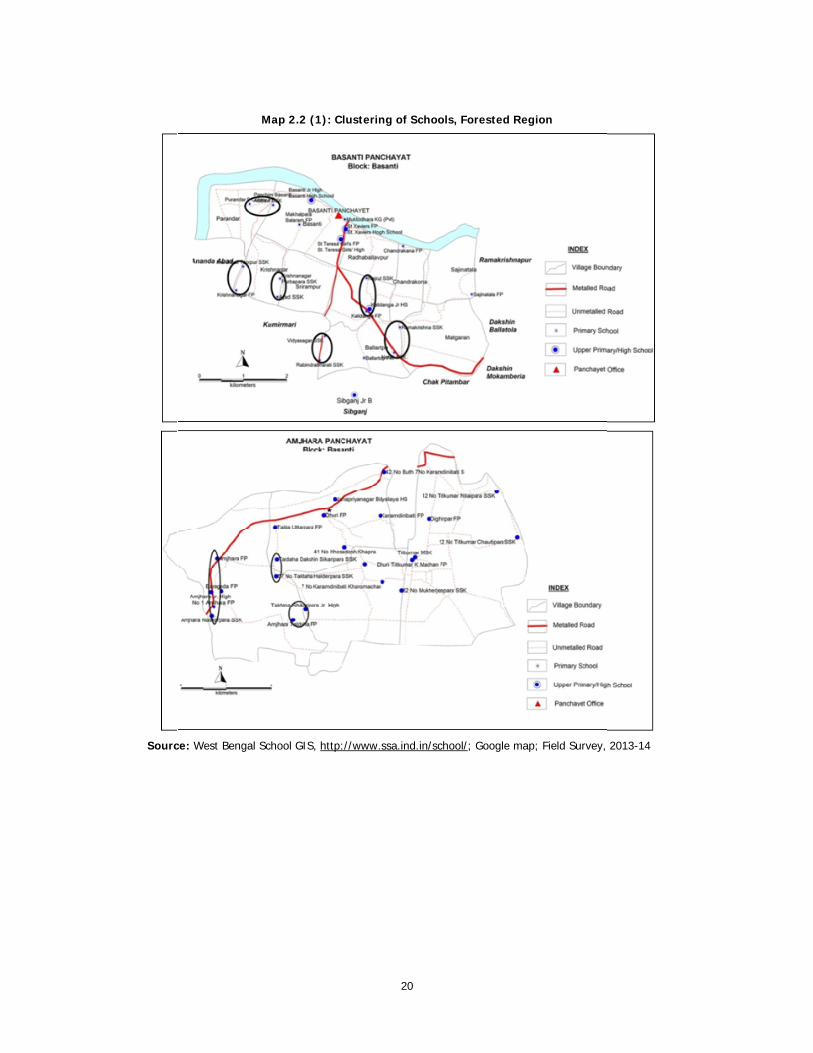
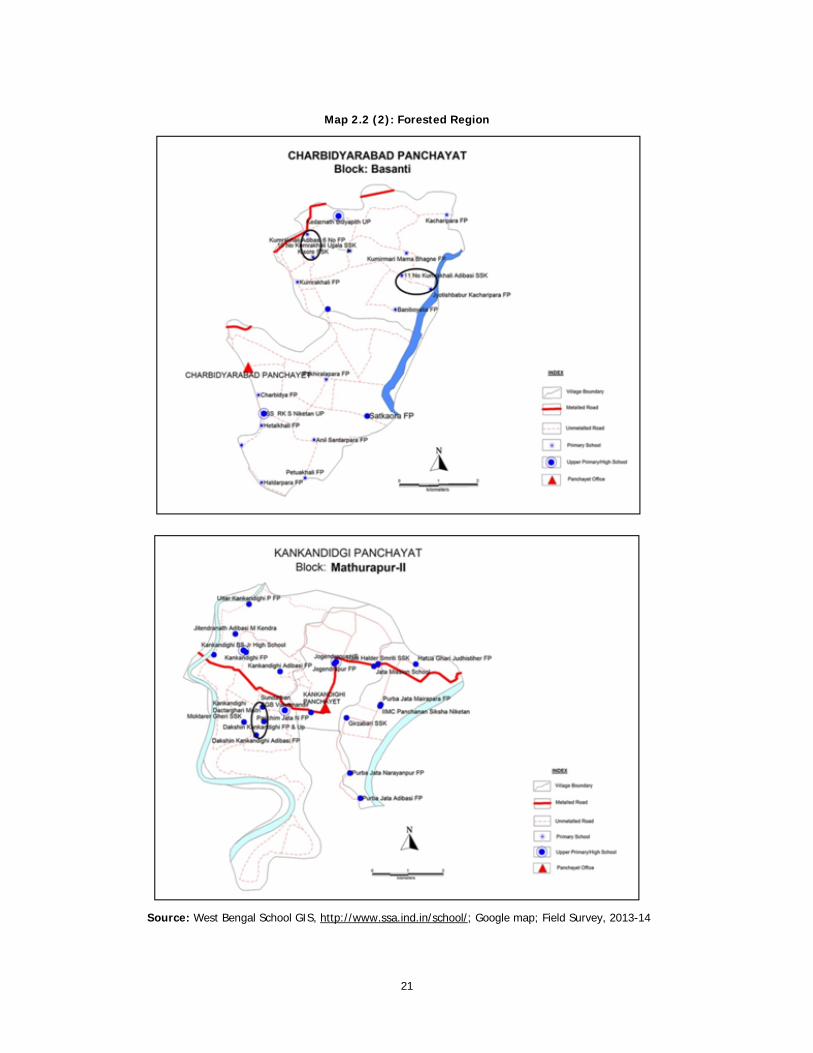
2.3. Spatial pattern of schools
An analysis was conducted to find out the spatial spread of schools within panchayat, which was
followed by mapping the village and habitation scenario. The maps helped to find out whether the
schools were properly located. The result shows that every block has its own characteristics in terms of
location of schools. However, sharp differences exist between forested blocks and non-forested blocks
in the matter of school location. Non-forested blocks are much ahead of forested blocks in terms of road
network, location of schools, number of primary schools as well as school infrastructures. Area- wise,
forested blocks are large with difficult terrains and sparsely located habitation. In contrast, the area of
the non-forested blocks is small but population density is high. In depth observation shows that there
are some habitations where two schools are situated within one km while some habitations do not have
any schools close by. Also, in many areas, two schools are situated in close proximity without much
justification.
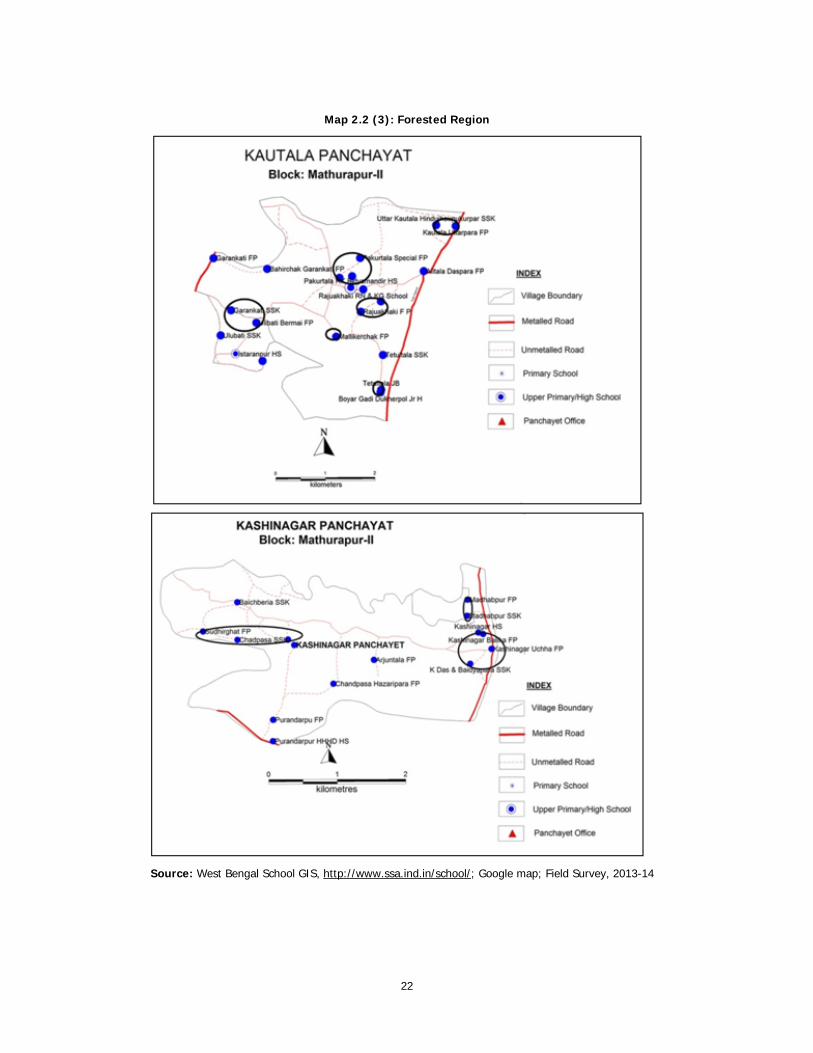
As discussed above, there is no restriction on having more than one primary school within the
radius of 1km from the habitation, provided it is justified in terms of accessibility and need based
norms. As pointed out earlier, in many areas two schools are situated in close locality without much
justification. To locate these excess schools, detailed maps of the panchayat are prepared (see Maps
2.2-[1-5] in appendix). To prepare these map six criteria – distance between two schools, enrolment of
the respected schools, types of habitation, population of the habitations, their social background and
types of road were taken into account. In the first stage, road distance between two schools was
measured (in km) and those schools which were within one km distance were identified. In the next
stage, the justification of location of two schools in close proximity was probed with the help of
enrolment figures, population data, social category data, type of habitation (clustered or isolated) and
approaching road type.
About 20 percent schools in the forested region and about 30 percent schools in the non-
forested region were identified as ones located within one km road distance, out of which over 45
percent schools in forested region and 77 percent schools in non-forested region did not have any
‐100.00‐75.00‐50.00‐25.000.0025.0050.0075.00
100.00
Percen
tage
Habitation Size
With School without school
9
justification for their location. These schools were either closely located with very few students or the
population of the habitation was low or were not remotely located to warrant a separate school.
Establishment of a new school depends on a number of hierarchical decisions. Most of the
time, panchayat applies for a school as per requirement of the village and the higher authorities
sanction schools accordingly. It has been noticed that the two types of government run schools —
regular primary schools and Sishu Siksha Kendras — were located closely in many villages. SSKs are run
by the Panchayat & Rural Development Authority and regular Primary schools are run by Department of
School Education. However, both types of schools are under the West Bengal Board of Primary
Education. These two organisations are parallel entities, and the existing location of schools suggests
that they did not have any coordination in opening new schools.
The spatial distribution of schools also shows certain uncovered areas where a school ought to
be provided, particularly in the forested region. This reveals that the site selection for the schools has
been improper. The improper site selection results in convenience for some children and problems for
others. If these schools are relocated to the deprived areas or two schools are merged and provided
better infrastructure, all the students would get good schooling opportunities. The detailed analysis of
infrastructure of these schools will be discussed later.
These wrong placements of schools were shared with the elected members of the all
panchayat (Panchayat Pradhan) while interviewing them. About 67 percent of them did not accept the
excess advantage of some areas, as it is in their interest to hide the relative deprivation of some
panchayats over the others. The rest of the members who accepted the situation put the blame on
former elected members. It is therefore obvious that present method of selection of sites for school
lacks proper planning. The decision of panchayat is often influenced by political considerations and
locations of a school sometimes become a clear political issue.
3. Infrastructure of Schools in the Study Area There might be adequate number of schools in these habitations, but it does not guarantee that
minimum infrastructure facilities required for smooth classroom transaction are available. The main task
of the school is to provide education which involves a series of programmes and activities. The
successful conduct of these programmes and activities depends mainly upon the availability of proper
infrastructure in the school. Infrastructure and facilities provide a comfortable learning environment,
accelerate the learning procedure and increases the students’ interest (Pritchett and Pande, 2006;
Iyengar, 2004).Where the quality of infrastructure is good, enrolment and completion rates would also
be good; where the condition of school facilities is good, learning outcomes also would be good.
The term 'Physical Infrastructure' stands for the physical facilities of the school. It refers to
buildings, grounds, furniture and apparatus, along with equipment essential for imparting education.
Different government interventions like the District Primary Education Program (DPEP) and Sarva
Shiksha Abhiyan (SSA) have tried to provide better infrastructure in the schools, particularly in the last
two or three decades. Some of the parameters of improvement are discussed here.
10
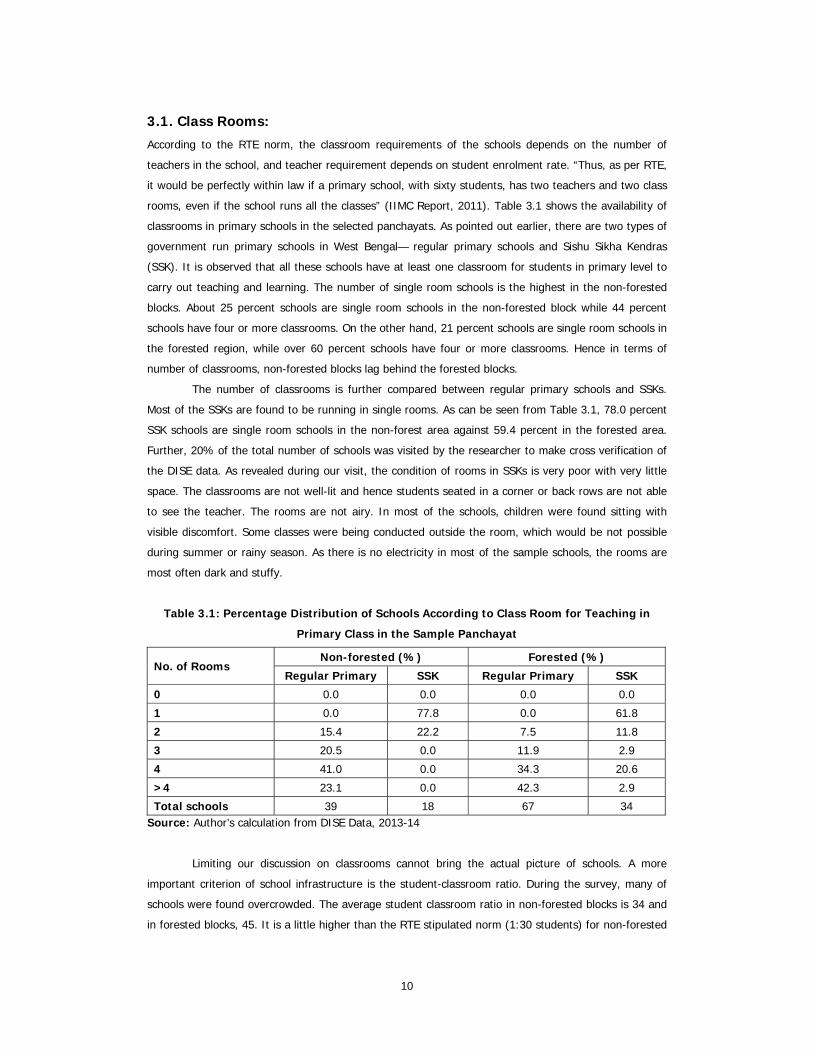
3.1. Class Rooms:
According to the RTE norm, the classroom requirements of the schools depends on the number of
teachers in the school, and teacher requirement depends on student enrolment rate. “Thus, as per RTE,
it would be perfectly within law if a primary school, with sixty students, has two teachers and two class
rooms, even if the school runs all the classes” (IIMC Report, 2011). Table 3.1 shows the availability of
classrooms in primary schools in the selected panchayats. As pointed out earlier, there are two types of
government run primary schools in West Bengal— regular primary schools and Sishu Sikha Kendras
(SSK). It is observed that all these schools have at least one classroom for students in primary level to
carry out teaching and learning. The number of single room schools is the highest in the non-forested
blocks. About 25 percent schools are single room schools in the non-forested block while 44 percent
schools have four or more classrooms. On the other hand, 21 percent schools are single room schools in
the forested region, while over 60 percent schools have four or more classrooms. Hence in terms of
number of classrooms, non-forested blocks lag behind the forested blocks.
The number of classrooms is further compared between regular primary schools and SSKs.
Most of the SSKs are found to be running in single rooms. As can be seen from Table 3.1, 78.0 percent
SSK schools are single room schools in the non-forest area against 59.4 percent in the forested area.
Further, 20% of the total number of schools was visited by the researcher to make cross verification of
the DISE data. As revealed during our visit, the condition of rooms in SSKs is very poor with very little
space. The classrooms are not well-lit and hence students seated in a corner or back rows are not able
to see the teacher. The rooms are not airy. In most of the schools, children were found sitting with
visible discomfort. Some classes were being conducted outside the room, which would be not possible
during summer or rainy season. As there is no electricity in most of the sample schools, the rooms are
most often dark and stuffy.
Table 3.1: Percentage Distribution of Schools According to Class Room for Teaching in
Primary Class in the Sample Panchayat
No. of Rooms Non-forested (%) Forested (%)
Regular Primary SSK Regular Primary SSK
0 0.0 0.0 0.0 0.0
1 0.0 77.8 0.0 61.8
2 15.4 22.2 7.5 11.8
3 20.5 0.0 11.9 2.9
4 41.0 0.0 34.3 20.6
>4 23.1 0.0 42.3 2.9
Total schools 39 18 67 34 Source: Author’s calculation from DISE Data, 2013-14
Limiting our discussion on classrooms cannot bring the actual picture of schools. A more
important criterion of school infrastructure is the student-classroom ratio. During the survey, many of
schools were found overcrowded. The average student classroom ratio in non-forested blocks is 34 and
in forested blocks, 45. It is a little higher than the RTE stipulated norm (1:30 students) for non-forested
11
areas, and much higher for forested areas. A careful look at the variations even across schools within
each panchayat indicates the gravity of the problem. The variation in the number of classroom available
across blocks is wide; in Diamond Harbour-I, it varied from 1:9 to 1:46; in Magrahat-I from 1:6 to 1:81;
in Basanti from 1:12 to 1:102; and in Mathurapur-II from 1:12 to 1:78. Further classrooms are
categorised into three on the basis of student strength: those with less than 30 students, those with 30
to 60 and those with over 60 students. It has been observed that 63 percent of the schools in the
sample panchayat of non-forested area and 57 percent of forested area have less than 30 students per
classroom. Significantly, 15 percent schools in the forested area have 60 students per class.
3.2. Ancillary Facilities
Even when a school has the required number of instructional rooms, the absence of the minimum
ancillary facilities there can make teaching meaningless. Research evidences show that availability of
these facilities in schools improves enrolment especially of girls and also helps in retaining children in
the system.
Ensuring supply of drinking water to the children is an important criterion because school is the
place where students spend a lot of time, and non-availability of drinking water can drive them away.
This study finds that drinking water facility is available in most schools of the sample panchayats. As
revealed by the study, all the sample schools have drinking water facilities in Diamond Harbour-I,
Magrahat-I and Mathurapur-II blocks, while in Basanti block, all primary schools except 5% of SSKs
have drinking water facilities.
The next important criterion is toilet facilities in the schools. Having toilets for boys and girl is
one of the minimum infrastructure facilities required as per the RTE norm. In thenon-forested region,
about 97 percent primary schools have separate toilets for boys and girls. Likewise, in the forested
region, 92 percent regular primary schools have separate toilet for girls and 94 percent schools have
separate toilet for boys. The situation of SSKs in this respect is very poor in the entire region. Not even
30 percent of the SSKs have separate toilet for girls in both forested and non-forested regions. Similarly,
less than half of the SSKs have separate toilet for boys. Field verification of the sample schools has
revealed that in many cases there was no water in the toilet, toilets were smelly and unhygienic, and
often toilets were kept under lock and key and only used by teachers (For example, in Bolsiddhi village
of Diamond Harbour-I block during household survey parents complained that the teachers of Haskhali
SSK used to lock the toilet and students were not allowed to use it).
The other minimum required school infrastructure facilities as per the RTE Act include an
office-cum-store-cum Head Master room, boundary wall or green fencing, kitchen for cooking mid-day
meal, library, playground etc. It implies that all schools should be composite schools, i.e., they should
have put in place all these facilities within three years of the coming into force of the RTE Act. The
provision of the above infrastructural facilities is far from satisfactory in the entire region, especially in
the Sundarban forest region. The condition of the SSKs in this respect is extremely poor. One-fourth of
the regular primary schools have an office-cum-store-cum Head Master room in the non-forested region
while only one-third of the regular primary schools have an office-cum-store-cum Head Master room in
the forested region. While just 5 percent of SSKs in non-forested region have these facilities, none of

12
the SSKs in forested region has these facilities. Only one third of the regular primary schools in both
forested and non-forested regions have boundary wall or green fencing; and 5 percent non-forested
and 9 percent forested SSKs have boundary wall.
Another required school infrastructure is library facility. However, there is no such norm for
availability of books or newspapers in the library. If a school has so much as few books in one rack of a
cupboard, the school would be deemed as having library facilities. With the above criteria, 97 percent
regular primary schools in non-forested blocks and 72 percent regular primary schools in forested blocks
can be considered as having library facility. However, none of the SSKs have library facilities in the
study area even in terms of the above criterion. Further, none of the schools have computer facility and
only a few primary schools have electricity supply (44 percent in non-forest region and 15 percent in
forested region).
Studies have shown that school level games play an important role in child’s personality
development. But data shows that just 47 percent regular primary schools in non-forested area and 34
percent regular primary schools in forested area have playground. The condition of SSKs is very
unsatisfactory as just one out of ten SSKs has playground in both regions.
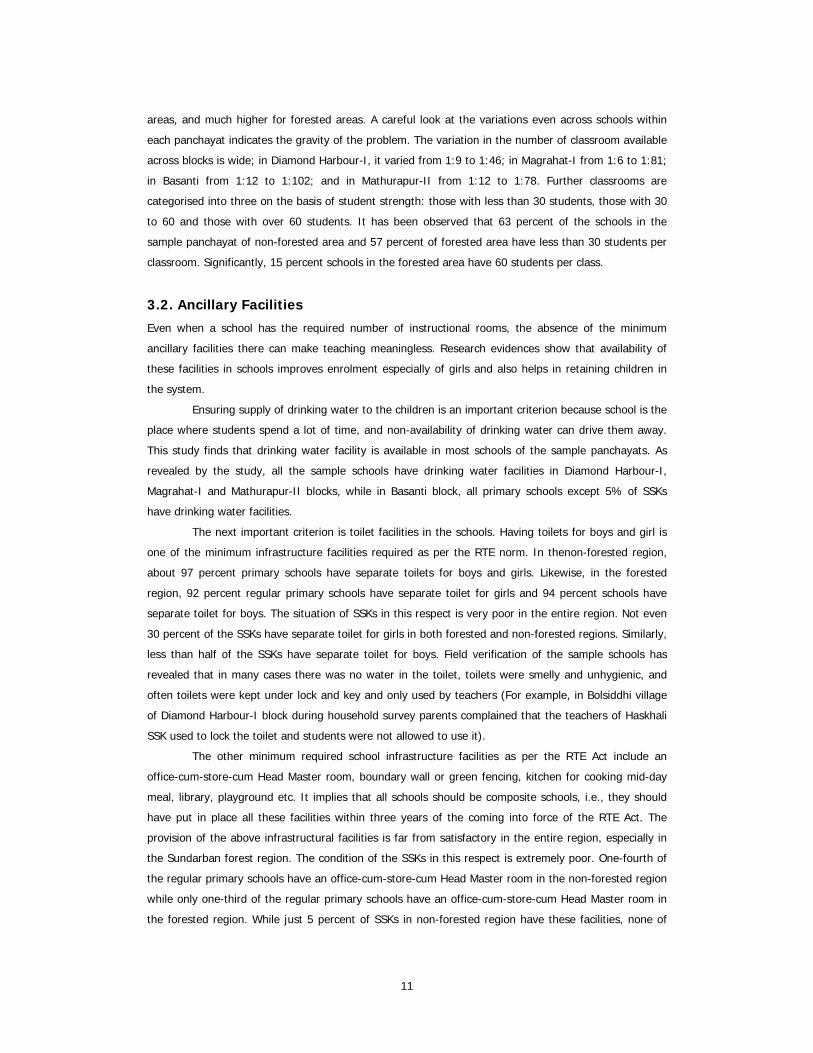
Table 3.2 provides important comparative statistics of school infrastructure in the study area.
Except drinking water facility, the condition of all other infrastructure facilities in West Bengal is very
poor compared to the other states of India. There is a huge gap between the topper states and West
Bengal in terms of basic infrastructure in schools, and the sample blocks are way behind the other
regions of West Bengal. Some of the states or Union Territories like Chandigarh, Dadra and Nagar
Haveli, Daman and Diu, Delhi, Lakshadweep, Puducherry, TamilNadu have almost 100 per cent
infrastructure like drinking water, toilet, boundary wall, computer, electricity playground etc. Further,
the state level achievement levels of West Bengal is way behind national levels, except in matters like
having drinking water facility in the entire schools and having separate toilets for girls in the regular
primary school. As can be seen from Table 3.3, infrastructure in primary schools in these blocks are
much below acceptable levels in spheres like (1) boys toilet (except Magrahat block) (2) Electricity (3)
Computer (4) Playground and (5) Boundary Wall. Nationally, availability of electricity and computer
facility in primary schools has always been a matter of great concern, and the performance of not only
of all the selected blocks but also the entire West Bengal on these counts has been below acceptable
levels. None of the schools in the forested blocks has computer facility and only 5 percent schools have
electricity. The conditions of SSKs are pathetic; these schools are running with only one or two
classrooms and the only available infrastructure is drinking water.
13
Table: 3.2: School Infrastructure- 2013-14
Parameter Diamond
Harbour-1 Magrahat I Basanti Mathurapur II
West Bengal
India
Best State/UT
Value
RP SSK RP SSK RP SSK RP SSK
% of schools having Drinking Water Facility
100 100 100 100 100 95.2 100 100 98.4 94.1
Chandigarh D & N Haveli Daman & Diu Delhi Lakshadweep Puducherry TamilNadu
100
% of schools having Common Toilet
46 57 56 18.2 60 52.3 46.9 38.5 93.7 92.9
Chandigarh Daman & Diu Delhi Lakshadweep Puducherry Sikkim
100
% of schools having Girls’ Toilet
100 42.9 96 18.2 94.3 47.6 90.6 0.0 68.8 80.9
Daman & Diu Delhi Lakshadweep Puducherry
100
% of schools having Boys’ Toilet
84.6 42.9 100 9.1 97.1 71.4 90.6 38.5 93.7 92.9
Chandigarh Daman & Diu Delhi Lakshadweep Puducherry Sikkim Tamil Nadu
100
% of schools having Boundary Wall
30.8 14.3 32 0.0 42.9 0.0 37.5 23.1 35.6 53.8 Chandigarh 100
% of schools having Computer
0.0 0.0 0.0 0.0 0.0 0.0 0.0 0.0 3.9 9.3 Lakshadweep 100
%of schools having Electricity
38.5 0.0 48.0 0.0 14.3 0.0 15.6 0.0 34.9 41.9
Chandigarh Daman & Diu Delhi Lakshadweep Puducherry
100
% of schools having Library
92.3 0.0 100 0.0 57.1 0.0 87.5 0.0 56.51 72.4 Chandigarh 100
% of schools having separate room for Head Master
30.8 14.3 20 0.0 45.7 0.0 21.9 0.0 - - - -
% of schools having playground
53.8 28.6 44 0.0 28.6 4.8 40.6 23.1 30.7 51.5 Punjab 97.3
% of schools having Kitchen Shed
100 42.8 88 18.2 82.9 9.5 90.6 53.8 81.44 75.77 Lakshadweep 100
RP- Regular Primary; Source: DISE Flash Statistics 2013-14 and School Report Card, 2013-14
3.3. Incentive Schemes
Like most other Indian States, West Bengal also has some incentive schemes to expand primary
education, which include mid-day meal scheme, distribution of text-books, and free supply of school
uniforms. The mid-day-meal scheme was introduced under National Programme of Nutritional Support
to Primary Education, and it was launched as a centrally-sponsored scheme in 1995 to attain
14
universalisation of primary education. Its objectives were to increase enrolment, improve attendance
and student-retention. Likewise, text books are being distributed free of cost to all the students of
recognized primary schools up to Class IV. Besides, free uniforms are provided to all girls, scheduled
caste boys, scheduled tribe boys and ‘below poverty line’ boys.
It is clear that the entire schools in the sample, including SSKs, provide mid-day meal to the
students regularly and positively. All regular primary schools and SSKs provide MDM to the students, but
many of the schools particularly SSKs don’t have a kitchen shed for preparing MDM. Almost three fourth
of the SSKs in non-forested region and 66 percent of SSKs in forested region don’t have a kitchen shed
for cooking MDM. While eliciting teacher’s views, almost all the teachers complained about this lacunae.
During the dry season, meals are prepared outside school buildings, but in rainy season this becomes
unfeasible, and the authorities are forced to use classrooms for cooking. As has been stated earlier,
most of the SSKs are single room schools, and during rainy season that room is used for cooking also.
Understandably, diversion of class-room hampers the teaching-learning process.
3.4. Correlation between Educational Attainment and Provision for
Physical Infrastructure
In order to delineate the association between levels of educational attainment and physical
infrastructure provisions in primary schools, a more disaggregate analysis have been done for each of
the blocks. In this exercise, the level of educational attainment as reflected in the enrolment in every
school is correlated with infrastructure available in those schools for the year 2013-14. For this purpose,
each of the physical infrastructure variable is ranked separately using SPSS ‘rank cases’ and the higher
value so derived is assigned the top rank. After ranking each variable for all schools individually, school-
wise infrastructure is added to get the final rank of each school. The infrastructure taken are number of
class-rooms in the school, common toilet, boys’ toilet, girls’ toilet, availability of computer, electricity,
drinking water facilities, library, number of books in library, number of black boards per school,
boundary wall, playground, kitchen shed for MDM and store cum HM room. The rank indicates the
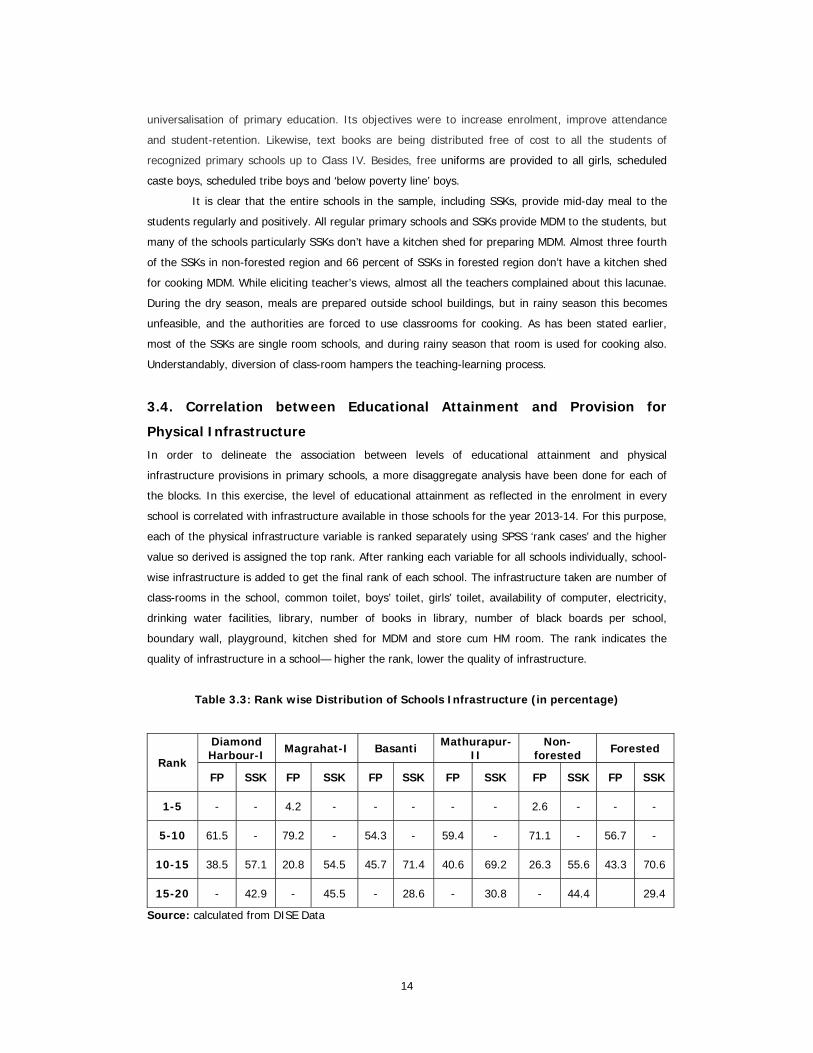
quality of infrastructure in a school— higher the rank, lower the quality of infrastructure.
Table 3.3: Rank wise Distribution of Schools Infrastructure (in percentage)
Rank
Diamond Harbour-I Magrahat-I Basanti Mathurapur-
II Non-
forested Forested
FP SSK FP SSK FP SSK FP SSK FP SSK FP SSK
1-5 - - 4.2 - - - - - 2.6 - - -
5-10 61.5 - 79.2 - 54.3 - 59.4 - 71.1 - 56.7 -
10-15 38.5 57.1 20.8 54.5 45.7 71.4 40.6 69.2 26.3 55.6 43.3 70.6
15-20 - 42.9 - 45.5 - 28.6 - 30.8 - 44.4 29.4
Source: calculated from DISE Data

15
As can be seen from Table 3.3, on the whole, the non-forested region has better infrastructure
than the forested region. In the non-forested region, schools that ranked in the 5-10 categories were
the highest in number (71.1 per cent). In the non-forested region, Magrahat-I block scored better than
Diamond Harbour-I block. The SSKs are predictably lagging behind the regular primary schools. In fact,
the SSKs of the non-forested region (43.3 per cent in 10-15 rank category) lag behind the SSKs of the
forested region (70.6 per cent in 10-15 rank category). The regular primary schools of the forested
region lag behind the non-forested region, with 56.7 percent schools in the 5-10 rank category and 43.3
percent schools in the 10-15 rank categories. Similarly, SSKs of the non-forest region lag behind even
the regular primary schools in the forested region. But the SSKs of forested region have better
infrastructure than those in the non-forested region.
Any discussion about infrastructure makes sense only when it includes a comparison of student
attainment in schools. To find out the gap between infrastructure and student related factors,
Spearman’s Rank correlation between infrastructure and enrolment has been performed. The ‘r’ values
of correlation co-efficient for the bivariate association between the physical infrastructure supply in the
primary grade and the enrolment are shown in Figure 6. It can be deduced from Figure 6 that the rank
of infrastructure and enrolment rate in the entire sample blocks are inversely related, i.e. higher the
rank of infrastructure, lower is the rate of enrolment in schools in the sample blocks. Hence, there is a
negative relation between the schools with lower quality of infrastructure and enrolment. In all the
blocks, students prefer schools where infrastructure quality is good.
Figure 3.1: Relation between Infrastructure and Enrolment
R² = 0.2950
200400600
0.00 5.00 10.00 15.00 20.00
Enrolm
ent
Infrastructure (Rank)
Basanti Block
R² = 0.2550
100
200
0.00 5.00 10.00 15.00 20.00
Enrolm
ent
Infrastructure (Rank)
Mathurapur‐II Block

16
Source: Calculated from DISE Data
This association is also true for both regular primary schools and SSKs. A strong negative link
with statistical significance is observable between position of SSKs of forested area (Basanti and
Mathurapur-II block) and regular primary schools of non-forested area (Diamond Harbour-I and
Magrahat-I block) (Table 3.4). With the exception of few SSKs, overall enrolment is higher in the
regular primary schools in the entire region. Hence, with higher enrolment in regular primary schools,
coefficient values become negative but not statistically significant. That means students prefer regular
primary school even if the infrastructure is not sufficient. Similarly, in the forested region due to
inaccessible location of their habitations, some students are likely to take admission in a nearby school.
Hence, coefficient values are not statistically significant.
Table 3.4: Correlation between Infrastructure and Enrolment
Block ‘r’ values
Regular Primary SSK
Basanti -.731 -.653**
Mathurapur-II -.728 -.869**
Diamond Harbour-I -.648* -.393
Magrahat-I -.699** -.089 Note: ** - significant at 0.01 level; * - significant at 0.05 level; Source: Calculated from DISE Data
4. Conclusions
The above analysis offers critical insights for understanding and locating the inequalities in primary
education in certain rural areas of West Bengal. The distribution of two basic resources of primary
R² = 0.4190
100
200
0.00 5.00 10.00 15.00 20.00
Enrolm
ent
Infrastructure (Rank)
Diamond Harbour‐I Block
R² = 0.3400
200
400
0.00 5.00 10.00 15.00 20.00
Enrolm
ent
Infrastructure (Rank)
Magrahat‐I Block

17
education viz. location of schools and infrastructure, have been analysed above, and it has been
observed that these resources vary across administrative blocks, gram panchayats and schools within
the same panchayats. From the current situation of schooling at village level, the following issues are
observed.
Location of the school plays a vital role in taking education closer to children in rural areas.
However, even today there are many habitations in the study area without a single primary school,
despite having a large population. Habitations without schools are found in large numbers in the
forested panchayats. It has been observed that type of roads plays an important role in the schooling
system. Obviously schools with good road connectivity are preferred by the parents. The problem of
roads is very severe in the forested region. As this region is criss-crossed by water bodies and rivers,
during monsoon season, flood water of these water bodies inundate the kutcha roads and make the
roads unusable, particularly for young children. Hence, monsoon season witnesses a serious dip in
school attendance.
Another factor that the analysis has highlighted is the spatial distribution of schools. It is found
that often two schools are located within one km radius in spite of lower enrolment; often while one
school attracts huge enrolment, the other suffers from poor enrolment. If the students are distributed
equally between the two schools, the pressure on infrastructure as well as requirement of teachers will
automatically come down. Hence, the habitation level plans should be drawn up on the basis of micro-
planning and school mapping exercises.
There exist sharp disparities between regular primary schools and SSKs. It is very
disappointing that schools for underprivileged children are under equipped. In the last eight years, the
spread of primary education in the entire region has been promoted by setting up higher number of
SSKs than regular primary schools. These schools are now functioning in a single classroom and indeed
have drinking water and common toilet facilitates, though most of these are inadequate or unhygienic.
It is understandable that if a remote habitation or an underprivileged section has lower quality schools,
the educational outcome will also be poor, and given these handicaps, securing universal primary
education is not an immediate possibility.
It is evident from the study that parents prefer schools which have good infrastructural
facilities for children. This is true for the entire region. Enrolments in the schools are quite high in better
ranked schools. Further, enrolment in regular primary schools is much higher than in the SSKs.
However, in the remote areas, parents do not have the option of sending their children to better
schools.
Finally, there is a sharp disparity between non-forested region and forested region. Non-
forested regions being close to the Kolkata Metropolis and being geographically non-vulnerable, the
overall development here is much better than in the Sundarban forested region. Expectedly, school
enrolment in this region is high and overall infrastructure is also good. If the forested region is found
lagging behind in all developmental parameters including school enrolment, it is definitely due to its
unfavourable geographical position and inaccessibility as also for want of meaningful landforms. For the
same reason, this region is one of the underdeveloped regions of West Bengal.

18
References DISE School Report Card, 2006-07, 2009-10, 2011-12, NEUPA, New Delhi.
District Human Development Report (2009). South 24 Parganas. West Bengal: Development and
Planning Department, Government of West Bengal.
Duflo, E (2001). Schooling and Labour Market Consequences of School Construction in Indonesia:
Evidence from an Unusual Policy Experiment. The American Economic Review, 91 (4): 795-
813.
Filmer D (2007). If You Build It, Will They Come? School Availability and School Enrollment in 21 Poor
Countries. Journal of Development Studies, 43 (5).
Govinda, R and Bandyopadhyay M (2009). Educational Access In India Country. Policy Brief. NUEPA.
www.nuepa.org/Download/Publications/Create/policybriefindia.pdf
————— (2011). Overcoming Exclusion through School Quality. CREATE Pathways to Access Research
Monograph, No. 66. NUEPA.
Handa, S (2002). Raising Primary School Enrollment in Developing Countries: The Relative Importance
of Supply and Demand. Journal of Development Economics, 69 (1).
IIMC Interim Report (2011). Restructuring of School Education System in West Bengal.
http://www.wbsed.gov.in/wbsed/default.html
Iyengar, R (2004). Why Do Children Go To School? Economic and Political Weekly.
Jalan, J, Glinskaya, E (2003). Improving Primary School Education in India: An Impact Assessment of
DPEP-Phase I. ISI (New Delhi) and The World Bank.
Lewin, K M (2007). Improving Access, Equity and Transitions in Education: Creating a Research Agenda.
CREATE Pathways to Access Research Monograph No. 1. University of Sussex
Mukherjee M (2011). Do Better Roads Increase School Enrolment? Evidence from a Unique Road Policy
in India. Department of Economics, Syracuse University. www.isid.ac.in/~pu/conference/
dec_11_conf/Papers/MuktaMukherjee.pdf
Pritchett, L, Pande, V (2006). Making Primary Education Work for India’s Rural Poor: A Proposal for
Effective Decentralization. South Asia Series. Paper No. 95.
Shyam K C (2007). Society and Infrastructure: Geographical Accessibility and its Effects on School
Enrolment in Nepal, (PhD dissertation). College Park, Faculty of the Graduate School,
University of Maryland.
Sinha, S and Reddy, N (2010). School Dropouts or Push Outs? Overcoming Barriers for the Right to
Education. CREATE Pathways to Access Research Monograph, No 40. NUEPA.
UNICEF (2006). A Social Exclusion of Scheduled Caste Children from Primary Education in India.
UNICEF, India
Ward, M (2007). Rural Education. India Infrastructure Report.
19
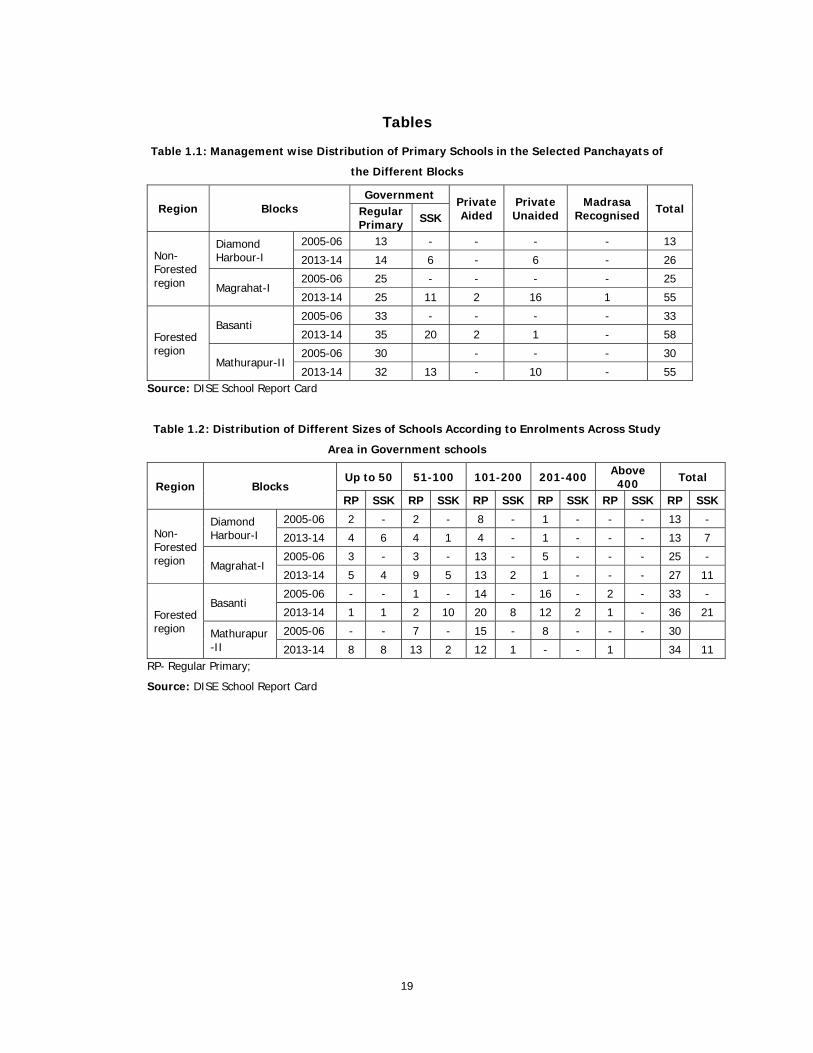
Tables Table 1.1: Management wise Distribution of Primary Schools in the Selected Panchayats of
the Different Blocks
Region Blocks Government Private
Aided Private Unaided
Madrasa Recognised Total Regular
Primary SSK
Non-Forested region
Diamond Harbour-I
2005-06 13 - - - - 13
2013-14 14 6 - 6 - 26
Magrahat-I 2005-06 25 - - - - 25
2013-14 25 11 2 16 1 55
Forested region
Basanti 2005-06 33 - - - - 33
2013-14 35 20 2 1 - 58
Mathurapur-II 2005-06 30 - - - 30
2013-14 32 13 - 10 - 55 Source: DISE School Report Card
Table 1.2: Distribution of Different Sizes of Schools According to Enrolments Across Study
Area in Government schools
Region Blocks Up to 50 51-100 101-200 201-400 Above
400 Total
RP SSK RP SSK RP SSK RP SSK RP SSK RP SSK
Non-Forested region
Diamond Harbour-I
2005-06 2 - 2 - 8 - 1 - - - 13 -
2013-14 4 6 4 1 4 - 1 - - - 13 7
Magrahat-I 2005-06 3 - 3 - 13 - 5 - - - 25 -
2013-14 5 4 9 5 13 2 1 - - - 27 11
Forested region
Basanti 2005-06 - - 1 - 14 - 16 - 2 - 33 -
2013-14 1 1 2 10 20 8 12 2 1 - 36 21
Mathurapur-II
2005-06 - - 7 - 15 - 8 - - - 30
2013-14 8 8 13 2 12 1 - - 1 34 11 RP- Regular Primary;
Source: DISE School Report Card
Sourc
ce: West Benga
Map 2.2 (1
al School GIS,
1): Clustering
http://www.ssa
20
of Schools, F
a.ind.in/school/
Forested Reg
/; Google map;
ion
; Field Survey,
2013-14
21
Map 2.2 (2): Forested Region
Source: West Bengal School GIS, http://www.ssa.ind.in/school/; Google map; Field Survey, 2013-14
22
Map 2.2 (3): Forested Region
Source: West Bengal School GIS, http://www.ssa.ind.in/school/; Google map; Field Survey, 2013-14

23
Map 2.2 (4): Non-forested Region
Source: West Bengal School GIS, http://www.ssa.ind.in/school/; Google map; Field Survey, 2013-14

24
Map 2.2 (5): Non-forested Region
Source: West Bengal School GIS, http://www.ssa.ind.in/school/; Google map; Field Survey, 2013-14

296 How Much Do We Know about theChinese SEZ Policy?Malini L Tantri
297 Emerging Trends in E-Waste Management- Status and IssuesA Case Study of Bangalore CityManasi S
298 The Child and the City: AutonomousMigrants in BangaloreSupriya RoyChowdhury
299 Crop Diversification and Growth of Maizein Karnataka: An AssessmentKomol Singha and Arpita Chakravorty
300 The Economic Impact of Non-communicable Disease in China and India:Estimates, Projections, and ComparisonsDavid E Bloom, Elizabeth T Cafiero, Mark EMcGovern, Klaus Prettner, Anderson Stanciole,Jonathan Weiss, Samuel Bakkia and LarryRosenberg
301 India’s SEZ Policy - Retrospective AnalysisMalini L Tantri
302 Rainwater Harvesting Initiative inBangalore City: Problems and ProspectsK S Umamani and S Manasi
303 Large Agglomerations and EconomicGrowth in Urban India: An Application ofPanel Data ModelSabyasachi Tripathi
304 Identifying Credit Constrained Farmers: AnAlternative ApproachManojit Bhattacharjee and Meenakshi Rajeev
305 Conflict and Education in Manipur: AComparative AnalysisKomol Singha
306 Determinants of Capital Structure ofIndian Corporate Sector: Evidence ofRegulatory ImpactKaushik Basu and Meenakshi Rajeev
307 Where All the Water Has Gone? AnAnalysis of Unreliable Water Supply inBangalore CityKrishna Raj
308 Urban Property Ownership Records inKarnataka: Computerized LandRegistration System for Urban PropertiesS Manasi, K C Smitha, R G Nadadur, N Sivanna, P
G Chengappa309 Historical Issues and Perspectives of
Land Resource Management in India: AReviewM S Umesh Babu and Sunil Nautiyal
310 E-Education: An Impact Study of SankyaProgramme on Computer EducationN Sivanna and Suchetha Srinath
311 Is India’s Public Debt Sustainable?Krishanu Pradhan
312 Biomedical Waste Management: Issuesand Concerns - A Ward Level Study ofBangalore CityS Manasi, K S Umamani and N Latha
Recent Working Papers313 Trade and Exclusion: Review of Probable
Impacts of Organised Retailing onMarginalised Communities in IndiaSobin George
314 Social Disparity in Child Morbidity andCurative Care: Investigating forDetermining Factors from Rural IndiaRajesh Raushan and R Mutharayappa
315 Is Access to Loan Adequate for FinancingCapital Expenditure? A Household LevelAnalysis on Some Selected States of IndiaManojit Bhattacharjee and Meenakshi Rajeev
316 Role of Fertility in Changing Age Structurein India: Evidence and ImplicationsC M Lakshmana
317 Healthcare Utilisation Behaviour in India:Socio-economic Disparities and the Effectof Health InsuranceAmit Kumar Sahoo
318 Integrated Child Development Services inIndia – A Sub-National ReviewJonathan Gangbar, Pavithra Rajan and K Gayithri
319 The Infrastructure-Output Nexus:Regional Experience from IndiaSumedha Bajar
320 Uncertainty, Risk and Risk Mitigation: FieldExperiences from Farm Sector inKarnatakaMeenakshi Rajeev and B P Vani
321 Socio-Economic Disparities in Health-Seeking Behaviour, Health Expenditureand Sources of Finance in Orissa: Evidencefrom NSSO 2004-05Amit Kumar Sahoo and S Madheswaran
322 Does Living Longer Mean Living Healthier?Exploring Disability-free Life Expectancyin IndiaM Benson Thomas, K S James and S Sulaja
323 Child and Maternal Health and Nutrition inSouth Asia - Lessons for IndiaPavithra Rajan, Jonathan Gangbar and K Gayithri
324 Reflecting on the Role of Institutions inthe Everyday Lives of Displaced Women:The Case of Ganga-Erosion in Malda, WestBengalPriyanka Dutta
325 Access of Bank Credit to VulnerableSections: A Case Study of KarnatakaVeerashekharappa
326 Neighbourhood Development and CasteDistribution in Rural IndiaRajesh Raushan and R Mutharayappa
327 Assessment of India’s Fiscal and ExternalSector Vulnerability: A Balance SheetApproachKrishanu Pradhan
328 Public Private Partnership’s GrowthEmpirics in India’s InfrastructureDevelopmentNagesha G and K Gayithri
329 Identifying the High Linked Sectors forIndia: An Application of Import-AdjustedDomestic Input-Output MatrixTulika Bhattacharya and Meenakshi Rajeev

330 Out-Of-Pocket (OOP) Financial RiskProtection: The Role of Health InsuranceAmit Kumar Sahoo and S Madheswaran
331 Promises and Paradoxes of SEZs Expansionin IndiaMalini L Tantri
332 Fiscal Sustainability of National FoodSecurity Act, 2013 in IndiaKrishanu Pradhan
333 Intergrated Child Development Servicesin KarnatakaPavithra Rajan, Jonathan Gangbar and K Gayithri
334 Performance Based Budgeting:Subnational Initiatives in India and ChinaK Gayithri
335 Ricardian Approach to Fiscal Sustainabilityin IndiaKrishanu Pradhan
336 Performance Analysis of National HighwayPublic-Private Partnerships (PPPs) in IndiaNagesha G and K Gayithri
337 The Impact of Infrastructure Provisioningon Inequality: Evidence from IndiaSumedha Bajar and Meenakshi Rajeev
338 Assessing Export Competitiveness atCommodity Level: Indian Textile Industryas a Case StudyTarun Arora
339 Participation of Scheduled CasteHouseholds in MGNREGS: Evidence fromKarnatakaR Manjula and D Rajasekhar
340 Relationship Between Services Trade,Economic Growth and ExternalStabilisation in India: An EmpiricalInvestigationMini Thomas P
341 Locating the Historical Past of theWomen Tea Workers of North BengalPriyanka Dutta
342 Korean Media Consumption in Manipur: ACatalyst of Acculturation to KoreanCultureMarchang Reimeingam
343 Socio-Economic Determinants of EducatedUnemployment in IndiaIndrajit Bairagya
344 Tax Contribution of Service Sector: AnEmpirical Study of Service Taxation inIndiaMini Thomas P
345 Effect of Rural Infrastructure onAgricultural Development: District-LevelAnalysis in KarnatakaSoumya Manjunath and Elumalai Kannan
346 Moreh-Namphalong Border TradeMarchang Reimeingam
347 Emerging Trends and Patterns of India’sAgricultural Workforce: Evidence from theCensusS Subramanian
348 Estimation of the Key EconomicDeterminants of Services Trade: Evidencefrom IndiaMini Thomas P
349 Employment-Export Elasticities for theIndian Textile IndustryTarun Arora
350 Caste and Care: Is Indian HealthcareDelivery System Favourable for Dalits?Sobin George
351 Food Security in Karnataka: Paradoxesof PerformanceStacey May Comber, Marc-Andre Gauthier,Malini L Tantri, Zahabia Jivaji and Miral Kalyani
352 Land and Water Use Interactions:Emerging Trends and Impact on Land-useChanges in the Tungabhadra and TagusRiver BasinsPer Stalnacke, Begueria Santiago, Manasi S, K VRaju, Nagothu Udaya Sekhar, Maria ManuelaPortela, António Betaâmio de Almeida, MartaMachado, Lana-Renault, Noemí, Vicente-Serranoand Sergio
353 Ecotaxes: A Comparative Study of Indiaand ChinaRajat Verma
354 Own House and Dalit: Selected Villages inKarnataka StateI Maruthi and Pesala Busenna
355 Alternative Medicine Approaches asHealthcare Intervention: A Case Studyof AYUSH Programme in Peri UrbanLocalesManasi S, K V Raju, B R Hemalatha,S Poornima, K P Rashmi
356 Analysis of Export Competitiveness ofIndian Agricultural Products with ASEANCountriesSubhash Jagdambe
Price: ` 30.00 ISBN 978-81-7791-213-5
INSTITUTE FOR SOCIAL AND ECONOMIC CHANGEDr V K R V Rao Road, Nagarabhavi P.O., Bangalore - 560 072, India
Phone: 0091-80-23215468, 23215519, 23215592; Fax: 0091-80-23217008E-mail: [email protected]; Web: www.isec.ac.in


