quantifying the main driving forces of ecosystem changes influencing the aquaculture sector and developing the appropriate environmental indicators ECASA SSG meeting, Amsterdam 21-22/10/2005
Transcript
WP 3 Identifying and quantifying the main driving forces of ecosystem changes influencing the aquaculture sector and developing the appropriate environmental indicators
ECASA SSG meeting, Amsterdam 21-22/10/2005
objective 1
to identify and quantitatively assess the role and the relative importance of the different forcing factors: (aquaculture, fisheries, pollution, eutrophication, habitat destruction etc.) and environmental variations affecting the water quality in aquaculture zones and the major ecosystem services provided
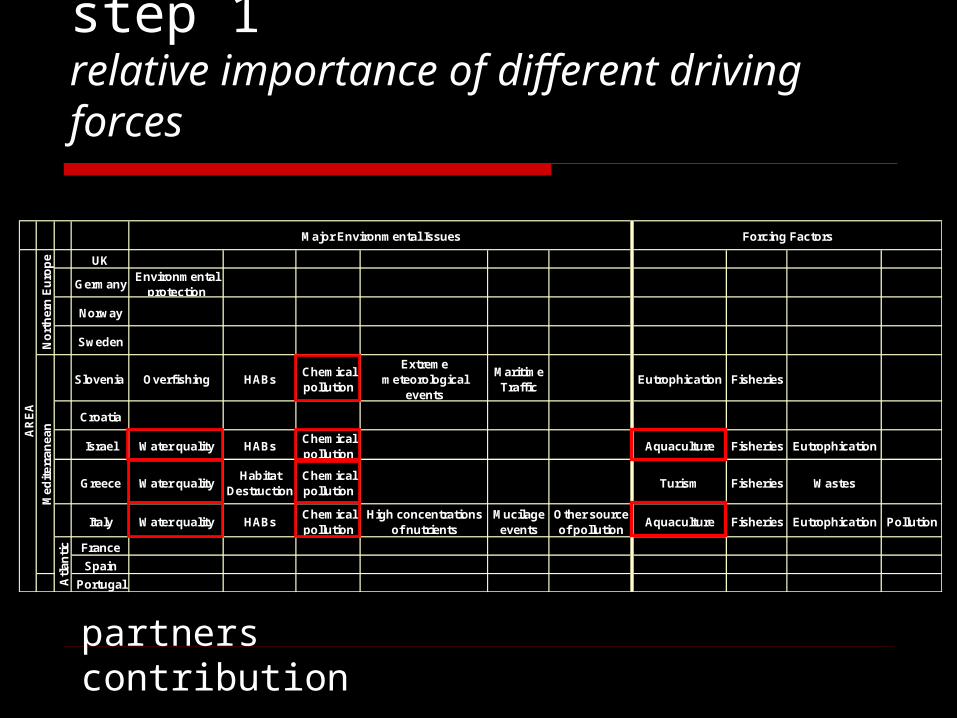
step 1relative importance of different driving forces
identification of major issues: partners contribution
major issues in different countries/areas experience bibliographic documentation other information sources
literature search EEA reports GOOS reports GESAMP reports
partners contribution
step 1relative importance of different driving forces
UK
GermanyEnvironmental
protection
Norway
Sweden
Slovenia Overfishing HABsChemical pollution
Extreme meteorological
events
Maritime Traffic
Eutrophication Fisheries
Croatia
Israel Water quality HABsChemical pollution
Aquaculture Fisheries Eutrophication
Greece Water qualityHabitat
DestructionChemical pollution
Turism Fisheries Wastes
Italy Water quality HABsChemical pollution
High concentrations of nutrients
Mucilage events
Other source of pollution
Aquaculture Fisheries Eutrophication Pollution
France
Spain
Portugal
AR
EA
Major Environmental Issues Forcing Factors
No
rth
ern
Eu
rop
eM
edit
erra
nea
n
Atl
anti
c
step 2relative importance of different driving forces
identification of major issues HOTO-Table *
* IOC 2001, GOOS Report No. 99
modifications(with partners contribution)
discrimination between shellfish – finfish
issues of importance to aquaculture
include other interactions
step 2relative importance of different driving forces
step 3relative importance of different driving forces
ranking of activities with regard to aquaculture
objective 2
to suggest the best methods for obtaining reference levels and associated indicators useful to monitor the impact of anthropogenic factors on aquaculture
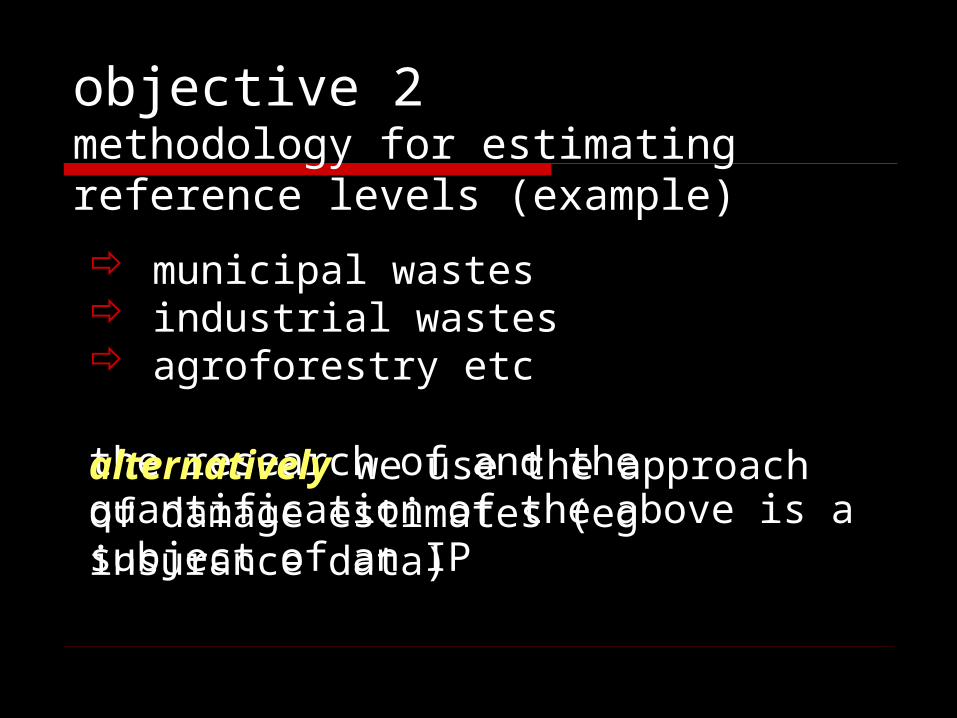
objective 2methodology for estimating reference levels (example)
1. aquaculture is affected by dissolved O2
2. what are the thresholds? (literature review)
3. how often are these thresholds reached in aquaculture?
4. what is the contribution of other uses to this situation?
municipal wastes industrial wastes agroforestry etc
the research of and the quantification of the above is a subject of an IP
objective 2methodology for estimating reference levels (example)
alternatively we use the approach of damage estimates (eg insurance data)
objective 2identifying risks of anthropogenic impacts on aquaculture