18
Noordwijk, Netherlands, 23.03.2011 1 1/6 WP5 -Task 5.2 Impulse current and short circuit current measurements
Noordwijk, Netherlands, 23.03.2011 111/6
WP5 -Task 5.2
Impulse current and short circuit
current measurements
Noordwijk, Netherlands, 23.03.2011 2
Task 5.2 Impulse current and short circuit current measurements
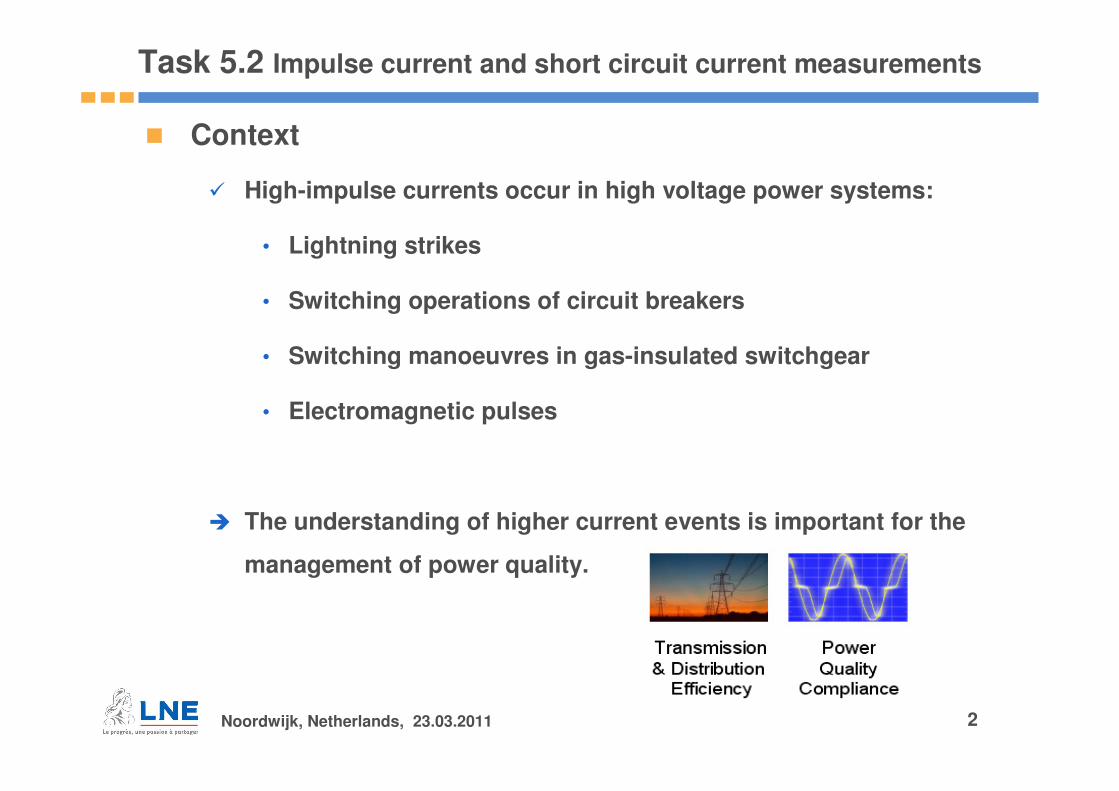
Context
High-impulse currents occur in high voltage power systems:
• Lightning strikes
• Switching operations of circuit breakers
• Switching manoeuvres in gas-insulated switchgear
• Electromagnetic pulses
The understanding of higher current events is important for the
management of power quality.
Noordwijk, Netherlands, 23.03.2011 3
Task 5.2 Impulse current and short circuit current measurements
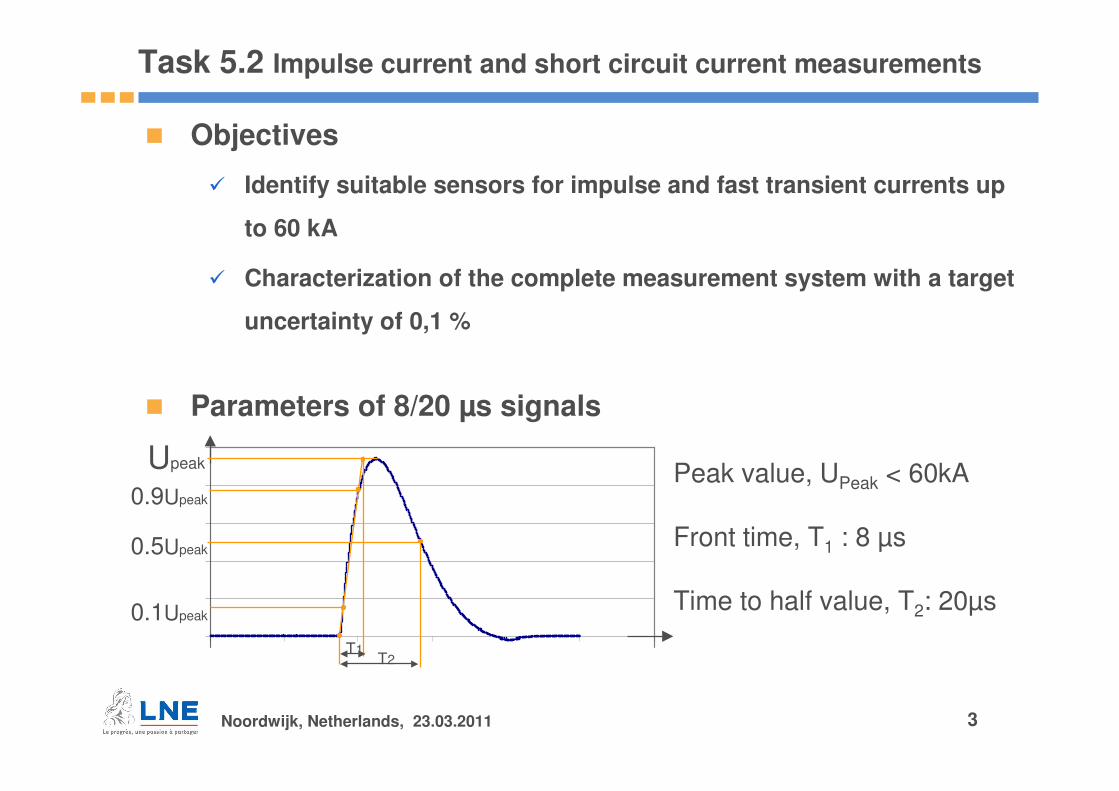
Objectives
Identify suitable sensors for impulse and fast transient currents up
to 60 kA
Characterization of the complete measurement system with a target
uncertainty of 0,1 %
Parameters of 8/20 µs signals
-2.000000
0.000000
2.000000
4.000000
6.000000
8.000000
10.000000
0 2000 4000 6000 8000 10000 12000
Upeak
0.9Upeak
0.1Upeak
0.5Upeak
T1T2
Peak value, UPeak < 60kA
Front time, T1 : 8 µs
Time to half value, T2: 20µs
Noordwijk, Netherlands, 23.03.2011 44
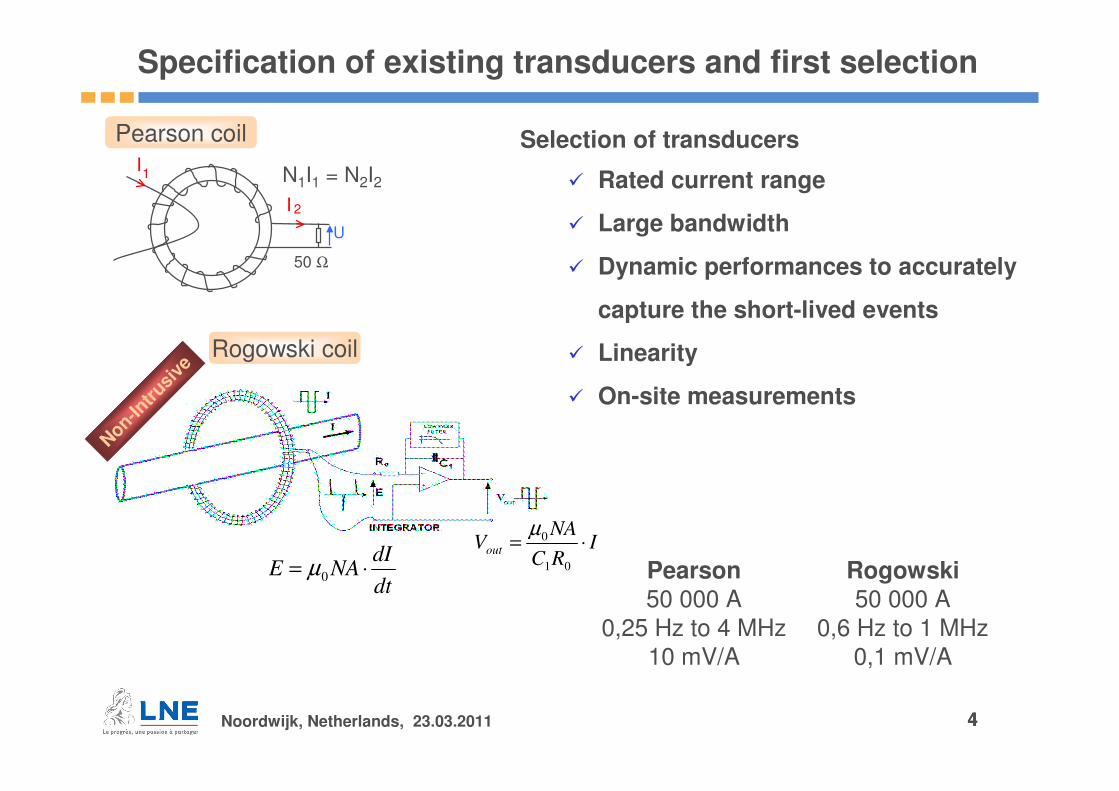
Specification of existing transducers and first selection
Pearson coil
Rogowski coil
U
1I
I 2
50 Ω
Non-In
trusi
veN1I1 = N2I2
dt
dINAE ⋅= 0µ
IRC
NAVout ⋅=
01
0µ
Pearson50 000 A
0,25 Hz to 4 MHz10 mV/A
Rogowski50 000 A
0,6 Hz to 1 MHz0,1 mV/A
Selection of transducers
Rated current range
Large bandwidth
Dynamic performances to accurately
capture the short-lived events
Linearity
On-site measurements
Noordwijk, Netherlands, 23.03.2011 55
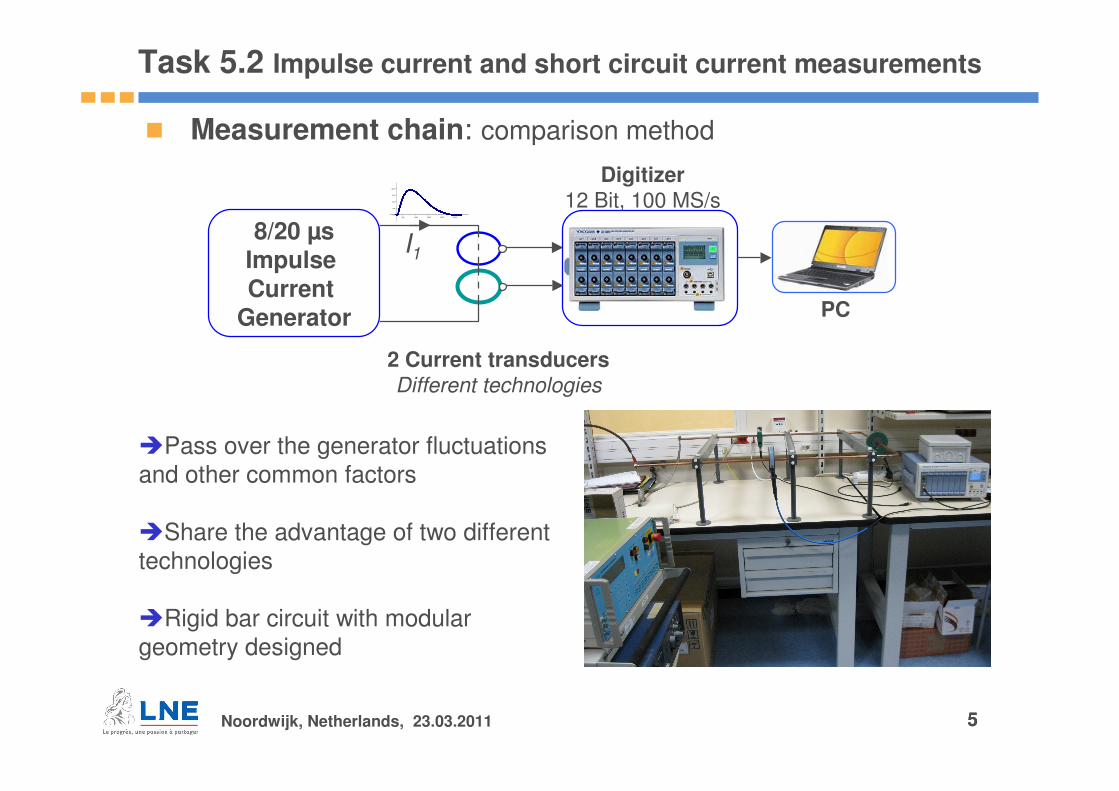
Measurement chain: comparison method
Task 5.2 Impulse current and short circuit current measurements
8/20 µsImpulse
Current Generator
2 Current transducers
Different technologies
PC
Digitizer
12 Bit, 100 MS/s
I1
0.0
5.0
10.0
15.0
20.0
-500 500 1500 2500 3500 4500
Pass over the generator fluctuations and other common factors
Share the advantage of two different technologies
Rigid bar circuit with modular geometry designed
Noordwijk, Netherlands, 23.03.2011 66
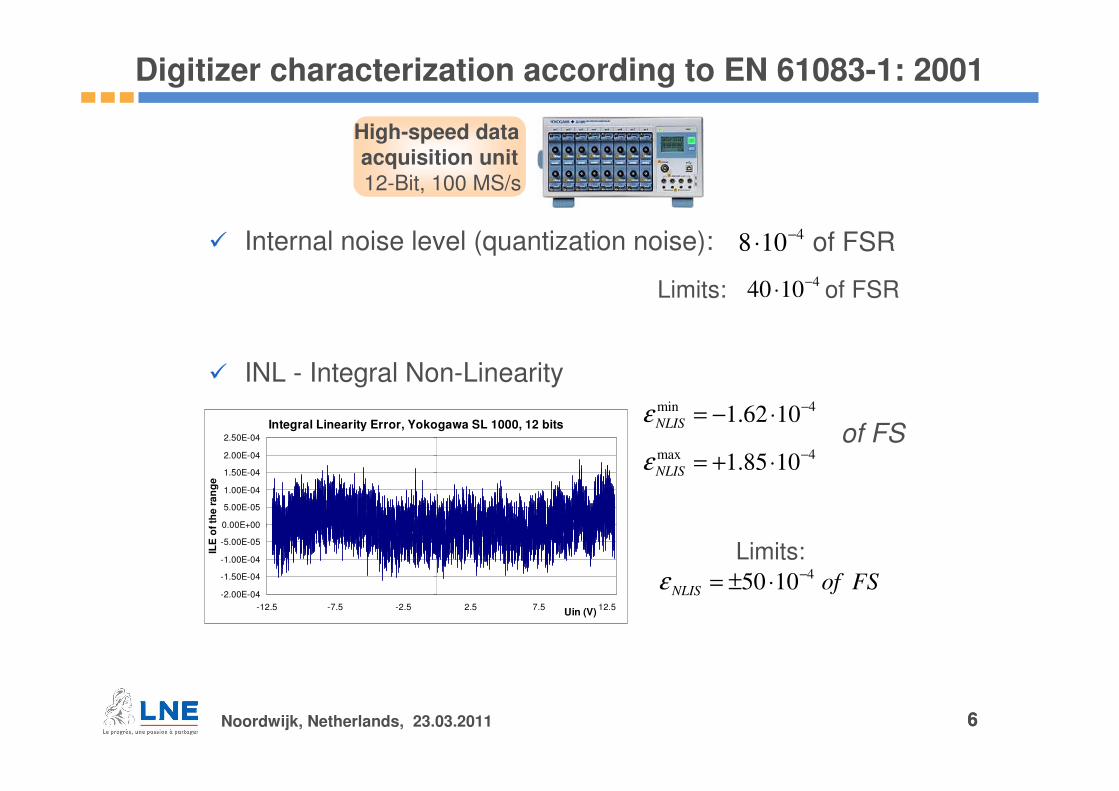
Digitizer characterization according to EN 61083-1: 2001
Internal noise level (quantization noise):
INL - Integral Non-Linearity
of FSR4108
−⋅
Limits: 41040
−⋅ of FSR
Integral Linearity Error, Yokogawa SL 1000, 12 bits
-2.00E-04
-1.50E-04
-1.00E-04
-5.00E-05
0.00E+00
5.00E-05
1.00E-04
1.50E-04
2.00E-04
2.50E-04
-12.5 -7.5 -2.5 2.5 7.5 12.5Uin (V)
ILE
of
the
ra
ng
e
4max1085.1
−⋅+=NLISε
4min1062.1
−⋅−=NLISε
FSofNLIS
41050
−⋅±=ε
Limits:
of FS
High-speed data
acquisition unit
12-Bit, 100 MS/s
Noordwijk, Netherlands, 23.03.2011 77
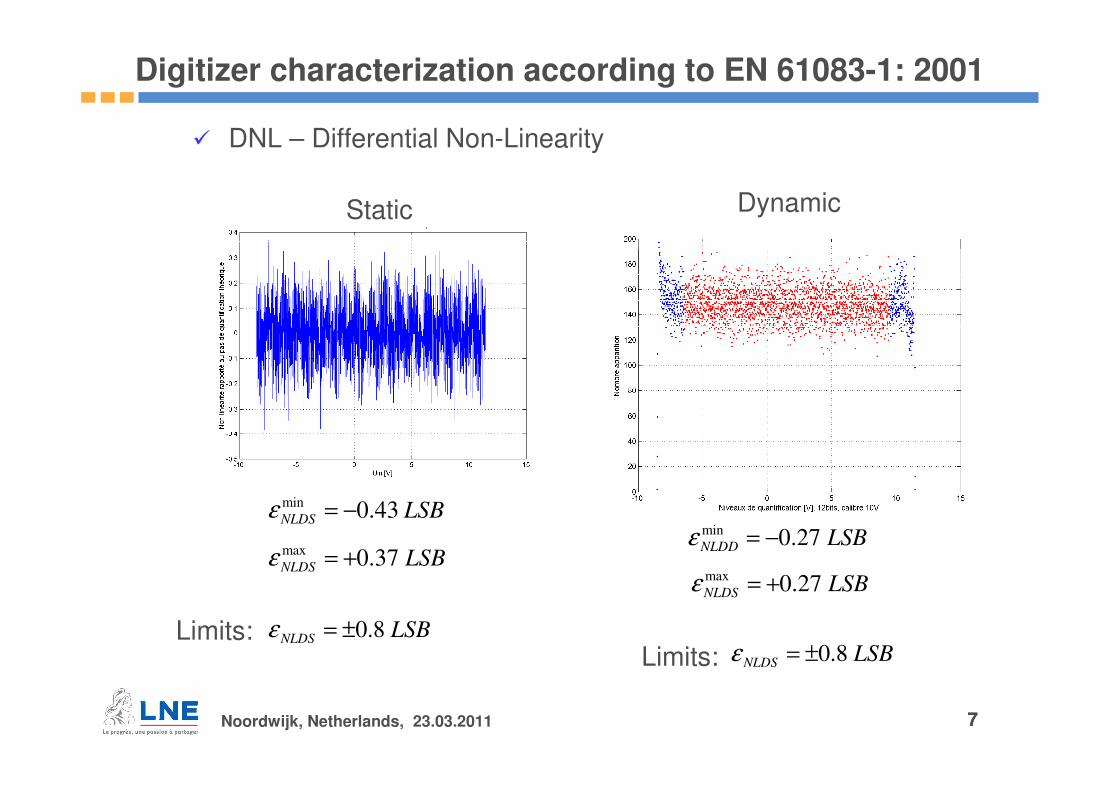
DynamicStatic
DNL – Differential Non-Linearity
LSBNLDS 43.0min −=ε
LSBNLDS 37.0max +=ε
LSBNLDS 8.0±=εLimits:
LSBNLDD 27.0min −=ε
LSBNLDS 27.0max +=ε
LSBNLDS 8.0±=εLimits:
Digitizer characterization according to EN 61083-1: 2001
Noordwijk, Netherlands, 23.03.2011 88
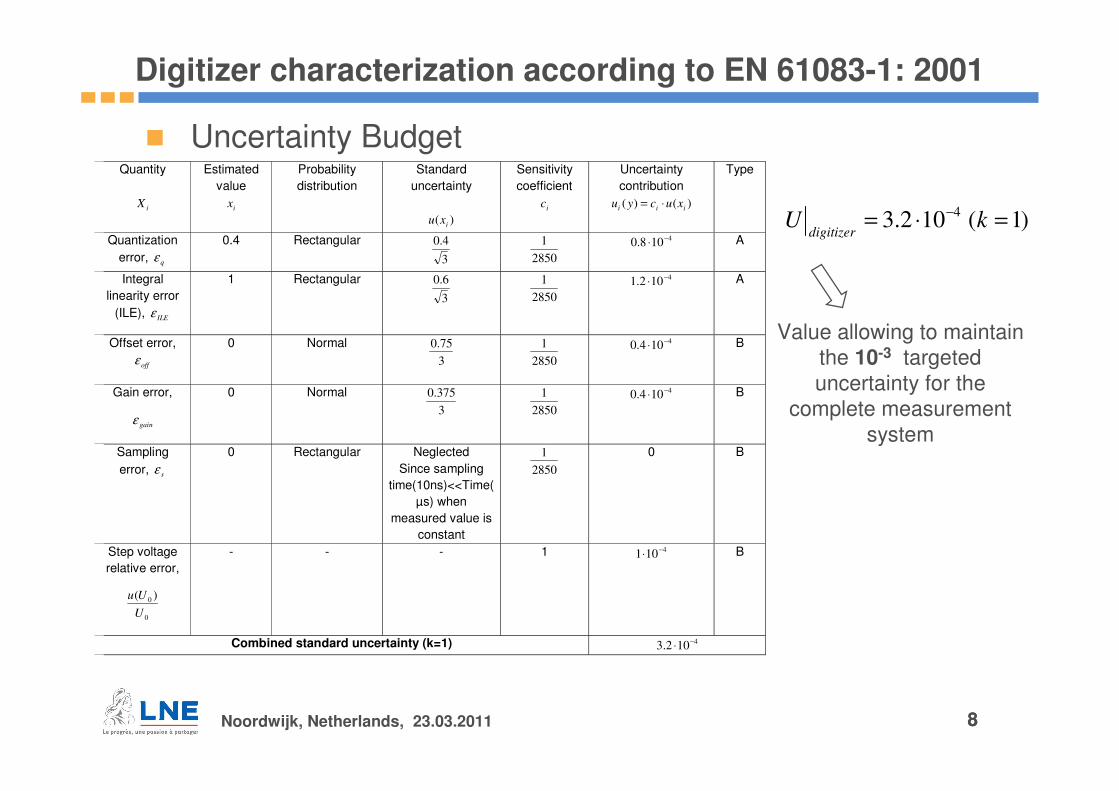
Digitizer characterization according to EN 61083-1: 2001
Uncertainty Budget
)1(102.34 =⋅= −
kUdigitizer
Value allowing to maintain the 10-3 targeted uncertainty for the
complete measurement system
Quantity
iX
Estimated value
ix
Probability distribution
Standard uncertainty
)( ixu
Sensitivity coefficient
ic
Uncertainty contribution
)()( iii xucyu ⋅=
Type
Quantization error, qε
0.4 Rectangular
3
4.0
2850
1
4108.0
−⋅ A
Integral linearity error
(ILE), ILEε
1 Rectangular
3
6.0
2850
1
4102.1
−⋅ A
Offset error,
offε 0 Normal
3
75.0
2850
1
4104.0
−⋅ B
Gain error,
gainε
0 Normal 3
375.0
2850
1
4104.0
−⋅ B
Sampling error, sε
0 Rectangular Neglected Since sampling
time(10ns)<<Time(µs) when
measured value is constant
2850
1
0 B
Step voltage relative error,
0
0 )(
U
Uu
- - - 1 4101
−⋅ B
Combined standard uncertainty (k=1) 4102.3
−⋅

Noordwijk, Netherlands, 23.03.2011 99
Current step generator
Dynamic characterization of the impulse current sensors and measurement chain
High level of current (~ 100A)
Steep falling slope (tens of ns)
Low parasitic inductance and capacitance
Noordwijk, Netherlands, 23.03.2011 1010
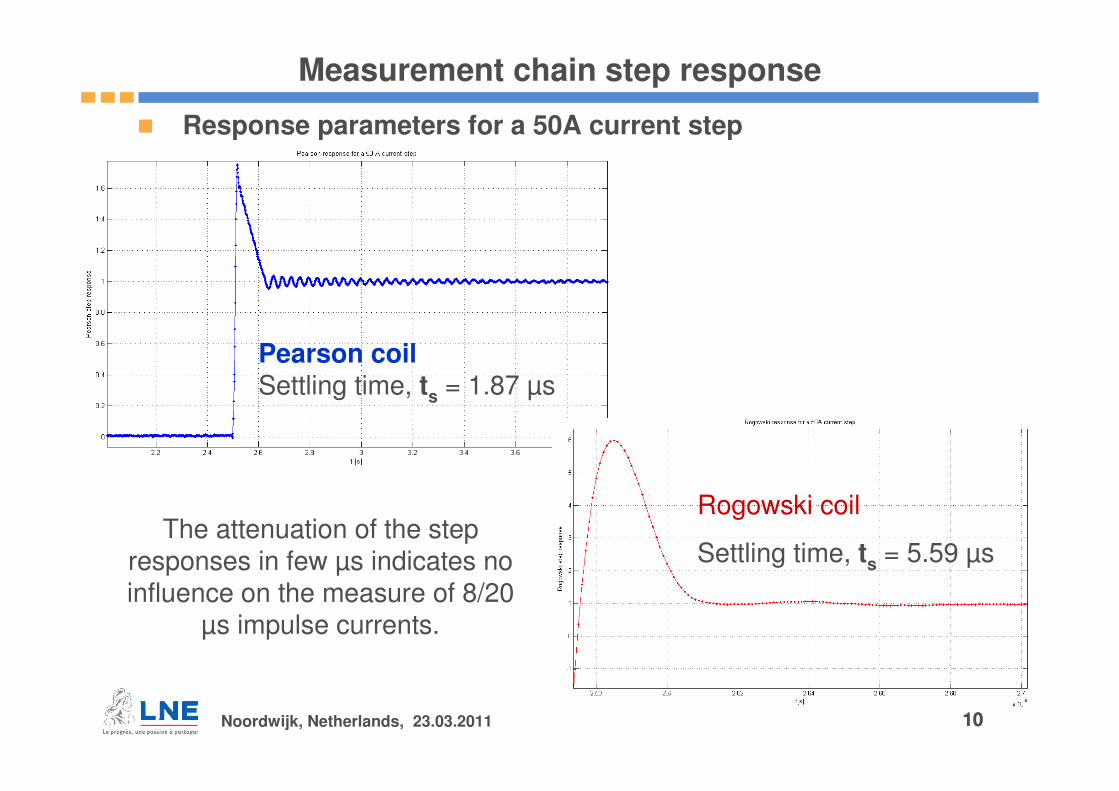
Measurement chain step response
Rogowski coil
Settling time, ts = 5.59 µs
Pearson coilSettling time, ts = 1.87 µs
The attenuation of the step responses in few µs indicates no influence on the measure of 8/20
µs impulse currents.
Response parameters for a 50A current step
Noordwijk, Netherlands, 23.03.2011 1111
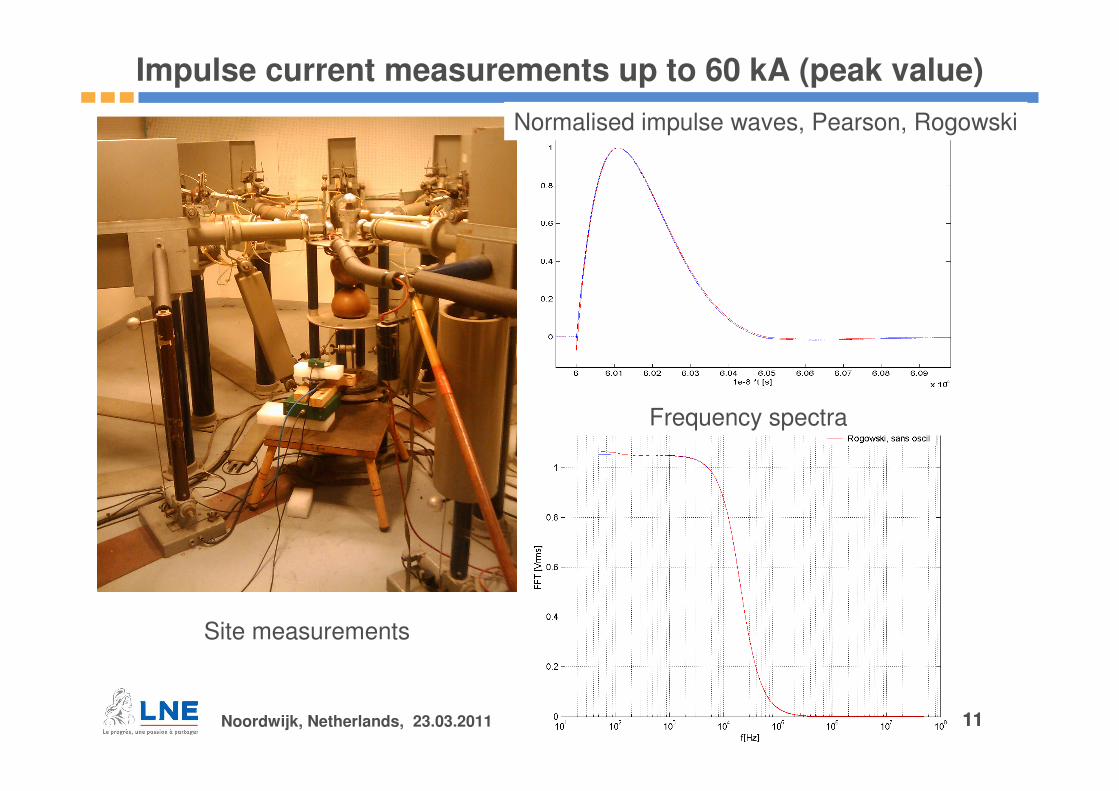
Impulse current measurements up to 60 kA (peak value)
Frequency spectra
Normalised impulse waves, Pearson, Rogowski
Site measurements
Noordwijk, Netherlands, 23.03.2011 12
Analysis parameter for peak value, 0,5 - 60 kA
0.0E+00
5.0E-04
1.0E-03
1.5E-03
2.0E-03
2.5E-03
0 10 20 30 40 50 60 70
I [kA]
12
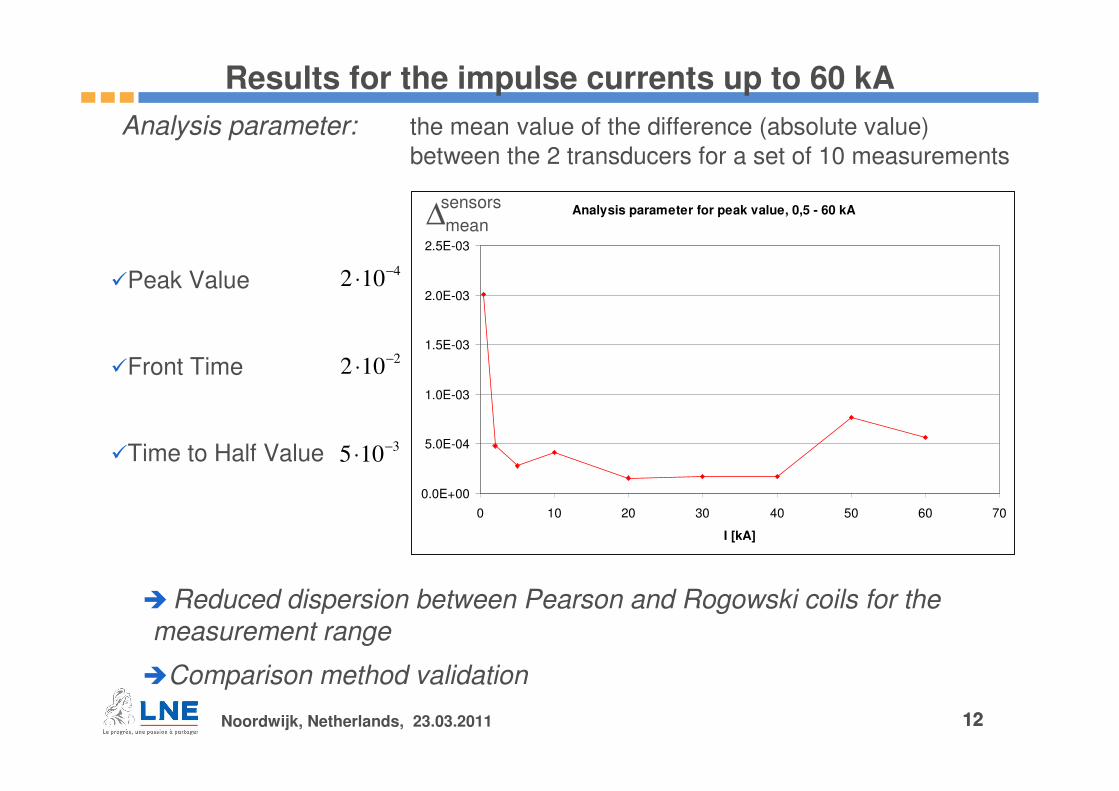
Results for the impulse currents up to 60 kA
Reduced dispersion between Pearson and Rogowski coils for the measurement range
Comparison method validation
∆meansensors
Analysis parameter: the mean value of the difference (absolute value) between the 2 transducers for a set of 10 measurements
Peak Value
Front Time
Time to Half Value
4102
−⋅
2102
−⋅
3105
−⋅
Noordwijk, Netherlands, 23.03.2011 13
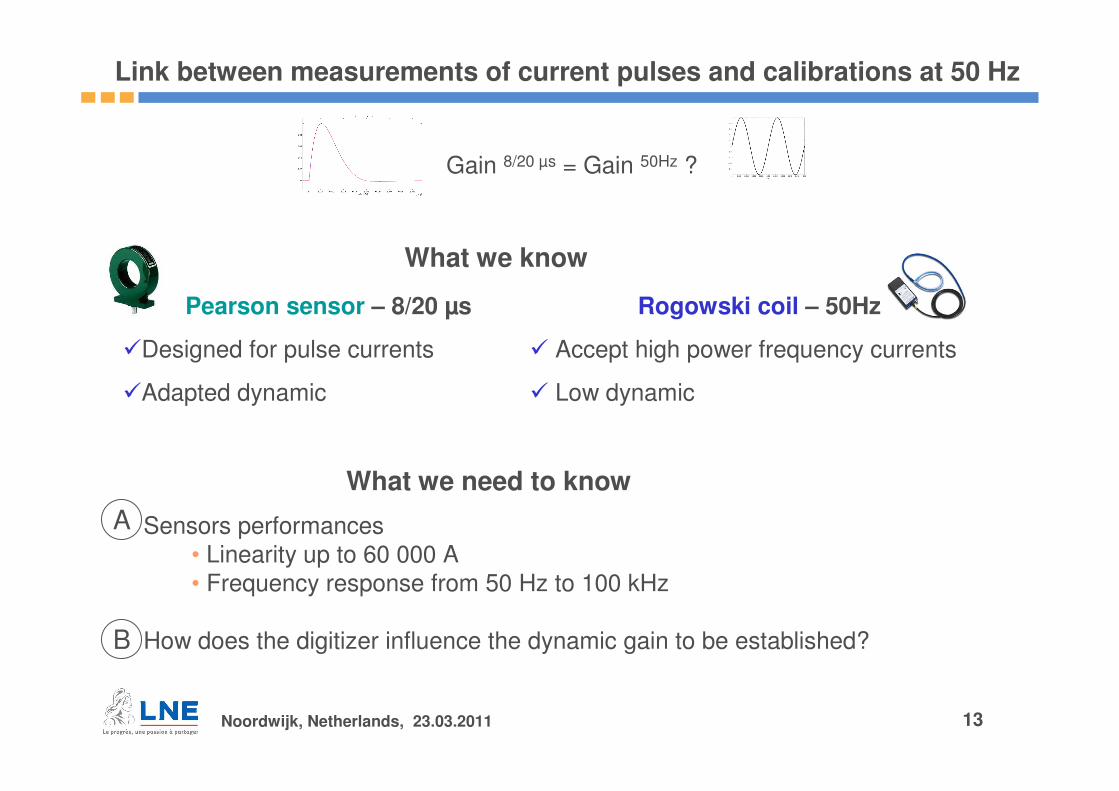
Link between measurements of current pulses and calibrations at 50 Hz
Gain 8/20 µs = Gain 50Hz ?
Sensors performances • Linearity up to 60 000 A • Frequency response from 50 Hz to 100 kHz
How does the digitizer influence the dynamic gain to be established?
Rogowski coil – 50Hz
Accept high power frequency currents
Low dynamic
Pearson sensor – 8/20 µs
Designed for pulse currents
Adapted dynamic
What we know
What we need to know
A
B

Noordwijk, Netherlands, 23.03.2011 14
Frequency response of sensors and digitizer
Digitizer Errors [%], Channel 1
-0.60
-0.40
-0.20
0.00
0.20
0.40
0.60
0.1 1 10 100
F [kHz]
Calibre 0.1V
Calibre 0.2V
Calibre 0.5V
Calibre 1V
Calibre 2V
Calibre 5V
Calibre 10V
Calibre 20V
Calibre 50V
Calibre 100V
Calibre 200V
DigitizerErrors [%], Channel 2
-0.30
-0.20
-0.10
0.00
0.10
0.20
0.30
0.40
0.1 1 10 100
F [kHz]
Calibre 0.1V
Calibre 0.2V
Calibre 0.5V
Calibre 1V
Calibre 2V
Calibre 5V
Calibre 10V
Calibre 20V
Calibre 50V
Calibre 100V
Calibre 200V
Link between measurements of current pulses and calibrations at 50 Hz
Pearson gain, 200A, sinusoidal
10.020
10.030
10.040
10.050
10.060
10.070
0.01 0.1 1 10
f [kHz]
Ga
inP
[m
V/A
]
%1,0±
Rogowski gain, 200A, sinusoidal
0.0990
0.0992
0.0994
0.0996
0.0998
0.1000
0.01 0.1 1 10
f [kHz]
Ga
inR
[m
V/A
] %1,0±
Noordwijk, Netherlands, 23.03.2011 15
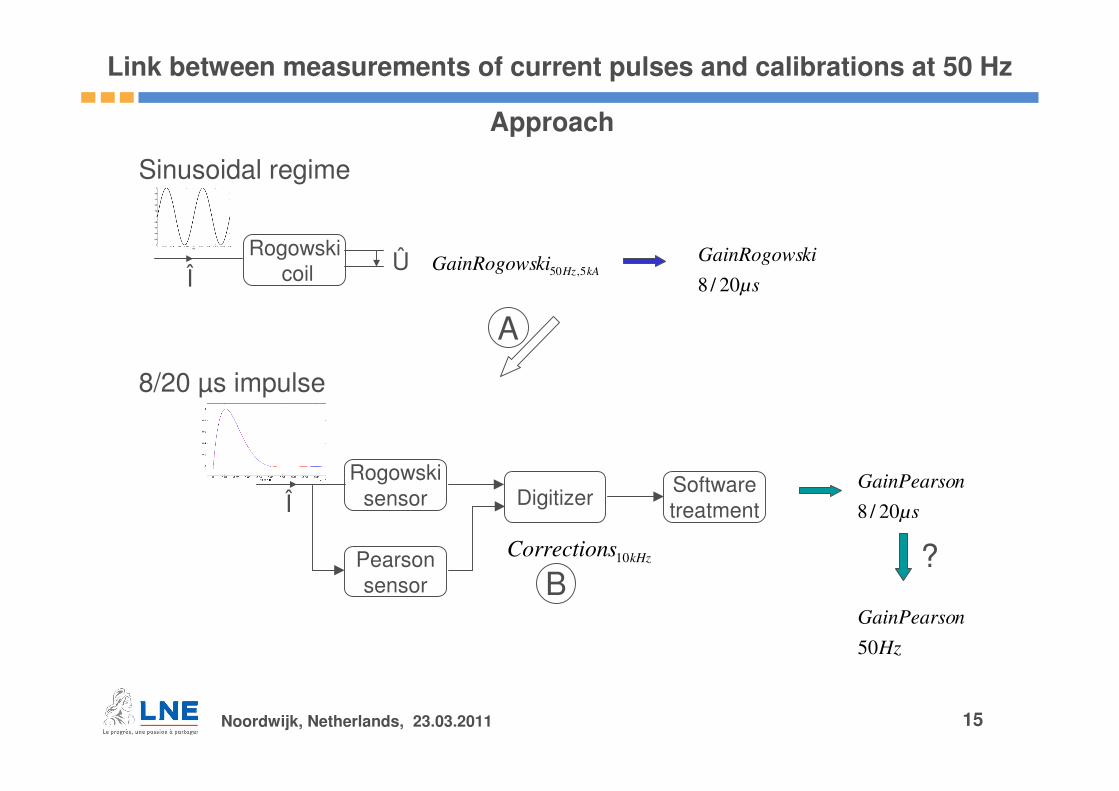
Link between measurements of current pulses and calibrations at 50 Hz
RogowskicoilÎ
Û kAHzkiGainRogows 5,50
Sinusoidal regime
µs
kiGainRogows
20/8
8/20 µs impulse
RogowskisensorÎ Digitizer
Softwaretreatment
Pearsonsensor
µs
nGainPearso
20/8
kHzsCorrection10
Hz
nGainPearso
50
Approach
A
B?
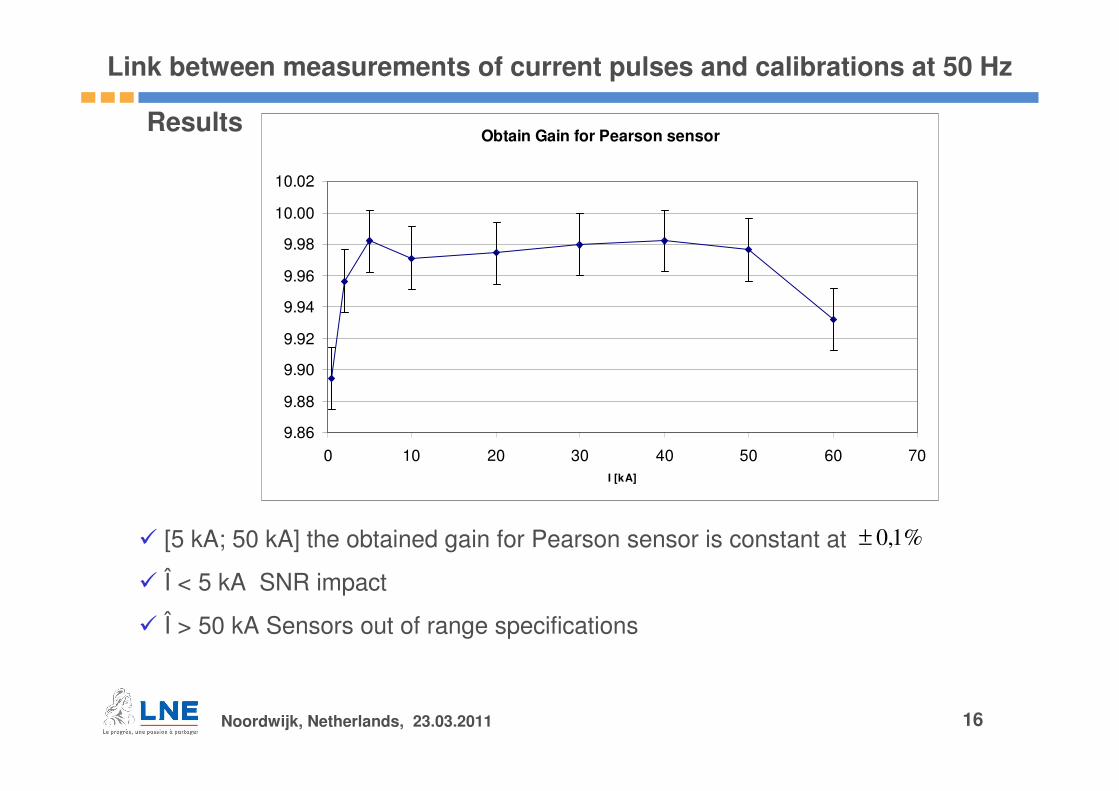
Noordwijk, Netherlands, 23.03.2011 16
Link between measurements of current pulses and calibrations at 50 Hz
[5 kA; 50 kA] the obtained gain for Pearson sensor is constant at
Î < 5 kA SNR impact
Î > 50 kA Sensors out of range specifications
%1,0±
ResultsObtain Gain for Pearson sensor
9.86
9.88
9.90
9.92
9.94
9.96
9.98
10.00
10.02
0 10 20 30 40 50 60 70I [kA]
Noordwijk, Netherlands, 23.03.2011 17
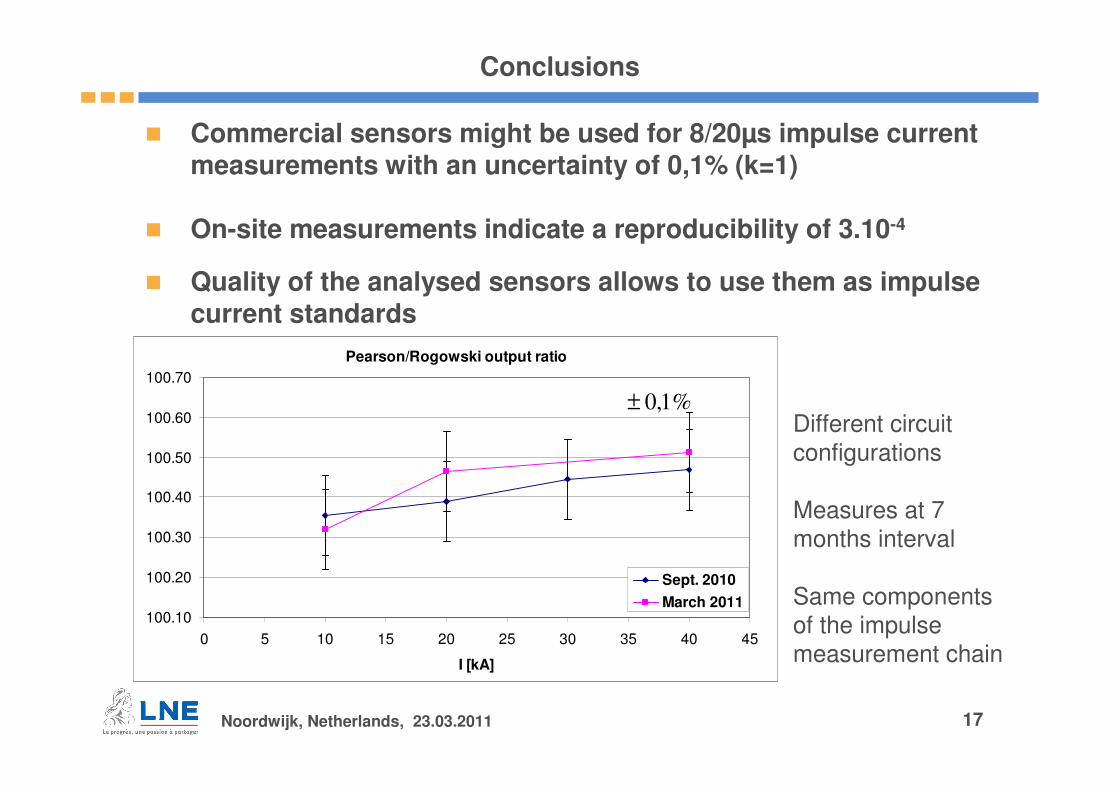
Commercial sensors might be used for 8/20µs impulse current measurements with an uncertainty of 0,1% (k=1)
On-site measurements indicate a reproducibility of 3.10-4
Quality of the analysed sensors allows to use them as impulse current standards
Conclusions
Pearson/Rogowski output ratio
100.10
100.20
100.30
100.40
100.50
100.60
100.70
0 5 10 15 20 25 30 35 40 45
I [kA]
Sept. 2010
March 2011
Different circuit configurations
Measures at 7 months interval
Same components of the impulse measurement chain
%1,0±
Noordwijk, Netherlands, 23.03.2011 1818
Task 5.2 Impulse current and short circuit current measurements
Thank you for your attention.


