Funded by: European Commission Framework Programme 7 Cooperation Thematic Area Environment 6.4 Earth Observation and assessment tools for sustainable development WP7 – DEMO-SITE IMPLEMENTATION DELIVERABLE D.7.2 REPORT ON THE MOSTAR CASE STUDY INVESTIGATIONS Compiled by Amer Smailbegovic, Photon llc., Croatia Mak Kisevic, Photon llc., Croatia Dries Raymaekers - VITO, Flemish Institute for Technological Research, Belgium Roko Andricevic, Photon llc., Croatia Marc Goossens, Geosense B.V., the Netherlands Mirna Raic - GFMO, University of Mostar, Bosnia and Herzegovina Senad Hrustanovic, Photon llc., Croatia Submitted by: GEONARDO Environmental Technologies Ltd. (Project Coordinator) Project Coordinator name: Mr. Peter Gyuris Project Coordinator organization name: GEONARDO, Hungary www.impactmin.eu IMPACT MONITORING OF MINERAL RESOURCES EXPLOITATION CONTRACT Nº 244166
Transcript
Funded by:
European CommissionFramework Programme 7
Cooperation
Thematic AreaEnvironment 6.4Earth Observation and assessment tools for sustainable development
WP7 – Demo-Site imPlementation
Deliverable D.7.2rePort on the moStar CaSe StuDy inveStigationS
Compiled byAmer Smailbegovic, Photon llc., CroatiaMak Kisevic, Photon llc., CroatiaDries Raymaekers - VITO, Flemish Institute for Technological Research, BelgiumRoko Andricevic, Photon llc., CroatiaMarc Goossens, Geosense B.V., the NetherlandsMirna Raic - GFMO, University of Mostar, Bosnia and HerzegovinaSenad Hrustanovic, Photon llc., Croatia
IMPACT MONITORING OF MINERAL RESOURCES ExPLOITATION
ContraCt nº
2 4 4 1 6 6
This report has been submitted to the European Commission for evaluation and for approval.
Currently the content of this report does not reflect the official opinion of the European Union.
Responsibility for the information and views expressed in the report therein lies entirely with the
author(s).
IMPACTMIN Contract №: 244166
2
Executive Summary:
The City of Mostar, Bosnia and Herzegovina,
situated along river Neretva in a narrow inter-
mountain valley has been an important crossroad
for thousands of years. The town was named after
the guardians of a famous bridge spanning the two
banks of Neretva and has retained its important
trading, mining and industrial character for
centuries. Significant deposits of brown coal were
discovered in the mid-19th century and the mining
began soon afterwards to supply the much needed
coal for railroads and industry springing in Bosnia
and Herzegovina during the Austro-Hungarian
reign. The mining of coal continued almost until
the outbreak of hostilities in Bosnia in the 1990s.
In addition to coal mining, Mostar was also a
center of aluminum-refining and bauxite-ore
processing industry supporting robust defense and
aircraft industry in the former Yugoslavia. The
Mostar valley now contains at least three sites of
possible environmental impact: the abandoned
Vihovici coal mine, the bauxite-ore waste ponds (red-mud ponds) and the aluminum smelter facility. Of
particular interest to the ImpactMin project are the coal mine and the bauxite-waste ponds as the city of
Mostar itself is situated in a karst environment with fragile aquatic ecosystem dependent on the river
Neretva, which is the main source of water for both Herzegovina as well as southern Croatia. The
Vihovici coal mine was also used as an illegal dumping ground during the 1992-1995 conflict and as a
result of illegal garbage burning, the remaining underground coal seams have caught on fire, which was
a task of remediation efforts in the 2007-2009 time frame.
Hyperspectral imagery was used to investigate for the potential sources of aquatic, atmospheric and
land pollution from the mine waste tailings, bauxite-ore waste storage and other areas of interest. The
hyperspectral data were intended to map iron oxide and sulfate minerals in the high-sulfur, sub-
economic coal seams piled on the fringes of the old mine, vegetation stress and water quality
degradation in the river Neretva and the old mine-pit within Vihovici as well as distribution and
condition of the red-mud in the bauxite-ore containment in the southern Mostar valley, partially as a
result of lessons-learned from the Ajka-Kolontar, Hungary red-mud spill in October of 2010, where
Photon llc. had also participated in the acquisition and analysis of hyperspectral data. It must be noted
that the red-mud storage facility in Mostar was appraised as a target of opportunity in the light of the
Hungarian disaster, which had occurred during the duration of the ImpactMin project.
IMPACTMIN Contract №: 244166
3
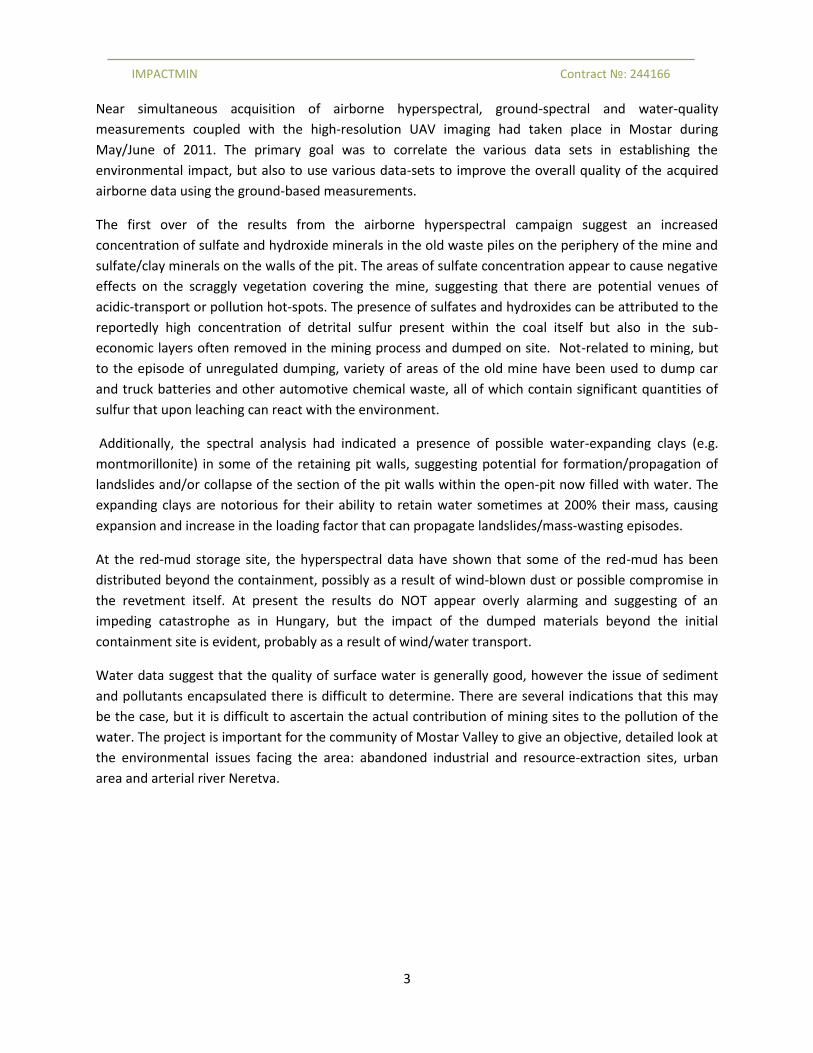
Near simultaneous acquisition of airborne hyperspectral, ground-spectral and water-quality
measurements coupled with the high-resolution UAV imaging had taken place in Mostar during
May/June of 2011. The primary goal was to correlate the various data sets in establishing the
environmental impact, but also to use various data-sets to improve the overall quality of the acquired
airborne data using the ground-based measurements.
The first over of the results from the airborne hyperspectral campaign suggest an increased
concentration of sulfate and hydroxide minerals in the old waste piles on the periphery of the mine and
sulfate/clay minerals on the walls of the pit. The areas of sulfate concentration appear to cause negative
effects on the scraggly vegetation covering the mine, suggesting that there are potential venues of
acidic-transport or pollution hot-spots. The presence of sulfates and hydroxides can be attributed to the
reportedly high concentration of detrital sulfur present within the coal itself but also in the sub-
economic layers often removed in the mining process and dumped on site. Not-related to mining, but
to the episode of unregulated dumping, variety of areas of the old mine have been used to dump car
and truck batteries and other automotive chemical waste, all of which contain significant quantities of
sulfur that upon leaching can react with the environment.
Additionally, the spectral analysis had indicated a presence of possible water-expanding clays (e.g.
montmorillonite) in some of the retaining pit walls, suggesting potential for formation/propagation of
landslides and/or collapse of the section of the pit walls within the open-pit now filled with water. The
expanding clays are notorious for their ability to retain water sometimes at 200% their mass, causing
expansion and increase in the loading factor that can propagate landslides/mass-wasting episodes.
At the red-mud storage site, the hyperspectral data have shown that some of the red-mud has been
distributed beyond the containment, possibly as a result of wind-blown dust or possible compromise in
the revetment itself. At present the results do NOT appear overly alarming and suggesting of an
impeding catastrophe as in Hungary, but the impact of the dumped materials beyond the initial
containment site is evident, probably as a result of wind/water transport.
Water data suggest that the quality of surface water is generally good, however the issue of sediment
and pollutants encapsulated there is difficult to determine. There are several indications that this may
be the case, but it is difficult to ascertain the actual contribution of mining sites to the pollution of the
water. The project is important for the community of Mostar Valley to give an objective, detailed look at
the environmental issues facing the area: abandoned industrial and resource-extraction sites, urban
area and arterial river Neretva.
IMPACTMIN Contract №: 244166
4
Table of Contents
List of Figures ................................................................................................................................................ 6
List of Tables ................................................................................................................................................. 9
Part 1 - Background ..................................................................................................................................... 10
Mostar Valley Problematics .................................................................................................................... 10
Area and Physiography ........................................................................................................................... 18
Area location ....................................................................................................................................... 18
Work Package 4: Spaceborne remote sensing using satellite technology.......................................... 29
Work Package 5: Airborne Hyperspectral Survey ............................................................................... 33
Work Package 5: Smartplanestm UAV.................................................................................................. 34
Work Package 5: Ground spectroscopy survey................................................................................... 34
Work Package 5: Water Survey ........................................................................................................... 37
Data Types ............................................................................................................................................... 43
Urban area .......................................................................................................................................... 56
Water body detection ......................................................................................................................... 57
Secondary Iron minerals ..................................................................................................................... 59
Airborne data analysis ............................................................................................................................ 63
Land target classification .................................................................................................................... 63
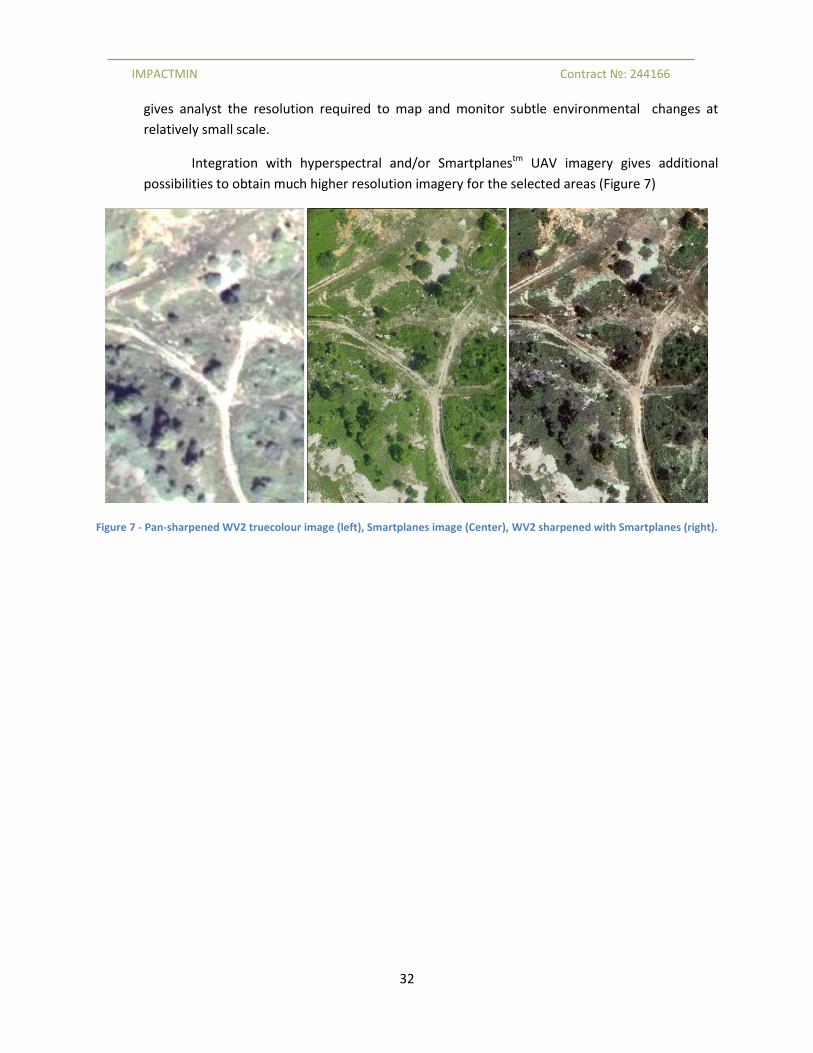
with Smartplanes (right). ............................................................................................................................ 32
Figure 8 - building and industrial waste dumped in the pit area (location 19 on Figure 10) ..................... 34
Figure 9 - Fairly sparse grass with shrubs and low trees (location 15 on map ) and typical composition of
cover material for historic waste (location 13) ........................................................................................... 35
Figure 11 - Field sampling points plotted on WV2-image and Smartplanes ortho-mosaic; numbered
samples correspond with the spectra shown in Figure 12 below. ............................................................. 36
Figure 12 - Representative spectra for the open pit area. Vertical lines show characteristic feature
positions for goethite, Kaolinite and Calcite respectively .......................................................................... 37
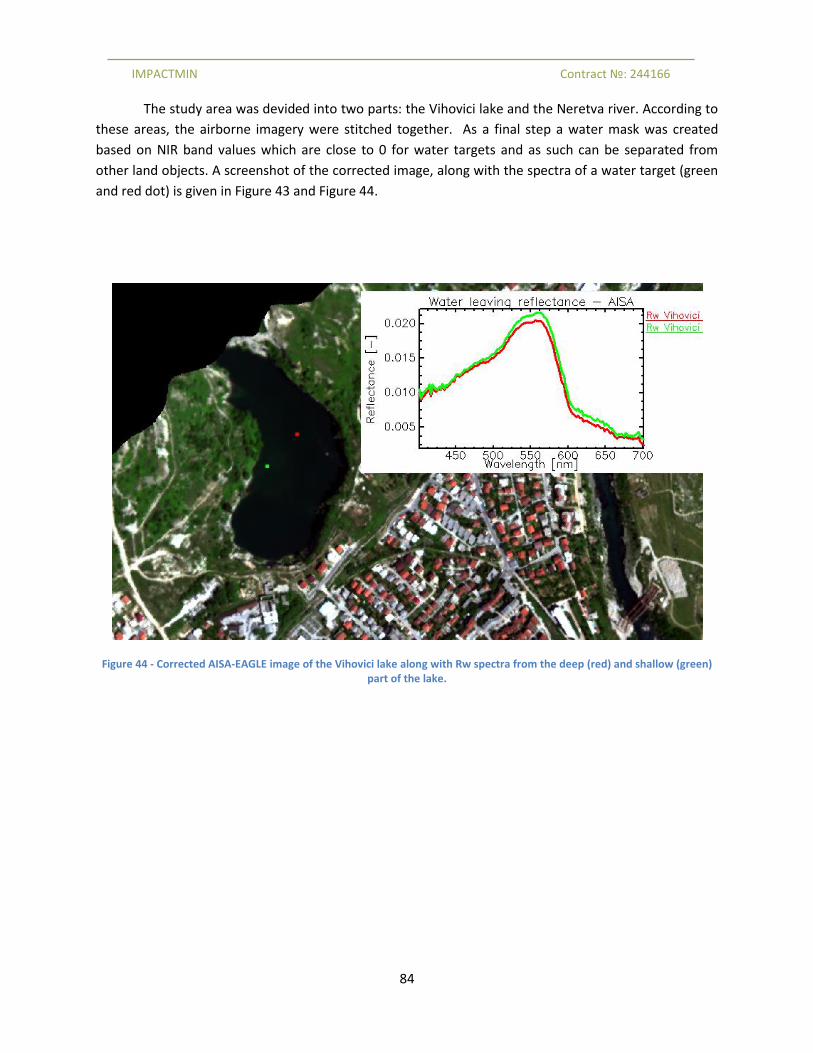
Figure 13 - Example of the airborne image (RGB) above Vihovici lake. Two radiance spectra from water
targets (at red and green location) are shown along with a picture taken during the field campaign. ..... 40
Figure 14 - Location of the field measurements. Red dots indicate the location of the water samples.
Yellow dots indicate the location of water samples and ASD measurements. .......................................... 41
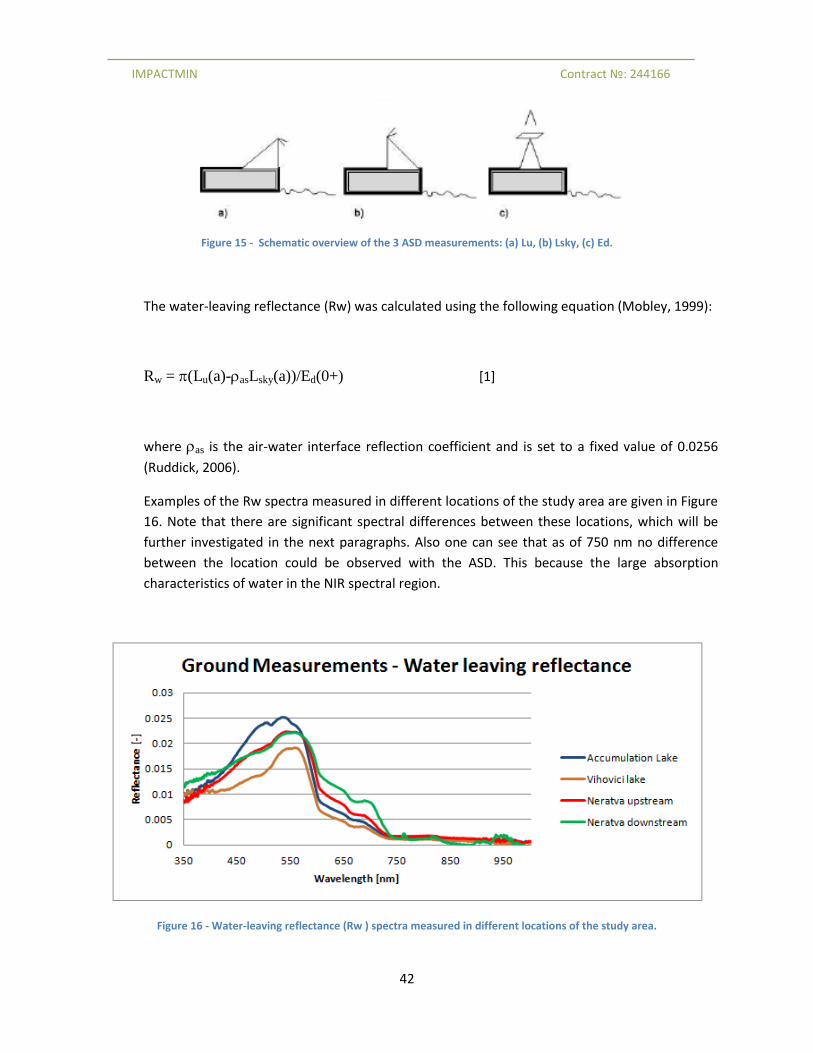
Figure 15 - Schematic overview of the 3 ASD measurements: (a) Lu, (b) Lsky, (c) Ed. .............................. 42
Figure 16 - Water-leaving reflectance (Rw ) spectra measured in different locations of the study area. . 42
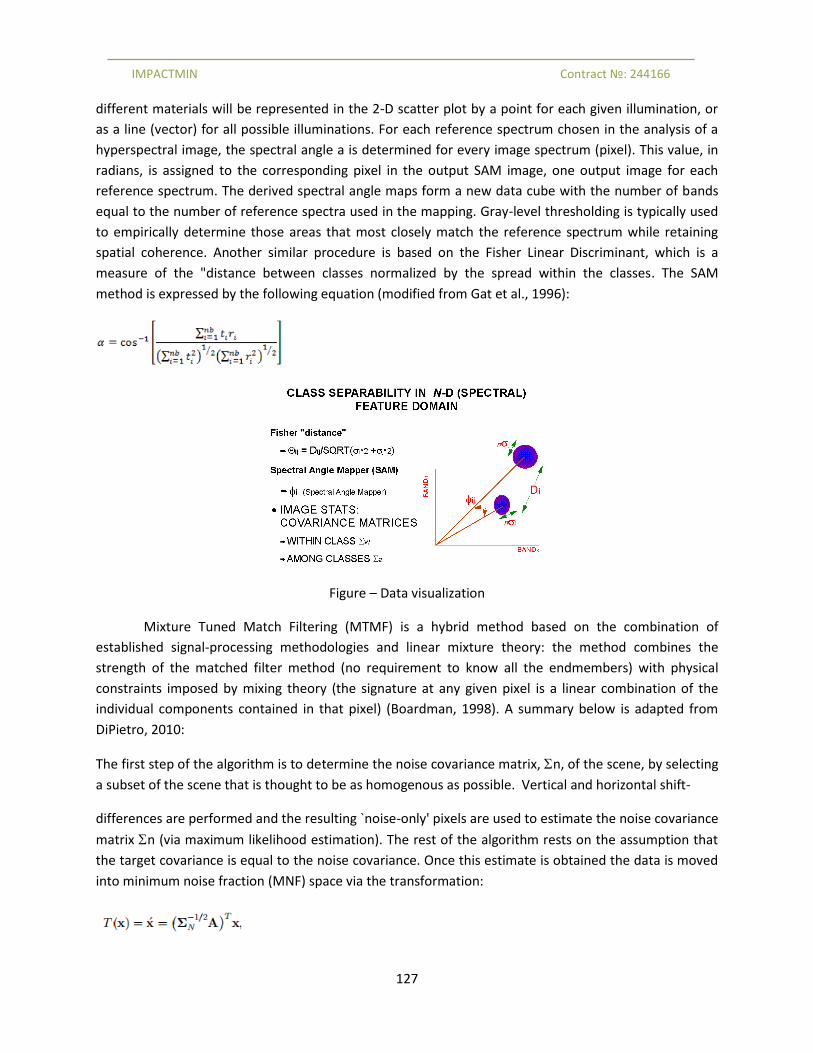
Figure 17- Conceptual model of hyperspectral imaging by a hyperspectral sensor .................................. 44
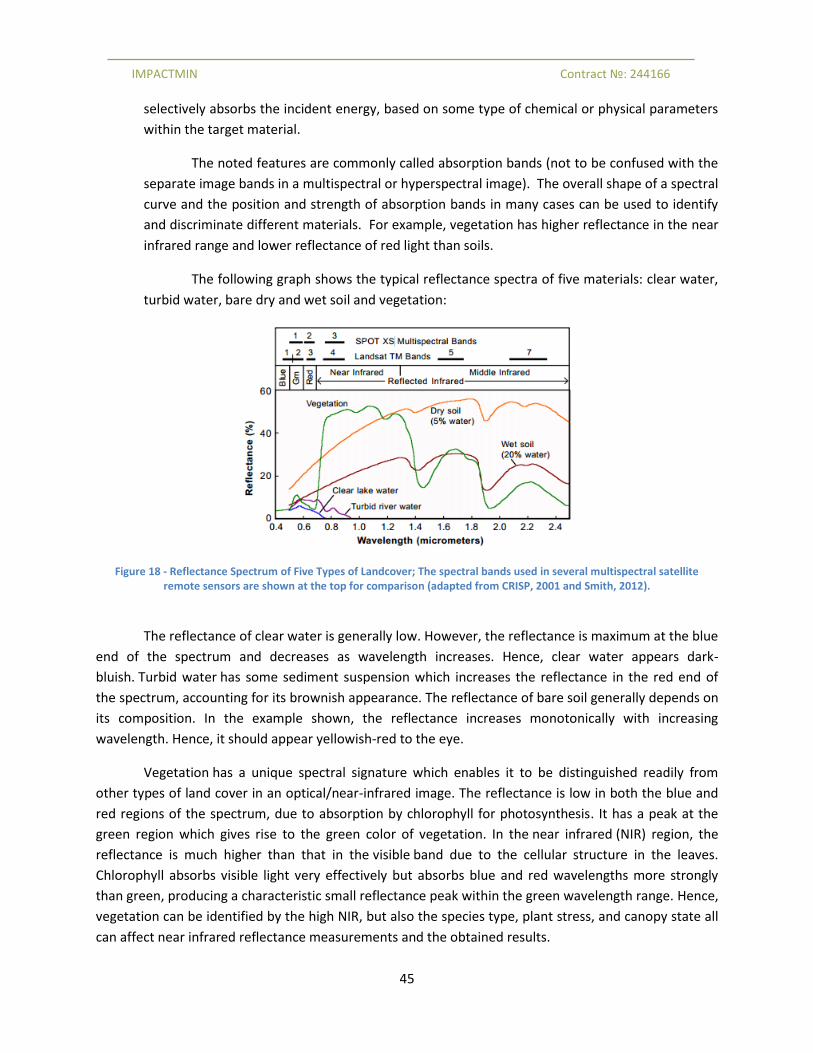
Figure 18 - Reflectance Spectrum of Five Types of Landcover; The spectral bands used in several
multispectral satellite remote sensors are shown at the top for comparison (adapted from CRISP, 2001
and Smith, 2012). ........................................................................................................................................ 45
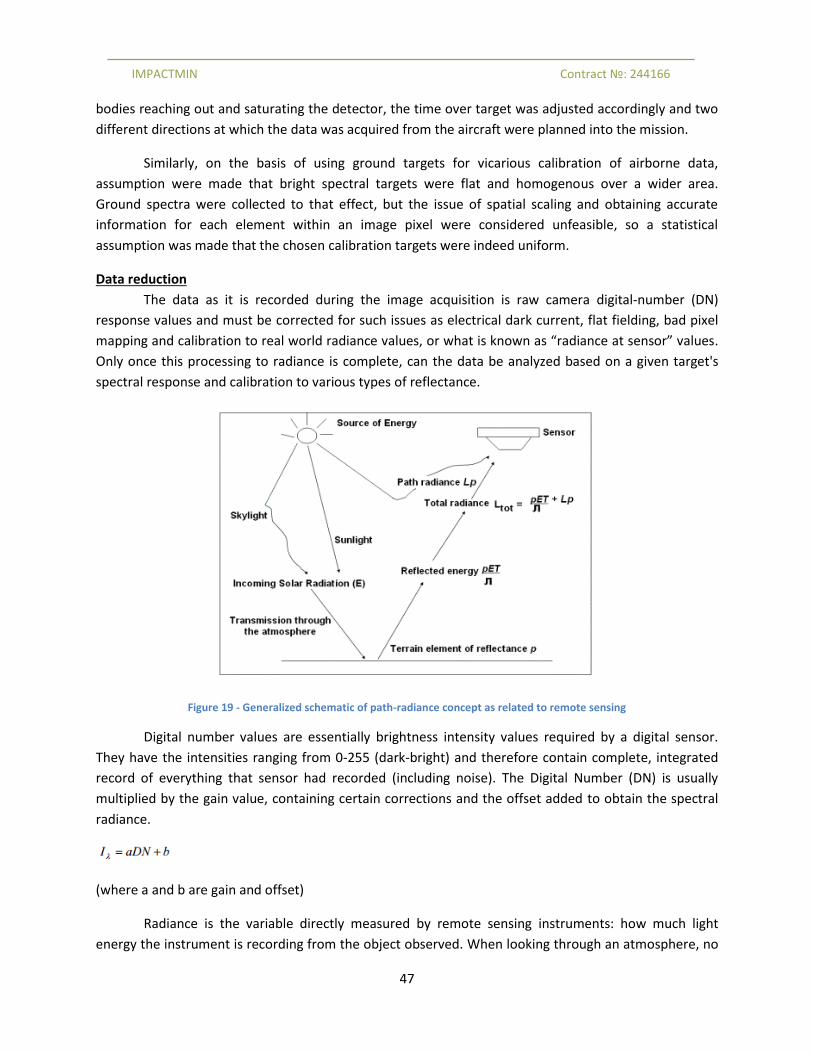
Figure 19 - Generalized schematic of path-radiance concept as related to remote sensing ..................... 47
Figure 20 - Flow chart for calibration of hyperspectral data ...................................................................... 48
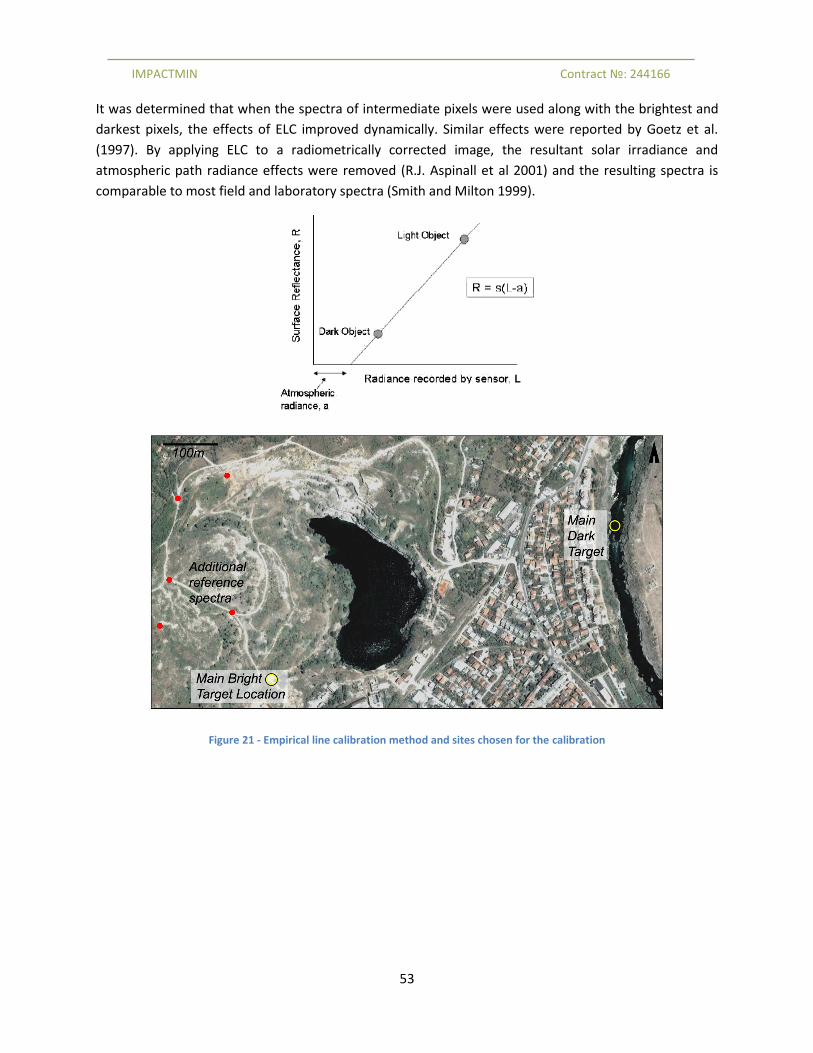
Figure 21 - Empirical line calibration method and sites chosen for the calibration ................................... 53
Figure 22 - Image showing the results of Land-cover classification ........................................................... 55
IMPACTMIN Contract №: 244166
7
Figure 23 - Color-intensity (EOS-B) coded NDVI image showing vegetation intensity (robustness) in the
Vihovici Mine area ...................................................................................................................................... 56
Figure 24 – Vihovici pit lake and Neretva river observed with Worldview 2 (left) imagery and
Smartplanes UAV digital airborne imagery (right) ...................................................................................... 58
Figure 25 - Left: WV2-colour composite image with the spectral samples plotted, and with the results of
the Spectral angle classification overlain. The inset shows the spectra of samples 19, 7 and 3. The
markers are color coded according to their ratio of r800/r880 ................................................................. 59
Figure 26 - Laboratory spectra of representative materials, resampled to WV2 band positions. ............. 60
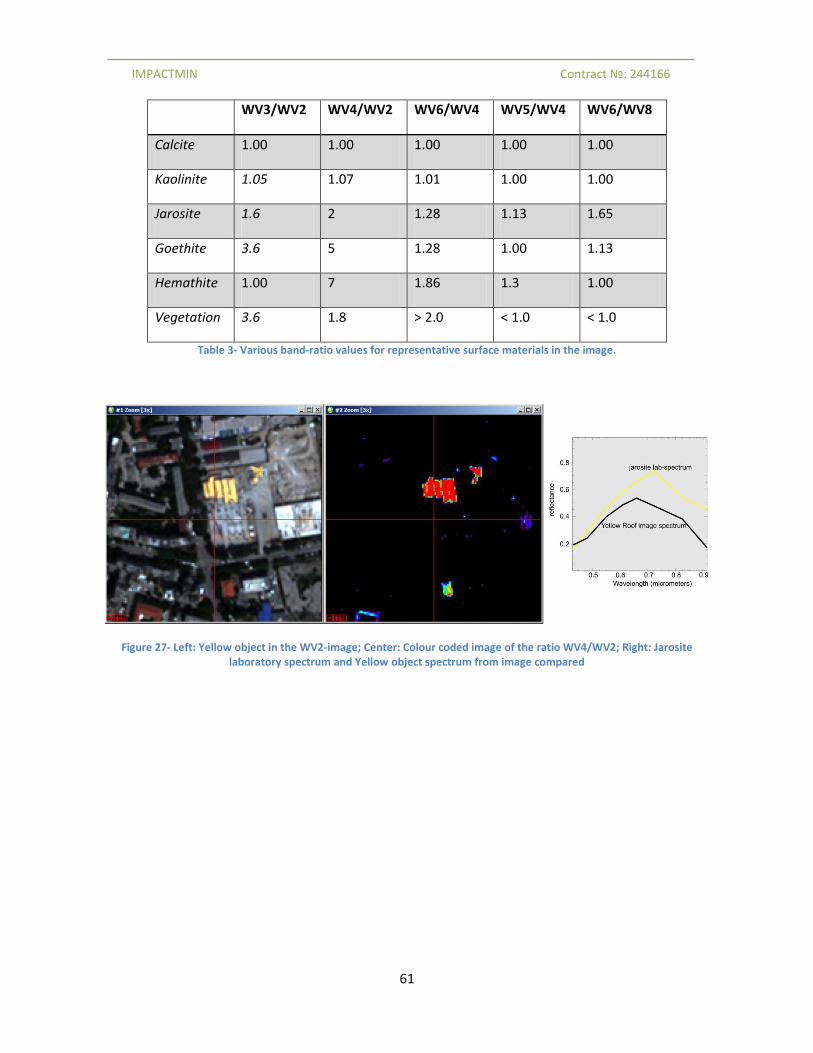
Figure 27- Left: Yellow object in the WV2-image; Center: Colour coded image of the ratio WV4/WV2;
Right: Jarosite laboratory spectrum and Yellow object spectrum from image compared ......................... 61
Figure 28 - Worldview 2 image with secondary Fe minerals abundance classes, derived using procedure
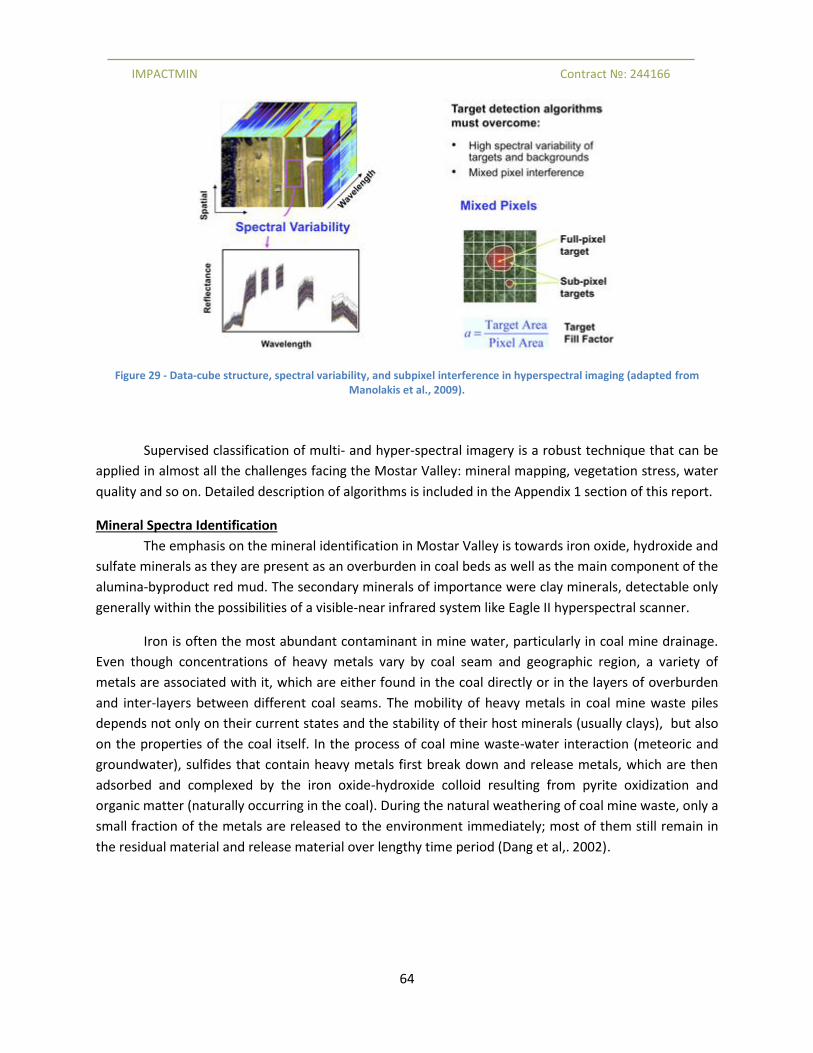
Figure 29 - Data-cube structure, spectral variability, and subpixel interference in hyperspectral imaging
(adapted from Manolakis et al., 2009). ...................................................................................................... 64
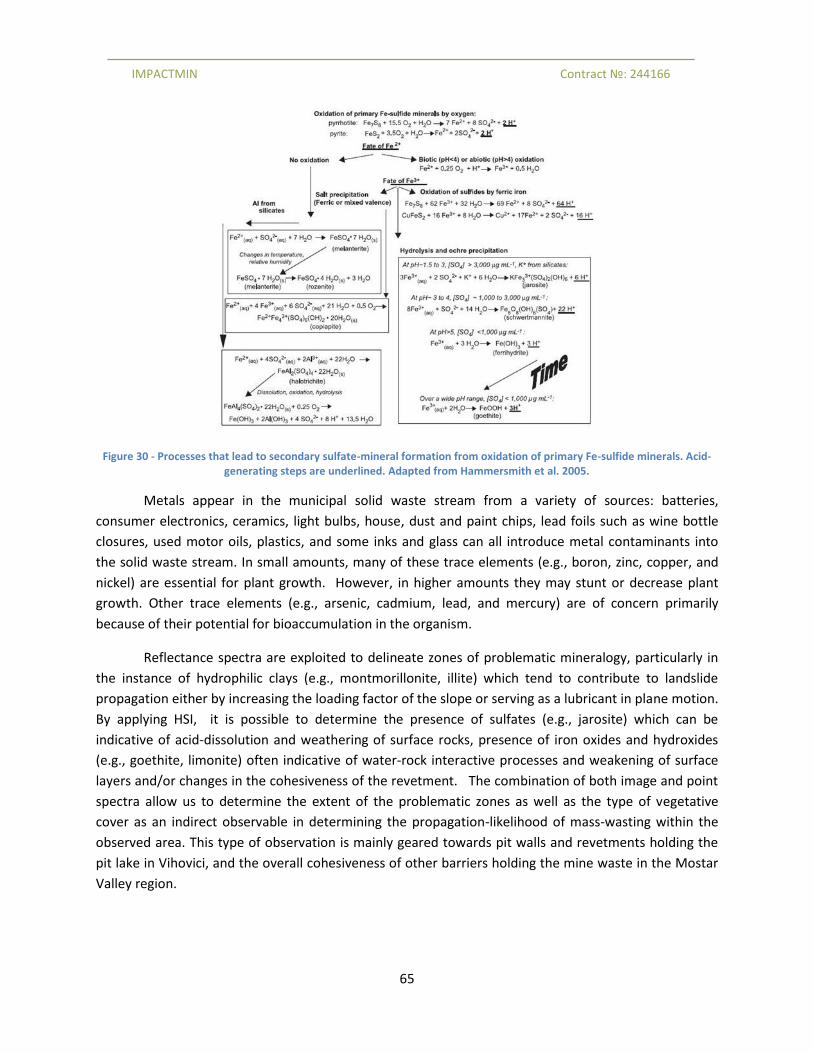
Figure 30 - Processes that lead to secondary sulfate-mineral formation from oxidation of primary Fe-
sulfide minerals. Acid-generating steps are underlined. Adapted from Hammersmith et al. 2005. ......... 65
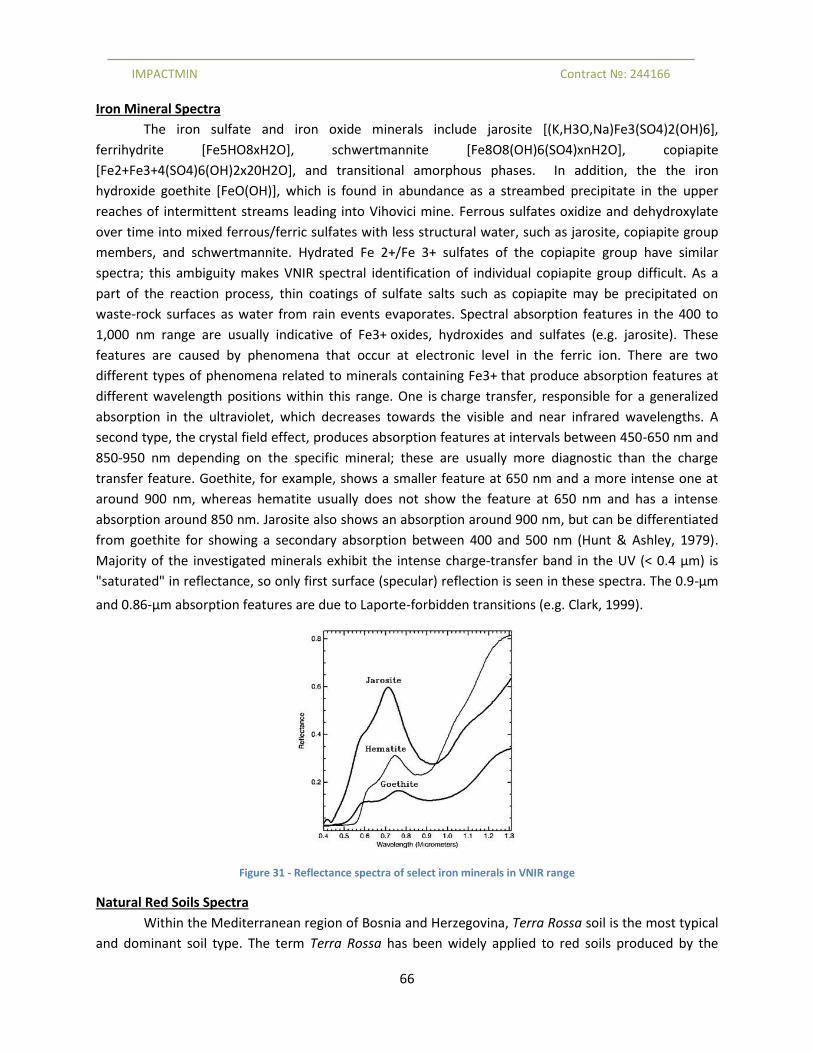
Figure 31 - Reflectance spectra of select iron minerals in VNIR range ....................................................... 66
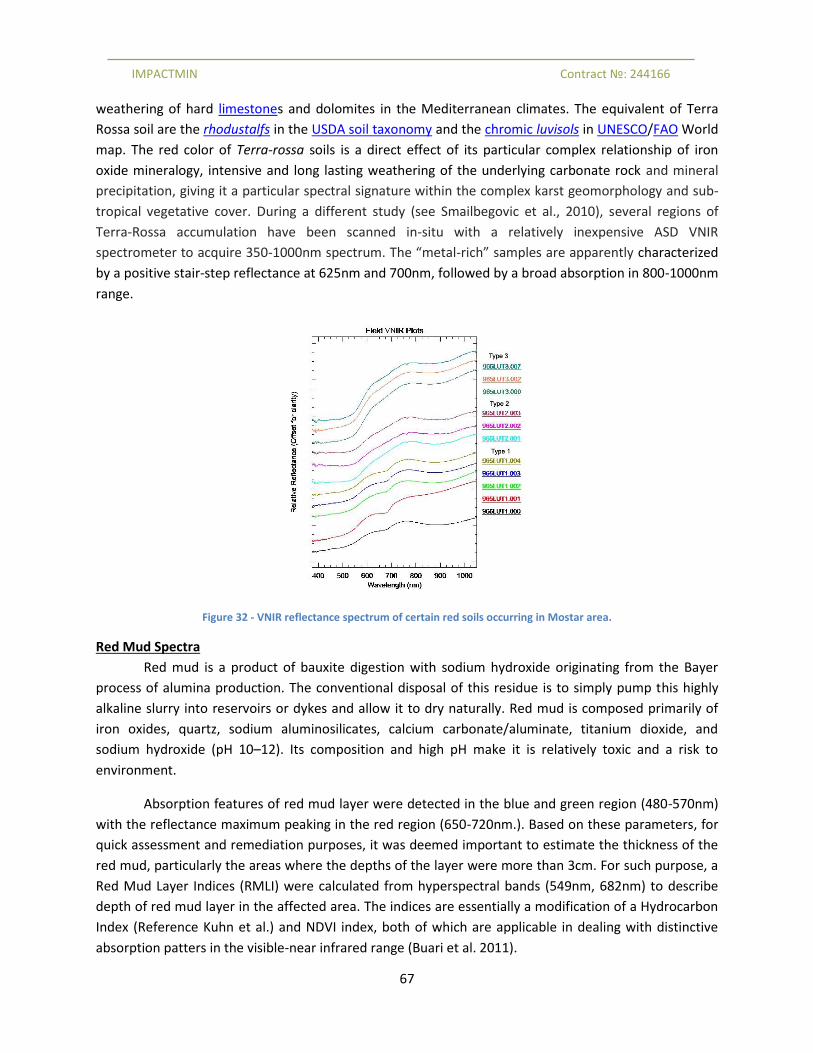
Figure 32 - VNIR reflectance spectrum of certain red soils occurring in Mostar area. ............................... 67
Figure 33 - VNIR reflectance spectrum of red mud .................................................................................... 68
Figure 34 - Scatter plot of 549nm and 682nm wavelengths of affected study area (28,900pixel). A
ellipsoid represents dry and moderated wet (50-92%) red mud, B ellipsoid represents red mud with high
wet content (less than 50%). ...................................................................................................................... 68
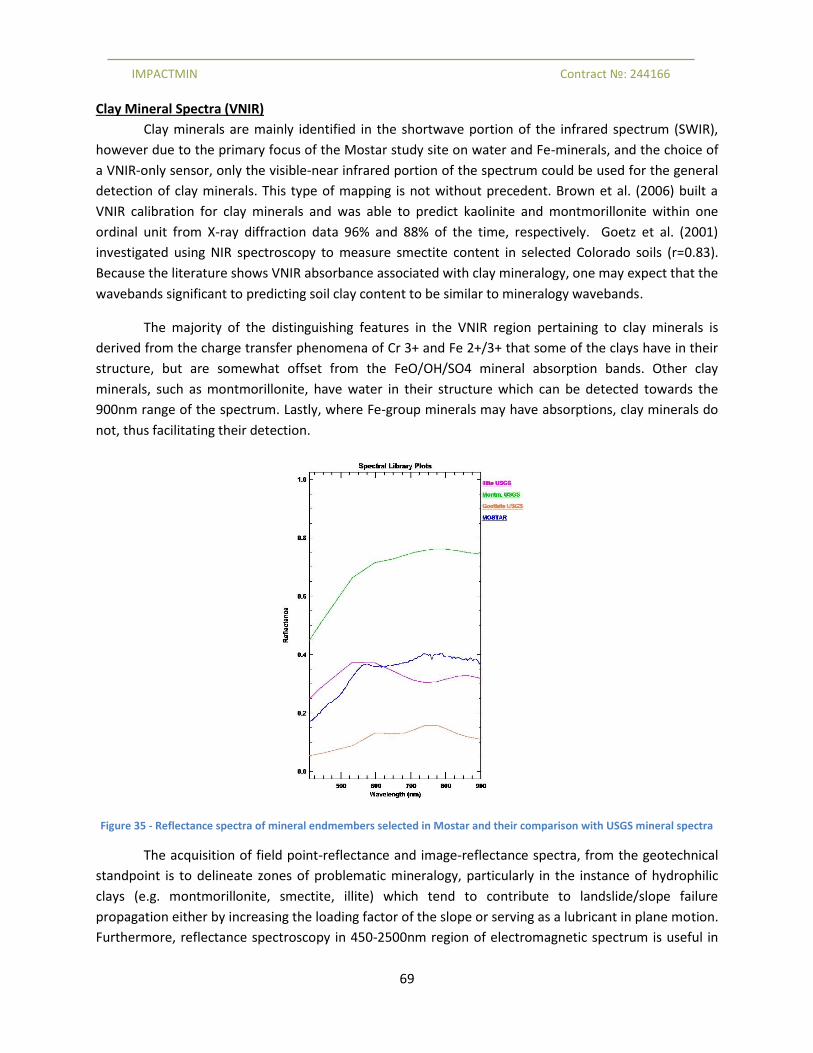
Figure 35 - Reflectance spectra of mineral endmembers selected in Mostar and their comparison with
USGS mineral spectra .................................................................................................................................. 69
Figure 36 - Reflectance spectra of mineral endmembers at Vihovici and Red Mud site............................ 70
Figure 37 - Distribution of mineral species at Vihovici, mapped with airborne HSI ................................... 72
Figure 38 - Distribution of mineral species and relationship to some of the mapped structures and
geotechnical observations, north side of Vihovici pit. ................................................................................ 74
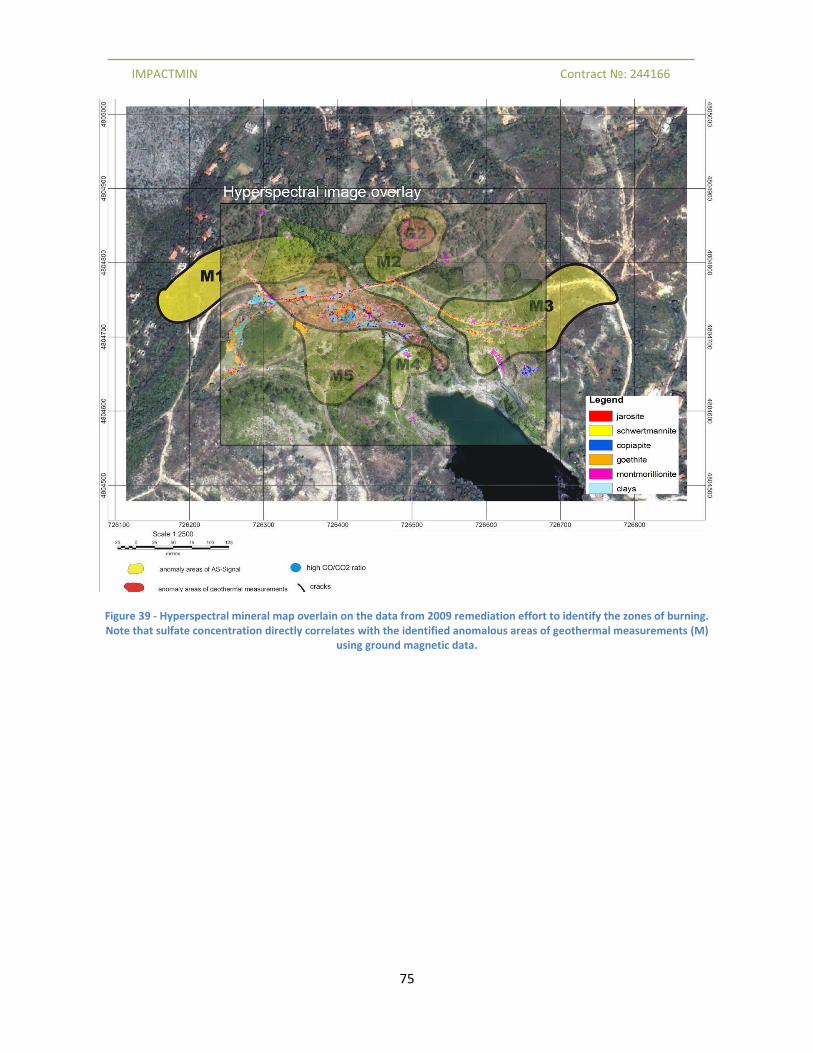
Figure 39 - Hyperspectral mineral map overlain on the data from 2009 remediation effort to identify the
zones of burning. Note that sulfate concentration directly correlates with the identified anomalous areas
of geothermal measurements (M) using ground magnetic data................................................................ 75
Figure 40 - Vegetation stress identified using senescence index (left) and same image overlain on the
base of CO2 measurements from KfW report (2009). Note vegetation stress correlating with the areas of
increased CO2 concentration. .................................................................................................................... 76
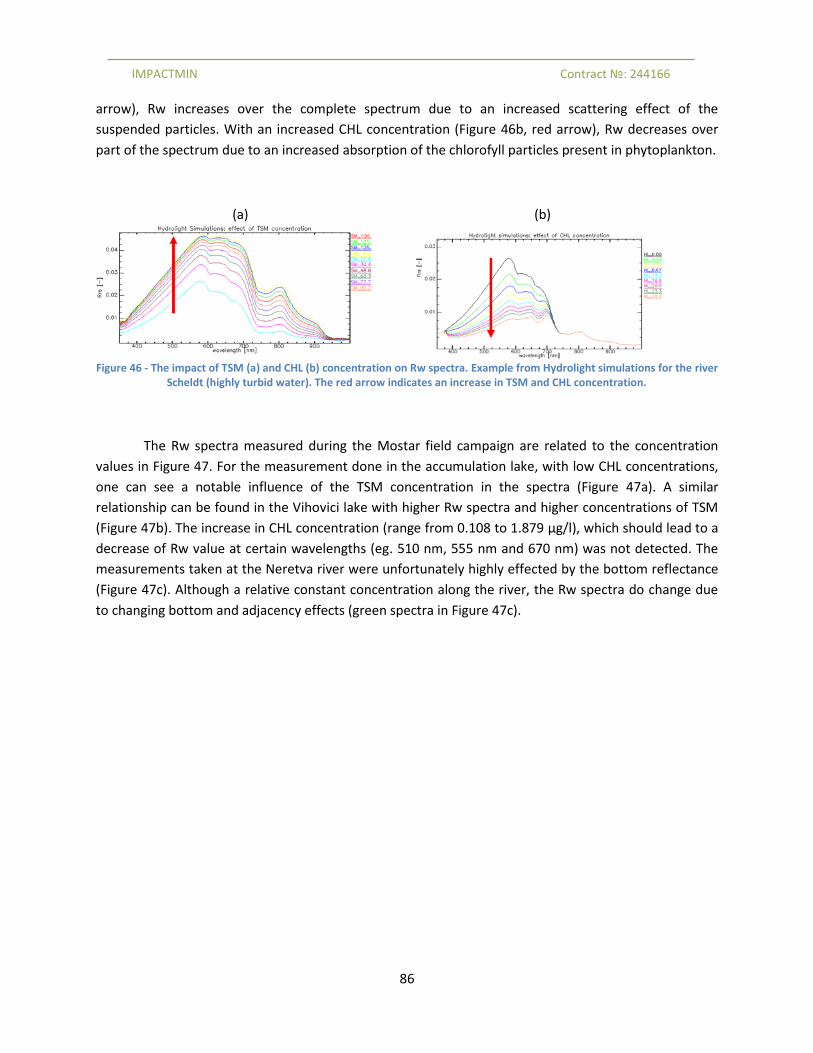
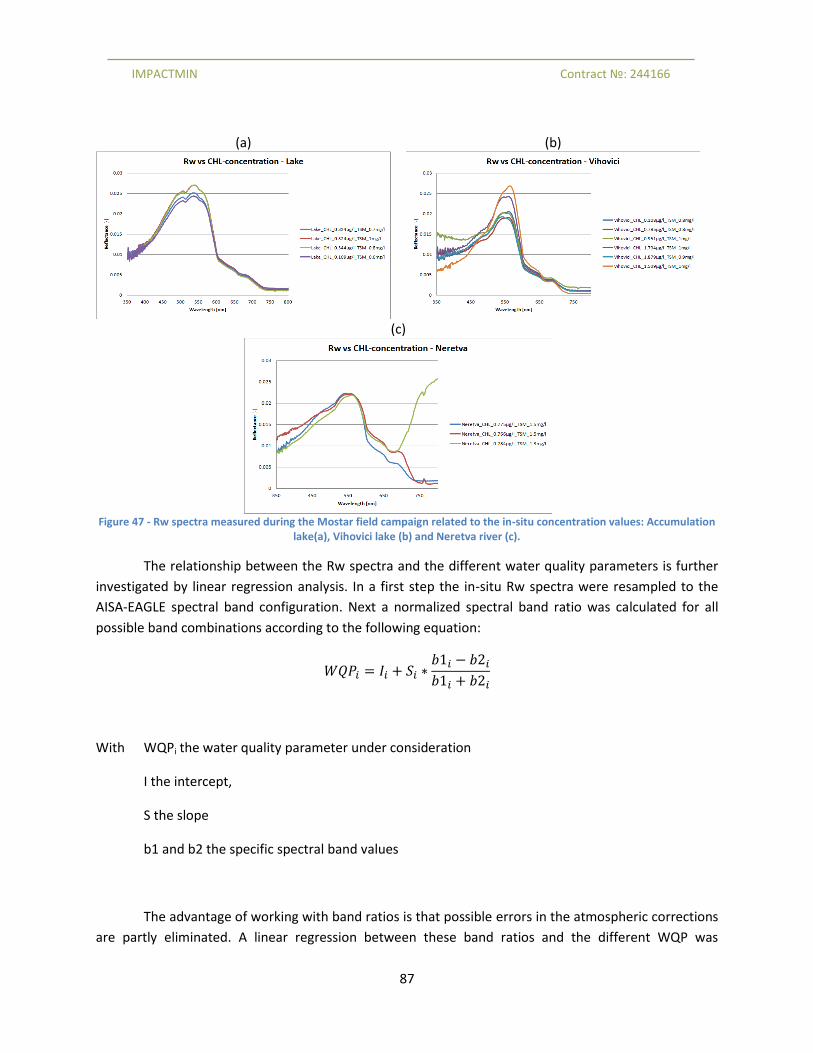
Figure 47 - Rw spectra measured during the Mostar field campaign related to the in-situ concentration
values: Accumulation lake(a), Vihovici lake (b) and Neretva river (c). ....................................................... 87
Figure 48 - Band ratio significance plot: R2 of the linear regression between the band ratio and TSM(a),
CHL-a (b), Nitrites (c), Nitrates (d), Total Nitrogen (e), Total Phosphorus (f), Ortho-phosphorus (g),
Cadmium (h), Lead (i) and Iron (j). .............................................................................................................. 89
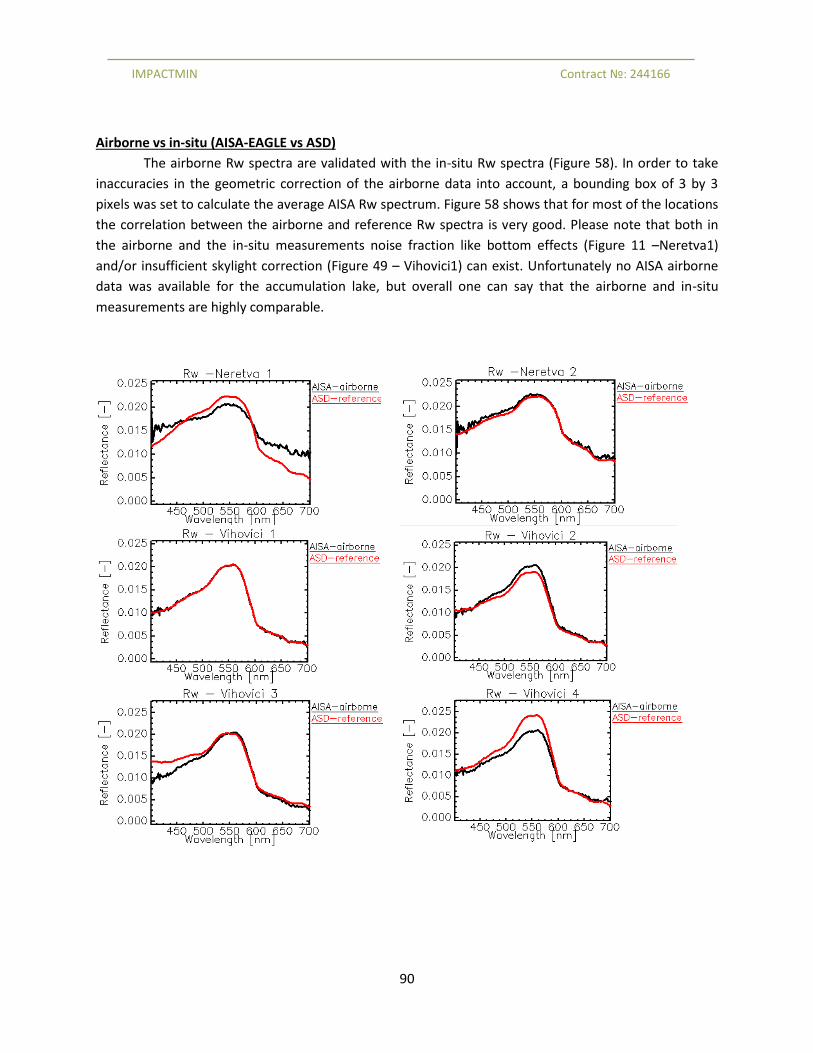
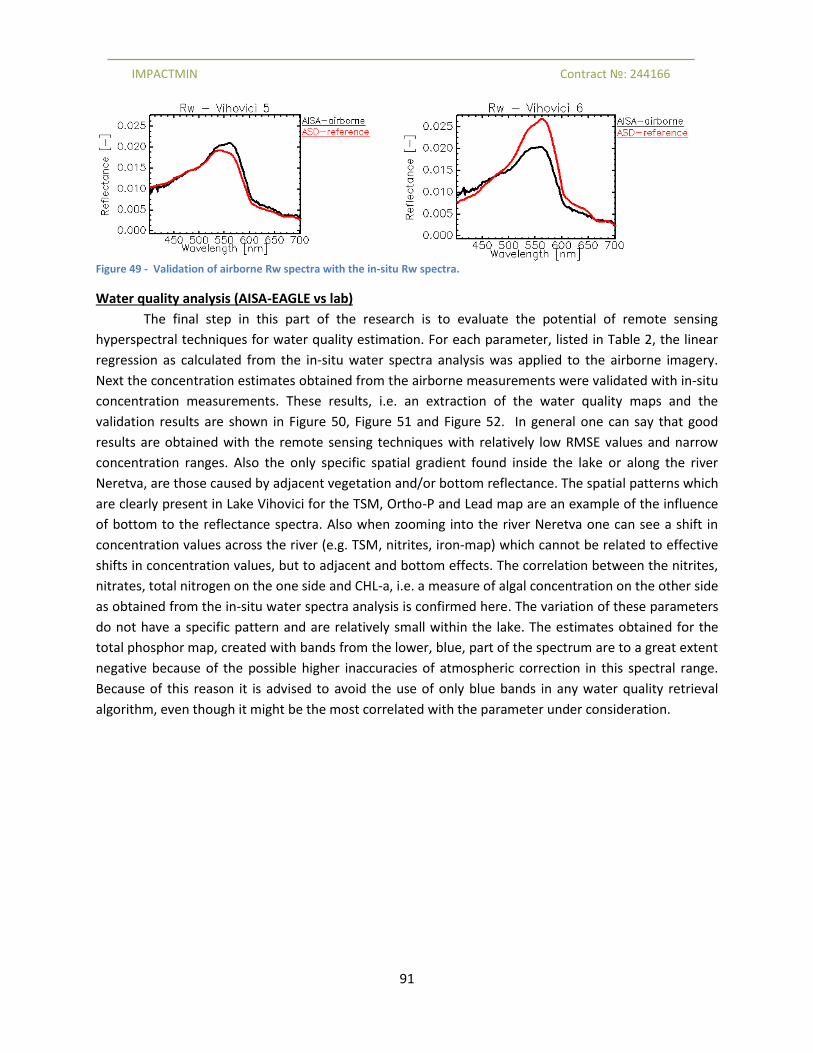
Figure 49 - Validation of airborne Rw spectra with the in-situ Rw spectra. .............................................. 91
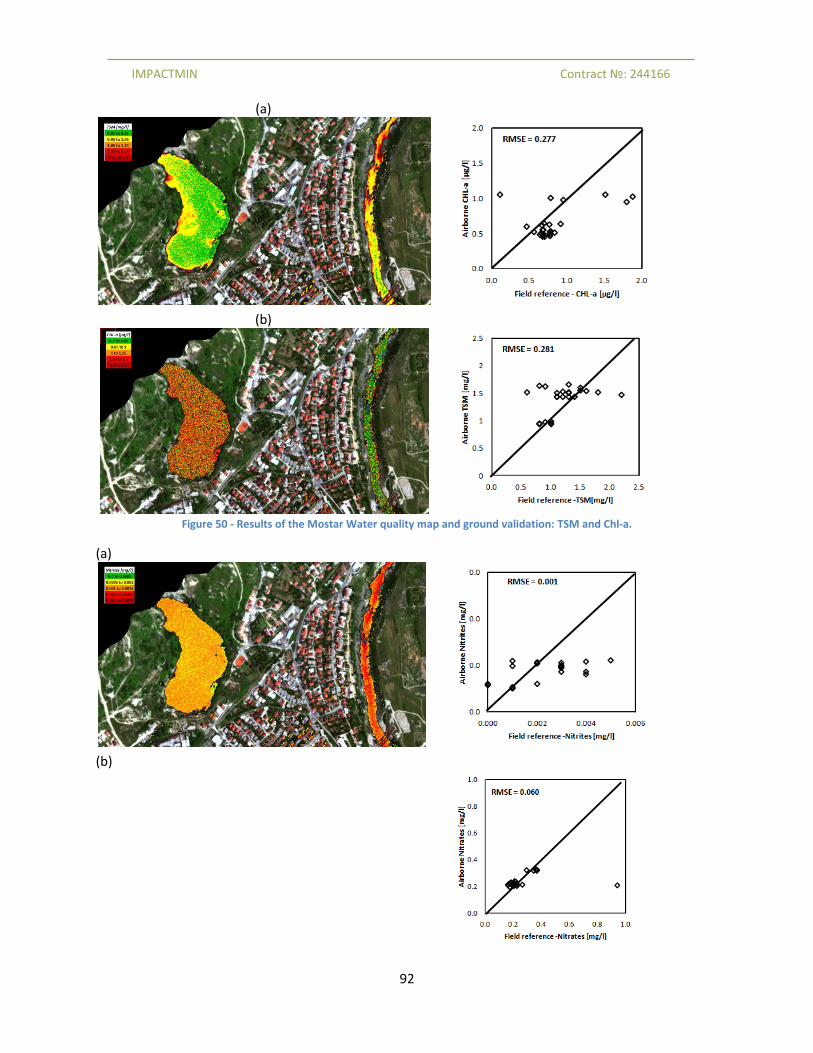
Figure 50 - Results of the Mostar Water quality map and ground validation: TSM and Chl-a. .................. 92
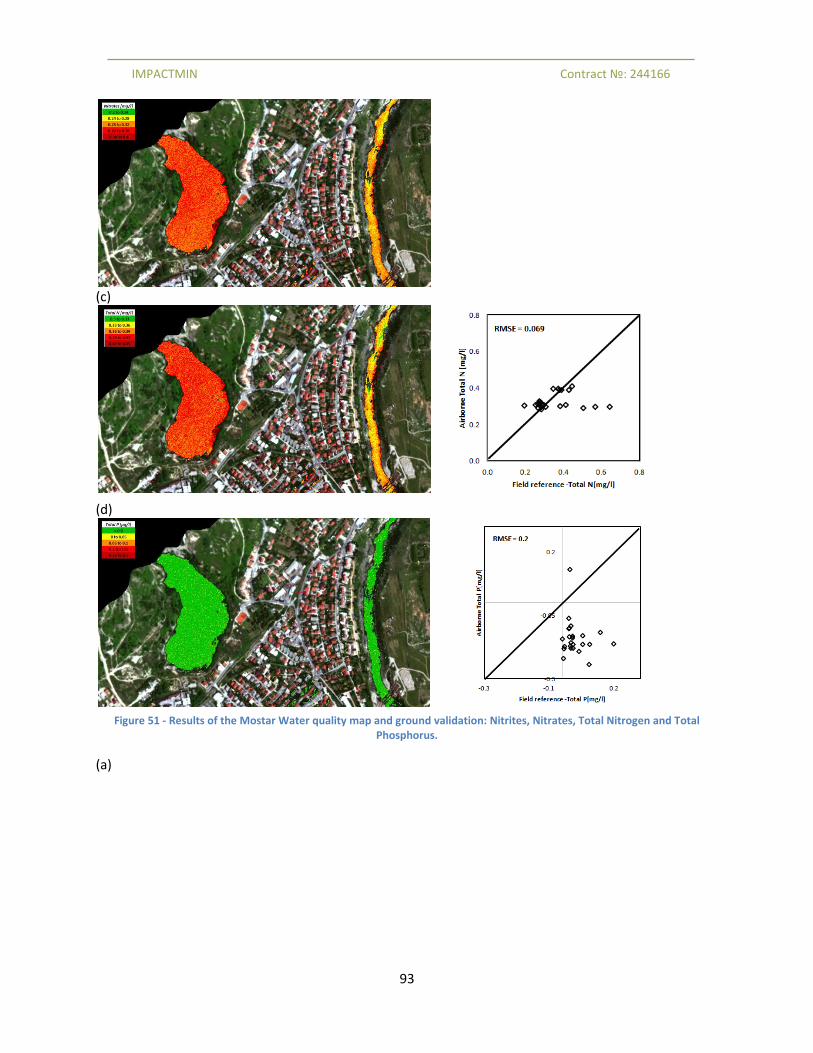
Figure 51 - Results of the Mostar Water quality map and ground validation: Nitrites, Nitrates, Total
Nitrogen and Total Phosphorus. ................................................................................................................. 93
Figure 52 - Results of the Mostar Water quality map and ground validation: ortho Phosphor, Cadmium,
Lead and Iron. ............................................................................................................................................. 95
Figure 53 Map of Chl-a distribution ............................................................................................................ 96
Figure 54 Map of TSS distributions ............................................................................................................. 96
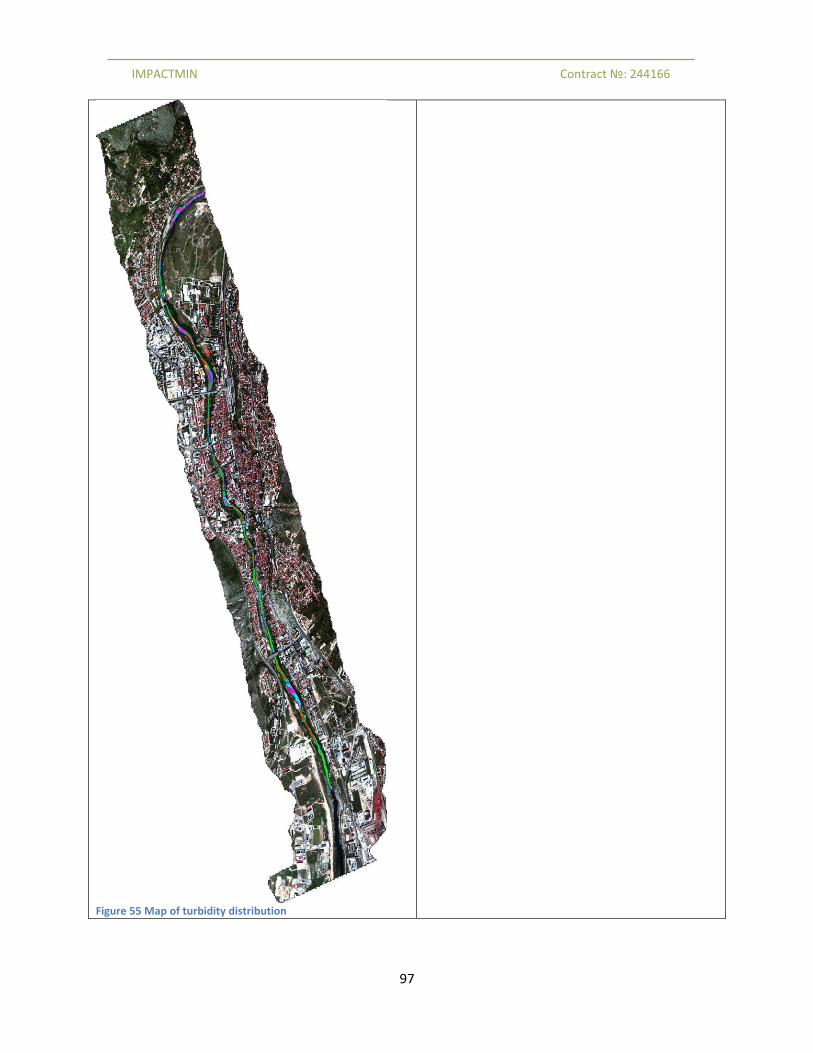
Figure 55 Map of turbidity distribution ...................................................................................................... 97
Figure 56 Map of Chl-a distribution ............................................................................................................ 98
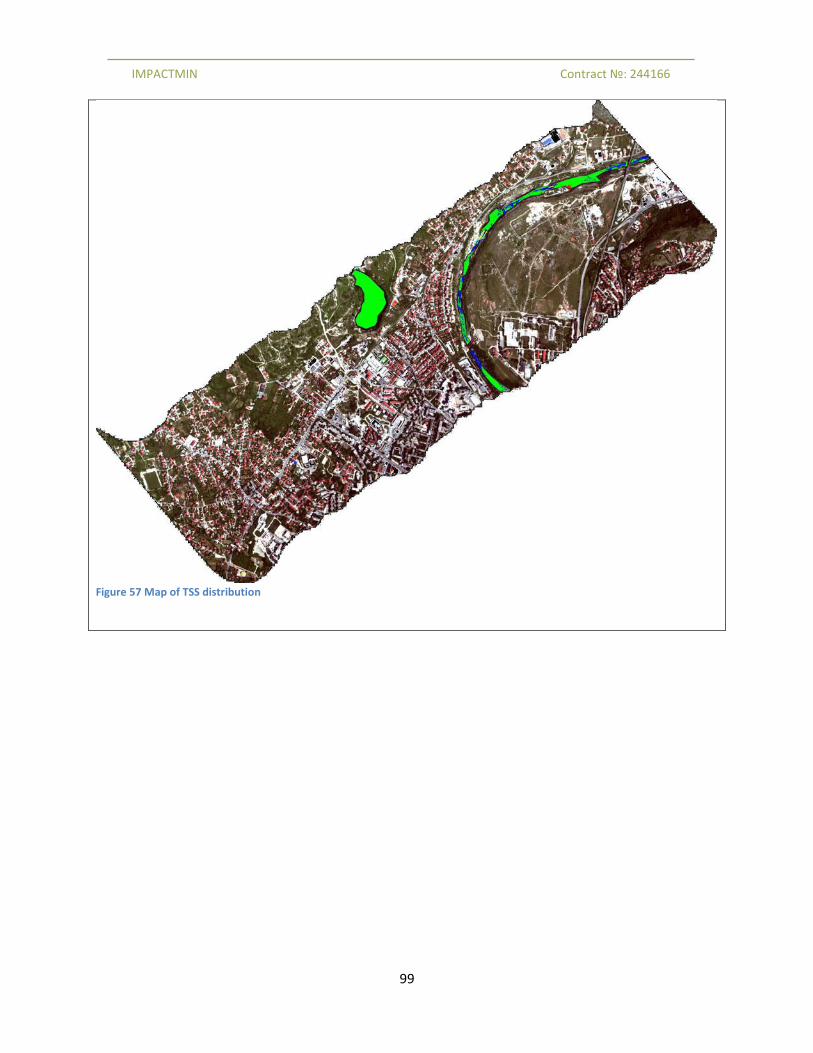
Figure 57 Map of TSS distribution ............................................................................................................... 99
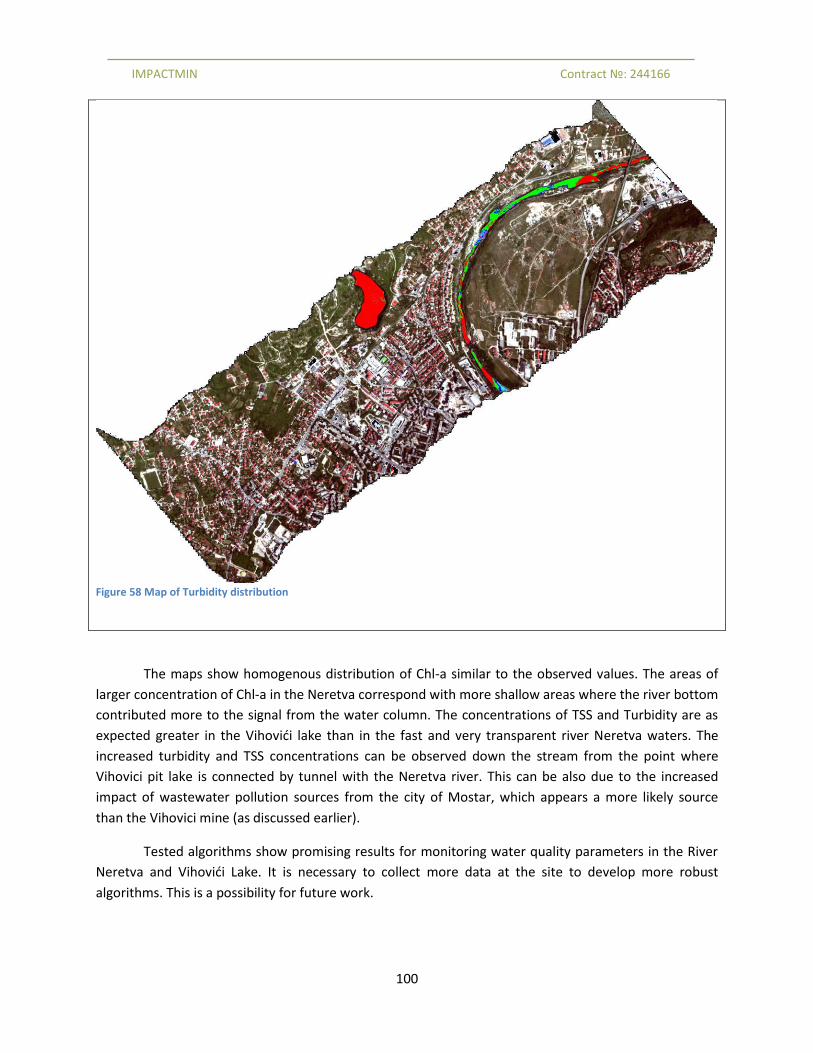
Figure 58 Map of Turbidity distribution .................................................................................................... 100
Figure 59 - Chlorophyll concentration from water chemistry data (all stations) ..................................... 102
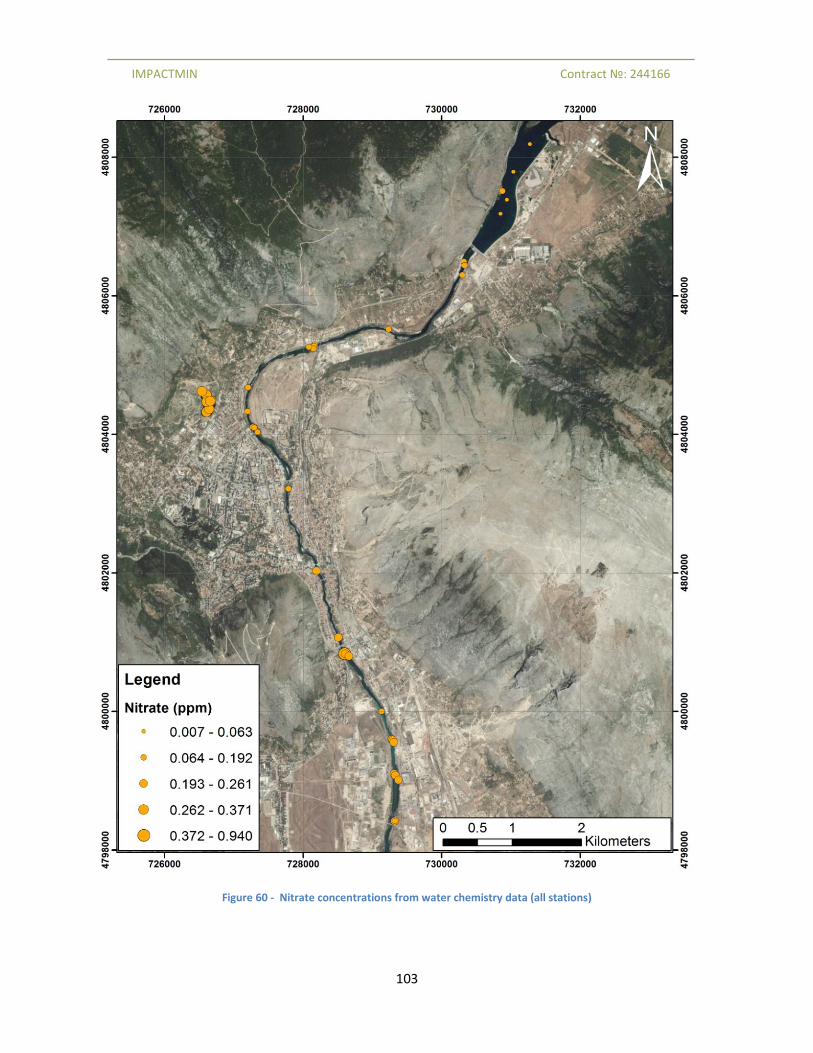
Figure 60 - Nitrate concentrations from water chemistry data (all stations) .......................................... 103
Figure 61 - Phosphorus concentrations from water chemistry data (all stations) ................................... 104
Figure 62 - Fe concentration at Vihovici pit lake and Neretva River ........................................................ 105
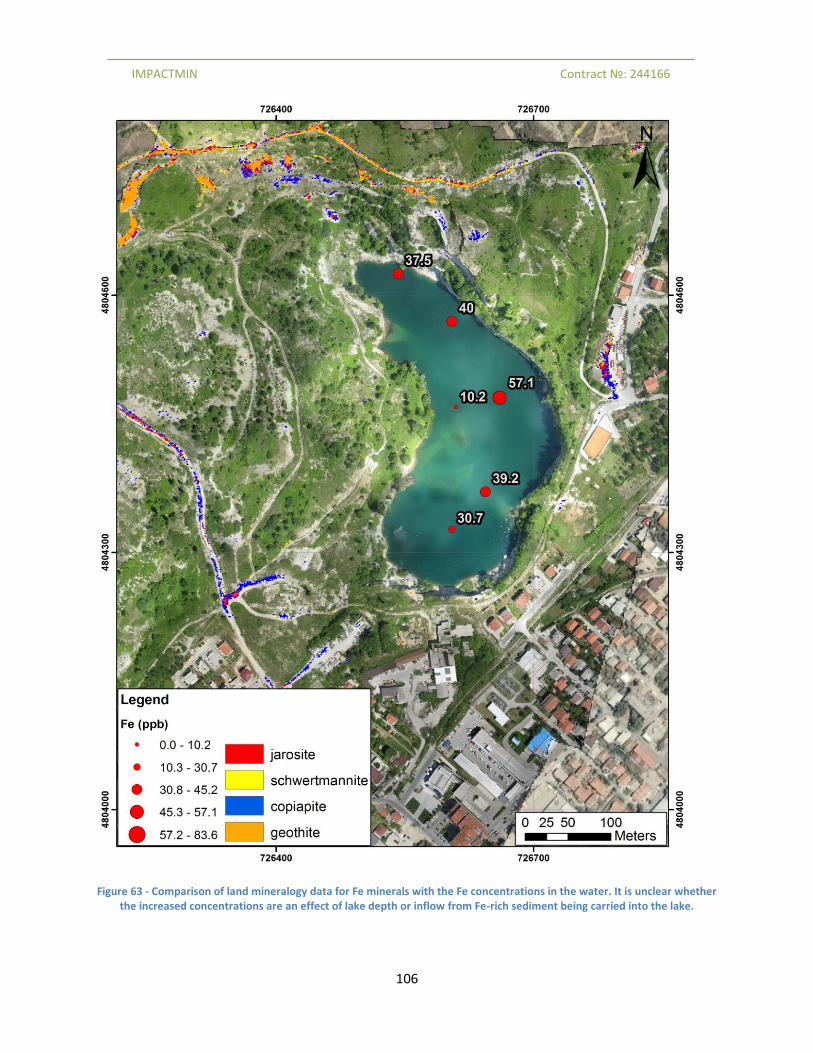
Figure 63 - Comparison of land mineralogy data for Fe minerals with the Fe concentrations in the water.
It is unclear whether the increased concentrations are an effect of lake depth or inflow from Fe-rich
sediment being carried into the lake. ....................................................................................................... 106
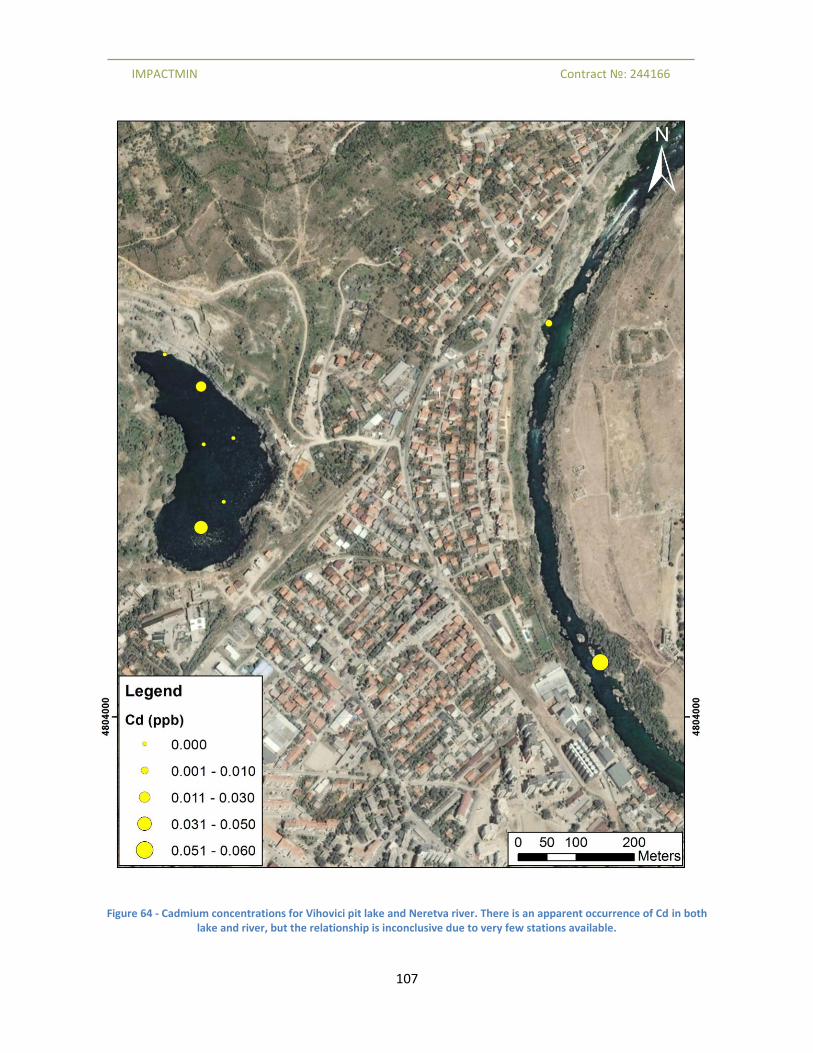
Figure 64 - Cadmium concentrations for Vihovici pit lake and Neretva river. There is an apparent
occurrence of Cd in both lake and river, but the relationship is inconclusive due to very few stations
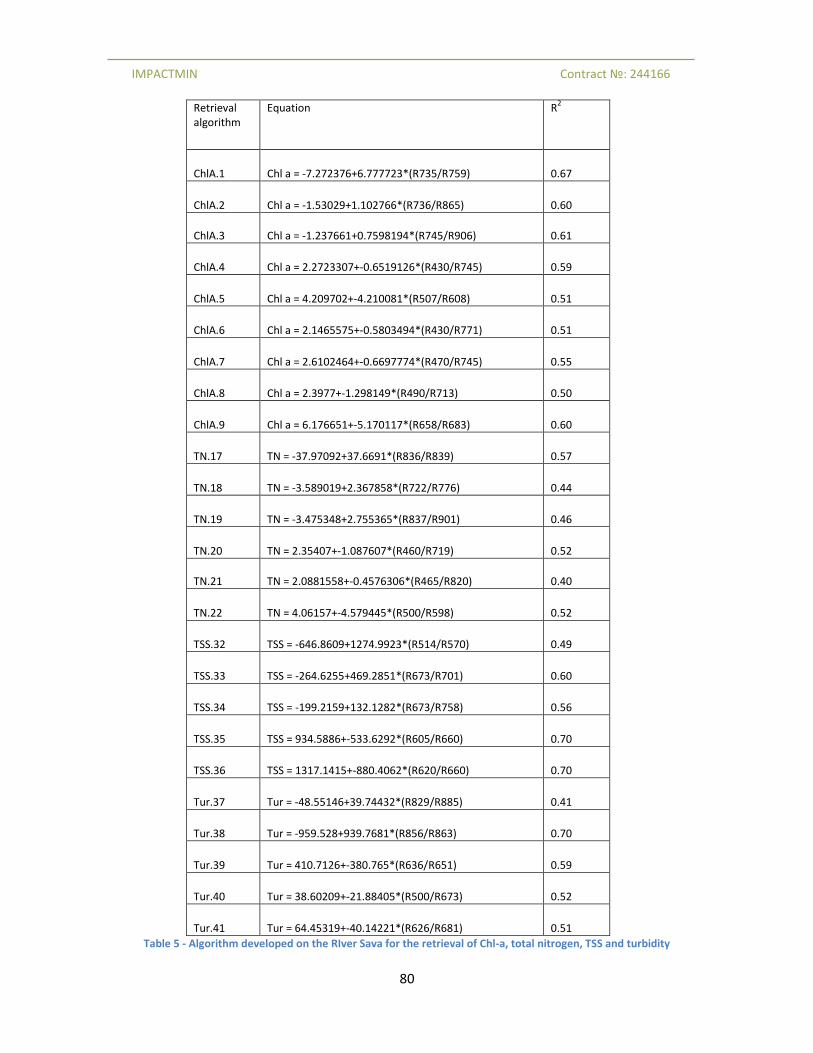
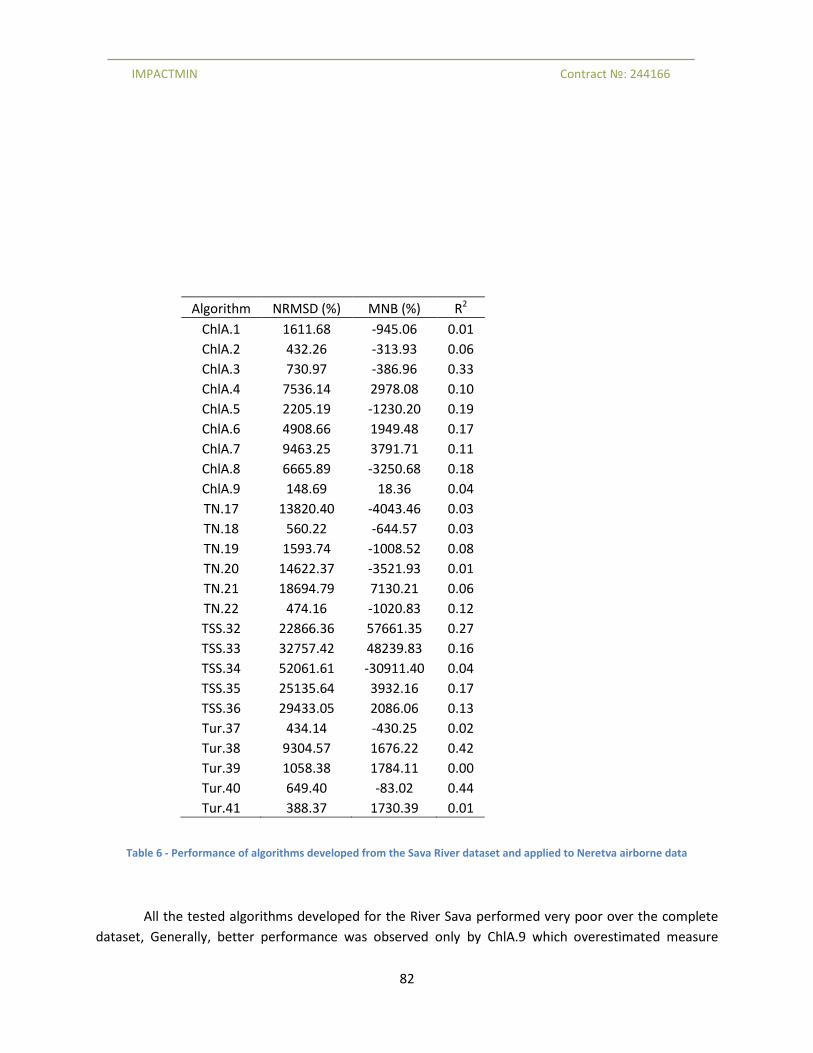
Table 6 - Performance of algorithms developed from the Sava River dataset and applied to Neretva
airborne data .............................................................................................................................................. 82
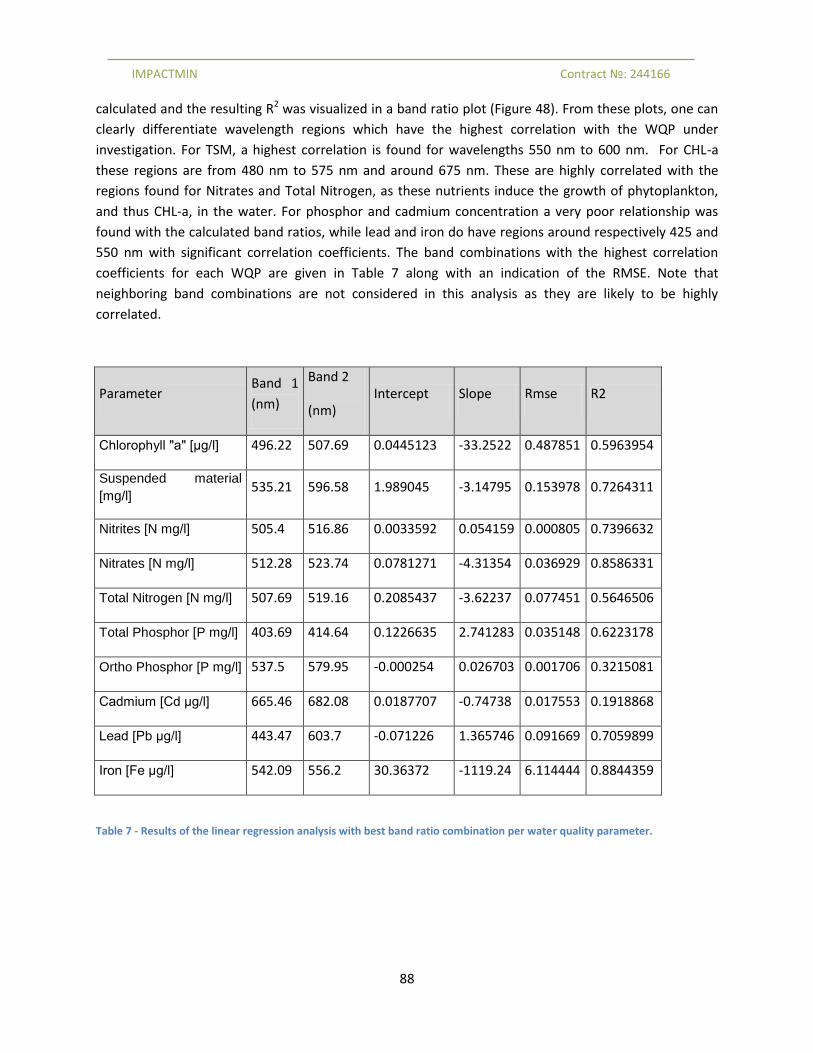
Table 7 - Results of the linear regression analysis with best band ratio combination per water quality
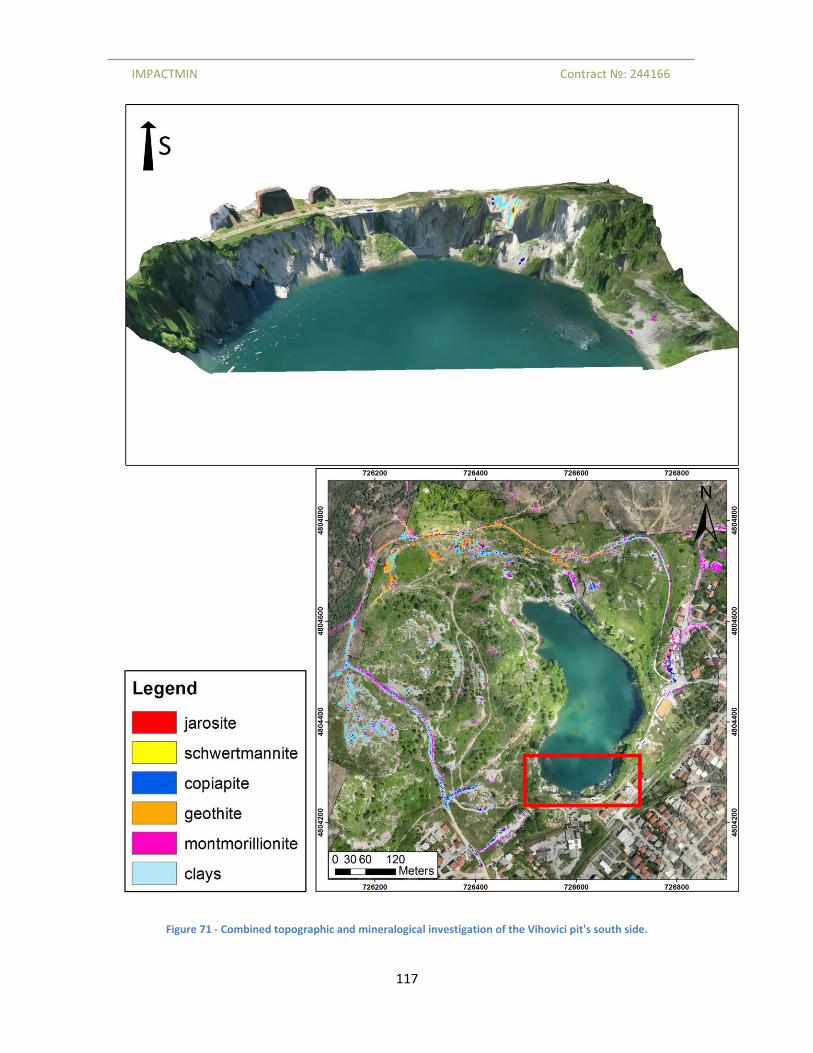
As a result of rehabilitation efforts and political solutions, Vihovici are no longer,
officially, used as a landfill; some of the open waste previously deposited at Vihovici was
collected, and buried elsewhere on site, while a 10-30cm layer of topsoil was dumped over the
other areas where the dumping has taken place. However, at the time of the field visits, it was
discovered that the site is still being used for illegal dumping of various household waste,
automobile parts, electronics and so on. Granted, the quantity of the deposited material is
nowhere close to the previous levels, but significant quantities of waste-material still find a way
to Vihovici.
The problem of the former mine increased when it was transformed into an unregulated
municipal waste-dump and when the underground coal (and organic material) fires ignited,
spewing hazardous gas in the middle of an urban area. The area was ameliorated in 2007-2009
through the combined municipal and international assistance effort (see KFW reports 2007 and
2009). However no follow-up has been performed to see how effective these remediation
efforts were. This report will intend to lay out the case and need for continued monitoring of a
former mine and associated areas in the Mostar valley and their overall impact to the
environment.
- Neretva River
The Neretva River is the largest tributary of the eastern part of the Adriatic basin,
draining the southern karst region of Dinaric Alps. The Neretva’s basin extends inland for
approximately 220 km long, of which only about 20 km lies within Croatia from the mouth of
Neretva on the Adriatic Sea to the border between Croatia and BiH at the city of Metkovic.. It
covers the area of about 10,380 km2 and stretches from the Adriatic coast in Mali Ston Bay to
the southeastern highlands of Dinarides, namely mountains Zelengora and Lelija on the south
and Treskavica on the east. Neretva's hydrographic system has created potential for intensive
underground and surface drainage system of rainwaters. It drains substantial parts of southern
and central Dinarides, the area that is itself characterized by abundant precipitation throughout
the year. Neretva is considered to be one of the longest and hydrologically richest rivers in
Bosnia and Herzegovina with specific runoff of 43,2 l/s/km2. Neretva’s annual water flow
averages 8,830,000,000 m3, based on the total average measurement of gaging stations along
its course in Bosnia and Herzegovina (Federal Hydrometeorological Institute, Bosnia and
Herzegovina). In addition to meeting the society's requirements for drinking water, sanitation
and general household uses, Neretva provides a medium for commercial fisheries. It is also
IMPACTMIN Contract №: 244166
14
extensively used for agricultural and industrial production, including production of electrical
power, as well as recreational purposes.
Intensive urban and industrial development, agriculture and hydropower plant construction and
other hydro-technical structures had great impact on ecosystems in some parts of the Neretva river
basin. Due to its canyon character, the river’s middle course is used for hydro-energy (6
hydropower plants with the reservoirs Jablanica, Rama, Grabovica, Salakovac, Mostar and Capljina).
Several towns are situated along the Neretva river, with the largest municipality being Mostar
(estimated population 111,249 in 2011 and expected to rise to 120,000 by 2015). Industrial plants
are mainly situated at bigger settlements (primarily food processing, agriculture, aluminium, lumber,
construction material and light industry). Most settlements and industrial capacities have no
wastewater treatment and discharge their wastewater directly into the river without even stage 1
treatment. The most critical problems are:
• Wastewater generated by 90% of the population is discharged directly without any treatment
into the closest water bodies or into karstic holes, which are connected to groundwater;
• Water supply systems cannot meet the needs of the consumers during the dry season due to a
combination of inadequate availability of water resources and inadequate capacity of the
infrastructure;
• Dumping sites where the waste is disposed are mostly placed near the river, and in most cases
are used without special protective measures.
- Red-mud facility
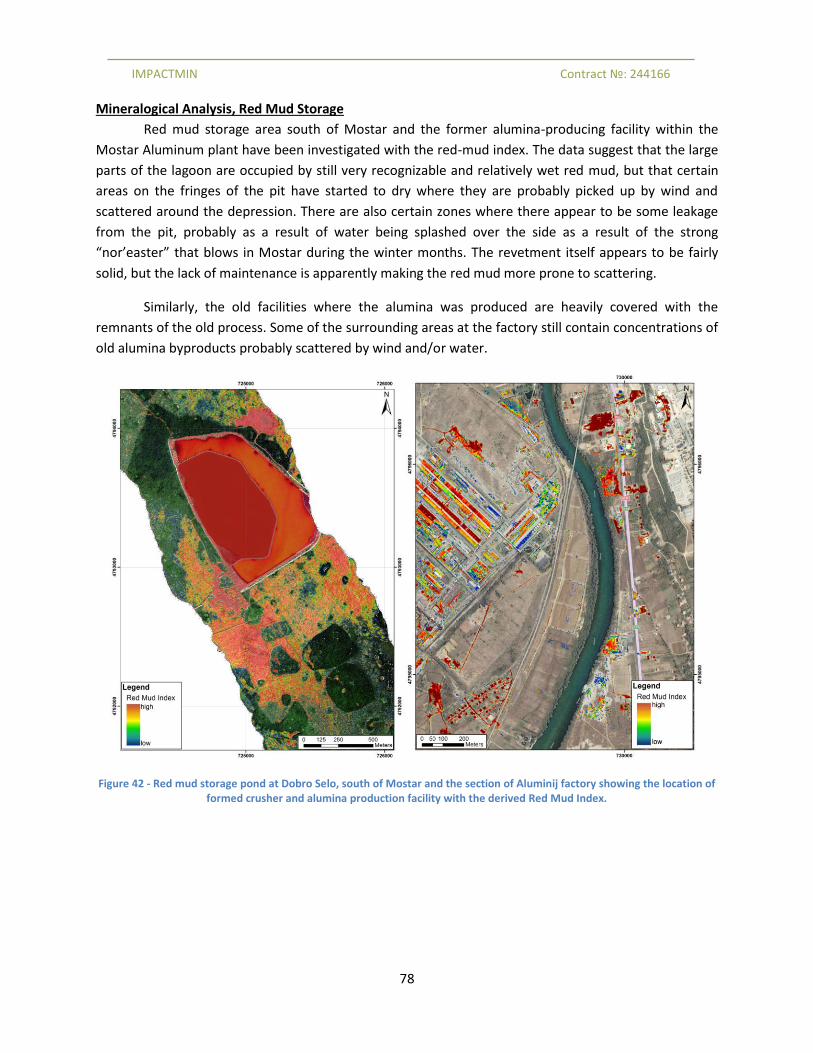
Red mud storage facility at Dobro Selo, southewest of Mostar has been used since 1980
to store the increased need for depositing byproducts of aluminum ore refining at the nearby
plant in Mostar. With the ramped-up production of aluminum to meet the needs of the
booming aircraft industry, approximately 10 million tons of bauxite-byproduct red mud has
been pumped to a cement-lined lagoon located in a small depression on the plateau above the
Mostar Valley (300m ASL). While the aluminum is still produced in Mostar, the refining of
bauxite ore has been terminated in 1992 at the outbreak of war. Since 1992, no new deposition
of red-mud had taken place at the locality and the facility is reportedly receiving some
maintenance from the aluminum plant in Mostar, mainly for dust mitigation and maintaining
proper levels of water in the lagoon.
The first phase was put in use in 1979 with the surface area of 302,830 m2 and total
capacity of 2.2 million m3. When the limits of the first phase were reached in 1984, the second
phase was started on the same surface, but increasing the initial revetment to accommodate
additional 2.4 million m3 of usable volume. The third phase had further increased the size of
concrete revetment adding additional surface area of 723,590 m2 and the total volume of 4.1
IMPACTMIN Contract №: 244166
15
million m3. The fourth and final phase was never completed due to the outbreak of the war. The
intended fill level of the lagoon was to be up to 1m of the surface rim to prevent the spillage of
waste above the revetment. The mud was pumped directly from the factory using two parallel
steel pipelines (200m diameter tubing): one for the red mud and one for the return of separated
water back to the factory.
Field visits of the site in 2011 had found the storage largely abandoned and in a rather
neglected state, however the condition of concrete revetments appear relatively solid. There
are various concerns in the wider community that in the case of a major seismic
movement/occurrence the somewhat-aged lagoon would collapse and dump considerable
amount of alkaline mud down to Neretva and beyond to the Adriatic Sea. Furthermore, the red-
mud is considered to be enriched with various heavy metals, so propagation of particulate dust
may have negative impact on the environment. The company operating the Aluminum factory
reportedly carried out investigation of water quality near the lagoon in 2008, measuring average
pH of 9.3 for the mud-saturated water, which is slightly alkaline, but has not carried out
additional tests on the red-mud itself. The company is reportedly paying rental/inconvenience
fees to the inhabitants of local settlement of Dobro Selo for the duration of the life of red-mud
storage facility.
- Aluminum Factory
The aluminum factory in Mostar began initially as a combined industrial facility for
processing the bauxite ore and then taking the raw alumina into production of aluminum
components. The facility was functioning in full capacity from 1977 – 1992, and was devastated
during the conflict in Bosnia and Herzegovina. In 1997, the process of reconstruction began and
only a portion of the facility has been renovated: the aluminum production facility, while the
bauxite refining and alumina production did not. The facility is currently operating nine inclined
furnaces for aluminum production, two in the capacity of 25 tons and seven in the capacity of 35
tons of alumina. To support the integral production, the facility also has a fuel-oil fired furnace
for anode roasting, producing about 70,000 tons per year of baked anodes. The facility releases
waste water to Neretva via a single waste-water collector, with the reported discharge rate of
2474 Equivalent Number of Inhabitants (ENI), which translates to about 5,641,000 m3 of waste-
water annually.
- Defense industry
Due to proximity of aluminum production facilities, aviation facilities and ample work-
force, Mostar has been a center of aerospace and chemical industry in former Yugoslavia. The
most prominent facilities were Soko Mostar, an aircraft factory and Military-Technical Institute
(MTI), a chemical weapons factory. Both facilities were set up in the late 1950s and continued
until 1992. It is unclear whether any effect is left by the factories, but as they were located
within the flight path and proximity of river Neretva, they are noted in the report.
IMPACTMIN Contract №: 244166
16
A Barter Agreement was signed with the Mayor of Mostar before the first Interim meeting in
Split (February, 2011), stating the cooperation between the ImpactMin consortium and the municipality
of Mostar during and after the project. The signed document illustrates the interest from the end-user
(City of Mostar) for this type of an integrated, multi-disciplinary project aimed towards raising the level
of understanding on the ongoing problems facing the inhabitants of Mostar Valley.
IMPACTMIN Contract №: 244166
17
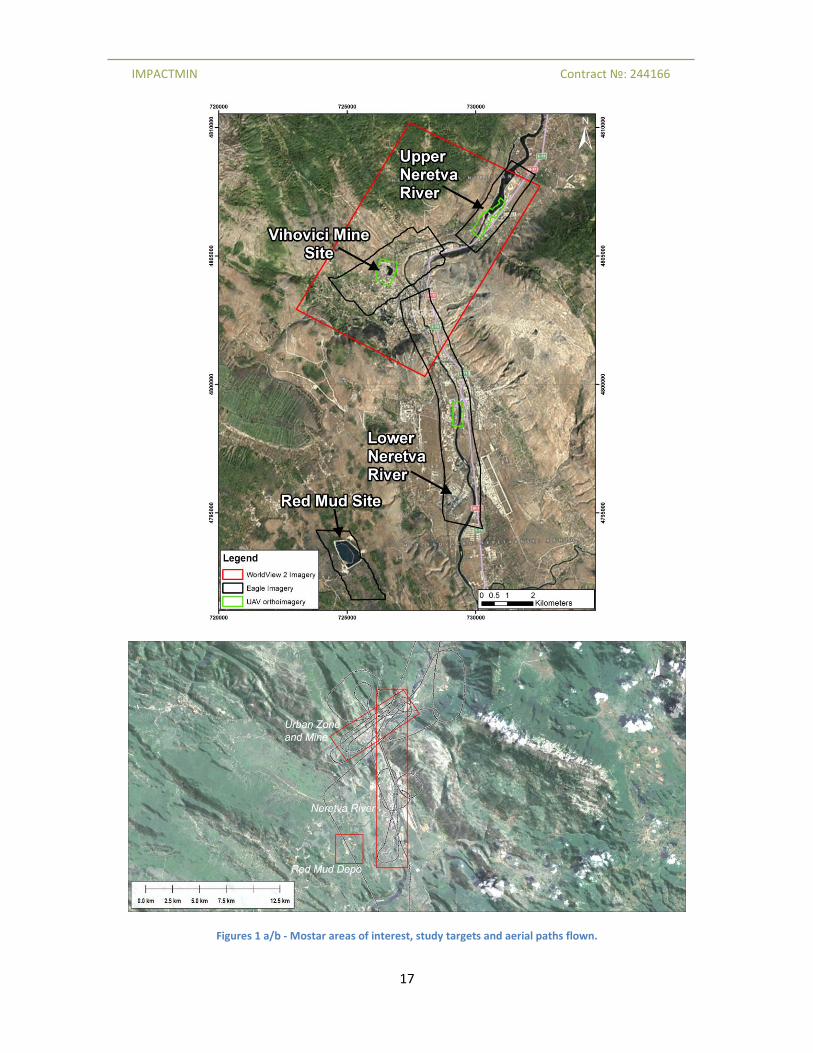
Figures 1 a/b - Mostar areas of interest, study targets and aerial paths flown.
IMPACTMIN Contract №: 244166
18
Area and Physiography
Area location
The City of Mostar is located in Mostar Valley, within Herzegovina-Neretva Canton (County) of
the Federation of Bosnia and Herzegovina, one of two entities comprising the modern-day makeup
of Bosnia and Herzegovina, post Dayton Peace Accords (1995). The region is located in the southern
part of Bosnia and Herzegovina, about 100 km south of Sarajevo, the Capital. Mostar is estimated to
be the 6th largest municipality in the country, but due to massive migrations during the 1992-1995
conflict and lack of a state-wide official census, it is almost impossible to determine the current
population in Bosnia, and the estimates are often exaggerated for political purposes, or local
rivalries.
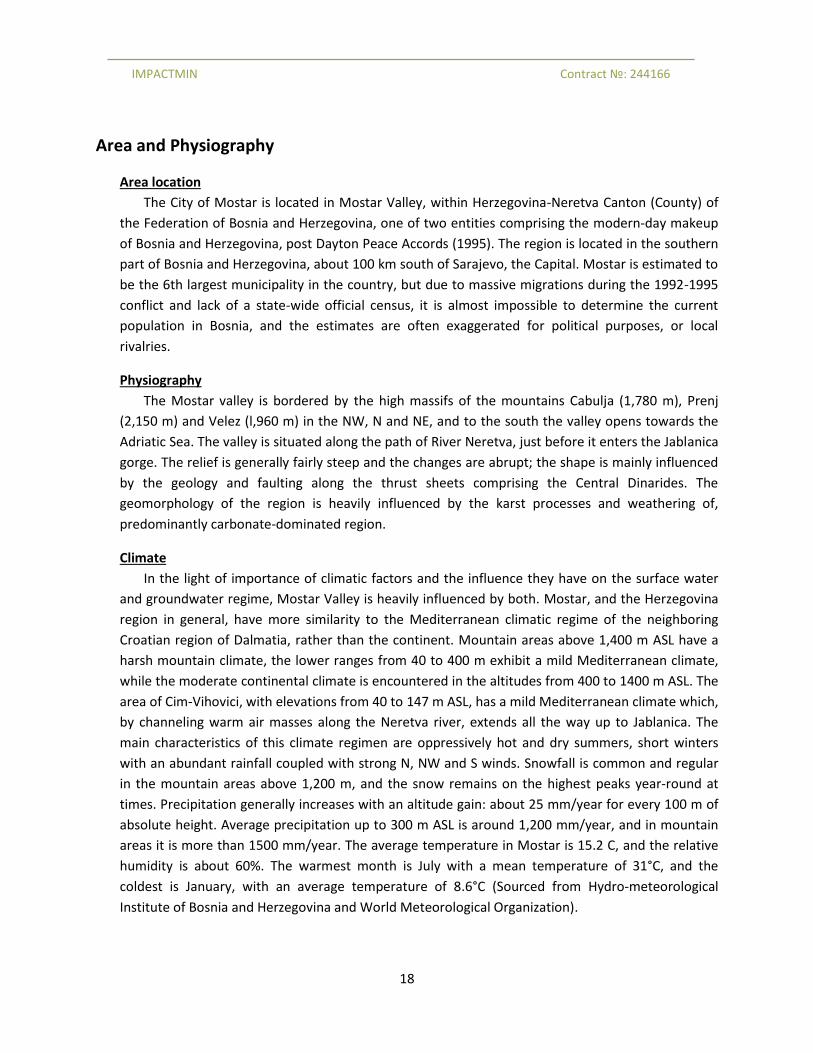
Physiography
The Mostar valley is bordered by the high massifs of the mountains Cabulja (1,780 m), Prenj
(2,150 m) and Velez (l,960 m) in the NW, N and NE, and to the south the valley opens towards the
Adriatic Sea. The valley is situated along the path of River Neretva, just before it enters the Jablanica
gorge. The relief is generally fairly steep and the changes are abrupt; the shape is mainly influenced
by the geology and faulting along the thrust sheets comprising the Central Dinarides. The
geomorphology of the region is heavily influenced by the karst processes and weathering of,
predominantly carbonate-dominated region.
Climate
In the light of importance of climatic factors and the influence they have on the surface water
and groundwater regime, Mostar Valley is heavily influenced by both. Mostar, and the Herzegovina
region in general, have more similarity to the Mediterranean climatic regime of the neighboring
Croatian region of Dalmatia, rather than the continent. Mountain areas above 1,400 m ASL have a
harsh mountain climate, the lower ranges from 40 to 400 m exhibit a mild Mediterranean climate,
while the moderate continental climate is encountered in the altitudes from 400 to 1400 m ASL. The
area of Cim-Vihovici, with elevations from 40 to 147 m ASL, has a mild Mediterranean climate which,
by channeling warm air masses along the Neretva river, extends all the way up to Jablanica. The
main characteristics of this climate regimen are oppressively hot and dry summers, short winters
with an abundant rainfall coupled with strong N, NW and S winds. Snowfall is common and regular
in the mountain areas above 1,200 m, and the snow remains on the highest peaks year-round at
times. Precipitation generally increases with an altitude gain: about 25 mm/year for every 100 m of
absolute height. Average precipitation up to 300 m ASL is around 1,200 mm/year, and in mountain
areas it is more than 1500 mm/year. The average temperature in Mostar is 15.2 C, and the relative
humidity is about 60%. The warmest month is July with a mean temperature of 31°C, and the
coldest is January, with an average temperature of 8.6°C (Sourced from Hydro-meteorological
Institute of Bosnia and Herzegovina and World Meteorological Organization).
IMPACTMIN Contract №: 244166
19
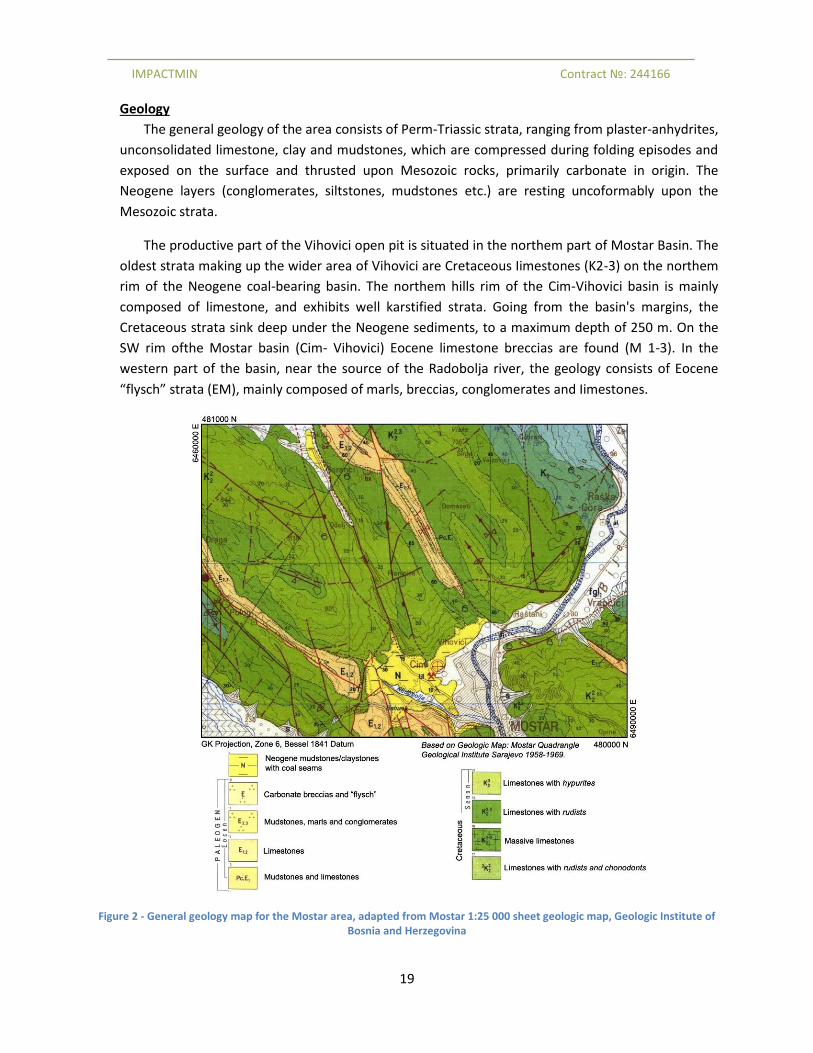
Geology
The general geology of the area consists of Perm-Triassic strata, ranging from plaster-anhydrites,
unconsolidated limestone, clay and mudstones, which are compressed during folding episodes and
exposed on the surface and thrusted upon Mesozoic rocks, primarily carbonate in origin. The
Neogene layers (conglomerates, siltstones, mudstones etc.) are resting uncoformably upon the
Mesozoic strata.
The productive part of the Vihovici open pit is situated in the northem part of Mostar Basin. The
oldest strata making up the wider area of Vihovici are Cretaceous Iimestones (K2-3) on the northem
rim of the Neogene coal-bearing basin. The northem hills rim of the Cim-Vihovici basin is mainly
composed of limestone, and exhibits well karstified strata. Going from the basin's margins, the
Cretaceous strata sink deep under the Neogene sediments, to a maximum depth of 250 m. On the
SW rim ofthe Mostar basin (Cim- Vihovici) Eocene limestone breccias are found (M 1-3). In the
western part of the basin, near the source of the Radobolja river, the geology consists of Eocene
“flysch” strata (EM), mainly composed of marls, breccias, conglomerates and Iimestones.
Figure 2 - General geology map for the Mostar area, adapted from Mostar 1:25 000 sheet geologic map, Geologic Institute of Bosnia and Herzegovina
IMPACTMIN Contract №: 244166
20
In the structural sense, the Neogene basins are tectonic trenches. The main basin and the sub-basins
in the Mostar region are bounded by the normal faults along which the subsidence took place.
Marginal faults of the Neogene basins delineate the shape and control the overall size of the basin.
The thickness of the deposits in each basin depends upon the relative size of displacement along
each fault. The deepest basins are found in the northern segment of Bjelo Polje (Prigradani - Lisani),
where a 700 m deep borehole did not penetrate the base of Neogene, while the elevations of the
surrounding mountains are all about 2,000 m, which means that the movements along the basin-
marginal faults were approaching 3,000 m in displacement.
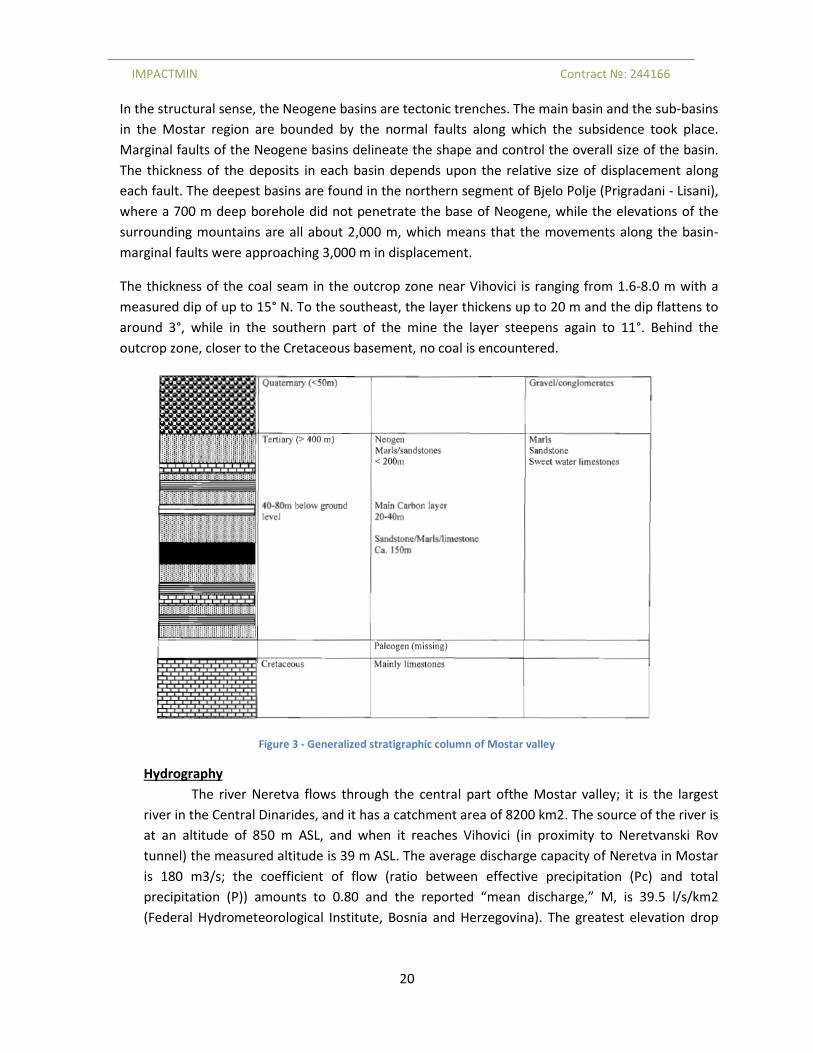
The thickness of the coal seam in the outcrop zone near Vihovici is ranging from 1.6-8.0 m with a
measured dip of up to 15° N. To the southeast, the layer thickens up to 20 m and the dip flattens to
around 3°, while in the southern part of the mine the layer steepens again to 11°. Behind the
outcrop zone, closer to the Cretaceous basement, no coal is encountered.
Figure 3 - Generalized stratigraphic column of Mostar valley
Hydrography
The river Neretva flows through the central part ofthe Mostar valley; it is the largest
river in the Central Dinarides, and it has a catchment area of 8200 km2. The source of the river is
at an altitude of 850 m ASL, and when it reaches Vihovici (in proximity to Neretvanski Rov
tunnel) the measured altitude is 39 m ASL. The average discharge capacity of Neretva in Mostar
is 180 m3/s; the coefficient of flow (ratio between effective precipitation (Pc) and total
precipitation (P)) amounts to 0.80 and the reported “mean discharge,” M, is 39.5 l/s/km2
(Federal Hydrometeorological Institute, Bosnia and Herzegovina). The greatest elevation drop
IMPACTMIN Contract №: 244166
21
occurs between Jablanica and Mostar, amounting to 120 m; on this part of the Neretva river
four hydroelectric power plants are in operation.
The perennial hydrographic network in the area of Cim- Vihovici is formed by the small river
Radobolja on the westem boundary of the mine; it originates from the large karst spring NW
from Cim with measured discharges of 0.2 m3/s. Besides the permanent surface flow, there are
also seasonal flows: Goranacki stream, Mujica draga and the Cerina draga, Crvena draga and
Bivaca, which are active only when the precipitation is high. These seasonal drainages are
formed in the limestone slopes NW of the open pit. The water collecting area of the Cervina and
Mujica draga torrent flows covers the plateaus of the Planinica and Bila hills, to Cabulja
mountain. As there is no vegetation or heavy solis to absorb the precipitation, most of the
meteoric water enters a system of various underground channels, joints, ponors (swallow
holes), etc. and the water-flow continues underground to the Neretva river, along the Mostar
basin. Part of the waters is released through the intermittent springs on the northern rim of
Vihovici, and a smaller part flows along the faults to the underground tunnels and the Vihovici
open pit.
Hydrogeological investigations in 1983 (reported in Kfw report, 2006) confirmed and
affirmed previous studies on the pathways and influence of the general hydrogeological
conditions in Mostar Valley and the reasons for presence of water in the future subsurface and
surface extraction pits. The reports states:
o Water-bearing Quatenary sediments covering Neogene deposits do not directly influence
the pits because there are thick Neogene marly sediments in between (having a filtration
coefficient, kf, of less than 5 x 10⁸ m/s which is virtually impermeable.
o The biggest part of the Neogene hanging wall shows very small values for the filtration
coefficient, so in practice it can be regarded as an impermeable medium. Intervals drilled
by boreholes are limited under aspects of spreading, thickness and water amounts.
o Along the tectonically predisposed zones, the possibility of water filtration is confirmed,
but it is realistic to say that groundwater inflow into the pit area, for the major part of
the Cim area, could not be bigger than the one already noted.
o Water from the limestone rim NW of the Cim coal-bearing field could present the biggest
danger. This is confirmed by experience from the exploitation of the Novo okno field and
Vihovici open pit.
o Water coming from above elevation + 60.0 m ASL flows under gravity into the river
Neretva.
o A system of drainage tunnels (Orlac, Bare and Dolac) was designed to drain the water
from the Cretaceous basement and from the contact area between the carbonates and
the main coal seam.
The Neretva river aquifer is characterized by a porous karst structure covered with
sediment. The aquifer, shared by BiH and Croatia, has an area-extension of approximately 280
km2. The aquifer is characterized by a complete inflow from BiH to Croatia, with a
IMPACTMIN Contract №: 244166
22
predominant direction to south. The total available annual groundwater resources are
estimated in about 25.2 M m3/y, while the renewable resources is about 465 M m3/y. The total
groundwater abstractions are about 15.8 M m3/y. Being of karst nature, the aquifer is
particularly vulnerable to pollution from the surface through fissures, conduits and caves
enlarged by dissolution processes. The high quantity of rainfall sinks into the underground,
where it makes up for large fluid flows, which surge out in littoral fresh springs, saline littoral
springs or submarine springs, which are present on the karst rim. These springs are either
periodical or permanent, depending on the seasons and quantity of water that drains from the
karst terrain. In spring, autumn and winter they bring large quantities of water into Neretva
Delta, while during the rainless period (predominantly in summer) when the waters are
relatively calm, the tracer testing method proved that these springs are connected with
karst valleys in the hinterland.
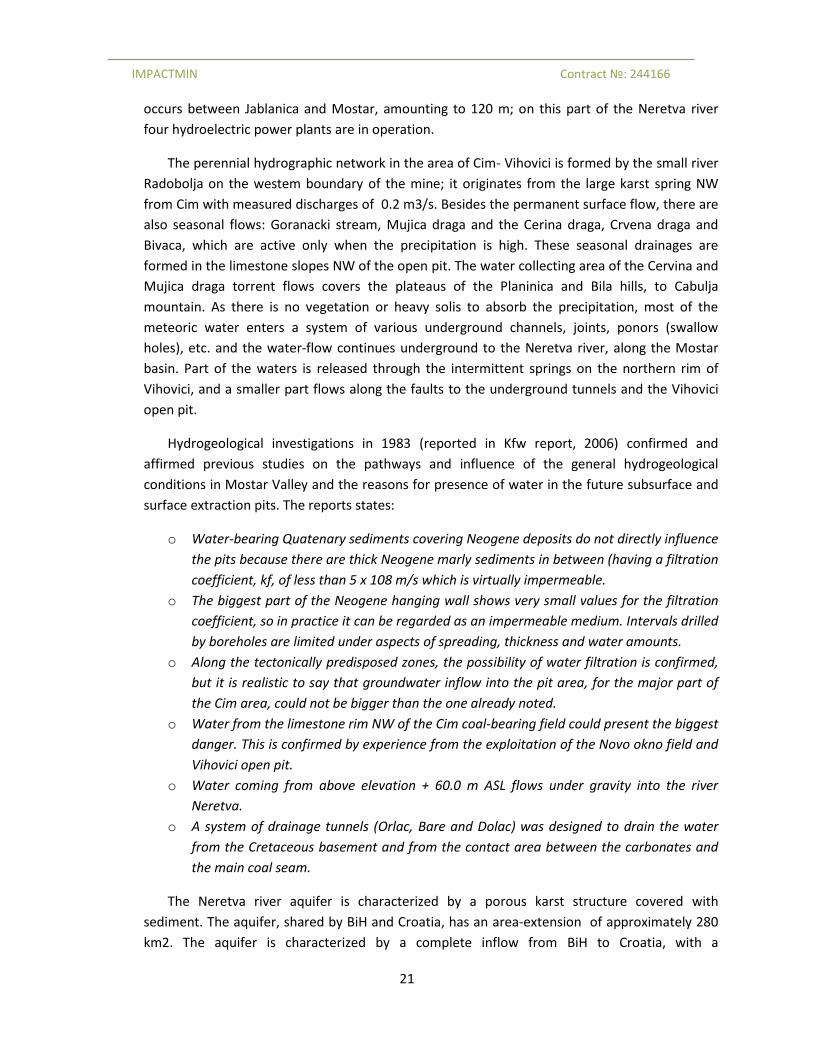
Figure: Vihovici geology
Biodiversity
The vegetation of the area is highly diversified. In the source areas, the role of high mixed and
deciduous forests - most of which are beech (fagus) and oak (quercus) forests, in water protection is
considered to be highly important: protection of wider source area against incidental pollutions and
IMPACTMIN Contract №: 244166
23
minimizing surface runoff. However, the karstified, mostly Jurassic and Cretaceous areas of the
Neretva River basin are considered more problematic, as the vegetation cover is sparser, so the
vegetation had to adopt to adhere to the top-soil poor condition and intermittent water supply. The
primary plant species observed in the wider Vihovici region is summarized from Redzic et al. (2011):
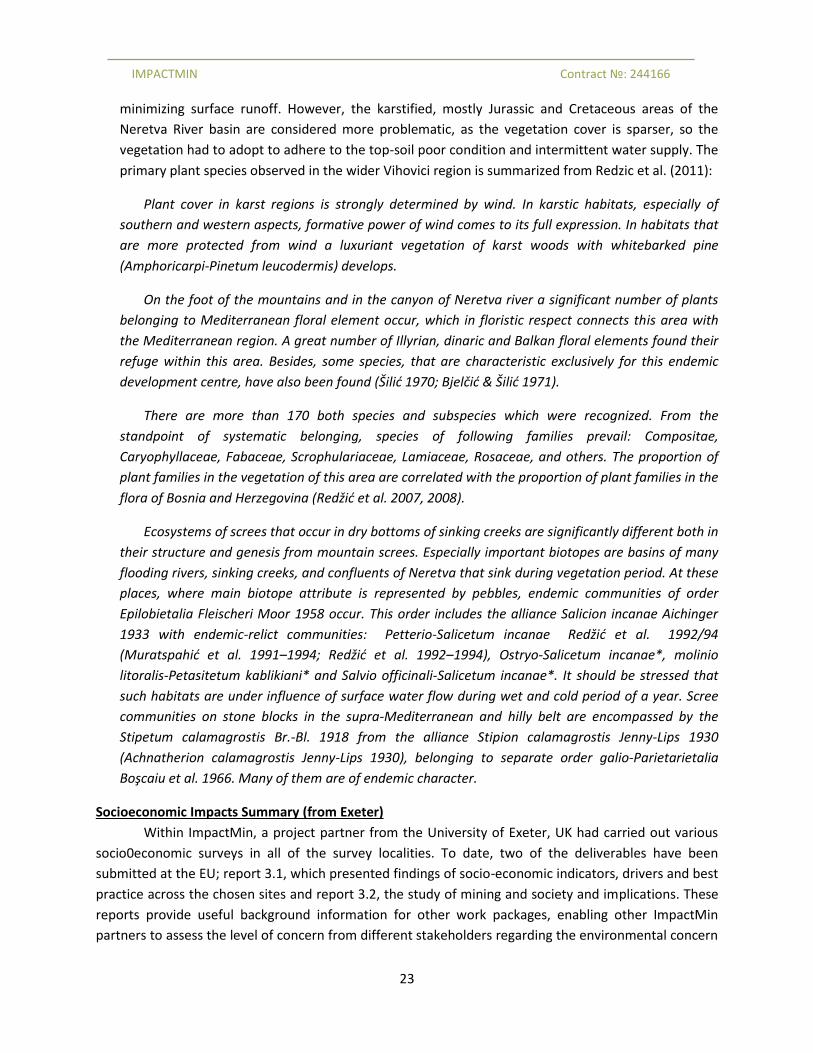
Plant cover in karst regions is strongly determined by wind. In karstic habitats, especially of
southern and western aspects, formative power of wind comes to its full expression. In habitats that
are more protected from wind a luxuriant vegetation of karst woods with whitebarked pine
(Amphoricarpi-Pinetum leucodermis) develops.
On the foot of the mountains and in the canyon of Neretva river a significant number of plants
belonging to Mediterranean floral element occur, which in floristic respect connects this area with
the Mediterranean region. A great number of Illyrian, dinaric and Balkan floral elements found their
refuge within this area. Besides, some species, that are characteristic exclusively for this endemic
development centre, have also been found (Šilić 1970; Bjelčić & Šilić 1971).
There are more than 170 both species and subspecies which were recognized. From the
standpoint of systematic belonging, species of following families prevail: Compositae,
Caryophyllaceae, Fabaceae, Scrophulariaceae, Lamiaceae, Rosaceae, and others. The proportion of
plant families in the vegetation of this area are correlated with the proportion of plant families in the
flora of Bosnia and Herzegovina (Redžić et al. 2007, 2008).
Ecosystems of screes that occur in dry bottoms of sinking creeks are significantly different both in
their structure and genesis from mountain screes. Especially important biotopes are basins of many
flooding rivers, sinking creeks, and confluents of Neretva that sink during vegetation period. At these
places, where main biotope attribute is represented by pebbles, endemic communities of order
Epilobietalia Fleischeri Moor 1958 occur. This order includes the alliance Salicion incanae Aichinger
1933 with endemic-relict communities: Petterio-Salicetum incanae Redžić et al. 1992/94
(Muratspahić et al. 1991–1994; Redžić et al. 1992–1994), Ostryo-Salicetum incanae*, molinio
litoralis-Petasitetum kablikiani* and Salvio officinali-Salicetum incanae*. It should be stressed that
such habitats are under influence of surface water flow during wet and cold period of a year. Scree
communities on stone blocks in the supra-Mediterranean and hilly belt are encompassed by the
Stipetum calamagrostis Br.-Bl. 1918 from the alliance Stipion calamagrostis Jenny-Lips 1930
(Achnatherion calamagrostis Jenny-Lips 1930), belonging to separate order galio-Parietarietalia
Boşcaiu et al. 1966. Many of them are of endemic character.
Socioeconomic Impacts Summary (from Exeter)
Within ImpactMin, a project partner from the University of Exeter, UK had carried out various
socio0economic surveys in all of the survey localities. To date, two of the deliverables have been
submitted at the EU; report 3.1, which presented findings of socio-economic indicators, drivers and best
practice across the chosen sites and report 3.2, the study of mining and society and implications. These
reports provide useful background information for other work packages, enabling other ImpactMin
partners to assess the level of concern from different stakeholders regarding the environmental concern
IMPACTMIN Contract №: 244166
24
held across the various ImpactMin demo sites. Key to understanding the environmental impacts of
mining, is knowing how people are affected by their environment. This defines the valuable contribution
of WP3 to all of the ImpactMin work packages that are aimed at developing new ways of monitoring and
mitigating against the environmental impacts of mining using Earth observation techniques.
The research was carried out using surveys, in addition to interviews and focus groups. A survey
administered across all of the sites assessed people’s views and perceptions of mining in their region
and what they were concerned about at each of the sites. Interviews and focus groups of stakeholders,
including where possible the mining companies, explored in more depth how people felt mining had
impacted on their lives, providing an insight into how different stakeholder groups interrelate and work
together (or do not in some instances).
Findings show that the majority of people interviewed across the demo sites have a positive
view of mining in general. This contrasts distinctly with the media portrayal of the industry which often
suggesting the opposite is true and that people dislike mining and related activities. The suggestion we
offer here is that where you have a ‘mining community’, or a community where mining has until recently
been an important economic activity, the majority of people readily connect and make positive
associations with the industry and these views most likely contrast significantly with the views of people
in a community that has never seen mining. There are exceptions to this rule within the ImpactMin
demo sites and likely explanations for the differences we identified. For example, at the Vihovići site in
Mostar where less than 40 % of people felt positive about mining, the city of Mostar has undergone
massive changes in population and ethnic background as a result of the Balkans war which lasted from
1992-1995. The changes in population in the city have meant that many of the residents have no
association with Vihovići being an active coal mine. For more detailed information, consult deliverables
3.1 and 3.2 of the ImpactMin report.
Concluding Background Remarks As a whole, Mostar Valley presents an interesting locality where various resource extraction and
processing activities had taken place in the past. In the current state of events, the expanding city limits
are encroaching upon the abandoned facilities and the mutual impacts are converging. The unplanned
closure and termination of extractive and industrial facilities at the outbreak of hostilities in 1992 and
rampant, unplanned growth post 1995, have left some of the problems unaddressed, and in the areas
where rehabilitation has taken place, no follow-up activity has been performed up to now to estimate
the success of rehabilitation activities.
IMPACTMIN Contract №: 244166
25
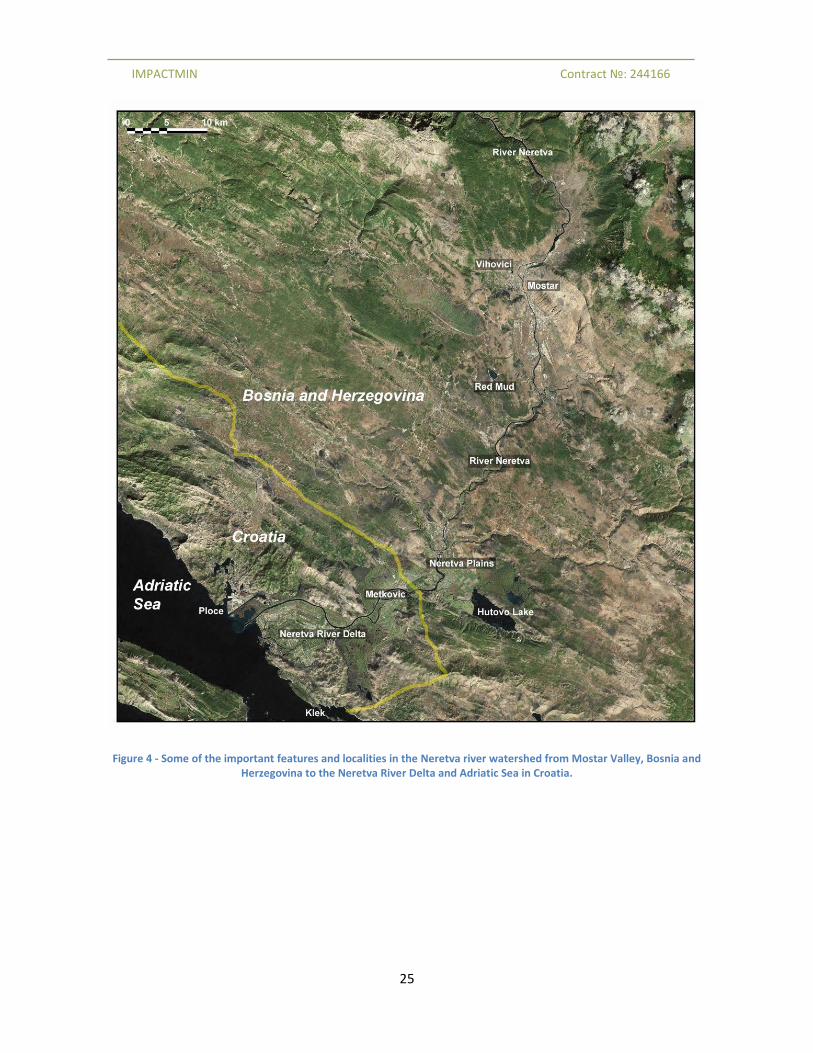
Figure 4 - Some of the important features and localities in the Neretva river watershed from Mostar Valley, Bosnia and Herzegovina to the Neretva River Delta and Adriatic Sea in Croatia.
IMPACTMIN Contract №: 244166
26
Part 2 – Activities
Planned Activities The plan for the Mostar Valley area case study was as following (summarized from ImpactMin):
High resolution spaceborne data will be used to help define the overall setting of the areas and
plot the the existing and new infrastrcuture, land-cover type and areas of particular concern. Of
particular interest will be the mapping of faults, fissures, karst-subduction features to identify
the areas and contamination affected area at 1:50,000 – 1:100,000 scale.
Using high airborne spatial-spectral resolution imager the surface mineralogical, vegetative,
hydrologic and anthropogenic cover of the sites will be created at 1:5,000 scale. It is the
intention of this project to examine possibilities to use airborne hyperspectral data to detect the
potential impact on the environment coming from mining activities or abandoned mine pits. The
narrow band-passes (5-10nm) and high spatial resolution (1m or better) of the imager will allow
the definition of discrete parameters of surface materials, in particular contaminants related to
mining, organics and mineral compositions of the waste piles. Using better-defined atmospheric
parameters and narrow band-pass of the instrument the distribution and location of possible
toxic-gas emitting fumaroles (CO, H2S, CO2, SO2 of underground burning of coal seams in
Vihovici region will be determined. Finally using the ultraviolet (UV) and deep blue regions of
electromagnetic (EM) spectrum covered by the hyperspectral imager the surface or subsurface
pathways of the effluence of pollution into Neretva river will be mapped.
Gamma-ray spectroscopic data will be flown in conjunction with hyperspectral data to generate
additional information about the underlying geology, but also identify hot spot zones indicative
of industrial and mining waste deposition at 1:10,000 scale.
An integrated approach to ground sampling will follow the outline of the anomalous zone
identified on the high resolution hyperspectral or gamma-ray data. The sites of interest would be
sampled with portable, full range VIS-SWIR spectrometer, uranium-thorium-potassium (U-Th-K)
gamma ray spectrometer and sample taken for further geochemical analysis.
Based on the input from the partners, situation on the ground and influx of new information that was
provided by the ongoing studies and research, actions and executions were modulated in the series of
teleconferences and interim meetings in Split, Croatia and Cluj, Romania.
Preparation Photon had taken a lead role in delivering the three key deliverables that made a bearing to deciding
what, where, when and how the execution of campaigns in Mostar Valley is to take place. The three key
work packages and associated deliverables are:
1. WP 5.1 Evaluation of the usability and feasibility of airborne systems
2. WP 5.2 Knowledge pool of methods
IMPACTMIN Contract №: 244166
27
3. WP 5.3 Preparatory work for demo-site implementation
Deliverables:
- Report on the limitation and potential of airborne EO Data
- Demo-site implementation plan
Additionally, deliverables 4.1 and 4.3, dealing with the aspects of satellite EO and addressing it
to study sites within ImpactMin project, have outlined some of the elements of limited satellite EO
activities to be performed in Mostar and the bearing relevance to the airborne campaign.
From the theoretical standpoint, the preparatory work has concluded that the imaging and analysis
of environmental factors (details cited in WP 5.1, but related to air, water, soil and vegetation) related
to mineral extraction, processing and industrialization with various remote sensing and supporting tools
are a complex task of resolving targets and observable characteristics coupled with the inherent
dimensionality of spectral data. Ultimately, the ability to resolve the subtle indicators and clues is
directly proportional to the quality of data collected, but also the premises and parameters determined
in data acquisition and analysis. In conjunction with all other available methods, the airborne spectral
imagery yields the highest score in the quantity and usability of data collected. Furthermore, by using
the sheer quantity and redundancy of airborne data, it is possible to increase the level of confidence in
target unmixing and detection, reinforcing the advantage over other sensing methods in the terms of
confidence, time and overall cost effectiveness. Therefore, the airborne component fills the important
niche situated between in-situ measurements and spaceborne sensing – in the context of Work Package
5.
The main advantages of the airborne approach are the ability to resolve the surface detail in high
spatial and spectral resolution, over relatively wide area and low-to-moderate overall cost of acquisition.
These qualities make it increasingly popular with the industry in appraising mineralization potential of
the area, types of surface cover, distribution of pollutants, anomaly identification and search/recovery.
The spectral information provides a fairly robust approach in extrapolating composition of the particular
imaged target and its classification or isolation from the background.
The main disadvantages of the approach are the requirements for nearly ideal acquisition
conditions: clear weather and abundant sunlight for hyperspectral and low/level-flight for gamma ray
sensors. The secondary disadvantages are the relatively high cost of mobilization and the amount of
data generated that requires considerable technical proficiency in analysis and interpretation.
Some of these obstacles can be tackled by using novel methods in acquisition (e.g. use of unmanned
aircraft, smaller sensors etc.), but also in supporting the airborne data with other types of in-situ or
satellite data to achieve better calibration, in-fill the coverage gaps, or most importantly precisely target
the airborne data to the areas where increased spatial/spectral detail is required.
The study sites presented in this report present an ideal testing ground in appraising capabilities of
an integrated airborne collection approach with the other types of data because of their environmental
IMPACTMIN Contract №: 244166
28
diversity, presence of particular signatures characteristic of mineral exploration and exploitation and
different strategies required or available to collect the necessary information.
From the practical standpoint the main expected result of the airborne campaign was to generate
an overall snapshot of the current state of affairs with regards to post-resource exploatation state in
the Mostar Valley, beginning with the former Vihovici mine, located in the main core of the city of
Mostar and grading futher to the other sites of interest in the Mostar Valley.
The snapshot would have three benefits:
1. Ascertain the success of 2007-2009 remediation at the Vihovici Mine site and point to the areas that are yet to be addressed or have been missed / re-activated from the first remediation attempt
2. Establish the baseline for Neretva river as a result of resource extraction before Vihovici, after Vihovici, below the city of Mostar and below the industrial area in the southern Mostar Valley.
3. Establish the current environmental baseline for the Mostar Valley and preliminarly evaluate other sites that may have problematic occurrences in the future (i.e. red mud storage).
The results from the airborne campaign were expected to strengthen the observables from the
spaceborne campaign and give additional elements of evidence towards understanding the past, current
and future activities and developments in Mostar Valley.
The main limitation in the project is the ability to observe the listed phenomena, stemming from the
facts that the City has grown on top of the abandoned mine lands. Additional challenges are pertaining
to the other areas of resource extraction that are still in use and limit the access and evaluation on the
ground. Hence, while some of the sites in Mostar Valley may be well covered with information, others
may not earn the same scrutiny due to various temporal, budgetary and political concerns. Conducting
this type of survey in an active and vibrant urban community is quite challenging and the dynamnic
nature of observables may not always offer conventional interpretations, leaving some of the results
and conclusions vague and extrapolative.
Permits for sampling water and soil in the area of interest, the airborne campaign, overflying
with the UAV, and access on private land properties were obtained before the project activities had
taken place. The following institutions have released and granted the respective permits: Bosnia and
Herzegovina Civil Aviation Directorate – Flight Authorization Department, City of Mostar, Ministry of
Interior Herzegovina-Neretva Canton, and Public Company for Electricity Management, Ministry of
water management, forestry and agriculture Herzegovina-Neretva Canton.
Execution The execution of the project involved several distinct phases: spaceborne remote sensing to identify
regional features of interest, detailed airborne hyperspectral sensing, high-resolution, low-altitude UAV
survey of the areas of interest and ground-based follow-up survey to supplant information from the
airborne campaigns with ground/water-truthing data.
IMPACTMIN Contract №: 244166
29
Work Package 4: Spaceborne remote sensing using satellite technology.
There are a number of environmental variables, soil and surface variables, associated with
mineral/energy mining activities, which are to some extent detectable with the satellite earth
observation data. Variables (or impacts) are effects on natural resources and on the components,
structures and functioning of affected ecosystems. The variables are separated into direct and
indirect variables. Direct variables are related to direct and predictable effects of mining itself,
occurring at the same time and place. Indirect variables are caused by mineral mining, but occur
later in time or farther removed in distance. Indirect variables may include cumulative effects
related to induced changes in the pattern of land use and related effects on soil, air and water and
other natural systems.
As most of the analyzed sites in Mostar Valley are in the abandoned state, the focus of this
report is given more towards the indirect activities and variables. Generally, during the closure and
reclamation stage, major clean-up takes place and large volumes of material are moved around in
the process of rehabilitation and landscaping. Regeneration of the old ecosystems throughout the
rehabilitated land gradually takes place. Some of the earlier processes, such as generation of acid
mine drainage, may continue to take place and require to be monitored at regular intervals.
Discussion on the indirect variables is presented in great depth in the Deliverable Report 4.1 of the
ImpactMin project.
The intent of satellite remote sensing was to monitor the regional parameters and their
temporal change: urban growth, natural regeneration of the vegetation, etc. Time series of medium
resolution imagery could be used for this purpose, although the spatial extent of the mine is not
large, and subpixel classification techniques might be necessary. Even though medium resolution
Landsat MSS/TM/ETM+ imagery and is limited in spatial and spectral resolution, a long time series
can be useful to monitor temporal changes and settings of the mine. It is interesting to
compare/contrast the position of the mine and development coupled with urban growth, and to
monitor vegetation regeneration after mine closure and mine site rehabilitation. The use of low
resolution time series (e.g. NOAA-AVHRR, SPOT-Vegetation etc.) is of no use at this particular demo-
site, because of the small spatial extent of the mining area and its influence zone.
However, the major opportunity at the Mostar demo-site is to test the applicability of image
fusion techniques of satellite imagery with airborne imagery collected in the ImpactMin field
campaign of 2011. The complete preparatory work for demo-site implementation of satellite remote
sensing for environmental monitoring is presented in deliverable D4.3.
The focus of the investigations in the Mostar area was on:
1) Pollution of the open pit area
2) Pollution of the Neretva river
The open pit area is relatively small and the environmental impact of the mining activities, that
can be currently observed, appear to be restricted to an area of less than 0.5 square km.The width
IMPACTMIN Contract №: 244166
30
of the Neretva river in the Mostar area varies roughly between 10 and 60 m, but in general it is not
wider than 30m. The width of the reservoir north of the town of Mostar is less than 350m.
For the Mostar area study, the consortium has acquired imagery with a range of spatial and
spectral resolutions, such as Landat, Aster and WorldView2. For the spatial and spectral
characteristics of these satellite images we refer to the report for Deliverable 4 (Work Package 4).
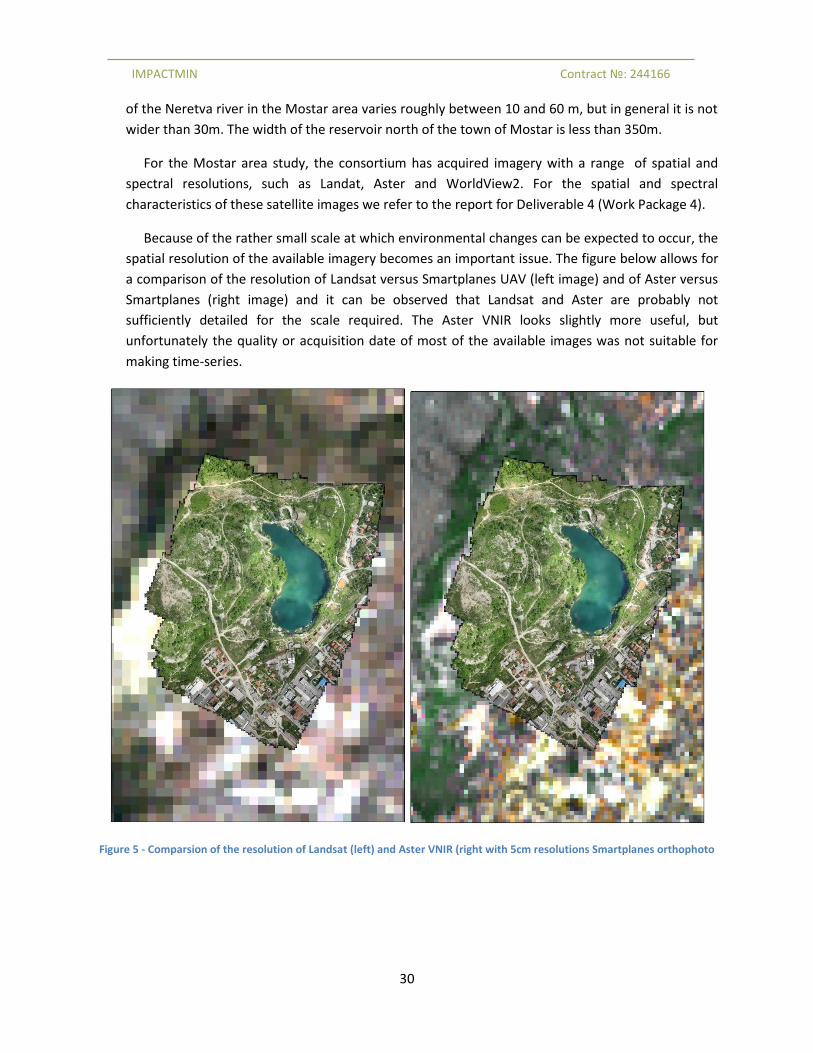
Because of the rather small scale at which environmental changes can be expected to occur, the
spatial resolution of the available imagery becomes an important issue. The figure below allows for
a comparison of the resolution of Landsat versus Smartplanes UAV (left image) and of Aster versus
Smartplanes (right image) and it can be observed that Landsat and Aster are probably not
sufficiently detailed for the scale required. The Aster VNIR looks slightly more useful, but
unfortunately the quality or acquisition date of most of the available images was not suitable for
making time-series.
Figure 5 - Comparsion of the resolution of Landsat (left) and Aster VNIR (right with 5cm resolutions Smartplanes orthophoto
IMPACTMIN Contract №: 244166
31
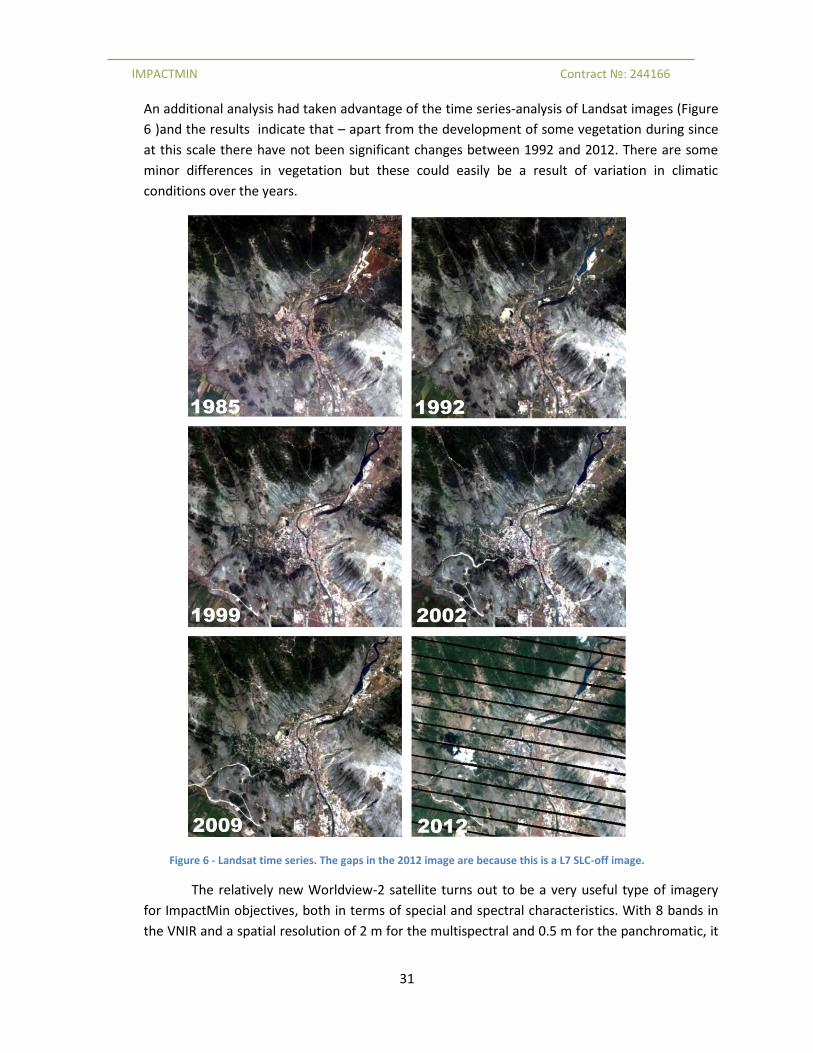
An additional analysis had taken advantage of the time series-analysis of Landsat images (Figure
6 )and the results indicate that – apart from the development of some vegetation during since
at this scale there have not been significant changes between 1992 and 2012. There are some
minor differences in vegetation but these could easily be a result of variation in climatic
conditions over the years.
Figure 6 - Landsat time series. The gaps in the 2012 image are because this is a L7 SLC-off image.
The relatively new Worldview-2 satellite turns out to be a very useful type of imagery
for ImpactMin objectives, both in terms of special and spectral characteristics. With 8 bands in
the VNIR and a spatial resolution of 2 m for the multispectral and 0.5 m for the panchromatic, it
IMPACTMIN Contract №: 244166
32
gives analyst the resolution required to map and monitor subtle environmental changes at
relatively small scale.
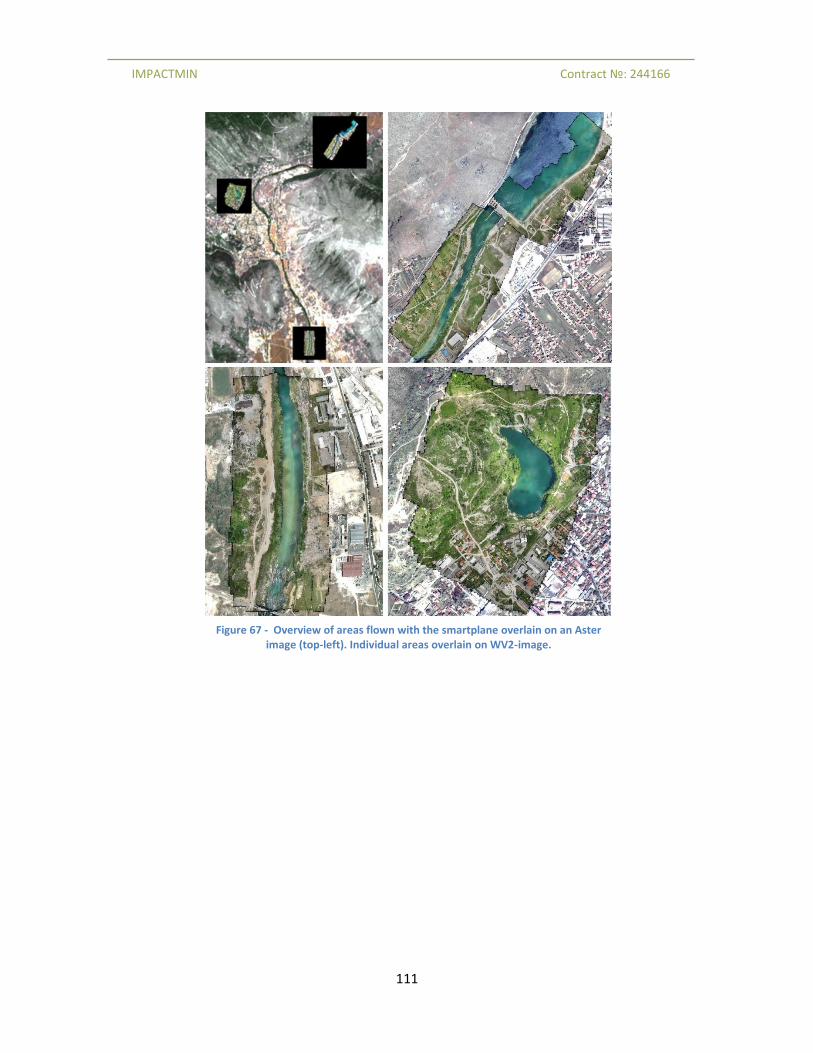
Integration with hyperspectral and/or Smartplanestm UAV imagery gives additional
possibilities to obtain much higher resolution imagery for the selected areas (Figure 7)
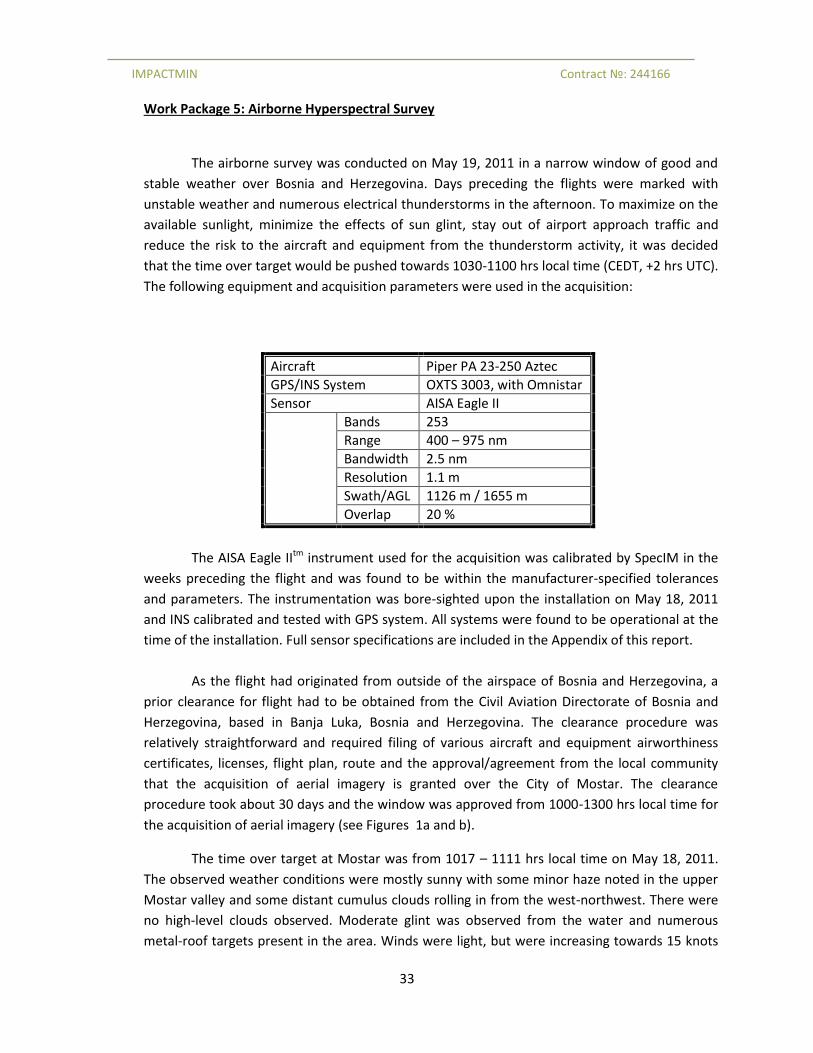
The airborne survey was conducted on May 19, 2011 in a narrow window of good and
stable weather over Bosnia and Herzegovina. Days preceding the flights were marked with
unstable weather and numerous electrical thunderstorms in the afternoon. To maximize on the
available sunlight, minimize the effects of sun glint, stay out of airport approach traffic and
reduce the risk to the aircraft and equipment from the thunderstorm activity, it was decided
that the time over target would be pushed towards 1030-1100 hrs local time (CEDT, +2 hrs UTC).
The following equipment and acquisition parameters were used in the acquisition:
Aircraft Piper PA 23-250 Aztec
GPS/INS System OXTS 3003, with Omnistar
Sensor AISA Eagle II
Bands 253
Range 400 – 975 nm
Bandwidth 2.5 nm
Resolution 1.1 m
Swath/AGL 1126 m / 1655 m
Overlap 20 %
The AISA Eagle IItm instrument used for the acquisition was calibrated by SpecIM in the
weeks preceding the flight and was found to be within the manufacturer-specified tolerances
and parameters. The instrumentation was bore-sighted upon the installation on May 18, 2011
and INS calibrated and tested with GPS system. All systems were found to be operational at the
time of the installation. Full sensor specifications are included in the Appendix of this report.
As the flight had originated from outside of the airspace of Bosnia and Herzegovina, a
prior clearance for flight had to be obtained from the Civil Aviation Directorate of Bosnia and
Herzegovina, based in Banja Luka, Bosnia and Herzegovina. The clearance procedure was
relatively straightforward and required filing of various aircraft and equipment airworthiness
certificates, licenses, flight plan, route and the approval/agreement from the local community
that the acquisition of aerial imagery is granted over the City of Mostar. The clearance
procedure took about 30 days and the window was approved from 1000-1300 hrs local time for
the acquisition of aerial imagery (see Figures 1a and b).
The time over target at Mostar was from 1017 – 1111 hrs local time on May 18, 2011.
The observed weather conditions were mostly sunny with some minor haze noted in the upper
Mostar valley and some distant cumulus clouds rolling in from the west-northwest. There were
no high-level clouds observed. Moderate glint was observed from the water and numerous
metal-roof targets present in the area. Winds were light, but were increasing towards 15 knots
IMPACTMIN Contract №: 244166
34
from the west towards the completion of the sortie flown over Mostar. All planned targets were
imaged in the course of the mission. The survey was flown at an altitude of about 1100m AGL,
which gave the average ground-instantaneous field of view (GIFOV) of about 1.02 m. A total of
20 flightlines were acquired during the mission, with some of the data being repeated, to ensure
good target coverage and minimal glint from the water surface targets. The flight has coincided
with the simultaneous acquisition of ground and water spectra.
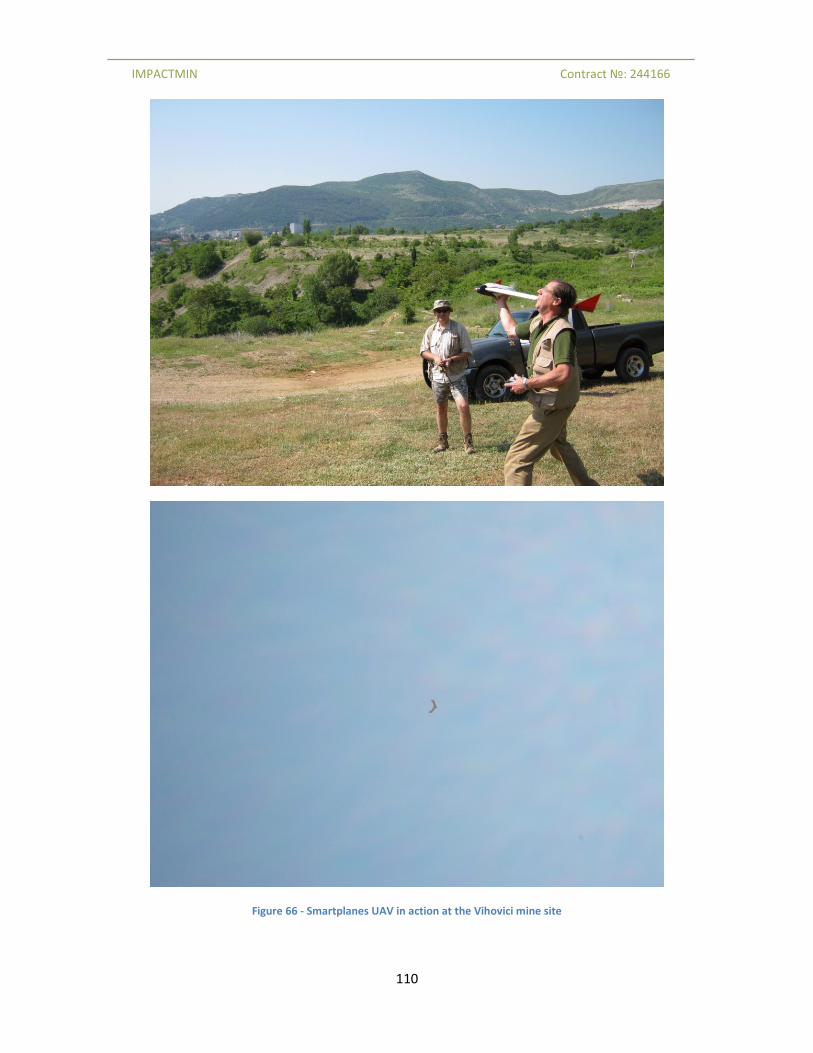
Work Package 5: Smartplanestm UAV
The UAV overflight was undertaken to acquire high-resolution images of the Vihovici
mine and Neretva River and assist in interpretation of targets with added detail. The entire
Vihovici mine complex was imaged and also important portions of the Neretva River, to include
a majority of the water sampling sites. Five flights were carried out with the Smartplanes UAV
to collect high resolution (5cm) aerial photographs of the open pit area and of the several
sampling sites in the Neretva River. The stereo imagery collected for the open pit area was used
to generate a Digital Surface model with a vertical precision better than 10 cm. The highly
detailed imagery of the open pit area was used to identify and map zones of structural
weakness. Relatively recent deposits of household waste, asbestos, building materials, etc, can
be observed along the road.
Work Package 5: Ground spectroscopy survey
The Mostar area is a complicated area when it comes to taking samples for spectral
analysis. The area is locally strongly vegetated. The site access is dangerous because there is
waste and litter of all sorts in many parts of the area, including sharp objects such as glass,
syringes, scrap metal etc. The area is, like most of the region around the town of Mostar, still
actively used as an illegal waste-dump (see below):
Figure 8 - building and industrial waste dumped in the pit area (location 19 on Figure 10)
The surface coverage is generally rather inhomogeneous due to the large amounts of waste. In
many cases it is very hard to find good sampling sites for spectroscopy. Also the risk for
IMPACTMIN Contract №: 244166
35
undetonated landmines is not imaginary. This means that in general our sampling was restricted
to locations that had relatively easy and safe access.
The Vihovici pit area can be characterized by a number of different land-cover types
1) vegetation: sparse to dense grass, shrub and low trees.
2) waste:
a) historic waste that has been covered with rocks and soils from nearby areas;
This is cover normally consists of limestone pebbles mixed with a slightly
ferruginous soil (Figure 9), usually composed of calcite and kaolinite
b) new waste that keeps being dumped today, and which is open and exposed.
3) ferruginous gravel-like overburden or colluvium (Figure 10). It is not clear if this
material originates from natural erosion or whether it is man-made.
4) Exposed rocks, normally in vicinity of the pit-wall.
Figure 9 - Fairly sparse grass with shrubs and low trees (location 15 on map ) and typical composition of cover material for historic waste (location 13)
IMPACTMIN Contract №: 244166
36
Figure 10 - Ferruginous overburden (location 19)
The sample locations are marked on the image below (Figure 11). For representative samples,
the spectra have been plotted in Figure 12. The numbers of the spectra correspond with the sample
numbers on the image, and with the locations of the photos above. Spectra were taken with an ASD-
terraspec full-range spectrometer, equipped with a contact probe.
Figure 11 - Field sampling points plotted on WV2-image and Smartplanes ortho-mosaic; numbered samples correspond with the spectra shown in Figure 12 below.
IMPACTMIN Contract №: 244166
37
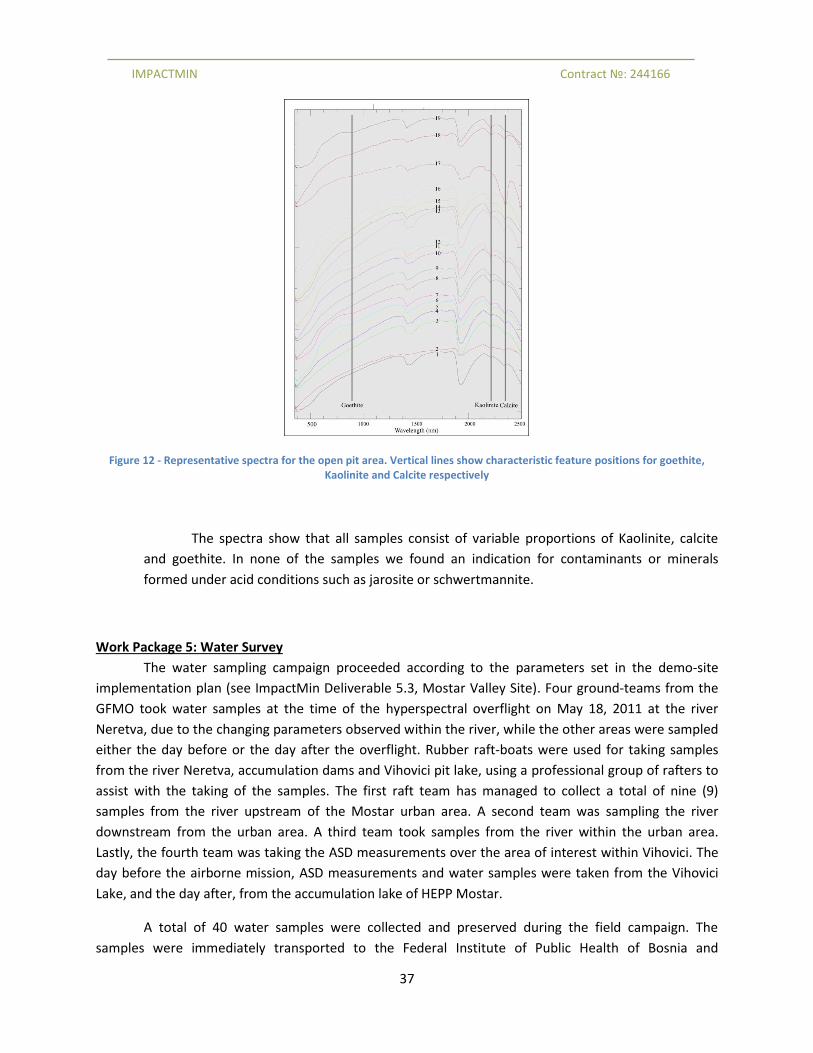
Figure 12 - Representative spectra for the open pit area. Vertical lines show characteristic feature positions for goethite, Kaolinite and Calcite respectively
The spectra show that all samples consist of variable proportions of Kaolinite, calcite
and goethite. In none of the samples we found an indication for contaminants or minerals
formed under acid conditions such as jarosite or schwertmannite.
Work Package 5: Water Survey
The water sampling campaign proceeded according to the parameters set in the demo-site
implementation plan (see ImpactMin Deliverable 5.3, Mostar Valley Site). Four ground-teams from the
GFMO took water samples at the time of the hyperspectral overflight on May 18, 2011 at the river
Neretva, due to the changing parameters observed within the river, while the other areas were sampled
either the day before or the day after the overflight. Rubber raft-boats were used for taking samples
from the river Neretva, accumulation dams and Vihovici pit lake, using a professional group of rafters to
assist with the taking of the samples. The first raft team has managed to collect a total of nine (9)
samples from the river upstream of the Mostar urban area. A second team was sampling the river
downstream from the urban area. A third team took samples from the river within the urban area.
Lastly, the fourth team was taking the ASD measurements over the area of interest within Vihovici. The
day before the airborne mission, ASD measurements and water samples were taken from the Vihovici
Lake, and the day after, from the accumulation lake of HEPP Mostar.
A total of 40 water samples were collected and preserved during the field campaign. The
samples were immediately transported to the Federal Institute of Public Health of Bosnia and
IMPACTMIN Contract №: 244166
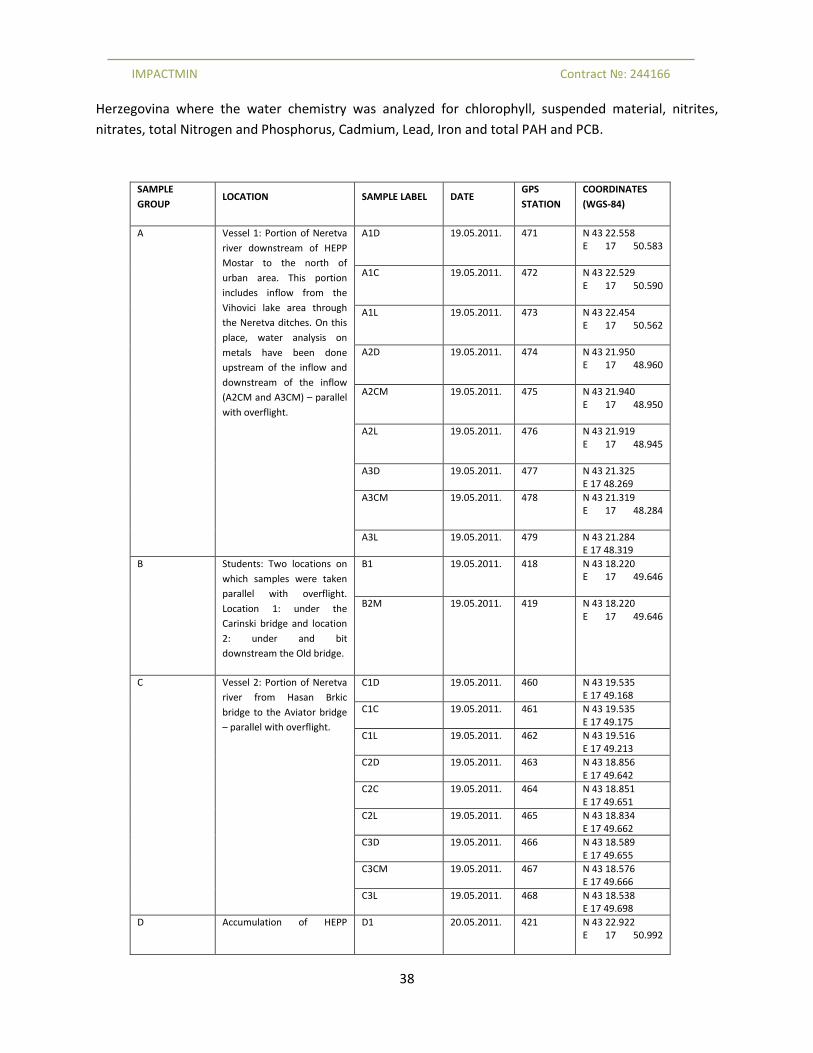
38
Herzegovina where the water chemistry was analyzed for chlorophyll, suspended material, nitrites,
nitrates, total Nitrogen and Phosphorus, Cadmium, Lead, Iron and total PAH and PCB.
SAMPLE
GROUP LOCATION SAMPLE LABEL DATE
GPS
STATION
COORDINATES
(WGS-84)
A Vessel 1: Portion of Neretva
river downstream of HEPP
Mostar to the north of
urban area. This portion
includes inflow from the
Vihovici lake area through
the Neretva ditches. On this
place, water analysis on
metals have been done
upstream of the inflow and
downstream of the inflow
(A2CM and A3CM) – parallel
with overflight.
A1D 19.05.2011. 471 N 43 22.558 E 17 50.583
A1C 19.05.2011. 472 N 43 22.529 E 17 50.590
A1L 19.05.2011. 473 N 43 22.454 E 17 50.562
A2D 19.05.2011. 474 N 43 21.950 E 17 48.960
A2CM 19.05.2011. 475 N 43 21.940 E 17 48.950
A2L 19.05.2011. 476 N 43 21.919 E 17 48.945
A3D 19.05.2011. 477 N 43 21.325 E 17 48.269
A3CM 19.05.2011. 478 N 43 21.319 E 17 48.284
A3L 19.05.2011. 479 N 43 21.284 E 17 48.319
B Students: Two locations on
which samples were taken
parallel with overflight.
Location 1: under the
Carinski bridge and location
2: under and bit
downstream the Old bridge.
B1 19.05.2011. 418 N 43 18.220 E 17 49.646
B2M 19.05.2011. 419 N 43 18.220 E 17 49.646
C Vessel 2: Portion of Neretva
river from Hasan Brkic
bridge to the Aviator bridge
– parallel with overflight.
C1D 19.05.2011. 460 N 43 19.535 E 17 49.168
C1C 19.05.2011. 461 N 43 19.535 E 17 49.175
C1L 19.05.2011. 462 N 43 19.516 E 17 49.213
C2D 19.05.2011. 463 N 43 18.856 E 17 49.642
C2C 19.05.2011. 464 N 43 18.851 E 17 49.651
C2L 19.05.2011. 465 N 43 18.834 E 17 49.662
C3D 19.05.2011. 466 N 43 18.589 E 17 49.655
C3CM 19.05.2011. 467 N 43 18.576 E 17 49.666
C3L 19.05.2011. 468 N 43 18.538 E 17 49.698
D Accumulation of HEPP D1 20.05.2011. 421 N 43 22.922 E 17 50.992
IMPACTMIN Contract №: 244166
39
Mostar D2 20.05.2011. 422 N 43 23.030 E 17 51.064
D3 20.05.2011. 423 N 43 23.245 E 17 51.145
D4M 20.05.2011. 424 N 43 23.457 E 17 51.330
E Vihovici lake (on location E2
were done PAH and PCB
analysis)
E1M 14.05.2011. 459 N 43 21.457 E 17 47.781
E2M 14.05.2011. 458 N 43 21.480 E 17 47.811
E3M 14.05.2011. 456 N 43 21.588 E 17 47.787
E4M 14.05.2011. 455 N 43 21.619 E 17 47.742
E5M 14.05.2011. 460 N 43 21.534 E 17 47.788
E6M 14.05.2011. 457 N 43 21.539 E 17 47.826
N Neretva river – N3 (Hasan
Brkic bridge), N7 (Gas
station), N10 (HEPP Mostar
acumulation) and N9 – these
four samples were taken
parallel with overflight and
ASD-measurements.
N1M (Aviator bridge) + PAH and PCB
18.05.2011. 417 N 43 18.220 E 17 49.644
N2 (Gravel pit) 18.05.2011. 416 N 43 19.076 E 17 49.542
N3 (Hasan Brkic bridge)
19.05.2011. N 43 19.666 E 17 49.107
N4 (The Old bridge)
18.05.2011. 415 N 43 20.189 E 17 48.898
N5 (Carinski bridge) + PAH and PCB
18.05.2011. 414 N 43 20.835 E 17 48.629
N6 (Bakijina Luka)
18.05.2011. 413 N 43 21.450 E 17 48.219
N7M (Gas-station)
19.05.2011. N 43 21.636 E 17 48.233
N8 (Rastanski bridge)
18.05.2011. 412 N 43 21.933 E 17 48.896
N9 (Armirac) 19.05.2011. N 43 22.051 E 17 49.754
N10 (Acumulation HEPP Mostar) + PAH and PCB
19.05.2011. N 43 23.097 E 17 51.021
Table 1 - Sampling sites for Mostar water quality campaign
IMPACTMIN Contract №: 244166
40
Figure 13 - Example of the airborne image (RGB) above Vihovici lake. Two radiance spectra from water targets (at red and green location) are shown along with a picture taken during the field campaign.
Variable Equipment Methodology
Water leaving reflectance [-] ASD, Spectralon Mobley, C.D.
(1999).
Chlorophyll "a" [µg/l]
Suspended material [mg/l]
Thickness [NTU]
Nitrites [N mg/l]
Nitrates [N mg/l]
Total Nitrogen [N mg/l]
Total Phosphor [P mg/l]
Ortho Phosphor [P mg/l]
Cadmium [Cd µg/l]
Lead [Pb µg/l]
Iron [Fe µg/l]
Total PAH [µg/l]
Total PCB [µg/l]
Table 2 - Variables measured during the Mostar field campaign.
The location of the field measurements are given in Figure14. Red dots indicate the location of the water
samples. Yellow dots indicate the location of water samples and ASD measurements
IMPACTMIN Contract №: 244166
41
Figure 14 - Location of the field measurements. Red dots indicate the location of the water samples. Yellow dots indicate the location of water samples and ASD measurements.
Water Leaving Reflectance
The water-leaving reflectance was measured with an ASD FieldSpec Pro FR
spectroradiometer. The ASD spectroradiometer measures the reflected light in the the
Visible/Near Infrared (VNIR, 350- 1050 nm) and the Short-Wave Infrared (SWIR, 900 – 2500 nm)
portion of the electromagnetic spectrum. The downwelling irradiance above the surface (Ed(0+))
was measured using an almost 100% reflecting Spectralon reference panel (Analytical Spectral
Devices, Inc.). Then, the total upwelling radiance from the water (Lu(a)) (i.e. from the water and
from the air-water interface) was measured by pointing the sensor at the water surface at 40°
from nadir, maintaining an azimuth of 90° or 135° from the solar plane, depending on the boat
orientation with respect to the sun. Downwelling sky radiance (Lsky(a)) was measured at a
zenith angle of 40° to account for the skylight reflection. A schematic overview of the 3
measurements is given in Figure 15.
IMPACTMIN Contract №: 244166
42
Figure 15 - Schematic overview of the 3 ASD measurements: (a) Lu, (b) Lsky, (c) Ed.
The water-leaving reflectance (Rw) was calculated using the following equation (Mobley, 1999):
Rw = (Lu(a)-asLsky(a))/Ed(0+) [1]
where as is the air-water interface reflection coefficient and is set to a fixed value of 0.0256
(Ruddick, 2006).
Examples of the Rw spectra measured in different locations of the study area are given in Figure
16. Note that there are significant spectral differences between these locations, which will be
further investigated in the next paragraphs. Also one can see that as of 750 nm no difference
between the location could be observed with the ASD. This because the large absorption
characteristics of water in the NIR spectral region.
Figure 16 - Water-leaving reflectance (Rw ) spectra measured in different locations of the study area.
IMPACTMIN Contract №: 244166
43
Data Types
The report on the Mostar Valley site is taking advantage of the exciting possibilities of remote
spectroscopy in the mapping and categorization of surface targets on the ground and in the water.
Several different types of spectroscopic data were used in the course of the study and their rationale is
presented below:
Remote Sensing Spectroscopy
Remote sensing spectroscopy or the reflectance spectroscopy is the study of light as a
function of wavelength that has been reflected or scattered from a solid, liquid, or gas. In this
report it pertains mainly to the observed/recorded solar energy reflected from the background
(soil, water, vegetation).
As photons enter a mineral, plant, material, some are reflected from the surfaces, some
pass through the object, and some are absorbed. Those photons that are reflected from the
surfaces or refracted through a particle are said to be scattered. Scattered photons may
encounter another surface or be scattered away from the surface so they may be detected and
measured. Photons are absorbed in minerals by several processes. The variety of absorption
processes and their wavelength dependence allows us to derive information about the
chemistry of an object from its reflected light. The human eye is by many means a crude
reflectance spectrometer: one can observe a surface and see a particular color. The eyes and
brain are processing the wavelength-dependent scattering of visible-light photons to reveal
something about the nature of the object being observed, like the red color of rust, the green
color of healthy plant or blue hues of a clean water body. A modern spectrometer, however, can
measure finer details over a broader wavelength range and with greater precision. Thus, a
spectrometer can measure absorptions due to more processes than can be seen with the eye
and determine some of the factors that are invisible to the humans.
One of the innovative concepts implemented in this Project, involved ground
spectrometry (from ground measurements) and hyperspectral remote sensing (from airplane or
satellite sensors). These sensors sample the earth surface in a large number of narrow spectral
bands over a continuous range. Such detailed measurements allow for precise investigations
and understanding of chemical and physical material properties as well as surface geometry that
are reflected in distinct spectral characteristics (Goetz et al.1985). Imaging spectrometry has
been increasingly explored to support the application of remote sensing for earth observation
purposes, i.e. for detailed spectroscopic analysis of natural targets such as vegetation and
minerals (Herold et al. 2003; Roberts et al. 1997, Clark 1999, van der Meer and de Jong 2001).
Hyperspectral images are produced by instruments called imaging spectrometers. The
development of these complex sensors has involved the convergence of two related but
IMPACTMIN Contract №: 244166
44
distinct technologies: spectroscopy and the remote imaging of Earth and planetary
surfaces. When solar radiation hits a target surface, it may
be transmitted, absorbed or reflected. Different materials reflect and absorb differently
at different wavelengths. The reflectance spectrum of a material is a plot of the fraction
of radiation reflected as a function of the incident wavelength and serves as a unique
signature for the material. In principle, a material can be identified from its spectral
reflectance signature if the sensing system has sufficient spectral resolution to
distinguish its spectrum from those of other materials. This premise provides the basis
for multispectral and hyperspectral remote sensing (Smith, R. 2012 and references
within).
Figure 17- Conceptual model of hyperspectral imaging by a hyperspectral sensor
In reflected-light spectroscopy the fundamental variable being analyzed is the spectral
reflectance: the ratio of reflected energy to incident energy as a function of wavelength
(discussed in greater detail in the next section). Reflectance varies with wavelength for most
materials because energy at certain wavelengths is scattered or absorbed to different degrees.
These reflectance variations are evident when a comparison is made between the spectral
reflectance curves (plots of reflectance versus wavelength) for different materials. Pronounced
downward deflections of the spectral curves mark the wavelength ranges for which the material
IMPACTMIN Contract №: 244166
45
selectively absorbs the incident energy, based on some type of chemical or physical parameters
within the target material.
The noted features are commonly called absorption bands (not to be confused with the
separate image bands in a multispectral or hyperspectral image). The overall shape of a spectral
curve and the position and strength of absorption bands in many cases can be used to identify
and discriminate different materials. For example, vegetation has higher reflectance in the near
infrared range and lower reflectance of red light than soils.
The following graph shows the typical reflectance spectra of five materials: clear water,
turbid water, bare dry and wet soil and vegetation:
Figure 18 - Reflectance Spectrum of Five Types of Landcover; The spectral bands used in several multispectral satellite remote sensors are shown at the top for comparison (adapted from CRISP, 2001 and Smith, 2012).
The reflectance of clear water is generally low. However, the reflectance is maximum at the blue
end of the spectrum and decreases as wavelength increases. Hence, clear water appears dark-
bluish. Turbid water has some sediment suspension which increases the reflectance in the red end of
the spectrum, accounting for its brownish appearance. The reflectance of bare soil generally depends on
its composition. In the example shown, the reflectance increases monotonically with increasing
wavelength. Hence, it should appear yellowish-red to the eye.
Vegetation has a unique spectral signature which enables it to be distinguished readily from
other types of land cover in an optical/near-infrared image. The reflectance is low in both the blue and
red regions of the spectrum, due to absorption by chlorophyll for photosynthesis. It has a peak at the
green region which gives rise to the green color of vegetation. In the near infrared (NIR) region, the
reflectance is much higher than that in the visible band due to the cellular structure in the leaves.
Chlorophyll absorbs visible light very effectively but absorbs blue and red wavelengths more strongly
than green, producing a characteristic small reflectance peak within the green wavelength range. Hence,
vegetation can be identified by the high NIR, but also the species type, plant stress, and canopy state all
can affect near infrared reflectance measurements and the obtained results.
IMPACTMIN Contract №: 244166
46
Various minerals, comprising the rocks and soils also have unique spectral signatures which
enable their identification and classification. In this particular case Iron oxide, hydroxide and sulfate
minerals exhibit both visible characteristics (red, yellow, ochre colors), but also infrared characteristics
related to the charge-transfer phenomena in their structure. When the solar radiation interacts with the
mineral, it changes the charge-state of Fe-ions, which in turn produces a measurable spectral response.
Different minerals have different degree of energy absorption as a result of it, and it is usually
manifested as a broad absorption in the NIR portion of the spectrum.
Scaling issues
Various remote sensing sensors observe the Earth’s surface at different spatial resolutions. In
deriving surface parameters using remotely sensed data, the transportability of algorithms from one
resolution to another is often of great concern because of the surface heterogeneity. Airborne sensors
(e.g. Airborne sensing systems and and spaceborne sensors generally have pixel sizes ranging from
meters, tens of meters to even kilometers (e.g. MODIS). Therefore, a reflectance recorded from a hand-
held device (field spectrometer) or an observation within an area of interest, comprised only of a few
square centimeters, would not be directly comparable to an image pixel with an area ranging from a few
square meters to couple of square kilometers collected from the same general area. To compare the
data obtained from in-situ measurements, to those from an airborne or spaceborne platform, or to use
the aerial or satellite measurements to interpolate surface phenomena within a small area, one has to
seriously consider the issues of spatial scaling.
The scaling issue has been defined as “taking information at one scale and using it to derive
processes at another scale” (Jarvis, 1995), while maintaining some level of data integrity in the process
so that the information is not lost in the process.
One of the important issues in collecting different resolution data for the purpose of getting
spatial maps showing mining impact is related to the up scaling. There are many different geostatistical
techniques that could be used to gain some information on how to merge information collected at
different scales. The surface reflectance obtained from the field spectrometer and/or airborne data, at a
given combination of wavebands, can be considered as a spatially continuous variable and analyzed for
a spatial variability and spatial correlation. The importance of this analysis comes from the fact that filed
spectrometer data collected on the centimeter scale are often used for ground thruting for airborne
data interpretation which are collected on the several meters scale.
This may be particularly important for typical parameters indicating vegetation stress and water
quality indicators. The spatial dependence and variability of analyzed parameters could be useful
information to have better interpretation of the final data maps.
Assumptions
In the course of the planning and acquisition of airborne and in-situ survey several assumptions
were made with regards to getting the optimal data from the target. The exact parameters of the
acquisition are described in the preceding sections, but to minimize the amount of glint from the water
IMPACTMIN Contract №: 244166
47
bodies reaching out and saturating the detector, the time over target was adjusted accordingly and two
different directions at which the data was acquired from the aircraft were planned into the mission.
Similarly, on the basis of using ground targets for vicarious calibration of airborne data,
assumption were made that bright spectral targets were flat and homogenous over a wider area.
Ground spectra were collected to that effect, but the issue of spatial scaling and obtaining accurate
information for each element within an image pixel were considered unfeasible, so a statistical
assumption was made that the chosen calibration targets were indeed uniform.
Data reduction
The data as it is recorded during the image acquisition is raw camera digital-number (DN)
response values and must be corrected for such issues as electrical dark current, flat fielding, bad pixel
mapping and calibration to real world radiance values, or what is known as “radiance at sensor” values.
Only once this processing to radiance is complete, can the data be analyzed based on a given target's
spectral response and calibration to various types of reflectance.
Figure 19 - Generalized schematic of path-radiance concept as related to remote sensing
Digital number values are essentially brightness intensity values required by a digital sensor.
They have the intensities ranging from 0-255 (dark-bright) and therefore contain complete, integrated
record of everything that sensor had recorded (including noise). The Digital Number (DN) is usually
multiplied by the gain value, containing certain corrections and the offset added to obtain the spectral
radiance.
(where a and b are gain and offset)
Radiance is the variable directly measured by remote sensing instruments: how much light
energy the instrument is recording from the object observed. When looking through an atmosphere, no
IMPACTMIN Contract №: 244166
48
matter how high or how low the instrument is, some of the light scattered by the atmosphere will be
also recorded by the instrument and included in the observed radiance of the target. An atmosphere
will also absorb light, which will decrease the observed radiance. Radiance is expressed in the units of
watt/steradian/square meter (Wm-2 sr-1 m-1). For this situation the spectral radiance L* at a sensor
pixel maybe parameterized as (Staenz et al., 1996; Vermote et al., 1995; Williams et al., 1992)
L* = Ap/( 1-p$) + Bp~( 1-pcS) + L*, (1)
(where p is the pixel surface reflectance, p, is an average surface reflectance for the surrounding region,
S is the spherical albedo of the atmosphere, L*, is the radiance backscattered by the atmosphere, and A
and B are coefficients that depend on atmospheric and geometric conditions)
The first term in Equation corresponds to the radiance horn the surface that travels directly into
the sensor, while the second term corresponds to the radiance from the surface that is scattered by the
atmosphere into the sensor.
Figure 20 - Flow chart for calibration of hyperspectral data
Reflectance is the ratio of the amount of energy (reflected light) leaving an observed target to
the amount of light striking the target and is therefore unit-less. If all of the light leaving the target is
“captured” for the measurement of reflectance, the result is called "hemispherical reflectance."
Reflectance, therefore is a measurement of a particular physical/chemical property of the material being
observed. Radiance, on the other hand, depends on the illumination (both its intensity and direction),
the orientation and position of the target and the path of the light through the atmosphere. With effort,
many of the atmospheric effects and the solar illumination can be compensated for in digital remote
sensing data using various models and appropriate corrections. The result of applying corrections yields
the "apparent reflectance," and it differs from true reflectance in that the shadows and directional
effects of illumination on reflectance have been modeled or not addressed at all.
IMPACTMIN Contract №: 244166
49
Radiance calibration
The author of the report, and also the principal contractor in the acquisition of airborne
hyperspectral data has a long working relationship with SpecTIR LLC., a global leader in the calibration
and operationalization of hyperspectral data. Upon collection, the author has spent considerable time at
SpecTIR’s main facility in Reno in preparing and optimizing the acquired Eagle II data for subsequent
analysis.
SpecTIR has incorporated all of the described corrections into its first stage processing software
which utilizes sensor specific files generated during the system's radiometric and wavelength calibration
(the process below is summarized from Weatherbee et al., 2012 SpecTIR process). The first stage of
processing the raw collected data is the removal of the “dark current", which is the underlying electrical
noise that is present in any and all electrical systems and if unmeasured or uncorrected, prevents the
accurate calibration of the data and possibly the subsequent detection of high fidelity spectral targets.
The SpecTIR’s approach takes advantage of and extrapolates the “dark current" measurement from the
data acquisition software in such way that the measurements are sourced from each and every flight
line of data. Essentially, the dark current is the measured signal the imaging array “sees” when no light is
striking the array(s). This is accomplished on AISA systems through the use of an after-market electro-
mechanical shutter system that SpecTIR has developed in house.
The next step is the normalization of the array response. Each element on the focal plane array
has a slightly different response to the amount of incoming light and so in order to convert these values
to something meaningful, these response levels must be normalized in what is known as “flat fielding."
SpecTIR has combined this flat fielding step with the actual calculation of radiance values utilizing the
“calibration” file which is essentially a gain factor calculated for each and every detector on the imaging
arrays.
As previously mentioned, the radiometric calibration file is generated during the system's pre
and post mobilization calibration procedure. SpecTIR’s standard radiometric calibration is achieved
through the use of a Labsphere USS- 2000-V uniform source. This 20-inch diameter integrating sphere is
equipped with is capable of outputting variable luminance from 0 to 4000 foot-lamberts with measured
uniformity > 98% over the entire 8-inch exit port. This sphere carries a NIST traceable spectral radiance
calibration from 400 nm to 2500 nm at a sampling interval of Snm. The resultant calibration allows
SpecTIR to provide data that is within +/- 5% of absolute radiance.
Wavelength calibration is generated through an Oriel Cornerstone 130 1/8m monochromator.
This automated, computer controlled monochromator provides calibrated and repeatable wavelength
outputs of 1 nm channels in the VNIR and 3 nm in the SWIR range. The central wavelength locations of
this output is known and certified within 0.5nm accuracy. Additionally, data QA/QC processing routines
utilize well-documented atmospheric features such as the Oxygen Fraunhoffer line at 763 nm to ensure
that accurate wavelength mapping is maintained.
Through the radiance calibration process, radiance data units and scaling factors are
documented in the header files for each processed flight line. Standard units are
IMPACTMIN Contract №: 244166
50
mW/(cm2*steradian*m) with a scaling factor of 1000. In analyzing the data then, an image value of
4500 with a scaling factor of 1000 would indicate a real world radiance value of 4.5
mW/(cm2*steradian*m).
The final stage in the radiometric processing relates to the correction for bad and/or dead pixels
on the imaging array. All CMOS based cameras suffer from these defects which include not just dead or
nonresponsive pixels but also pixels which do not respond linearly or predictably to the amount of
incoming light. If uncorrected, these pixels can lead to false spectral and or spatial anomalies. The
identification of these elements generates what is known as a "bad pixel map." Spectir's radiance
processing program incorporates these maps utilizing a proprietary compensation algorithm to remove
the spatial and spectral contribution of these elements in the array.
Reflectance Calibration
In order to convert the calibrated radiance data to surface reflectance values, SpecTIR employs a
3rd party implementation of the industry standard MODTRAN4 radiative transfer code. The software
package ATCOR-4 utilizes MODTRAN4 atmospheric lookup tables and proprietary techniques to correct
for atmospheric absorption and scattering components. During processing, ATCOR-4 generates log files
for each flight line which provide information on all input parameters and program settings. These ASCII
files are included in the data distribution directory.
In handling atmospheric absorption features, ATCOR-4 incorporates three possible interpolation
schemes. In generating the final reflectance product the provider will select the best combination of
interpolation options for the given data set. Linear interpolation is employed in the 760,725, and 825 nm
atmospheric absorption regions. Non-linear interpolation is applied in the 940 and 1130 nm parts of the
spectrum based on the function of the vegetation index to account for the leaf water content in plants.
Lastly, non-linear interpolation is performed in the 1400 nm and 1900 nm water vapor absorption
regions by fitting the curves with a hull of a template vegetation or soil spectrum. The interpolation
parameter settings are identified in the associated log files and in addition all interpolated channels are
marked with an "*” in the ENVI headers of the reflectance files.
The raw output reflectance data is evaluated for any model or sensor related artifacts which are
then compensated for via library based spectra modifications and polishing. Polishing of the reflectance
is achieved using a SpecTIR proprietary program based on a Savitsky-Golay algorithm with refined
handling of atmospheric absorption features associated with CO2 and water.
Georectification
The georeferencing process generates an Internal Geometry Map (IGM) file which is a two-band,
pixel-by-pixel identification of easting (band 1) and northing (band 2) values for the unrectified image.
Also provided is the associated Geographic Lookup Table (GLT) file which is a two-band file of the
unrectified pixel locations (x,y) projected into map space. These industry standard files are used by
image processing software to generate fully navigated and georeferenced imagery of subsequent
analysis products. The basis for geographic correction is derived from the on-board navigation and GPS
files recorded by the instrument (Weatherbee, et al. 2011).
IMPACTMIN Contract №: 244166
51
To create the IGM and GLT from the navigation (NAV) files that the sensor’s inertial motion unit
(IMU) records, the data are first corrected for the aircraft motion and then orthorectified (ray-traced) to
the appropriate pixel on the ground. The process employs a full three-dimensional ray tracing and a 30m
spatial resolution digital elevation model for complete orthorectification: each pixel in the imagery is
individually ray traced using the best-estimate of sensor location and attitude until it intersects the
digital elevation model. The digital model used was derived from a 1:25,000 topographic model
generated by the Geodetic Institute of the Federation of Bosnia and Herzegovina, with a reported 10m
accuracy. However, some slight datum modifications had to be used to match the WGS-84 based
navigation data from the sensor to the Gauss-Kruger, Bessel 1841 datum projection of the DEM. The
spatial fidelity of the data is hence corrected, especially in areas of rugged and variable across-track
terrain, which is the case with the Mostar site.
Noted parameters for Gauss-Kruger, Zone 6 (Bosnia and Herzegovina) projection are as
The data that were derived from the process from raw to radiance-at-sensor to reflectance,
were finally calibrated with vicarious calibration of the image spectra using the ground-spectra collected
at the time of the overflight. This type of calibration is referred to as the empirical line calibration.
In-situ reflectance data were collected using ASD FieldSpec hyperspectral radiometer in the full-
spectral region (325nm to 2550 nm). It was then resampled by averaging intermediate points to match
the airborne sensor bandwidth. Spectral Angle Mapper algorithm was used to identify targets in the
image by comparing the angular deviation between the image spectrum and in-situ spectrum for each
target at every pixel.
Observation was made under clear skies and the spectrum was constantly checked for artifacts.
Errors which generally occur during field spectra collection (from Gu et al. 1992) were minimized by
carefully selecting the acquisition conditions and using calibrated Spectralontm white-reference panel
with directional / isotropic-hemispherical reflectance factor. Measurements were made near solar noon
when the solar geometry is changing least and when the errors due to the angular response of the
reflectance panel are at a minimum.
The ASD spectrometer spectra had displayed atmospheric effects in the UV (325 – 400nm)
region and at the NIR 1000 to 1075nm region. Hence this region was cropped off to make for a better
match with AISA Eagle II and a spectral library was made from 420 to 970nm for 17 common target
endmembers for later comparison and empirical line calibration. Two main locations selected for the
acquisition of ground-spectra were a relatively uniform, carbonate-gravel portion at the entrance to the
mine (bright target) and a patch of dark, deep water in Neretva river (dark target).
Two targets (light and dark) with known reflectance (R) and at-sensor radiance (L) are joined by
a straight line with slope s and intercept a. The reflectance for any at-sensor radiance can be computed
from R = s (L-a). The term „a” represents atmospheric radiance. This equation is computed for all four
spectral bands (Smith and Milton 1999).
The objective of ELC is to determine the slope 's' (multiplicative factor / gain) and intercept 'a' (additive
factor / offset) from the bright and dark pixels and apply the same to rest of the pixels to determine
their reflectance. ELC forces image spectra to match field reflectance spectra (Cone et al. 1987) and thus
normalizes both the spectra for further analysis.
IMPACTMIN Contract №: 244166
53
It was determined that when the spectra of intermediate pixels were used along with the brightest and
darkest pixels, the effects of ELC improved dynamically. Similar effects were reported by Goetz et al.
(1997). By applying ELC to a radiometrically corrected image, the resultant solar irradiance and
atmospheric path radiance effects were removed (R.J. Aspinall et al 2001) and the resulting spectra is
comparable to most field and laboratory spectra (Smith and Milton 1999).
Figure 21 - Empirical line calibration method and sites chosen for the calibration
IMPACTMIN Contract №: 244166
54
Part 3 – Analysis The purpose of this section is to show the analysis results of all components used in the Mostar
Valley study site: satellite imaging, airborne imaging, light-UAV imaging, water spectroscopy and
analysis. Each individual segment contributes an additional layer of evidence towards understanding all
of the elements of the Mostar study site and impacts to the environment.
Satellite Imaging The spectral resolution of worldview2 multispectral data is considered high enough to map different
surface parameters related to the environmental impact at Mostar Valley site and is therefore given
attention and advantage over other satellite datasets available (e.g. Landsat, ASTER). The focus of the
investigation is on the following elements:
1) Soils: different iron-bearing secondary minerals, such as goethite, jarosite.
2) Vegetation: NDVI, red-edge estimation
3) Water quality: algae, suspended material.
Data acquisition and pre-processing
The Worldview-2 image, used in the study, was acquired on July 21 2010, 10.03 hrs. The image
was orthorectified using SRTM and ground control points collected in the field during the summer
2011 field season. Further improvement of positional accuracy was obtained by aligning the WV2-
image with the high-precision SmartPlanes UAV images. Raw WV2- spectra were converted to
absolute radiance using the Envi Worldview radiance calibration utility.
Spectral analysis
In order to support the assessment of the potential impact of the open pit mining activities on
its surroundings, a land cover map was produced with the following classes: Water, Urban area,
Vegetation, Goethite, Hematite, Jarosite (see Figure 22)
IMPACTMIN Contract №: 244166
55
Figure 22 - Image showing the results of Land-cover classification
Vegetation Analysis
For mapping of vegetation distribution and eventual stress, a Normalized Difference
Vegetation Index (NDVI) was used, comprising of matching Worldview 2 spectral bands (red:
WV5, NIR WV7). The exact function of the vegetation indices is discussed at great detail in the
Deliverable 4.1 of the ImpactMin report. The index was thresholded at 0.252 value. Stretching
and color coding of the NDVI image (Figure 23) shows high NDVI-values in the open pit area,
indicating that the vegetation in this pit area is relatively dense and healthy.
IMPACTMIN Contract №: 244166
56
Figure 23 - Color-intensity (EOS-B) coded NDVI image showing vegetation intensity (robustness) in the Vihovici Mine area
Urban area
The Urban area is highly mixed, and in order to achieve a proper classification we had to
split the area into two different classes:
- Concrete, asphalt and metal roofs, - Roofs with red tiles
Roofs with red tiles: For the classification of the red tiles it was important to make sure that this
class did not overlap with the iron oxide classes. It was determined in the course of the analysis
that the best method to distinguish the red roofs from other ferruginous materials was by using
the so called Normalized Brick Roof Index (Zhou et al, 2012), defined as :
(WV4-WV3) /(WV4+WV3).
IMPACTMIN Contract №: 244166
57
Concrete, Asphalt and metal roofs: We were not able to classify these materials into separate
classes, as their spectra did not show consistent differences. However, due to the relatively
wide spectral variation within this group of materials, we were also not able to classify all these
urban materials as one class. Hence we had to use a stepwise approach in order to make sure
that a relatively complete classification result was obtained.
- Step 1: Directed Principle component analysis which was trained on specific parts of
the urban area.
- Step 2: Mahalanobis classification for parts of the urban area that remained
unclassified after the Principle Component analysis
Water body detection
Factors such as sun-glint, water- turbulence and image resolution appear to limit the
usefulness of the Worldview data for monitoring water quality at the scale of this project. Two
sets of images are shown below where the Worldview2 (RGB=421) is compared with digital
imagery acquired with the Smartplanestm UAV data.
The top images are showing the Vihovici Pit lake. The effect of the sun-glint in the WV2-
image is very obvious, and the observer can also very clearly observe that the shallow parts of
the pit-lakes, visible in the Smartplanestm-UAV image, cannot be identified in the WV2-image.
The bottom images show the Neretva river just south of the reservoir. And in this case, both
sun-glint and turbulence mask the details that are visible in the Smartplanes UAV image.
The classification of water is a complex proposition, because of factors such as presence
of sun-glint, turbidity, suspended matter, shadows etc. tend to distort the useful signal. In the
course of the experimentation with the best band-fit for water classification using WV2 data, it
was determined that the most feasible approach is to classify the water bodies was by using the
ratio (WV3-WV8)/(WV3+WV8).
Unfortunately the classification of water is very sensitive to shadows. Several studies
(e.g. DLR, 2011 technical report on active shadow) have noted that that shadows can be
classified quite effectively by using the WV2/WV3 ratio, but in this case we could not achieve
optimal separation of the very dark parts of the water and the shadows.
IMPACTMIN Contract №: 244166
58
Figure 24 – Vihovici pit lake and Neretva river observed with Worldview 2 (left) imagery and Smartplanes UAV digital airborne imagery (right)
IMPACTMIN Contract №: 244166
59
Secondary Iron minerals
As reported in the overview of ground-spectroscopy and sample collection, it was possible to
only identify Goethite in the 19 samples collected.The presence of other Iron-bearing minerals, like
Hematite and Jarosite, could not be confirmed in the open pit area with the ground spectra. The results
presented below show some of the iron minerals detected remotely, and in the case of goethite, the
match is good.
Goethite: For the classification of Goethite we have used the information of the spectral
sampling. As can be seen in Figure 3, the spectrum of sample 19 shows the most prominent goethite
signature. Consequently, the corresponding pixel spectrum of the WV2-image was used as reference for
a Spectral Angle classification.
Figure 25 - Left: WV2-colour composite image with the spectral samples plotted, and with the results of the Spectral angle classification overlain. The inset shows the spectra of samples 19, 7 and 3. The markers are color coded according to their
ratio of r800/r880
As there were no occurrences of Hematite or Jarosite in the samples collected, it was not possible to use
field locations as a basis for the classification and we had to take different approaches for the prediction
of these minerals:
IMPACTMIN Contract №: 244166
60
Hematite: In the image we identified dark red areas without vegetation that had not been
classified as goethite, assuming that these might be hematite, and used these as reference for a spectral
angle classification.
Jarosite: Jarositic soils are normally hard to identify visually, as they are usually rather bright,
and usually consist of an intimate mixture with Goethite, however jarosite tends to have a yellowish-hue
to it.
However, compared to other minerals that are identified in the area, such as goethite, kaolinite,
calcite, and perhaps hematite, jarosite has a fairly distinctive spectrum in the Visible and NIR. In Figure
26 we have plotted the laboratory spectra of these minerals, resampled to WV2-band positions. This
figure shows that the Fe-minerals , and in particular jarosite, have a distinctive spectrum compared to
kaolinite, calcite and vegetation. Based on these spectra it is possible calculate which band-ratios would
be most useful to predict the presence of jarosite.
We have tested each of these band ratios and found that probably the ratios of WV3/WV2 and
in particular WV4/WV2 give most realistic results. This conclusion is supported by the fact that these
two band ratios are the only two that successfully mapped some yellow objects in the image (Figure 27)
Figure 26 - Laboratory spectra of representative materials, resampled to WV2 band positions.
IMPACTMIN Contract №: 244166
61
WV3/WV2 WV4/WV2 WV6/WV4 WV5/WV4 WV6/WV8
Calcite 1.00 1.00 1.00 1.00 1.00
Kaolinite 1.05 1.07 1.01 1.00 1.00
Jarosite 1.6 2 1.28 1.13 1.65
Goethite 3.6 5 1.28 1.00 1.13
Hemathite 1.00 7 1.86 1.3 1.00
Vegetation 3.6 1.8 > 2.0 < 1.0 < 1.0
Table 3- Various band-ratio values for representative surface materials in the image.
Figure 27- Left: Yellow object in the WV2-image; Center: Colour coded image of the ratio WV4/WV2; Right: Jarosite laboratory spectrum and Yellow object spectrum from image compared
IMPACTMIN Contract №: 244166
62
Figure 28 - Worldview 2 image with secondary Fe minerals abundance classes, derived using procedure above.
IMPACTMIN Contract №: 244166
63
Airborne data analysis Hyperspectral imagery was used to investigate for the potential sources of aquatic, atmospheric
and land pollution from the mine waste tailings, bauxite-ore waste storage and other areas of interest.
The hyperspectral data were intended to map iron oxide and sulfate minerals in the high-sulfur, sub-
economic coal seams piled on the fringes of the old mine, vegetation stress and water quality
degradation in the river Neretva and the old mine-pit within Vihovici as well as distribution and
condition of the red-mud in the bauxite-ore containment in the southern Mostar valley, partially as a
result of lessons-learned from the Ajka-Kolontar, Hungary red-mud spill in October of 2010, where
Photon llc. had also participated in the acquisition and analysis of hyperspectral data. It must be noted
that the red-mud storage facility in Mostar was appraised as a target of opportunity in the light of the
Hungarian disaster (“better safe than sorry” adage), which had occurred during the duration of the
ImpactMin project. The airborne hyperspectral data were augmented with the high-resolution optical
imagery derived from a light, unmanned, Smartplanes UAV which had been collected by Geosense over
different parts of Mostar Valley.
Land target classification
The detailed discussion on algorithms for hyperspectral image analysis is discussed in
Deliverable 5.1 of the ImpactMin report. The discussion presented here focuses on the types of
algorithms applied for the classification and analysis of hyperspectral targets on the ground elements:
particularly minerals that may have a detrimental effect to water quality and/or slope stability in
Vihovici, or red-mud dispersal at the Red Mud site in Mostar Valley.
Algorithm Choices, Ground
Reducing the multi-sided and voluminous dataset that is geared towards identification and
classification of a particular targets requires the use of a right algorithm or a set of algorithms. The high-
resolution spectral data can be used to detect and identify spatially resolved or unresolved objects on
the basis of their spectral signatures. If each material had a unique spectrum, the solution of detection
and identification problems would be relatively straightforward. However, there are always present
varieties in material composition, illumination and atmospheric propagation, in addition to instrument
noise, which all introduce random spectral variations. Also the measured spectrum of every pixel in the
imaged scene includes a mixture of object, neighboring objects, background contributions and
atmosphere. Thus, every detection algorithm has to overcome two major obstacles: spectral variability
and background interference (Manolakis et al, 2009) .
IMPACTMIN Contract №: 244166
64
Figure 29 - Data-cube structure, spectral variability, and subpixel interference in hyperspectral imaging (adapted from Manolakis et al., 2009).
Supervised classification of multi- and hyper-spectral imagery is a robust technique that can be
applied in almost all the challenges facing the Mostar Valley: mineral mapping, vegetation stress, water
quality and so on. Detailed description of algorithms is included in the Appendix 1 section of this report.
Mineral Spectra Identification
The emphasis on the mineral identification in Mostar Valley is towards iron oxide, hydroxide and
sulfate minerals as they are present as an overburden in coal beds as well as the main component of the
alumina-byproduct red mud. The secondary minerals of importance were clay minerals, detectable only
generally within the possibilities of a visible-near infrared system like Eagle II hyperspectral scanner.
Iron is often the most abundant contaminant in mine water, particularly in coal mine drainage.
Even though concentrations of heavy metals vary by coal seam and geographic region, a variety of
metals are associated with it, which are either found in the coal directly or in the layers of overburden
and inter-layers between different coal seams. The mobility of heavy metals in coal mine waste piles
depends not only on their current states and the stability of their host minerals (usually clays), but also
on the properties of the coal itself. In the process of coal mine waste-water interaction (meteoric and
groundwater), sulfides that contain heavy metals first break down and release metals, which are then
adsorbed and complexed by the iron oxide-hydroxide colloid resulting from pyrite oxidization and
organic matter (naturally occurring in the coal). During the natural weathering of coal mine waste, only a
small fraction of the metals are released to the environment immediately; most of them still remain in
the residual material and release material over lengthy time period (Dang et al,. 2002).
IMPACTMIN Contract №: 244166
65
Figure 30 - Processes that lead to secondary sulfate-mineral formation from oxidation of primary Fe-sulfide minerals. Acid-generating steps are underlined. Adapted from Hammersmith et al. 2005.
Metals appear in the municipal solid waste stream from a variety of sources: batteries,
consumer electronics, ceramics, light bulbs, house, dust and paint chips, lead foils such as wine bottle
closures, used motor oils, plastics, and some inks and glass can all introduce metal contaminants into
the solid waste stream. In small amounts, many of these trace elements (e.g., boron, zinc, copper, and
nickel) are essential for plant growth. However, in higher amounts they may stunt or decrease plant
growth. Other trace elements (e.g., arsenic, cadmium, lead, and mercury) are of concern primarily
because of their potential for bioaccumulation in the organism.
Reflectance spectra are exploited to delineate zones of problematic mineralogy, particularly in
the instance of hydrophilic clays (e.g., montmorillonite, illite) which tend to contribute to landslide
propagation either by increasing the loading factor of the slope or serving as a lubricant in plane motion.
By applying HSI, it is possible to determine the presence of sulfates (e.g., jarosite) which can be
indicative of acid-dissolution and weathering of surface rocks, presence of iron oxides and hydroxides
(e.g., goethite, limonite) often indicative of water-rock interactive processes and weakening of surface
layers and/or changes in the cohesiveness of the revetment. The combination of both image and point
spectra allow us to determine the extent of the problematic zones as well as the type of vegetative
cover as an indirect observable in determining the propagation-likelihood of mass-wasting within the
observed area. This type of observation is mainly geared towards pit walls and revetments holding the
pit lake in Vihovici, and the overall cohesiveness of other barriers holding the mine waste in the Mostar
Valley region.
IMPACTMIN Contract №: 244166
66
Iron Mineral Spectra
The iron sulfate and iron oxide minerals include jarosite [(K,H3O,Na)Fe3(SO4)2(OH)6],
RMLI showed a strong correlation (R2 =0.72, n=14) for dry and moderately- wet red mud layer. The
index was applied to the mask of the red mud generated from SAM image. Accuracy of red mud map
was ground-truthed with 68 field points. Overall accuracy was 74.2% in determining the depth of red
mud layer in the thickness of 3cm or more; in 25.8% of the cases the index had over-estimated the
thickness.
Figure 34 - Scatter plot of 549nm and 682nm wavelengths of affected study area (28,900pixel). A ellipsoid represents dry and moderated wet (50-92%) red mud, B ellipsoid represents red mud with high wet content (less than 50%).
IMPACTMIN Contract №: 244166
69
Clay Mineral Spectra (VNIR)
Clay minerals are mainly identified in the shortwave portion of the infrared spectrum (SWIR),
however due to the primary focus of the Mostar study site on water and Fe-minerals, and the choice of
a VNIR-only sensor, only the visible-near infrared portion of the spectrum could be used for the general
detection of clay minerals. This type of mapping is not without precedent. Brown et al. (2006) built a
VNIR calibration for clay minerals and was able to predict kaolinite and montmorillonite within one
ordinal unit from X-ray diffraction data 96% and 88% of the time, respectively. Goetz et al. (2001)
investigated using NIR spectroscopy to measure smectite content in selected Colorado soils (r=0.83).
Because the literature shows VNIR absorbance associated with clay mineralogy, one may expect that the
wavebands significant to predicting soil clay content to be similar to mineralogy wavebands.
The majority of the distinguishing features in the VNIR region pertaining to clay minerals is
derived from the charge transfer phenomena of Cr 3+ and Fe 2+/3+ that some of the clays have in their
structure, but are somewhat offset from the FeO/OH/SO4 mineral absorption bands. Other clay
minerals, such as montmorillonite, have water in their structure which can be detected towards the
900nm range of the spectrum. Lastly, where Fe-group minerals may have absorptions, clay minerals do
not, thus facilitating their detection.
Figure 35 - Reflectance spectra of mineral endmembers selected in Mostar and their comparison with USGS mineral spectra
The acquisition of field point-reflectance and image-reflectance spectra, from the geotechnical
standpoint is to delineate zones of problematic mineralogy, particularly in the instance of hydrophilic
clays (e.g. montmorillonite, smectite, illite) which tend to contribute to landslide/slope failure
propagation either by increasing the loading factor of the slope or serving as a lubricant in plane motion.
Furthermore, reflectance spectroscopy in 450-2500nm region of electromagnetic spectrum is useful in
IMPACTMIN Contract №: 244166
70
identifying other types of minerals, which may compromise slope stability. Examples include the
presence of sulfates (e.g., jarosite) which can be indicative of acid-dissolution and weathering of surface
rocks , presence of iron oxides and hydroxides (e.g., goethite, limonite) which can be indicative of water-
rock interactive processes and weakening of surface layers and/or changes in the cohesiveness of the
carbonate host rock (Smailbegovic et al., 2011).
Figure 36 - Reflectance spectra of mineral endmembers at Vihovici and Red Mud site
Mineralogical Analysis, Vihovici
The available data shows that the concentration of iron and clay minerals largely correspond
with the observed geology of the area and the former exploitation of the coal at the Vihovici mine site.
There are certain anomalies, mainly with regards to the sulfate minerals that may not be related to the
mining itself but later industrial/dumping activities around the mine. The main concentration of iron
minerals is in the northern segment of the image where the iron-rich top seam is exposed. These are
various types of iron minerals in the different stages of weathering which eventually seem to be all
diverging towards the lake water where they are either dissolved and/or deposited in the sediment.
The clay minerals mainly dominate the dump material areas where the clay-rich mudstone
overburden was deposited. In places the clays have a stabilizing effect whereas in the pit wall they may
be problematic when they are contained within the structure. Clay minerals, particularly
montmorillonite tend to swell when wet and may result in the subsequent slope failure, which could
negatively impact the overall cohesiveness of the site (Figure 37).
There is an interesting occurrence of iron oxides, sulfates and clays in the northern-
northwestern segment of the image, enlarged in the northern-section view of the Vihovici area where
the mineral maps tend to follow the trend of the underground coal seam burning zone. The type of
minerals present suggest possible alteration of the surface mineralogy as a result of intense heat from
the former zone of intense burning (now smoldering, Figure 38).
IMPACTMIN Contract №: 244166
71
There are apparent concentrations of sulfates along the eastern boundary of the scene, along
the areas where former vehicle battery-dismantling junkyards were. It is possible that some of the areas
may represent sulfate-polluted soils again in the vicinity of the mine itself.
IMPACTMIN Contract №: 244166
72
Figure 37 - Distribution of mineral species at Vihovici, mapped with airborne HSI
IMPACTMIN Contract №: 244166
73
The vegetation stress in the scene was identified using NDVI and senescence indices, mainly as a
supporting element in determining whether the distribution of surface minerals (namely sulfates) may
have a detrimental effect to overall vegetation. On the basis of the used vegetation indices, and the
decrease of chlorophyll reflectance profile, the greatest stress to vegetation appears to be in the
southern part of the scene, near the entrance where the largest concentration of waste was deposited
and then covered during the rehabilitation. The secondary zones of vegetation stress are located in the
northern portion of the scene, along the E-W burning zone trend in the northern portion of the scene,
around the former waste piles containing sub-economic layers of coal top seams in the north and
northwest, and along the eastern side where former battery-dismantling facility was, before the mine
was rehabilitated. Due to the general lack of water and nutrients on the limestone-karst sides of the
mountains on the western and northern side of Vihovici, there is a broad trend of senescence across the
range. As a whole, the distribution of Fe-minerals and vegetative stress appears to be in the zones that
were readily affected by the problem stemming from the underground fires at Vihovici mine. When
compared with the maps and geophysical data derived from the 2007-2009 remediation campaign, the
correlation suggests that the areas of increased burning and CO2 concentration have contributed to the
vegetation stress. As noted before, some of the greatest concentrations of sulfate minerals (jarosite,
copiapite) tend to occur in the area identified by geophysics and subsequent probing as the main burn
zone (Figure 40). There is a possibility that some of the oxidation/reduction processes resulting from the
burning of the coal seam may have resulted in the mineralogical changes in the soils, thus negatively
impacting the vegetation.
Lastly, hyperspectral data have also outlined anomalous reflectance values, which had no
apparent spectral library match. When queried with the high-resolution UAV data, it was discovered
that they represent various zones of concentration of household waste – mainly plastic. Those
anomalous zones were outlined and shown on Figure 41.
IMPACTMIN Contract №: 244166
74
Figure 38 - Distribution of mineral species and relationship to some of the mapped structures and geotechnical observations, north side of Vihovici pit.
IMPACTMIN Contract №: 244166
75
Figure 39 - Hyperspectral mineral map overlain on the data from 2009 remediation effort to identify the zones of burning. Note that sulfate concentration directly correlates with the identified anomalous areas of geothermal measurements (M)
using ground magnetic data.
IMPACTMIN Contract №: 244166
76
Figure 40 - Vegetation stress identified using senescence index (left) and same image overlain on the base of CO2 measurements from KfW report (2009). Note vegetation stress correlating with the areas of increased CO2 concentration.
IMPACTMIN Contract №: 244166
77
Figure 41 - Locations of accumulated plastic-dominant household waste
IMPACTMIN Contract №: 244166
78
Mineralogical Analysis, Red Mud Storage
Red mud storage area south of Mostar and the former alumina-producing facility within the
Mostar Aluminum plant have been investigated with the red-mud index. The data suggest that the large
parts of the lagoon are occupied by still very recognizable and relatively wet red mud, but that certain
areas on the fringes of the pit have started to dry where they are probably picked up by wind and
scattered around the depression. There are also certain zones where there appear to be some leakage
from the pit, probably as a result of water being splashed over the side as a result of the strong
“nor’easter” that blows in Mostar during the winter months. The revetment itself appears to be fairly
solid, but the lack of maintenance is apparently making the red mud more prone to scattering.
Similarly, the old facilities where the alumina was produced are heavily covered with the
remnants of the old process. Some of the surrounding areas at the factory still contain concentrations of
old alumina byproducts probably scattered by wind and/or water.
Figure 42 - Red mud storage pond at Dobro Selo, south of Mostar and the section of Aluminij factory showing the location of formed crusher and alumina production facility with the derived Red Mud Index.
IMPACTMIN Contract №: 244166
79
Water Target Classification
The possibility to identify and quantify water quality parameters using airborne remotely sensed
data was examined. Two different approaches were taken for this purpose: (i) using empirical algorithms
developed for extracting water quality parameters on the River Sava from hyperspectral remotely
sensed data, (ii) developing algorithms using coincidental water quality and remotely sensed data
collected over Neretva during the course of the Mostar site assessment.
Table 4 - Methodology applied for water target classification
Algorithms Developed
The following table contains algorithms developed using data collected in 2010 and 2011 on the
River Sava. The River Sava is the longest river connecting ex-Yugoslavia states flowing from its source in
Slovenia, along the border of Croatia and Bosnia and Herzegovina and flowing into the river Danube in
Belgrade, Serbia. The general environmental condition of the Sava River can be characterized as heavily
influenced by land based pollution especially compared to the environmental conditions of the Neretva
river in Mostar.
1 •Acquiring water quality and hyperspectral field data
2 •Establishing correlations between hyperspectral and water quality parameters
3 •Development of empirical algorithm
4 •Acquisition of air-borne data
5 • Image processing
6 •Mapping of water quality parameters
7 •Validation of the products
IMPACTMIN Contract №: 244166
80
Retrieval algorithm
Equation R2
ChlA.1 Chl a = -7.272376+6.777723*(R735/R759) 0.67
ChlA.2 Chl a = -1.53029+1.102766*(R736/R865) 0.60
ChlA.3 Chl a = -1.237661+0.7598194*(R745/R906) 0.61
ChlA.4 Chl a = 2.2723307+-0.6519126*(R430/R745) 0.59
ChlA.5 Chl a = 4.209702+-4.210081*(R507/R608) 0.51
ChlA.6 Chl a = 2.1465575+-0.5803494*(R430/R771) 0.51
ChlA.7 Chl a = 2.6102464+-0.6697774*(R470/R745) 0.55
ChlA.8 Chl a = 2.3977+-1.298149*(R490/R713) 0.50
ChlA.9 Chl a = 6.176651+-5.170117*(R658/R683) 0.60
TN.17 TN = -37.97092+37.6691*(R836/R839) 0.57
TN.18 TN = -3.589019+2.367858*(R722/R776) 0.44
TN.19 TN = -3.475348+2.755365*(R837/R901) 0.46
TN.20 TN = 2.35407+-1.087607*(R460/R719) 0.52
TN.21 TN = 2.0881558+-0.4576306*(R465/R820) 0.40
TN.22 TN = 4.06157+-4.579445*(R500/R598) 0.52
TSS.32 TSS = -646.8609+1274.9923*(R514/R570) 0.49
TSS.33 TSS = -264.6255+469.2851*(R673/R701) 0.60
TSS.34 TSS = -199.2159+132.1282*(R673/R758) 0.56
TSS.35 TSS = 934.5886+-533.6292*(R605/R660) 0.70
TSS.36 TSS = 1317.1415+-880.4062*(R620/R660) 0.70
Tur.37 Tur = -48.55146+39.74432*(R829/R885) 0.41
Tur.38 Tur = -959.528+939.7681*(R856/R863) 0.70
Tur.39 Tur = 410.7126+-380.765*(R636/R651) 0.59
Tur.40 Tur = 38.60209+-21.88405*(R500/R673) 0.52
Tur.41 Tur = 64.45319+-40.14221*(R626/R681) 0.51
Table 5 - Algorithm developed on the RIver Sava for the retrieval of Chl-a, total nitrogen, TSS and turbidity
IMPACTMIN Contract №: 244166
81
The other approach taken was to develop the empirical water quality extraction algorithms
exclusively using data over the Neretva River taken at the time close to acquiring airborne remotely
sensed data. The advantage of such approach is that it takes into account the inherent optical properties
of the Neretva River providing more reliable results for the specific spatial and temporal conditions
present at the time of the airborne survey. A main disadvantage is a relatively small set of data that was
used for algorithm development, which further needs to be tested for robustness regarding temporal
and spatial changes.As the first step, a correlation was tested between water quality data and ASD
measurements acquired coincidentally at the measuring stations in the Neretva River and Vihovici lake
(presented at the Table 1
Algorithm Application
The algorithms for extracting water quality parameters from spectral data were tested on the
air-borne reflectance spectra. To facilitate creation of water quality maps in ENVI software package, a
IDL script was developed to apply the selected algorithms on the airborne hyperspectral data, produce
the maps and output values of particular pixels which location corresponds to the field measuring
stations. These pixel values were used for validating the estimated water quality with the analytically
measured values from the samples taken at the same locations.
The evaluation of the algorithms was based on the percent difference between estimated and
analytically measured values:
ei = 100 ´ (WQPesti-WQPmeasi
) / WQPmeasi (1)
WQP – Water quality parameter
Mean normalized bias (MNB) is an indicator of systematic error and the normalized root mean square
error (NRMS) is an indicator of random error:
MNB=mean(ei )% (2)
NRMS= stdev(ei )% (3)
The tables below shows the performance of different algorithms.
IMPACTMIN Contract №: 244166
82
Algorithm NRMSD (%) MNB (%) R2
ChlA.1 1611.68 -945.06 0.01
ChlA.2 432.26 -313.93 0.06
ChlA.3 730.97 -386.96 0.33
ChlA.4 7536.14 2978.08 0.10
ChlA.5 2205.19 -1230.20 0.19
ChlA.6 4908.66 1949.48 0.17
ChlA.7 9463.25 3791.71 0.11
ChlA.8 6665.89 -3250.68 0.18
ChlA.9 148.69 18.36 0.04
TN.17 13820.40 -4043.46 0.03
TN.18 560.22 -644.57 0.03
TN.19 1593.74 -1008.52 0.08
TN.20 14622.37 -3521.93 0.01
TN.21 18694.79 7130.21 0.06
TN.22 474.16 -1020.83 0.12
TSS.32 22866.36 57661.35 0.27
TSS.33 32757.42 48239.83 0.16
TSS.34 52061.61 -30911.40 0.04
TSS.35 25135.64 3932.16 0.17
TSS.36 29433.05 2086.06 0.13
Tur.37 434.14 -430.25 0.02
Tur.38 9304.57 1676.22 0.42
Tur.39 1058.38 1784.11 0.00
Tur.40 649.40 -83.02 0.44
Tur.41 388.37 1730.39 0.01
Table 6 - Performance of algorithms developed from the Sava River dataset and applied to Neretva airborne data
All the tested algorithms developed for the River Sava performed very poor over the complete
dataset, Generally, better performance was observed only by ChlA.9 which overestimated measure
IMPACTMIN Contract №: 244166
83
values by 18.36%, showing weak correlation (0.04 R2) and Tur.40 which underestimated measured
values by 83%, but showing strong correlation (0.44 R2). Other algorithms that showed moderate or
strong correlation, although performed poorly predicting the water quality values, are ChlA.3, ChlA.5,
This suggest that the band ratios used in these algorithms are useful to estimate water quality
parameters in the Neretva River and Vihovići lake , but that the numerical coefficients need to be
modified. To achieve such more robust algorithms that are tuned better to the bio-optical conditions of
the River Neretva, the Sava River algorithms have to be further optimized by using Neretva data. This is
one of the possibilities for future work.
Tested algorithms show promising results for monitoring water quality parameters in the River
Neretva and Vihovići Lake. It is necessary to collect more data at the site to develop more robust
algorithms. This is a possibility for future work. The results are presented in the Figures (62-67) following
the discussion on correlation between airborne and in-situ data for Vihovici mine site below.
Airborne pre-processing
The airborne AISA-EAGLE data were corrected for geometric and atmospheric distortions, as
explained in the land analysis part of the Mostar demo. Although the applied combination of FLAASH
and empirical line methods for atmospheric correction worked fine for land applications, an extra
vicarious calibration was needed to extract the water leaving reflectance from the AISA hyperspecral
imagery. This because:
In general water spectra are very dark in comparison to land targets, leading to overestimation of reflectance values after the first empirical line correction
Sun light directly reflected at the air-water (i.e. skylight reflection) interphase should be corrected for. This skylight reflection mainly effects the lower wavelength part of the spectrum and is illustrated in Figure 52.
Figure 43 - Effect of skylight correction for water reflectance spectra.
IMPACTMIN Contract №: 244166
84
The study area was devided into two parts: the Vihovici lake and the Neretva river. According to
these areas, the airborne imagery were stitched together. As a final step a water mask was created
based on NIR band values which are close to 0 for water targets and as such can be separated from
other land objects. A screenshot of the corrected image, along with the spectra of a water target (green
and red dot) is given in Figure 43 and Figure 44.
Figure 44 - Corrected AISA-EAGLE image of the Vihovici lake along with Rw spectra from the deep (red) and shallow (green) part of the lake.
IMPACTMIN Contract №: 244166
85
Figure 45 - Corrected AISA-EAGLE image of the Neretva river along with Rw spectra from the deep (red) and shallow (green) part of the river.
As can be seen in both figures, the bottom effect in shallow water is significant and should be taken into
account when correlating the airborne Rw spectra with water quality measurements.
In-situ water spectra analysis (ASD vs lab)
The Rw spectra measured with an optical system is in reality a spectral mixture of those
constituents in the water which are optically active. These include water, Total Suspended Matter
(TSM), Phytoplankton (with most active component Chlorophyll a, CHL) and Colored Dissolved Organic
Matter (CDOM). A combination of these parameters can give an indication of the water quality. For
coastal and inland waters it is more complex to derive this water quality information than over oceanic
waters as the optically active constituents have a combined impact on the water leaving radiance. An
example of this impact is given in Figure 45. With an increased TSM concentration (Figure 46a, red
IMPACTMIN Contract №: 244166
86
arrow), Rw increases over the complete spectrum due to an increased scattering effect of the
suspended particles. With an increased CHL concentration (Figure 46b, red arrow), Rw decreases over
part of the spectrum due to an increased absorption of the chlorofyll particles present in phytoplankton.
(a)
(b)
Figure 46 - The impact of TSM (a) and CHL (b) concentration on Rw spectra. Example from Hydrolight simulations for the river
Scheldt (highly turbid water). The red arrow indicates an increase in TSM and CHL concentration.
The Rw spectra measured during the Mostar field campaign are related to the concentration
values in Figure 47. For the measurement done in the accumulation lake, with low CHL concentrations,
one can see a notable influence of the TSM concentration in the spectra (Figure 47a). A similar
relationship can be found in the Vihovici lake with higher Rw spectra and higher concentrations of TSM
(Figure 47b). The increase in CHL concentration (range from 0.108 to 1.879 µg/l), which should lead to a
decrease of Rw value at certain wavelengths (eg. 510 nm, 555 nm and 670 nm) was not detected. The
measurements taken at the Neretva river were unfortunately highly effected by the bottom reflectance
(Figure 47c). Although a relative constant concentration along the river, the Rw spectra do change due
to changing bottom and adjacency effects (green spectra in Figure 47c).
IMPACTMIN Contract №: 244166
87
(a)
(b)
(c)
Figure 47 - Rw spectra measured during the Mostar field campaign related to the in-situ concentration values: Accumulation
lake(a), Vihovici lake (b) and Neretva river (c).
The relationship between the Rw spectra and the different water quality parameters is further
investigated by linear regression analysis. In a first step the in-situ Rw spectra were resampled to the
AISA-EAGLE spectral band configuration. Next a normalized spectral band ratio was calculated for all
possible band combinations according to the following equation:
With WQPi the water quality parameter under consideration
I the intercept,
S the slope
b1 and b2 the specific spectral band values
The advantage of working with band ratios is that possible errors in the atmospheric corrections
are partly eliminated. A linear regression between these band ratios and the different WQP was
IMPACTMIN Contract №: 244166
88
calculated and the resulting R2 was visualized in a band ratio plot (Figure 48). From these plots, one can
clearly differentiate wavelength regions which have the highest correlation with the WQP under
investigation. For TSM, a highest correlation is found for wavelengths 550 nm to 600 nm. For CHL-a
these regions are from 480 nm to 575 nm and around 675 nm. These are highly correlated with the
regions found for Nitrates and Total Nitrogen, as these nutrients induce the growth of phytoplankton,
and thus CHL-a, in the water. For phosphor and cadmium concentration a very poor relationship was
found with the calculated band ratios, while lead and iron do have regions around respectively 425 and
550 nm with significant correlation coefficients. The band combinations with the highest correlation
coefficients for each WQP are given in Table 7 along with an indication of the RMSE. Note that
neighboring band combinations are not considered in this analysis as they are likely to be highly
correlated.
Parameter Band 1
(nm)
Band 2
(nm) Intercept Slope Rmse R2
Chlorophyll "a" [µg/l] 496.22 507.69 0.0445123 -33.2522 0.487851 0.5963954
Lead [Pb µg/l] 443.47 603.7 -0.071226 1.365746 0.091669 0.7059899
Iron [Fe µg/l] 542.09 556.2 30.36372 -1119.24 6.114444 0.8844359
Table 7 - Results of the linear regression analysis with best band ratio combination per water quality parameter.
IMPACTMIN Contract №: 244166
89
(a)
(b)
(c)
(d)
(e)
(f)
(g)
(h)
(i)
(j)
Figure 48 - Band ratio significance plot: R2 of the linear regression between the band ratio and TSM(a), CHL-a (b), Nitrites (c),
Nitrates (d), Total Nitrogen (e), Total Phosphorus (f), Ortho-phosphorus (g), Cadmium (h), Lead (i) and Iron (j).
IMPACTMIN Contract №: 244166
90
Airborne vs in-situ (AISA-EAGLE vs ASD)
The airborne Rw spectra are validated with the in-situ Rw spectra (Figure 58). In order to take
inaccuracies in the geometric correction of the airborne data into account, a bounding box of 3 by 3
pixels was set to calculate the average AISA Rw spectrum. Figure 58 shows that for most of the locations
the correlation between the airborne and reference Rw spectra is very good. Please note that both in
the airborne and the in-situ measurements noise fraction like bottom effects (Figure 11 –Neretva1)
and/or insufficient skylight correction (Figure 49 – Vihovici1) can exist. Unfortunately no AISA airborne
data was available for the accumulation lake, but overall one can say that the airborne and in-situ
measurements are highly comparable.
IMPACTMIN Contract №: 244166
91
Figure 49 - Validation of airborne Rw spectra with the in-situ Rw spectra.
Water quality analysis (AISA-EAGLE vs lab)
The final step in this part of the research is to evaluate the potential of remote sensing
hyperspectral techniques for water quality estimation. For each parameter, listed in Table 2, the linear
regression as calculated from the in-situ water spectra analysis was applied to the airborne imagery.
Next the concentration estimates obtained from the airborne measurements were validated with in-situ
concentration measurements. These results, i.e. an extraction of the water quality maps and the
validation results are shown in Figure 50, Figure 51 and Figure 52. In general one can say that good
results are obtained with the remote sensing techniques with relatively low RMSE values and narrow
concentration ranges. Also the only specific spatial gradient found inside the lake or along the river
Neretva, are those caused by adjacent vegetation and/or bottom reflectance. The spatial patterns which
are clearly present in Lake Vihovici for the TSM, Ortho-P and Lead map are an example of the influence
of bottom to the reflectance spectra. Also when zooming into the river Neretva one can see a shift in
concentration values across the river (e.g. TSM, nitrites, iron-map) which cannot be related to effective
shifts in concentration values, but to adjacent and bottom effects. The correlation between the nitrites,
nitrates, total nitrogen on the one side and CHL-a, i.e. a measure of algal concentration on the other side
as obtained from the in-situ water spectra analysis is confirmed here. The variation of these parameters
do not have a specific pattern and are relatively small within the lake. The estimates obtained for the
total phosphor map, created with bands from the lower, blue, part of the spectrum are to a great extent
negative because of the possible higher inaccuracies of atmospheric correction in this spectral range.
Because of this reason it is advised to avoid the use of only blue bands in any water quality retrieval
algorithm, even though it might be the most correlated with the parameter under consideration.
IMPACTMIN Contract №: 244166
92
(a)
(b)
Figure 50 - Results of the Mostar Water quality map and ground validation: TSM and Chl-a.
(a)
(b)
IMPACTMIN Contract №: 244166
93
(c)
(d)
Figure 51 - Results of the Mostar Water quality map and ground validation: Nitrites, Nitrates, Total Nitrogen and Total
Phosphorus.
(a)
IMPACTMIN Contract №: 244166
94
(b)
(c)
(d)
IMPACTMIN Contract №: 244166
95
Figure 52 - Results of the Mostar Water quality map and ground validation: ortho Phosphor, Cadmium, Lead and Iron.
Concluding remarks on spectral water analysis
To monitor the water quality of the Mostar Neretva river and Vihovici lake an extensive airborne
and field campaign was organized and a large amount of valuable information was collected within the
area. The in-situ Rw spectra were used along with the in-situ concentrations measurements to find the
most optimal band ratio algorithm for each water quality parameter separately. The linear regression
analysis between the band ratios and the concentration measurements showed very strong (R2 = 0.82
for Nitrates and R2 = 0.72 for TSM) , strong (R2 = 0.59) for CHL-a and weak (R2 = 0.19 for Cadmium)
relationship between them. As the airborne Rw spectra were found to be very similar to those measured
in-situ, the linear regression could be inverted to calculate water quality maps for each parameter under
consideration. The validation of these maps showed good correlation and small RMSE for most of the
parameters, but were influenced by bottom and adjacency effects. The absence of specific spatial
patterns in the water quality maps, other than generated by bottom and adjacency effects, make us
conclude that no significant change in water quality as a latent effect of the old mining industry or waste
dumping can be observed within the region of Mostar. The work presented here describes the
methodology to study water quality based on airborne hyperspectral imagery and can be applied for
similar cases, although the band ratio analysis and retrieved algorithms should be recalculated.
The figures below (Figures 53-58) present water quality maps for the River Neretva and Vihovići
lake derived from the best of the tested algorithms from the Sava River dataset, developed earlier and
using observables for water quality described above. Colors represent areas of different concentrations
following the order of spectral colors, e.g. blue represents area with the lowest concentration while red
represents area with the largest concentration of the observed parameter. Since all the algorithms
presented in the images have strong correlation with the observed values, these images can show well
the relative distribution of concentrations and indicate areas of interest.
IMPACTMIN Contract №: 244166
96
Figure 53 Map of Chl-a distribution
Figure 54 Map of TSS distributions
IMPACTMIN Contract №: 244166
97
Figure 55 Map of turbidity distribution
IMPACTMIN Contract №: 244166
98
Figure 56 Map of Chl-a distribution
IMPACTMIN Contract №: 244166
99
Figure 57 Map of TSS distribution
IMPACTMIN Contract №: 244166
100
Figure 58 Map of Turbidity distribution
The maps show homogenous distribution of Chl-a similar to the observed values. The areas of
larger concentration of Chl-a in the Neretva correspond with more shallow areas where the river bottom
contributed more to the signal from the water column. The concentrations of TSS and Turbidity are as
expected greater in the Vihovići lake than in the fast and very transparent river Neretva waters. The
increased turbidity and TSS concentrations can be observed down the stream from the point where
Vihovici pit lake is connected by tunnel with the Neretva river. This can be also due to the increased
impact of wastewater pollution sources from the city of Mostar, which appears a more likely source
than the Vihovici mine (as discussed earlier).
Tested algorithms show promising results for monitoring water quality parameters in the River
Neretva and Vihovići Lake. It is necessary to collect more data at the site to develop more robust
algorithms. This is a possibility for future work.
IMPACTMIN Contract №: 244166
101
Water Chemistry
Water chemistry data gleaned from the analysis of the samples for chlorophyll, certain nutrients
and metals suggests some interesting trends on the river Neretva as well as Vihovici pit lake. The values
have been plotted on the available satellite imagery and distributed with regards to their relative
concentrations (Figures 59 – 65).
With regards to the metals, Fe concentrations are elevated within the lake relative to the river
Neretva and the iron content in the water tends to increase towards the area which were mapped as
iron rich in the hyperspectral data, suggesting possible source area for the iron enrichment in the water.
The concentrations of lead and cadmium are also somewhat elevated in the pit lake relative to the river,
but another interesting element is that the concentrations of lead and cadmium are apparently
increased down the stream from the interactive point of Neretva and Neretvanski Rov, a tunnel
connecting the Vihovici pit lake with the Neretva river. However, relatively few number of samples and
lack of sediment samples makes this occurrence difficult to quantify.
IMPACTMIN Contract №: 244166
102
Figure 59 - Chlorophyll concentration from water chemistry data (all stations)
IMPACTMIN Contract №: 244166
103
Figure 60 - Nitrate concentrations from water chemistry data (all stations)
IMPACTMIN Contract №: 244166
104
Figure 61 - Phosphorus concentrations from water chemistry data (all stations)
IMPACTMIN Contract №: 244166
105
Figure 62 - Fe concentration at Vihovici pit lake and Neretva River
IMPACTMIN Contract №: 244166
106
Figure 63 - Comparison of land mineralogy data for Fe minerals with the Fe concentrations in the water. It is unclear whether the increased concentrations are an effect of lake depth or inflow from Fe-rich sediment being carried into the lake.
IMPACTMIN Contract №: 244166
107
Figure 64 - Cadmium concentrations for Vihovici pit lake and Neretva river. There is an apparent occurrence of Cd in both lake and river, but the relationship is inconclusive due to very few stations available.
IMPACTMIN Contract №: 244166
108
Figure 65 - Lead concentrations for Vihovici pit lake and Neretva river. There is an apparent occurrence of Pb in both the lake and river, but the relationship is inconclusive due to very few stations available.
IMPACTMIN Contract №: 244166
109
Lightweight, Unmanned Aerial Vessel (UAV) Remote Sensing Instead of the gamma-ray sensing from the light-weight platform, it was determined that the
radiological risk at Mostar was, most likely a non-issue, and the effort was placed on aerial investigation
of Vihovici site using Smartplanes UAV to address the possibility of geotechnical hazards at the Vihovici
mine site. The Smartplanes tm UAV is a small unmanned aircraft equipped with a photo camera for
production of highly detailed orthophotos and Digital Elevation Models (DEM). The plane is easily
transported in a small suitcase, and ready for operation within minutes with minimal footprint. It is
hand-launched and landed, and it can take off and land almost on any surface (Figure 66).
Three areas were flown in the Mostar Valley (Figure 67) with the Smartplane in order to
support the interpretation of the field measurements and of the hyperspectral imagery and ground-
based surveys. The very high resolution imagery provides us with an excellent tool to better understand
the acquired spectral and analytical data (Figure 68).
IMPACTMIN Contract №: 244166
110
Figure 66 - Smartplanes UAV in action at the Vihovici mine site
IMPACTMIN Contract №: 244166
111
Figure 67 - Overview of areas flown with the smartplane overlain on an Aster image (top-left). Individual areas overlain on WV2-image.
IMPACTMIN Contract №: 244166
112
Figure 68 - Comparison of Hyperspectral image (1m.resolution) and Smartplanes image (5 cm resolution). The image is a part of the Vihovici lake. The vaguely brighter areas in the lake were initially interpreted as material in suspension, but the
Smartplanes image suggests that it is actually the lake bottom.
Photogrammetric processing (generation of Digital elevation Models and Orthophotos) of the
aerial photographs was done using Agisoft photogrammetric software, designed for the mosaicking and
stitching of the Smartplanes UAV system. The spatial resolution of the resulting orthophoto mosaics is 5
cm, and of the DEMs 20cm. Using 8-10 precision survey points per block flow allowed us to achieve a
vertical accuracy better than 7 cm, and a horizontal accuracy better than 10 cm.
Geotechnical observations
Open pit excavation was stopped abruptly and with no planning. Previously coal extraction was
forced and overburden removal detected, which resulted in unfavorable sloping in the excavation crater
and also of the overburden dumps. The excavation was abandoned over 20 years ago, and since then its
condition has worsened because of further collapses of geo-mechanically unstable slopes. This applies
especially to the northeast, east and south slopes of the open pit which were formed to be almost
vertical, so it is unsafe to approach them and carry out further studies.
Located on the northeast side, in the immediate proximity of the excavation area, is the outer
dump of overburden material, which further loads up the pit walls. The inner dump overburden material
has been contoured with irregular slopes and its current form is unacceptable from a mining/structural-
engineering perspective, especially in view of the high safety/concern demands in the urban
surroundings (Figure 69).
Given the type of geology at Vihovici, consisting of interbedded limestone and clay stone layers,
subject to swelling and cracking during winter and summer months, the issue of slope stability is to be
taken seriously into consideration, because failure along a significant block of the pit wall, especially on
the southern end could have serious consequences on the urban area below. Various climatic,
topographic and geologic factors complicate the evaluation and prevention of landslide zones,
IMPACTMIN Contract №: 244166
113
particularly in urban zones, but the available data at least narrows down the zones for further
investigation and possible amelioration of a geotechnical risk at Vihovici mine.
Usually, prior to planning new infrastructure development a detailed geotechnical report is
commissioned, but the techniques are mainly limited to the analysis of geo-mechanical properties of the
underlying terrain and slope stability analyses. However the reports are fairly general in nature and for
long distances require substantial field engagements. A medium-sized landslide may result in 300,000
cubic meters of slide material at a cost of $2 million Euro with indirect economic costs, due to property
loss, damage, service disruptions ranging in estimates at more than $0.5 million Euro per day. No such
assessment was ever carried out for Vihovici post closure.
IMPACTMIN Contract №: 244166
114
Figure 69 - Geotechnical observations at several sites in Vihovici open pit
IMPACTMIN Contract №: 244166
115
The acquisition of field point-reflectance and image-reflectance spectra is exploited to delineate
zones of problematic mineralogy, particularly in the instance of hydrophilic clays (e.g. montmorillonite,
illite) which tend to contribute to landslide propagation either by increasing the loading factor of the
slope or serving as a lubricant in plane motion. Furthermore, reflectance spectroscopy in 450-2500nm
(field spectra) or 400-970nm (image spectra) region of electromagnetic spectrum is useful in identifying
other types of minerals, which may compromise slope stability. Examples include the presence of
sulfates (e.g., jarosite) which can be indicative of acid-dissolution and weathering of surface rocks ,
presence of iron oxides and hydroxides (e.g., goethite, limonite) which can be indicative of water-rock
interactive processes and weakening of surface layers and/or changes in the cohesiveness of the
carbonate host rock. The analysis of hyperspectral data coupled with the ultra-high resolution of the
UAV-produced aerial images and a DEM, had allowed for the mineralogical assessment of zones
exhibiting potential geotechnical risk. The emphasis was given onto the zones populated by swelling
clays and/or presence of iron minerals signifying the zones of potential weathering and weakening of
the pit walls.
The data presented in the following figures show that both the northern-steep face of the
Vihovici Pit as well as the southern zone exhibit potentially problematic locations. The presence of clay
minerals corresponds with the areas of unstable slopes shown on both the available high-resolution
DEMs as well as field assessment of the area.
The zones of intense clay-weathering further coincide with the zones of observed high relief and
observed structures suggesting continued activity in the combined DEM/High-resolution/HSI imaged
zone. Furthermore, high resolution and DEM data indicate the presence of potential sliding blocks and
zones of weakness caused by previous movements and structures (e.g. faults, micro-faults, joints,
fissures and/or fractures) present along the exposed face, especially along the northern pitwall. The
topographic data suggest several zones of weakness that may be activated, re-activated and possibly
even aided by the presence of HSI-detected mineralogy consisting of swelling clays. Particularly risky
zone to the housing development is possible on the southern edge of the pit wall where the apparent
clumping of material and fracture propagation had already started to occur (Figures 69 - 71).
The method demonstrates the usefulness of a combined scanning-methodology approach in the
appraisal of geological factors pertaining to landslide environment and opens up possibilities in
simultaneous analysis of different factors in the elements of landslide formation, propagation and
evaluation using multiple stand-off detection methods that could be automated or semi-automated to
provide models for real or near-real time monitoring of potential landslide zones. This portion of the
project focused on a target of opportunity presented by the evident spatial and spectral elements of the
landslide areas for the purposes of defining quantitative or semi-quantitative elements of recognition
that can be extrapolated to a wider area (mineralogy, geology, structural features, stress framework
etc.).
IMPACTMIN Contract №: 244166
116
Figure 70 - North part of Vihovici pit lake and UAV-derived digital topography. Mineralogy and topography may suggest slopes at the risk of potential failure.
IMPACTMIN Contract №: 244166
117
Figure 71 - Combined topographic and mineralogical investigation of the Vihovici pit's south side.
IMPACTMIN Contract №: 244166
118
Correlation between datasets Mostar case study is specific because it had encompassed variety of sites in an urban corridor
with satellite, airborne, lightweight UAV and ground/water in-situ sampling. All of the datasets have had
a particular observable to address and a niche to fill. As presented above, some of the datasets
presented have already been correlated (e.g. topographic model, slope stability and hyperspectral
measurements, hyperspectral measurements of water from air and boat etc.).
Individual elements complement each other by adding a particular element of information not
available to another and the same applies for the data collected in the course of Impact min as well as
the data collected previously during 2007-2009 remediation of the Vihovici area. From the standpoint of
surface mapping we can determine that the mineralogical information between the Worldview 2
satellite, AISA-EAGLE 2 airborne hyperspectral data and ground-based spectral data correlates well (e.g.
detection of secondary Fe-minerals in all 3 datasets, co-located and shown in the figure below).
Likewise, combined airborne, in-situ spectroscopy measurements tends to show a degree of correlation
with the water chemistry data.
Figure 72 - Correlation between the datasets: spaceborne multispectral, airborne hyperspectral and in-situ spectroscopy of Fe-minerals at Vihovici Mine, north part of the open pit.
IMPACTMIN Contract №: 244166
119
Figure 73 - Example of correlating hyperspectral models, water spectroscopy and water chemistry data for nitrates at Vihovici Mine and Neretva.
IMPACTMIN Contract №: 244166
120
Figure 74 - Comparison between HSI data for chlorophyll on river Neretva and results from chemical water sampling (right) show good correlation
The quick visual and numeric correlations between the datasets can be carried out in a GIS
environment where data can be visualized and correlated by using all available datasets. The datasets
show that satellite, airborne, lightweight-airborne and in-situ data all show same observables albeit in
different resolutions. As a whole, there are no particular hot spots identified in the data, but there are
areas of interest that suggest that continued monitoring and/or targeted clean-up/stabilization
campaigns are warranted in the Mostar Valley.
IMPACTMIN Contract №: 244166
121
Part 4 – Concluding remarks
Vihovici Mine Site and Red Mud Storage Facility are the two main areas of concern in the Mostar
Valley. Vihovici Mine is located close or within the urban zone, while the risks of the Red Mud Storage
are yet to be fully appraised. The proximity of the sites to the urban zone and the important watershed
of river Neretva have called for a detailed study of both sites and their impact on the environment.
Combined campaign using variety of cutting-edge remote sensing assets and analysis tools have yielded
the results presented below.
Mostar Valley, in a sense is a time-capsule of the region that had come to an industrial and
resource-extraction standstill as a result of a conflict in Bosnia and Herzegovina. Virtually all of the
industrial production and resource extraction activities have ground to a halt in 1992 and have been
barely restarted in 1995 and up to the present day. In that sense, Mostar is interesting as a site, because
one could see how and if nature reclaims the area formerly used for resource extraction and processing
activities. Furthermore, as the industrial activities have ceased, the natural processes have not stopped,
so the old working have been flooded, coal seams have ignited, red mud lagoon had dried up and so on
with the absence of supporting activities one would expect at the active industrial site.
In summary, the overall observables and findings in Mostar Valley are:
o Land The focus was given to detecting iron oxide, hydroxide and sulfate minerals that
may have a negative effect on the environment. The carbonate karst
background was an ideal background for detecting increased concentrations of
such. Satellite and airborne HSI data suggest that there are increased concentrations
of Fe-minerals at the Vihovici mine site and Red mud storage facility, and most
can be traced back to the resource extraction and/or processing activity. Fe-minerals at Vihovici appear to be mainly contained to the former burn area
and waste piles, with the increased concentration of sulfates near the areas of
former industrial waste (battery dismantling) and burn areas, but their overall
impact appears to be relatively mild and contained to the mine site. Fe-hydroxides, associated with the bauxite/alumina refining at the Red Mud
storage lagoon suggest drying and dispersal beyond the containment area and
warrant closer inspection. Much larger potential impact represents continued, illegal dumping of
household waste at Vihovici Mine and the surrounding areas. There are also moderate-to-high concern zones of geotechnical risk developing
around the Vihovici mine-site which may be in the risk of collapse.
IMPACTMIN Contract №: 244166
122
o Water Airborne and in-situ analysis of water data suggests that the observed water
bodies are relatively clean and consistent in what would be expected of water
bodies in an urban environment, with only rudimentary wastewater treatment. Majority of the observed effects as to increased concentrations
chlorophyll/nutrients in Neretva river occurs within the urban corridor. There are no observable “spikes” in the data that would suggest direct negative
impact. The increased concentrations of heavy metals (observed with chemical analysis)
do occur within the Vihovici pit lake and downstream, but are difficult to
quantify due to relatively few measurements. The fast-moving Neretva river and
constantly-changing waters do not represent the best medium for quantifying
this type of measurement and the future focus should be directed to analyzing
sediment for heavy metal pollution. At the cessation of activities, most of the environment has naturally cleaned
itself with the potential pollutants remaining encapsulated in the sediment. o Urban
The urban area was imaged only as a background to other datasets discussed
above The areas of devastated industrial facilities and/or discontinued portions of
alumina refining facilities do show the increased quantity of iron oxide and
sulfate minerals resulting from the former activities. This is particularly notable
at the aluminum factory, south of Mostar. Open lots and former industrial areas, as well as sites left unoccupied following
the 1992-1995 conflict are being used as illegal household waste-disposal areas. o Vegetation
Vegetation stress was also investigated as a supporting element to mapping
mineral-related impact at the Vihovici mine site and Red Mud storage facility. The vegetation has mainly reclaimed both areas, and it shows that the former
resource-extraction areas, left to disrepair are quickly consumed by the
resistant vegetative species. Presence of water, in an otherwise dry environment, appears to have positive
effect on the vegetation growth without regards to potentially negative soils
(e.g. increased sulfate concentration). There are several discrete areas at the Vihovici mine site where there is notable
vegetation stress (near old battery dismantling factory, burn sites and illegal
waste disposal areas).
IMPACTMIN Contract №: 244166
123
Noted observables and potential problems in the area:
- Targets selected in Mostar Valley have fallen in disrepair and neglect following the cessation of
operations there
- Almost 20 years of neglect have resulted in the sites reverting back to the natural environment,
wherever possible.
- Burning of the coal seams, collapse of pit walls and drying of the lagoon are all natural and
expected consequences of the industrial area “reversal” without the management.
- There are very few direct problem-observables in any of the sites, only sniffs of potential issues
that have been reclaimed naturally or remain encapsulated in the sediment.
- The primary problems are:
o continued illegal disposal of household waste in the abandoned facilities,
o unstable slopes at the collapsing Vihovici open-pit mine or pit walls,
o potential for re-ignition of burning coal seams, now left smoldering following the
remediation campaign,
o dispersal of red mud from the drying lagoon, south of Mostar
- Now reclaimed and naturally-resolved problems MAY come back to the forefront if some radical
changes occur to the environment (e.g. collapse of the pit wall at Vihovici, earthquakes, brush
fires etc.), which may re-mobilize the somewhat-stabilized elements.
Impact of mineral activities on the environment and suggested courses of action:
- Mostar area presents a good investigative area of natural reclamation of former industrial and
resource-extraction activities with only moderate anthropogenic-influence of the acute
problems (e.g. coal seam burning).
- The observed impact of the elements is a following:
o Mineralogy (oxides, hydroxides and sulfates): moderate
o Surface solid waste pollution: moderate to high
o Geotechnical hazards: moderate to high
o Water pollution: low to moderate (mainly urban)
o Vegetation stress: low
- The remediation activities and follow-up efforts should be focused on the following:
o Solid-waste cleanup and remediation
o Detailed evaluation of geotechnical hazard at Vihovici mine
o Evaluation of red-mud dispersal at the disposal site
o Analysis of river/stream sediment near the former extractive/industrial sites for heavy
metals, PCBs and PAHs.
Summary and Conclusions
Mostar municipality suffered tremendous casualties during recent war in Bosnia and
Herzegovina. The “wounds” from the war are all over this beautiful city, full of historical buildings and
values. The biggest one has been a division among ethnic groups, which has paralyzed the progress of
IMPACTMIN Contract №: 244166
124
the city in last 20 years. Even though international community and local political players have tried to
move forward and elevate level of trust among communities, there is still a lack of real effort by
politicians to work together for welfare of all citizens in the Mostar Valley. Occasionally good things
happen, mostly initiated by local enthusiasts and International community. Those initiatives have been
always welcomed by ordinary people and they made some progress in the city.
Fears and uncertainties hang over heads of people in the city, from environmental issues to the
ethnic divisions expressed through a political gridlock in functioning of local government. The fear that
one ethnic group will dominate over the other one still causes a mistrust in the Mostar Valley, it
paralyzes a real progress, scares foreign investors and holds unemployment on the very high level. In
addition, environmental issues have made situation even more difficult, because this community relies
mostly on the natural resources above all: clear water, fertile soil, Mediterranean climate with plenty of
sunny days and hazard-free environment. Some of these factors of developments were jeopardized
during the war and immediately after the war.
Many issues have been without an appropriate answer for too long, such as: quality of water in
Neretva river, an environmental impact of closed Vihovici mine and its pit, irregular/ illegal waste dumps
and their impact, etc. There have been also some disturbing questions, such as; is there any radiological
waste in the valley or traces of it, as result of military operations in the nineties, especially in and around
Vihovici mine; how big is the impact of underground fire which was left smoldering; perspectives for
landslides around the pit, etc. All of these environmental issues, if not addressed appropriately and on
time, can be very dangerous for the well-being of people, economic development and prosperity of the
entire community and, if neglected over longer time, might have a political impact too, because majority
of the people in Mostar municipality, have felt, they are left behind, by everybody, local politicians and
international community as well.
ImpactMin project addresses some of the above mentioned environmental issues. There have
been a lot of reasons for concerns, as the mine and the former processing facilities are almost in the
middle of town, close by a densely populated area with the network of underground water channels
connected with the Neretva river, which by itself is a heart of community. Along the Neretva river are
farms of Mediterranean vegetables, fruits, vineyards, which are the core of agriculture development,
food processing industry and tourism too.
Without the direct action from the EC and project such as ImpactMin, to undertake a
comprehensive survey of the area, with the latest imaging tools, it is unlikely that similar project would
have ever been tasked or funded by the local government, because of lack of resources and so many
remaining after-war issues plaguing the city. In the community, with several open environmental
problems and political gridlock about many local issues, it would take considerable time before the local
institutions would define priorities and dedicate some funding for surveys.
Projects like the ImpactMin are very important: it will show people that there are issues where
the local divisive politics do not make any sense and that there are much larger issues, like
environmental issues, which are important for welfare of all people in the Mostar Valley. Project like this
IMPACTMIN Contract №: 244166
125
will send a strong message that the entire community should work together to preserve what is the
most important for all of them, regardless on social, ethnic or political affiliation.
Results of this project will be shared by all people in the Mostar Valley and information will
clarify some environmental concerns of all in the community. The Vihovici mine, even though it is
closed, it is still an open case for the Mostar municipality. As such, it is under a city care, but the city
does not have the resources to seriously address its environmental problems, especially to fix them.
Without the help of state government and the international community, it is very difficult to expect that
there will be enough care of the Vihovici site and its environmental issues in the future too.
In that regard one should precisely analyze the responsibilities of all government levels in
Bosnia Herzegovina towards closed mines and abandoned resource processing facilities, are they have
been closed or abandoned without the regulated procedures. It should be determined how safe are
they are and who is supposed to take care of them; what kind of resources are available for the
maintenance of safety and who is ultimately responsible. Most recent disaster and casualties at the
closed mine in Posusje ( closed mine of bauxite, not too far from Mostar ) should be a wakeup call for
the responsible government agencies to take action and check all these facilities, all over the country,
and address all open issues, from ownership issues to fixing of the remaining safety problems.
It is of extraordinary importance for the citizens of Mostar that the ImpactMin project
addressed the sites of interest and that the European Commission had funded it, especially the surveys,
which should finally exclude all kind of information-manipulations that have existed for the last 20 years,
related particularly to the former industrial sites. The ImpactMin study will realistically address the
existing and future environmental issues based on the exact data gathered by the most contemporary
technologies and methods, which are analyzed by a multidisciplinary team throughout the site report.
We strongly believe that the results of this study will force short and long term actions by the local
government with an additional help of regional and international institutions and organizations.
The Impactmin Consortium could not expect do more by itself with limited resources at its
disposal and the chosen team of partners whose expertise and reach are focused to problem
identification and surveying. The goal of this project was not to fix problems; the goal was to survey and
identify them, analyze, evaluate and share them with the scientific and other institutions, which are
supposed to look for solutions. The particular goal of this project has been to evaluate the situation, in
and around Vihovici site and propose some future actions to all interested parties. Using an
extraordinary technology and methods, we have detected some additional environmental issues, as a
bonus contribution to the project. Flying over the Mostar Valley and doing a hyperspectral survey we
have detected additional issues at the Red Mud storage facility, which would not have been possible to
see otherwise. It proved the benefits of the combined remote sensing approach and hyperspectral
technology as well as their importance for the future assessments. Now it is up to the community and
local governments to determine how they would want to address these issues in the future. We are
confident that they will be provided with an extraordinary data, gathered by the most cutting-edge
technology which exists today in the World.
IMPACTMIN Contract №: 244166
126
Appendix 1 – Algorithms
Land surfaces algorithms Customarily signatures of targets within an image are presented in the feature-space which in
this case is an N-dimensional space where “N” is the number of spectral bands. Most classification
algorithms operate in the feature space and are primarily based on statistical techniques including
clustering algorithms. In contrast, neural network (NN) based classification may have the advantages
that (a) they are distribution-free (i.e., do not make any assumption regarding the statistical distribution
function of the data), (b) they are non-linear, and (c) they do not require a phenomenology based model
to describe the data distribution, but can learn by example (as such they can easily identify classes with
disjoint distributions). In spite of these potential advantages, NN are not frequently used in
hyperspectral image classification. The reasons are (a) the inordinately long training time associated
with back-propagation type algorithms training when using large data sets, and (b) the dependence of
the final results on the starting parameters assigned to the NN weights. The latter problem is related to
the fact that the NN training algorithms often get trapped in local minima as opposed to establishing
global minimization of the error function.
Figure – Data visualization
One technique to quantify the class separability is based on the Spectral Angle Mapper (SAM)
that measures the "angle" between the two vectors that point to the centers of the two clusters. The
Spectral Angle Mapper (SAM) is an automated method for comparing image spectra to individual
spectra or a spectral library (Boardman, unpublished data; CSES, 1992; Kruse et al ., 1993a). SAM
assumes that the data have been reduced to apparent reflectance (true reflectance multiplied by some
unknown gain factor controlled by topography and shadows). The algorithm determines the similarity
between two spectra by calculating the "spectral angle" between them, treating them as vectors in a
space with dimensionality equal to the number of bands ( nb ). A simplified explanation of this can be
given by considering a reference spectrum and an unknown spectrum from two-band data. The two
IMPACTMIN Contract №: 244166
127
different materials will be represented in the 2-D scatter plot by a point for each given illumination, or
as a line (vector) for all possible illuminations. For each reference spectrum chosen in the analysis of a
hyperspectral image, the spectral angle a is determined for every image spectrum (pixel). This value, in
radians, is assigned to the corresponding pixel in the output SAM image, one output image for each
reference spectrum. The derived spectral angle maps form a new data cube with the number of bands
equal to the number of reference spectra used in the mapping. Gray-level thresholding is typically used
to empirically determine those areas that most closely match the reference spectrum while retaining
spatial coherence. Another similar procedure is based on the Fisher Linear Discriminant, which is a
measure of the "distance between classes normalized by the spread within the classes. The SAM
method is expressed by the following equation (modified from Gat et al., 1996):
Figure – Data visualization
Mixture Tuned Match Filtering (MTMF) is a hybrid method based on the combination of
established signal-processing methodologies and linear mixture theory: the method combines the
strength of the matched filter method (no requirement to know all the endmembers) with physical
constraints imposed by mixing theory (the signature at any given pixel is a linear combination of the
individual components contained in that pixel) (Boardman, 1998). A summary below is adapted from
DiPietro, 2010:
The first step of the algorithm is to determine the noise covariance matrix, n, of the scene, by selecting
a subset of the scene that is thought to be as homogenous as possible. Vertical and horizontal shift-
differences are performed and the resulting `noise-only' pixels are used to estimate the noise covariance
matrix n (via maximum likelihood estimation). The rest of the algorithm rests on the assumption that
the target covariance is equal to the noise covariance. Once this estimate is obtained the data is moved
into minimum noise fraction (MNF) space via the transformation:
IMPACTMIN Contract №: 244166
128
Where A is made up of the orthonormal set of eigenvectors. MNF transform is usually used prior to
dimensionality reduction in order to retain those axes with the highest signal-to-noise ratio (SNR). Next,
the data is moved from MNF space to rotated whitened space via the transformation:
Here the background is whitened while the noise covariance is diagonalized:
Coordinates in this space are related to those in whitened space (as described in the matched filter
section) by an orthogonal transformation (or rotation). The matched filter response is still the projection
of the pixel under test onto the target mean. The projection of a pixel onto the subspace orthogonal to
the target mean should tell how “untarget-like" it is, in the same way that the projection onto the target
mean tells how “target-like" it is. The move to target-orthogonal space is made via the transformation:
The preferred mapping method Mixture-Tuned-MatchedFiltering (MTMF) provides more precise results
and is basically a partial linear spectral unmixing procedure, producing abundance information for each
endmember determined within the scene.
IMPACTMIN Contract №: 244166
129
References
Boardman JW, (1989), “Inversion of imaging spectrometry data using singular value decomposition”,
Proceedings, IGARSS?89, 12th Canadian Symposium on Remote Sensing, 4:2069–2072
Boardman, J.W. 1998. Leveraging the high dimensionality of aviris data for improved sub-pixel target un-
mixing and rejection of false positives: mixture tuned matched filtering. In R. O. Green, editor, Summaries
of the Seventh Annual JPL Airborne Geoscience Workshop, volume 1, page 55, Pasadena, California,
1998. JPL Publication 97-21.
Brown, D.J., K.D. Shepherd, M.G. Walsh, M.D. Mays, and T.G. Reinsch. 2006. Global soil characterization
with VNIR diffuse reflectance spectroscopy. Geoderma. 421 132:273-290
Burai, P., Smailbegovic, A., Lenart, C., Berke, J., Milics, G., Tomor, T and Biro, T. (2011). Preliminary
analysis of red mud spill based on aerial imagery. AGD Landscape & Environment 5 (1) 2011. 47-57.
Clark RN, Gallagher AJ, Swayze GA (1990), “Material absorption band depth mapping of imaging
spectrometer data using the complete band shape least-squares algorithm simultaneously fit to multiple
spectral features from multiple materials”. Proceedings of the 3rd Airborne Visible/Infrared Imaging
spectral image processing system (SIPS)–Interactive visualization and analysis of imaging spectrometer
data”. Remote Sensing of Environment 44:145–163
Manolakis, D.G., Lockwood,R., Cooley, T and Jacobson. J. 2009. Apparent superiority of sophisticated detection algorithms in test conditions does not necessarily imply the same in real-world hyperspectral imaging applications. 17 June 2009, SPIE Newsroom. DOI: 10.1117/2.1200906.1560 Ray, T. 1994. FAQ on Vegetation remote sensing. California Institute of Technology.
Mostar Aluminij, d.d. Mostar. 2008. Report to the Federal Ministry of Industry, Mining and Energy. Public
document
Redzic, S., Barudanovic, S.. Trakic, S. and Kulijer, D., 2011. Vascular Plant Biodiversity Richness and
Endemo-relictness of the Karst Mountains Prenj, Cvrsnica and Cabulja in Bosnia and Herzegovina. ACTA
CARSOLOGICA 40/3 – 2011.
RGNF Zagreb, 1996: Studija sanacije, ekspolatacije i rekultivacije kopa Vihovici i rekonstrukcija rudnika
Mostar. Report from the Mining-Geology-Oil Faculty, University of Zagreb: Report on the study of
rehabilitation, exploitation and re-cultivation of the pit Vihovici and restructuring of the Mostar mine.
Ridanovic, L., Ridanovic, S., Jurica, D., Spasjovic, P. Evaluation of Water Temperature and Dissolved
Oxigen Regimes in River Neretva. Proceedings of BALWOIS 2010. Ohrid, FYROM, May, 2010.
Roberts, D. A., Green, R. O. and Adams J. B., 1997. Temporal and spatial patterns in vegetation and
atmospheric properties from AVIRIS”, Remote Sensing of Environment, 62 (3): 223-240.
Smailbegovic, A., Mendenhall,M., Clark, J. Gray, K and Wooten, R. (2011). Landslide imaging and
detection with horizontal scanning active and passive remote sensing methods: A study of data
integration in assessing complex target environment. IEEE Publication of WHISPERS 2011,
Smailbegovic, A., Milos, B. and Kisevic. 2010. Poor man’s spectroscopy: using VNIR spectra and high
resolution digital ortho-photo imagery to map distribution of terra rosa soils and iron oxides. Geological
Society of Nevada Symposium. Remote Sensing Workshop. Reno, Nevada, USA, p.17-18.
Smith GM and Milton EJ. 1999, “The use of the Empirical line method to calibrate remote sensing data to
reflectance”. International Journal of Remote Sensing 20 2653 – 2662.
Smith, R.B. 2005. Computing radiances, reflectance and albedo from DNs. Yale University
Documentation.
Smith, R.B., 2012. Hyperspectral Imaging. www.microimages.com and references within.
Staenz, K., Williams, D.J., and B. Walker, 1996, “Surface Reflectance Retrieval from AVIRIS Data Using a
Six-Dimensional Look-Up Table,” Summaries of the Sixth Annual JPL Airborne Earth Science Workshop,
March 4-8, 1996, JPL Publication 96-4, Vol. 1, Pasadena, California, pp. 223-229.