35
WPP AUNZ 2016 FULL YEAR RESULTS 24 February 2017 For personal use only
| Date post: | 15-Mar-2018 |
| Category: |
Documents |
| Upload: | truongminh |
| View: | 215 times |
| Download: | 1 times |

WPP AUNZ 2016 FULL YEAR RESULTS24 February 2017
For
per
sona
l use
onl
y

WPP AUNZ Limited
• Merger with WPP effective 4 April 2016, creating a group with over $850 million in revenue, over 5,000 employees
• Change of name and branding reflecting closer alignment with WPP plc. Fifth largest market for WPP globally
• Strong local market knowledge and relationships combined with iconic International brands, tools and global reach
• Better connectivity across group to unlock value for all businesses
• Continuation of experienced management team with new executive council to drive closer oversight and collaboration
• Optimisation of portfolio to create scale and strengthen competitive positioning
• Ever evolving marketing landscape much better navigated with global partner. WPP is the ideal partner
• Leverage WPP’s global insights, IP, expertise and investment in new technology
• In FY17, WPP AUNZ expects to deliver mid-single digit growth in earnings per share
WPP AUNZ 2016 Full Year Results | 2
For
per
sona
l use
onl
y

2016 Full Year Highlights
WPP AUNZ 2016 Full Year Results | 3
• Navigated early integration phase. Establish a platform for future growth.
• Successful merger of the two groups, achieving positive improvement in net sales of $865 million (2015: $855 million).
• Profit before interest and tax (PBIT) of $141.6 million ($136.9 million). PBIT delivered at an increased margin of 16.4% (2015: 16.0%).
• Strong operating cash flow exceeding cash conversion target.
• New debt facilities of $520 million on materially enhanced terms. Leverage ratio 1.9x (Dec 2016), down from 2.5x (Dec 2015).
• Final dividend of 3.9 cents per share. Total dividend relating to the 2016 year of 6.0 cents (2015: 5.7 cents).
• Strong client interest and engagement with significant new customer wins in the last quarter of the year.
• Opportunities to further optimize and strengthen portfolio.
Headline trading performance presented as if all businesses were owned from 1 January 2016 and excludes one off and significant items.
For
per
sona
l use
onl
y

WPP AUNZ - 2016 Full Year Results
WPP AUNZ 2016 Full Year Results | 4
KEY MEASURES 31 Dec 2016
Net Sales $865m (31 Dec 2015: $855m)
Net Sales increase of 1.2% against 2015.New business to drive growth
Profit Before Interest and Tax $141.6m(31 Dec 2015: $136.9m)
3.5% growth in PBIT against 2015
Net Sales Margin 16.4%(31 Dec 2015: 16.0%)
Margin improvement on 2015. Realisation of cost synergies to drive margin improvement
EPS Cents Per Share 9.5 cents(31 Dec 2015: 9.2 cents)
4.1% growth in EPS
Dividends Per Share 6.0 cents(31 Dec 2015: 5.7 cents)
Payout ratio 63% of earningsTargeted dividend payout ratio of 60% to 70% of
earnings
Leverage Ratio (Debt / EBITDA) 1.9x(31 Dec 2015: 2.5x)
Leverage ratio within targeted range of 1.5x to 2.0x. Strong operating cash flow drives debt
reductionFor
per
sona
l use
onl
y
WPP AUNZ 2016 Full Year Results | 5
Key Financials
Chris Rollinson, WPP AUNZChief Financial Officer (Interim)
For
per
sona
l use
onl
y
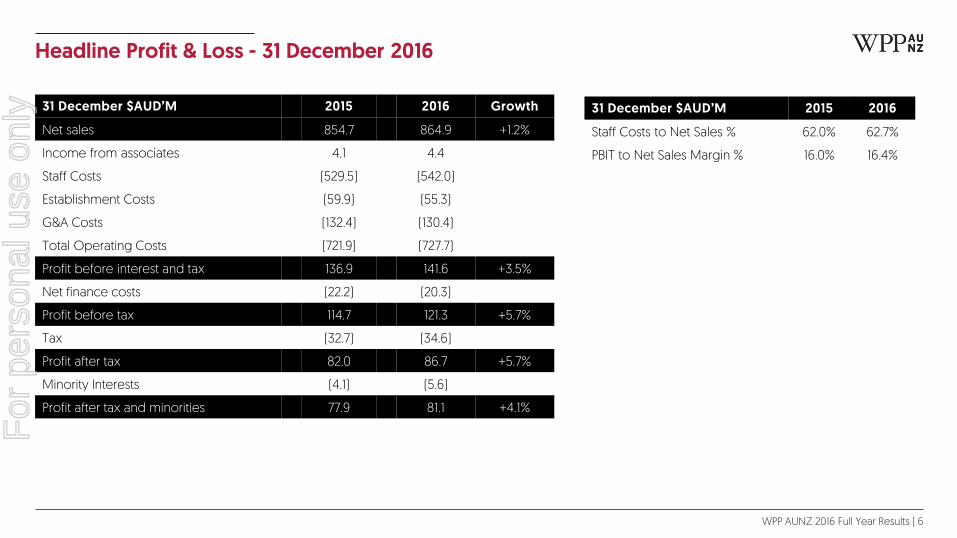
Headline Profit & Loss - 31 December 2016
WPP AUNZ 2016 Full Year Results | 6
31 December $AUD’M 2015 2016 Growth
Net sales 854.7 864.9 +1.2%
Income from associates 4.1 4.4
Staff Costs (529.5) (542.0)
Establishment Costs (59.9) (55.3)
G&A Costs (132.4) (130.4)
Total Operating Costs (721.9) (727.7)
Profit before interest and tax 136.9 141.6 +3.5%
Net finance costs (22.2) (20.3)
Profit before tax 114.7 121.3 +5.7%
Tax (32.7) (34.6)
Profit after tax 82.0 86.7 +5.7%
Minority Interests (4.1) (5.6)
Profit after tax and minorities 77.9 81.1 +4.1%
31 December $AUD’M 2015 2016
Staff Costs to Net Sales % 62.0% 62.7%
PBIT to Net Sales Margin % 16.0% 16.4%
For
per
sona
l use
onl
y
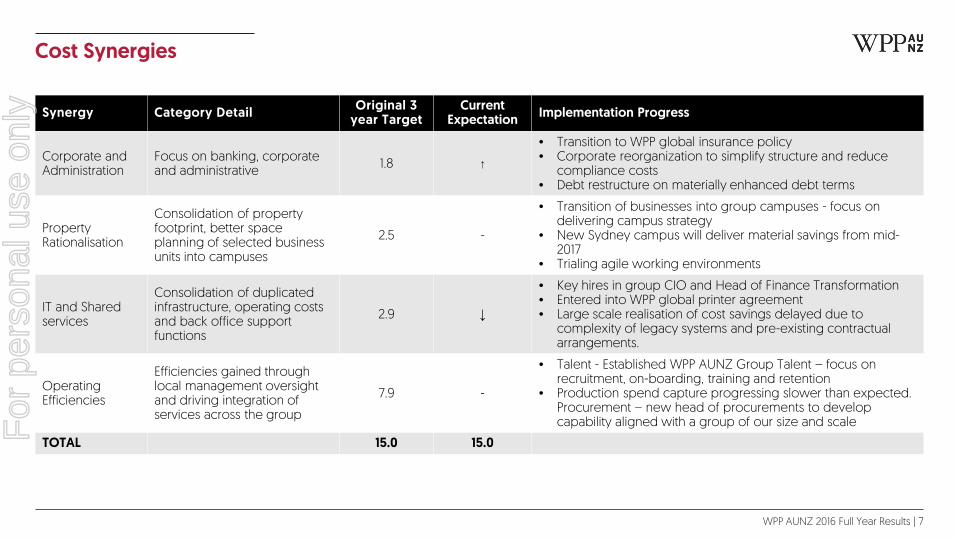
Cost Synergies
WPP AUNZ 2016 Full Year Results | 7
Synergy Category Detail Original 3 year Target
Current Expectation Implementation Progress
Corporate and Administration
Focus on banking, corporate and administrative 1.8 ↑
• Transition to WPP global insurance policy• Corporate reorganization to simplify structure and reduce
compliance costs• Debt restructure on materially enhanced debt terms
Property Rationalisation
Consolidation of property footprint, better space planning of selected business units into campuses
2.5 -
• Transition of businesses into group campuses - focus on delivering campus strategy
• New Sydney campus will deliver material savings from mid-2017
• Trialing agile working environments
IT and Shared services
Consolidation of duplicated infrastructure, operating costsand back office support functions
2.9 ↓
• Key hires in group CIO and Head of Finance Transformation • Entered into WPP global printer agreement • Large scale realisation of cost savings delayed due to
complexity of legacy systems and pre-existing contractual arrangements.
Operating Efficiencies
Efficiencies gained through local management oversight and driving integration of services across the group
7.9 -
• Talent - Established WPP AUNZ Group Talent – focus on recruitment, on-boarding, training and retention
• Production spend capture progressing slower than expected. Procurement – new head of procurements to develop capability aligned with a group of our size and scale
TOTAL 15.0 15.0For
per
sona
l use
onl
y
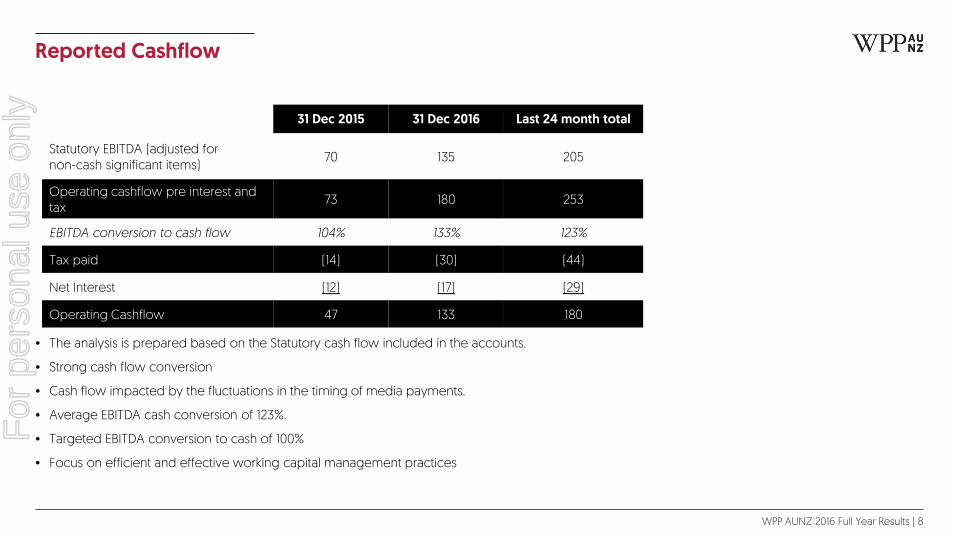
Reported Cashflow
WPP AUNZ 2016 Full Year Results | 8
• The analysis is prepared based on the Statutory cash flow included in the accounts.
• Strong cash flow conversion
• Cash flow impacted by the fluctuations in the timing of media payments.
• Average EBITDA cash conversion of 123%.
• Targeted EBITDA conversion to cash of 100%
• Focus on efficient and effective working capital management practices
31 Dec 2015 31 Dec 2016 Last 24 month total
Statutory EBITDA (adjusted for non-cash significant items) 70 135 205
Operating cashflow pre interest and tax 73 180 253
EBITDA conversion to cash flow 104% 133% 123%
Tax paid (14) (30) (44)
Net Interest (12) (17) (29)
Operating Cashflow 47 133 180
For
per
sona
l use
onl
y
Balance Sheet
WPP AUNZ 2016 Full Year Results | 9
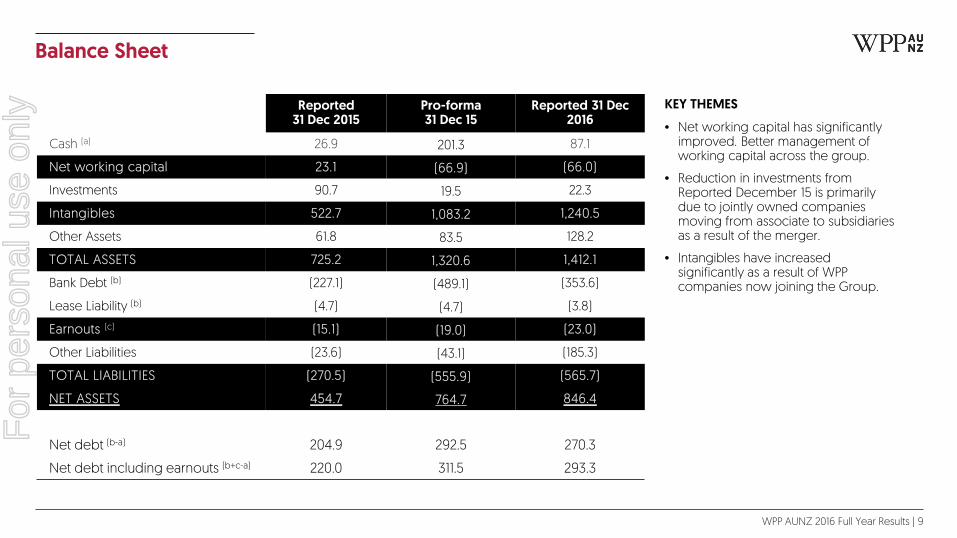
KEY THEMES
• Net working capital has significantly improved. Better management of working capital across the group.
• Reduction in investments from Reported December 15 is primarily due to jointly owned companies moving from associate to subsidiaries as a result of the merger.
• Intangibles have increased significantly as a result of WPP companies now joining the Group.
Reported31 Dec 2015
Pro-forma31 Dec 15
Reported 31 Dec 2016
Cash (a) 26.9 201.3 87.1
Net working capital 23.1 (66.9) (66.0)
Investments 90.7 19.5 22.3
Intangibles 522.7 1,083.2 1,240.5
Other Assets 61.8 83.5 128.2
TOTAL ASSETS 725.2 1,320.6 1,412.1
Bank Debt (b) (227.1) (489.1) (353.6)
Lease Liability (b) (4.7) (4.7) (3.8)
Earnouts (c) (15.1) (19.0) (23.0)
Other Liabilities (23.6) (43.1) (185.3)
TOTAL LIABILITIES (270.5) (555.9) (565.7)
NET ASSETS 454.7 764.7 846.4
Net debt (b-a) 204.9 292.5 270.3
Net debt including earnouts (b+c-a) 220.0 311.5 293.3
For
per
sona
l use
onl
y
Debt Facilities and Gearing
WPP AUNZ 2016 Full Year Results | 10
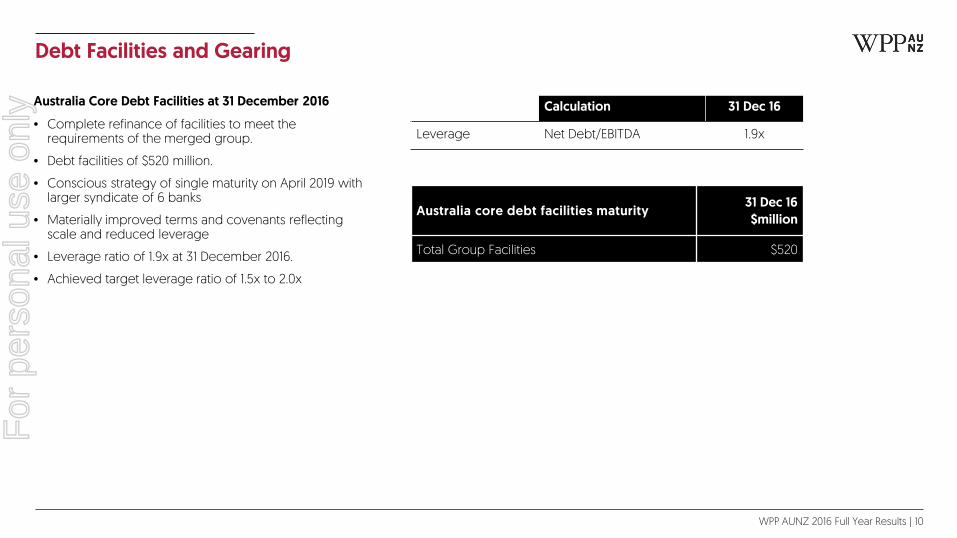
Australia Core Debt Facilities at 31 December 2016
• Complete refinance of facilities to meet the requirements of the merged group.
• Debt facilities of $520 million.
• Conscious strategy of single maturity on April 2019 with larger syndicate of 6 banks
• Materially improved terms and covenants reflecting scale and reduced leverage
• Leverage ratio of 1.9x at 31 December 2016.
• Achieved target leverage ratio of 1.5x to 2.0x
Australia core debt facilities maturity 31 Dec 16 $million
Total Group Facilities $520
Calculation 31 Dec 16
Leverage Net Debt/EBITDA 1.9x
For
per
sona
l use
onl
y
Aggregate Earnout Position
WPP AUNZ 2016 Full Year Results | 11
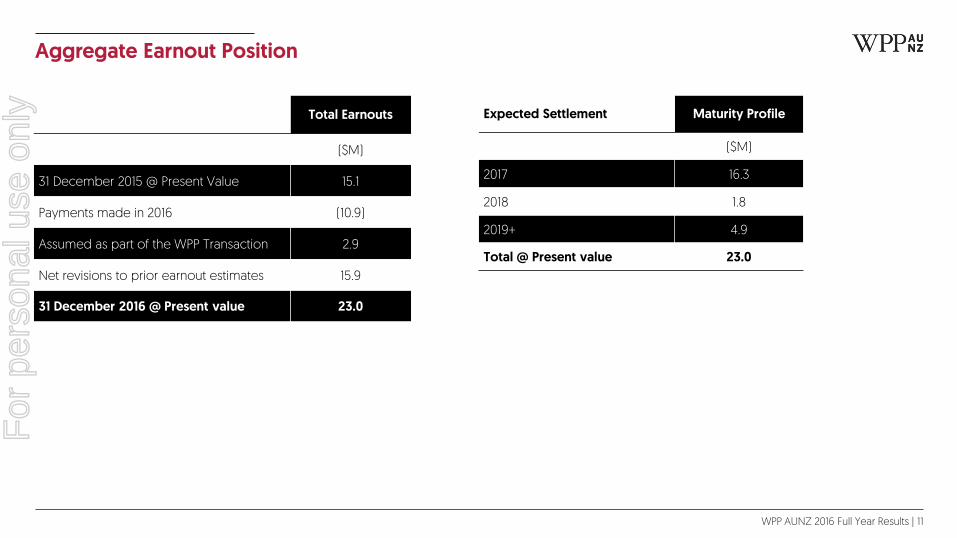
Total Earnouts
($M)
31 December 2015 @ Present Value 15.1
Payments made in 2016 (10.9)
Assumed as part of the WPP Transaction 2.9
Net revisions to prior earnout estimates 15.9
31 December 2016 @ Present value 23.0
Expected Settlement Maturity Profile
($M)
2017 16.3
2018 1.8
2019+ 4.9
Total @ Present value 23.0
For
per
sona
l use
onl
y

WPP AUNZ 2016 Full Year Results | 12
Harnessing the powerWPP AUNZ
Mike Connaghan, WPP AUNZChief Executive Officer
For
per
sona
l use
onl
y
Full Year Results by Segment - 31 December 2016
WPP AUNZ 2016 Full Year Results | 13
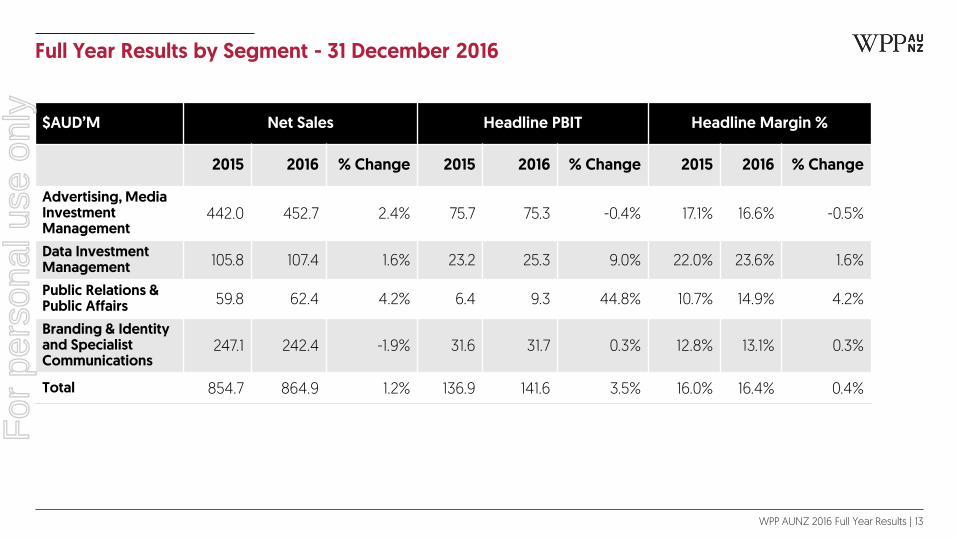
$AUD’M Net Sales Headline PBIT Headline Margin %
2015 2016 % Change 2015 2016 % Change 2015 2016 % Change
Advertising, Media Investment Management
442.0 452.7 2.4% 75.7 75.3 -0.4% 17.1% 16.6% -0.5%
Data Investment Management 105.8 107.4 1.6% 23.2 25.3 9.0% 22.0% 23.6% 1.6%
Public Relations & Public Affairs 59.8 62.4 4.2% 6.4 9.3 44.8% 10.7% 14.9% 4.2%
Branding & Identity and Specialist Communications
247.1 242.4 -1.9% 31.6 31.7 0.3% 12.8% 13.1% 0.3%
Total 854.7 864.9 1.2% 136.9 141.6 3.5% 16.0% 16.4% 0.4%
For
per
sona
l use
onl
y

CONNECTED KNOW-HOWKnow more, do more, be more.
So together we can achieve the extraordinary.
For
per
sona
l use
onl
y

3. LEVERAGE THE POWER OF WPP
Leveraging WPP’s IP, tools, expertise in data management, digital, research and technology investment.
1. BIG AT HOME
Maintain leadership position in core business and drive home advantage of our superior scale.
4. DRIVE HORIZONTALITY
Driving collaboration and horizontality across our group for the benefit of our people, our companies and our clients.
2. FUTURE-PROOF
Future-proof the group through technology, data, content, mobile and proprietary offerings.
WPP AUNZ StrategyDeliver 100%
of client’s customer experience budget
For
per
sona
l use
onl
y

• Mature low growth – Must win market share.
• Blend best of local and global - strong local market knowledge and relationship with iconic brands, tools and global reach.
• Capture group production work flowing through to strong production and shopper capabilities.
• Optimise portfolio driving efficiency, effectiveness and enhanced capability.
1. BIG AT HOME
WPP AUNZ 2016 Full Year Results | 16
For
per
sona
l use
onl
y

• Significant lead in the Digital specialists space:
• DT AKQA – complimentary merger
• White and Grey – collaboration and engagement
• Invest in data capability and leverage WPP data alliance.
• Consolidating of shopper assets to grow our share of burgeoning customer journey spend.
• Build proprietary tools and partner with clients in helping them transform their business model for the Digital age.
• Focus on Marketing Technology. Immediate opportunities exist around platforms and ecosystems (DT, Wunderman-Bienalto, One20, Adcast, Fusion, VML).
2. FUTURE-PROOF
WPP AUNZ 2016 Full Year Results | 17
For
per
sona
l use
onl
y

• ANZ serious market for WPP – engagement from Global CEO’s outstanding.
• Establish the Data Alliance along with access to new proprietary tools to grow our share of data dollars.
• 5th largest Global WPP market for Data Alliance.
• Buchanan - Kantar global collaboration piloting Home Tester Club across global test markets.
• The Store - partnering with Geometry and Ogilvy to service key client in Australia, Asia Pacific and now Japan.
3. LEVERAGING THE POWER OF WPP
WPP AUNZ 2016 Full Year Results | 18
For
per
sona
l use
onl
y
• Leverage power of group wide resources and relationships.
• Build bespoke client teams/ reduce complexity.
• Better outcomes for clients, our people and our companies.
• New ‘Central Support’ team formed to foster connectivity, collaboration and horizontality.
• Enhanced campus strategy fosters connectivity and collaboration by locating complementary businesses.
• Geographic hub leaders to drive connectivity.
• People drive growth: aligned incentives; internal mobility for employees; internal training and recruitment service to save headhunter and training fees.
4. DRIVE HORIZONTALITY
WPP AUNZ 2016 Full Year Results | 19
For
per
sona
l use
onl
y
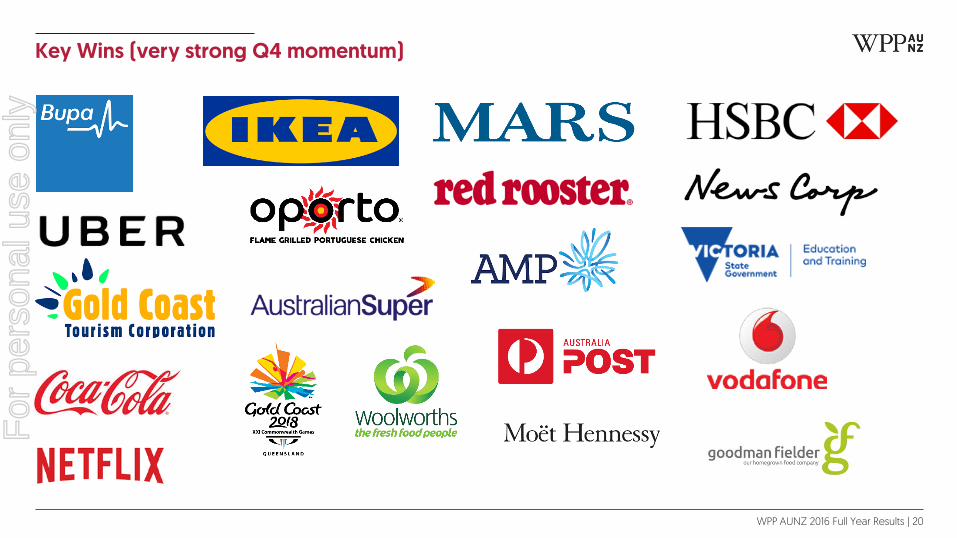
Key Wins (very strong Q4 momentum)
WPP AUNZ 2016 Full Year Results | 20
For
per
sona
l use
onl
y
WPP AUNZ 2016 Full Year ResultsSummary and Outlook
WPP AUNZ 2016 Full Year Results | 21
For
per
sona
l use
onl
y
Outlook and Summary
WPP AUNZ 2016 Full Year Results | 22
• 2017 to build on momentum established since the merger in April 2016.
• Meaningful cost synergies to flow from this year, on track to deliver A$15 million target over three years.
• Growing organic revenues from new and existing clients remains a priority. Position the business for future growth by pushing hard into areas of production, data, marketing infrastructure and shopper marketing.
• Merger is about blending the best of local and global. WPP AUNZ teams positioned to ‘Know more, Do more, Be more’.
• Buy in of all companies and staff to our new purpose – cultural change which will bring opportunity for all stakeholders.
• In FY2017, WPP AUNZ expects to deliver mid-single digit growth in earnings per share.
For
per
sona
l use
onl
y
23
For
per
sona
l use
onl
y

WPP AUNZ 2016 Full Year Results | 24
Media Market Overview
John Steedman, WPP AUNZExecutive Chairman Media Investment Management
For
per
sona
l use
onl
y
2016 Vs. 2015 Demand by Media Type
WPP AUNZ 2016 Full Year Results | 25
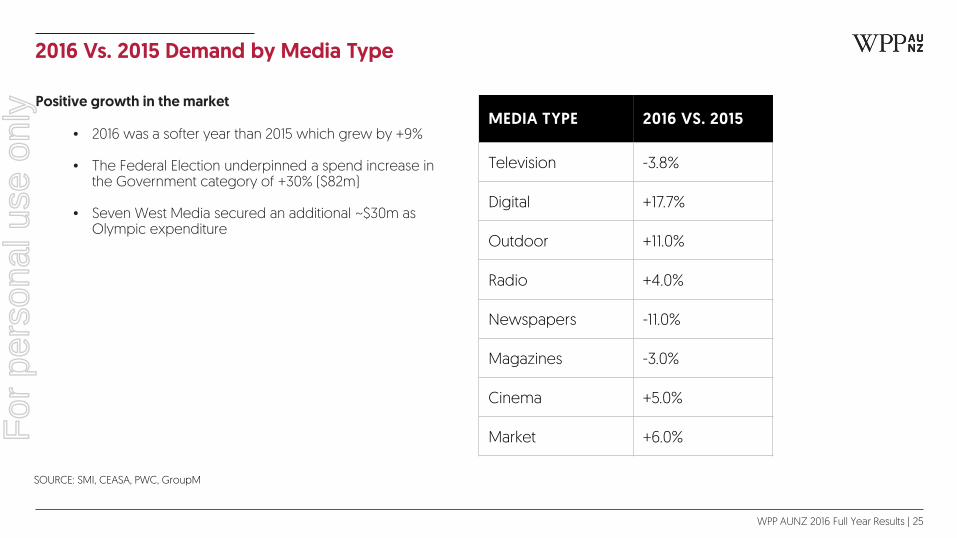
Positive growth in the market
• 2016 was a softer year than 2015 which grew by +9%
• The Federal Election underpinned a spend increase in the Government category of +30% ($82m)
• Seven West Media secured an additional ~$30m as Olympic expenditure
MEDIA TYPE 2016 VS. 2015
Television -3.8%
Digital +17.7%
Outdoor +11.0%
Radio +4.0%
Newspapers -11.0%
Magazines -3.0%
Cinema +5.0%
Market +6.0%
SOURCE: SMI, CEASA, PWC, GroupM
For
per
sona
l use
onl
y
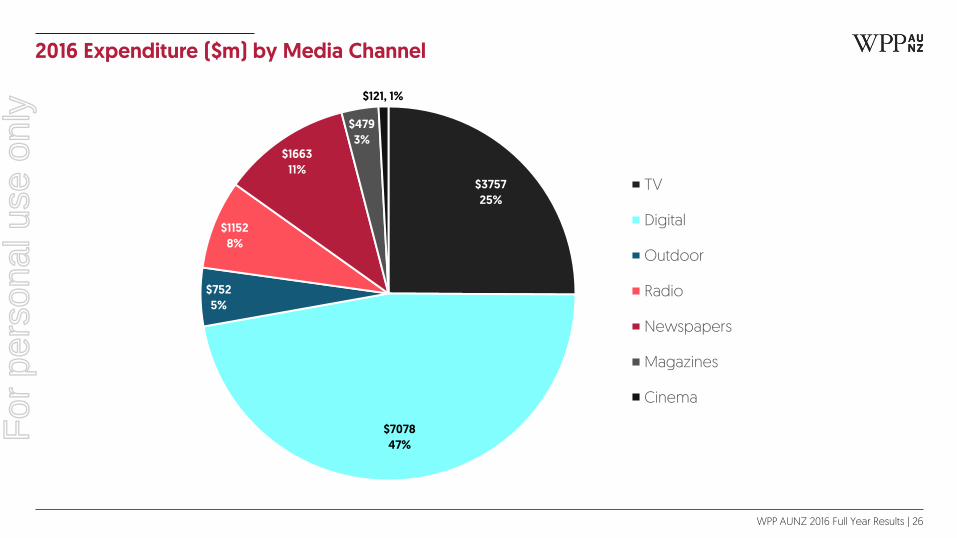
2016 Expenditure ($m) by Media Channel
WPP AUNZ 2016 Full Year Results | 26
$375725%
$707847%
$7525%
$11528%
$166311%
$4793%
$121, 1%
TV
Digital
Outdoor
Radio
Newspapers
Magazines
Cinema
For
per
sona
l use
onl
y

2016 Vs. 2015 Demand by Key Categories
WPP AUNZ 2016 Full Year Results | 27
Government & Wagering standout categories in 2016
• Government growth was driven by expenditure supporting the Federal Election, delivering $80m of growth to the category with TV, Digital and Newspaper experiencing above trend growth from the category
• Proposed Government and Opposition amendments to legislation has the potential to impact one of the fastest growing advertising categories - Wagering
• The top two categories moved expenditure from TV and re-invested in digital, radio and OOH
CATEGORY 2016 VS. 2015
Automotive Brand +1.7%
Retail +3.4%
Insurance -1.2%
Food /Produce/Dairy +1.4%
Travel +5.1%
Government +30.2%
Domestic Banks +8.0%
Restaurants -0.3%
Home Furnishing / Appliances +6.8%
Wagering +12.8%
SOURCE: SMI, CEASA, PWC, GroupM
SOURCE: Standard Media Index 2016 vs 2015
For
per
sona
l use
onl
y
2017 Demand Forecast
WPP AUNZ 2016 Full Year Results | 28
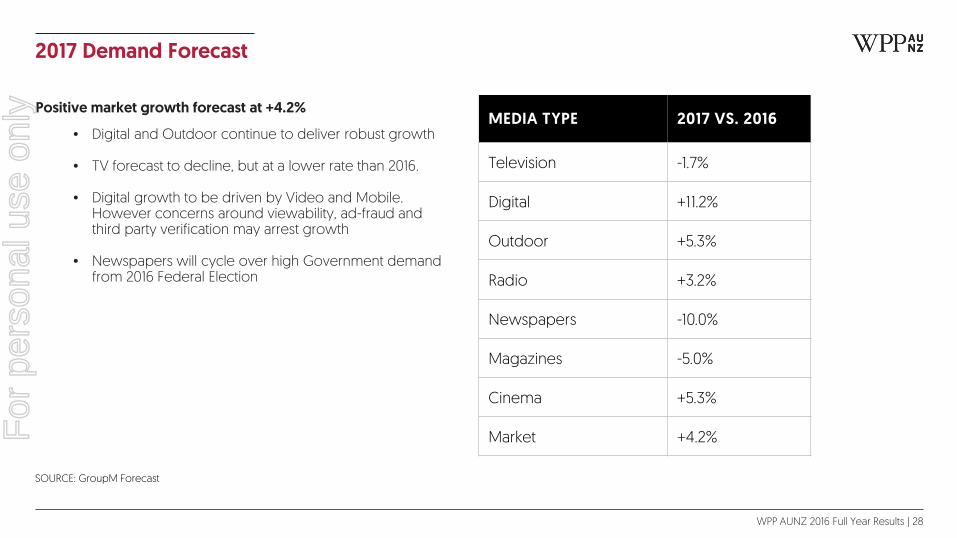
Positive market growth forecast at +4.2%
• Digital and Outdoor continue to deliver robust growth
• TV forecast to decline, but at a lower rate than 2016.
• Digital growth to be driven by Video and Mobile. However concerns around viewability, ad-fraud and third party verification may arrest growth
• Newspapers will cycle over high Government demand from 2016 Federal Election
MEDIA TYPE 2017 VS. 2016
Television -1.7%
Digital +11.2%
Outdoor +5.3%
Radio +3.2%
Newspapers -10.0%
Magazines -5.0%
Cinema +5.3%
Market +4.2%
SOURCE: SMI, CEASA, PWC, GroupM
SOURCE: GroupM Forecast
For
per
sona
l use
onl
y

Share of Media Expenditure by Media Type
WPP AUNZ 2016 Full Year Results | 29
MEDIA TYPE 2015 2016F 2017F
Television 27.6% 25.0% 23.6%
Digital 42.5% 47.2% 50.4%
Outdoor 4.8% 5.0% 5.1%
Radio 7.8% 7.7% 7.6%
Newspapers 13.2% 11.1% 9.6%
Magazines 3.3% 3.2% 2.9%
Cinema 0.8% 0.8% 0.8%
SOURCE: SMI, CEASA, PWC, GroupM
SOURCE: SMI, CEASA, PWC, GroupM
For
per
sona
l use
onl
y
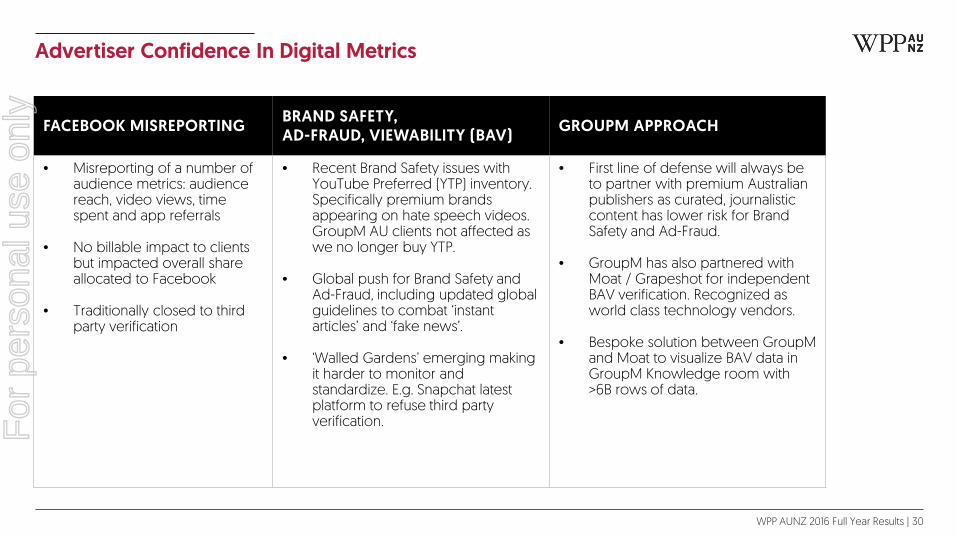
Advertiser Confidence In Digital Metrics
WPP AUNZ 2016 Full Year Results | 30SOURCE: SMI, CEASA, PWC, GroupM
FACEBOOK MISREPORTING BRAND SAFETY, AD-FRAUD, VIEWABILITY (BAV) GROUPM APPROACH
• Misreporting of a number of audience metrics: audience reach, video views, time spent and app referrals
• No billable impact to clients but impacted overall share allocated to Facebook
• Traditionally closed to third party verification
• Recent Brand Safety issues with YouTube Preferred (YTP) inventory. Specifically premium brands appearing on hate speech videos. GroupM AU clients not affected as we no longer buy YTP.
• Global push for Brand Safety and Ad-Fraud, including updated global guidelines to combat ‘instant articles’ and ‘fake news’.
• ‘Walled Gardens’ emerging making it harder to monitor and standardize. E.g. Snapchat latest platform to refuse third party verification.
• First line of defense will always be to partner with premium Australian publishers as curated, journalistic content has lower risk for Brand Safety and Ad-Fraud.
• GroupM has also partnered with Moat / Grapeshot for independent BAV verification. Recognized as world class technology vendors.
• Bespoke solution between GroupM and Moat to visualize BAV data in GroupM Knowledge room with >6B rows of data.
For
per
sona
l use
onl
y
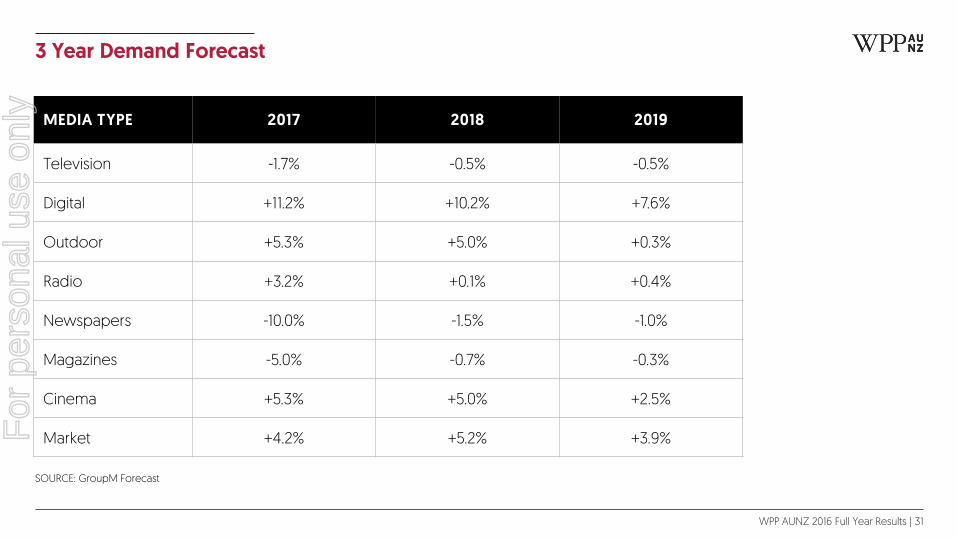
3 Year Demand Forecast
WPP AUNZ 2016 Full Year Results | 31
MEDIA TYPE 2017 2018 2019
Television -1.7% -0.5% -0.5%
Digital +11.2% +10.2% +7.6%
Outdoor +5.3% +5.0% +0.3%
Radio +3.2% +0.1% +0.4%
Newspapers -10.0% -1.5% -1.0%
Magazines -5.0% -0.7% -0.3%
Cinema +5.3% +5.0% +2.5%
Market +4.2% +5.2% +3.9%
SOURCE: SMI, CEASA, PWC, GroupM
SOURCE: GroupM Forecast
For
per
sona
l use
onl
y
Thank You.
WPP AUNZ 2016 Full Year Results | 32
For
per
sona
l use
onl
y
WPP AUNZ 2016 FULL YEAR RESULTSAppendix
WPP AUNZ 2016 Full Year Results | 33
For
per
sona
l use
onl
y
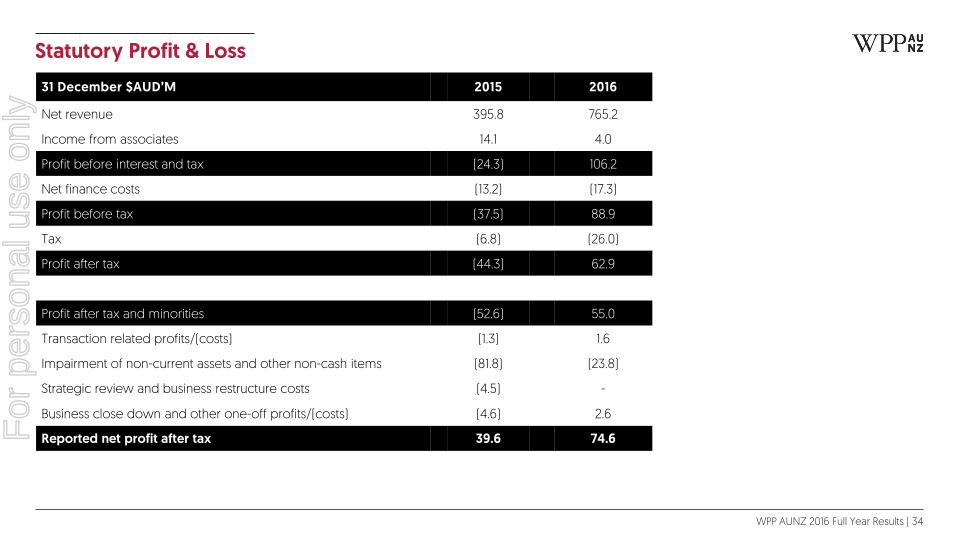
Statutory Profit & Loss
WPP AUNZ 2016 Full Year Results | 34
31 December $AUD’M 2015 2016
Net revenue 395.8 765.2
Income from associates 14.1 4.0
Profit before interest and tax (24.3) 106.2
Net finance costs (13.2) (17.3)
Profit before tax (37.5) 88.9
Tax (6.8) (26.0)
Profit after tax (44.3) 62.9
Profit after tax and minorities (52.6) 55.0
Transaction related profits/(costs) (1.3) 1.6
Impairment of non-current assets and other non-cash items (81.8) (23.8)
Strategic review and business restructure costs (4.5) -
Business close down and other one-off profits/(costs) (4.6) 2.6
Reported net profit after tax 39.6 74.6For
per
sona
l use
onl
y
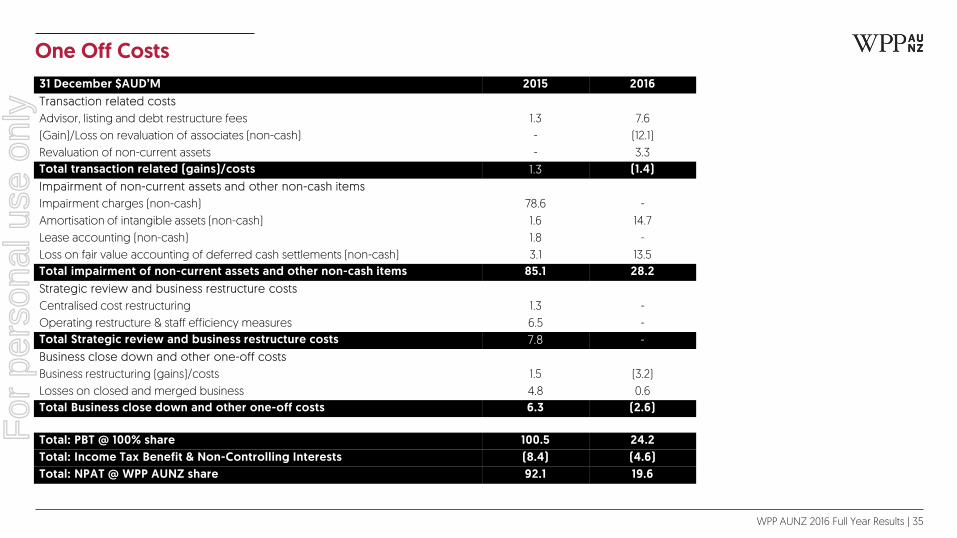
One Off Costs
WPP AUNZ 2016 Full Year Results | 35
31 December $AUD’M 2015 2016Transaction related costsAdvisor, listing and debt restructure fees 1.3 7.6(Gain)/Loss on revaluation of associates (non-cash) - (12.1)Revaluation of non-current assets - 3.3Total transaction related (gains)/costs 1.3 (1.4)Impairment of non-current assets and other non-cash itemsImpairment charges (non-cash) 78.6 -Amortisation of intangible assets (non-cash) 1.6 14.7Lease accounting (non-cash) 1.8 -Loss on fair value accounting of deferred cash settlements (non-cash) 3.1 13.5Total impairment of non-current assets and other non-cash items 85.1 28.2Strategic review and business restructure costsCentralised cost restructuring 1.3 -Operating restructure & staff efficiency measures 6.5 -Total Strategic review and business restructure costs 7.8 -Business close down and other one-off costsBusiness restructuring (gains)/costs 1.5 (3.2)Losses on closed and merged business 4.8 0.6Total Business close down and other one-off costs 6.3 (2.6)
Total: PBT @ 100% share 100.5 24.2Total: Income Tax Benefit & Non-Controlling Interests (8.4) (4.6)Total: NPAT @ WPP AUNZ share 92.1 19.6
For
per
sona
l use
onl
y


