31
WATER QUALITY MONITORING
| Date post: | 09-Apr-2018 |
| Category: |
Documents |
| Upload: | manmohit-singh |
| View: | 223 times |
| Download: | 0 times |
8/7/2019 WQ monitoring
http://slidepdf.com/reader/full/wq-monitoring 1/31
WATER QUALITYMONITORING
8/7/2019 WQ monitoring
http://slidepdf.com/reader/full/wq-monitoring 2/31
Water Quality
NET WORKLABOTATRIESINSTRUMENTSMANPOWERSTANDARDS
TRENDPENALTIESREWARDS
8/7/2019 WQ monitoring
http://slidepdf.com/reader/full/wq-monitoring 3/31
NET WORK(observation)
ROUTINE MONITORINGSURVILIENCESurveysSPECIAL PURPOSE
MOBILE
8/7/2019 WQ monitoring
http://slidepdf.com/reader/full/wq-monitoring 4/31
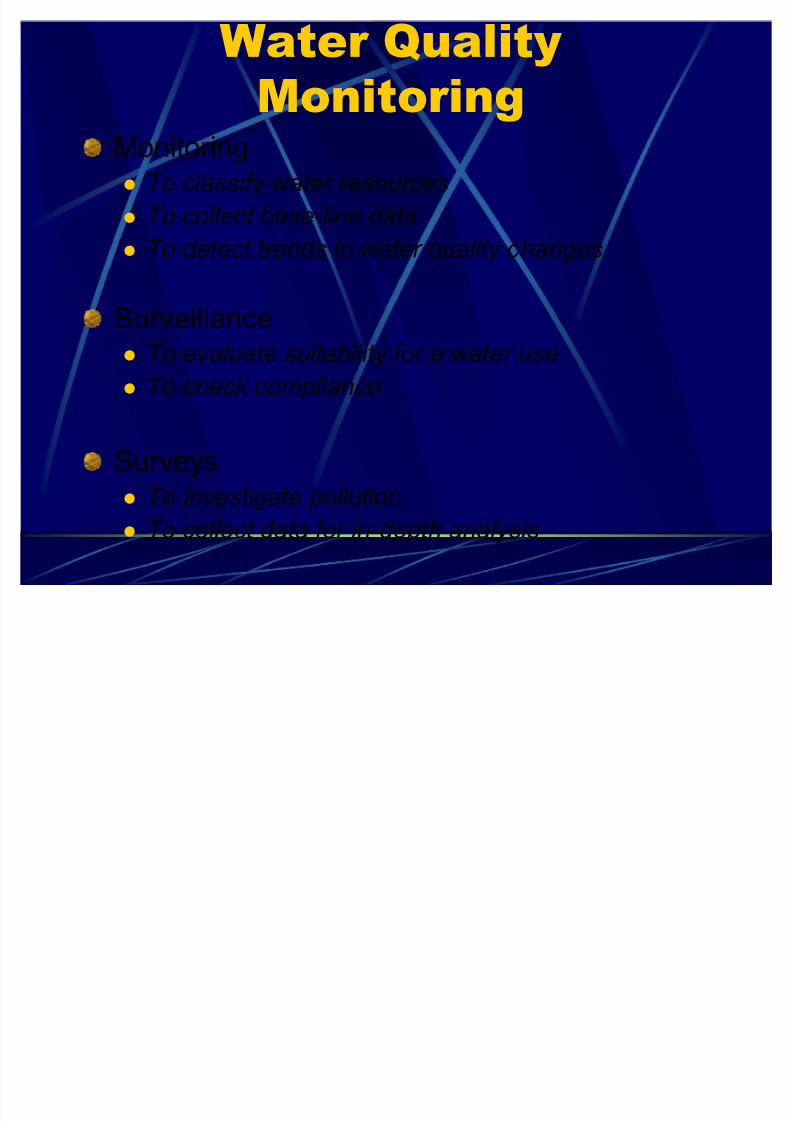
Water QualityMonitoring
MonitoringTo classify water resourcesTo collect base-line dataTo detect trends in water quality changes
SurveillanceTo evaluate suitability for a water useTo check compliance
SurveysTo investigate pollutionTo collect data for in-depth analysis
8/7/2019 WQ monitoring
http://slidepdf.com/reader/full/wq-monitoring 5/31
NET WORK(SAMPLE COLLECTION)InsituLevel2level3
8/7/2019 WQ monitoring
http://slidepdf.com/reader/full/wq-monitoring 6/31

8/7/2019 WQ monitoring
http://slidepdf.com/reader/full/wq-monitoring 7/31
NET WORK(instrument)
LAB SPECIFIC ASSURED POWER SUPPLYSAFE TRANSPORT OF SAMPLESWORKING CONDITION
INDEGINOUS/IMPORTEDINSTRUMENTSSTRICT PENALITIES
8/7/2019 WQ monitoring
http://slidepdf.com/reader/full/wq-monitoring 8/31
Water Quality PlanningRequirement in India
Large variation in river dischargeUntreated river water used for domesticsupplyWater quality can not be allowed todegradeUniform emission standards for industries
8/7/2019 WQ monitoring
http://slidepdf.com/reader/full/wq-monitoring 9/31
Water Quality PlanningRequirement in India
40% LIVE BELOW POVERTY LINE90% OF TRIBALS LIVE NEAR OR INFORESTLARGE SIZE OF CITY POPULATIONDONOT HAVE WATER SUPPLY ANDSANITATION FACILITYWATER SUPPLY IS FROM GOVT. DEPTT.NO ORGANISED SAMPLING MECHANISM
8/7/2019 WQ monitoring
http://slidepdf.com/reader/full/wq-monitoring 10/31
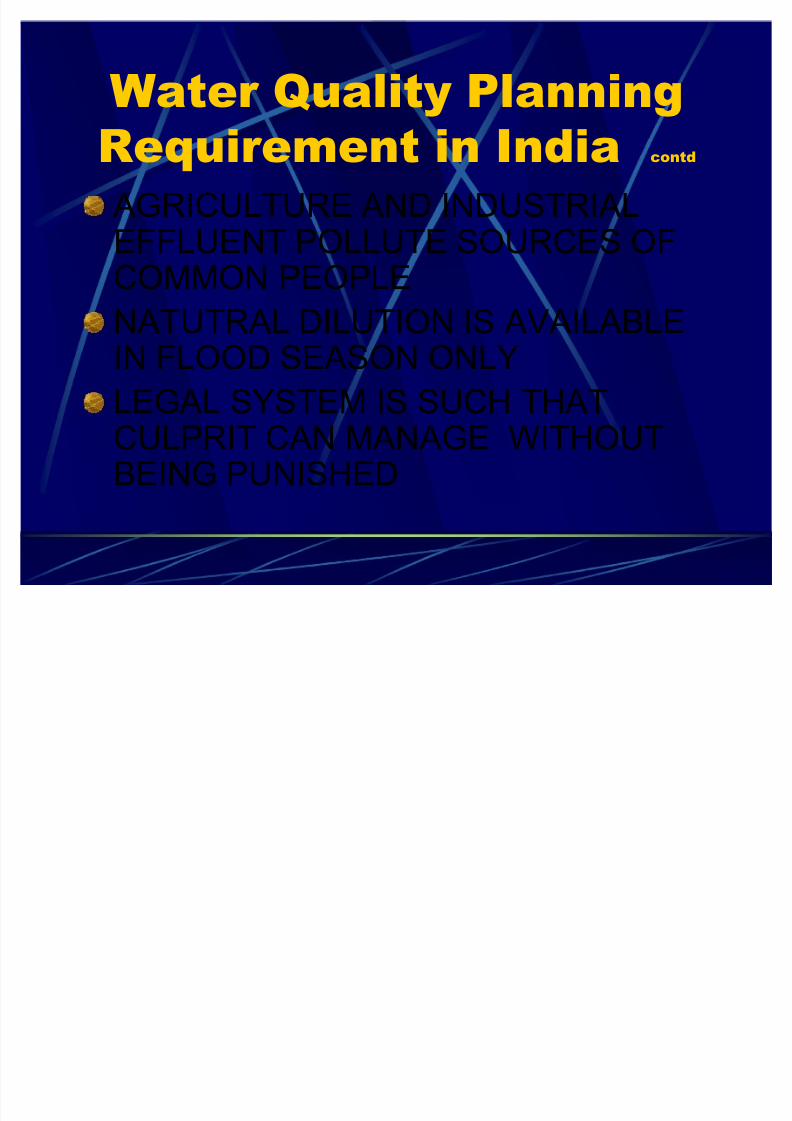
Water Quality PlanningRequirement in India contd
AGRICULTURE AND INDUSTRIALEFFLUENT POLLUTE SOURCES OFCOMMON PEOPLENATUTRAL DILUTION IS AVAILABLEIN FLOOD SEASON ONLY
LEGAL SYSTEM IS SUCH THATCULPRIT CAN MANAGE WITHOUTBEING PUNISHED

8/7/2019 WQ monitoring
http://slidepdf.com/reader/full/wq-monitoring 11/31
Water Quality PlanningRequirement in India contd
15 % HUMAN AND 18 % ANIMALPOPULATION LIVES ON 2. 5 % LANDHAS LONG COAST LINE FOR SEAWTER INTRUSIONRAIN WTER HRVESTING
STRUCTURES ARE ON RISK OFPOLLUTION FROM MAN AND ANIMALWASTE POLLUTING THE G.W
8/7/2019 WQ monitoring
http://slidepdf.com/reader/full/wq-monitoring 12/31
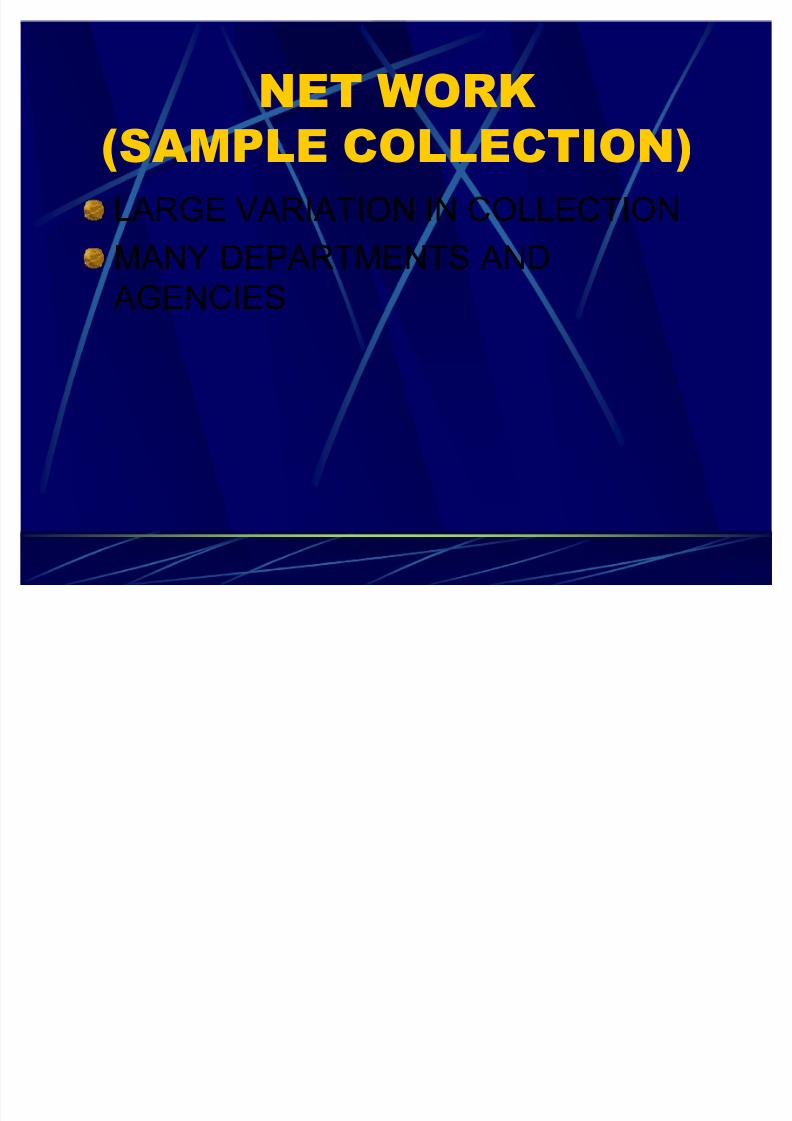
NET WORK(SAMPLE COLLECTION)LARGE VARIATION IN COLLECTIONMANY DEPARTMENTS AND
AGENCIES
8/7/2019 WQ monitoring
http://slidepdf.com/reader/full/wq-monitoring 13/31
8/7/2019 WQ monitoring
http://slidepdf.com/reader/full/wq-monitoring 14/31
8/7/2019 WQ monitoring
http://slidepdf.com/reader/full/wq-monitoring 15/31
8/7/2019 WQ monitoring
http://slidepdf.com/reader/full/wq-monitoring 16/31
8/7/2019 WQ monitoring
http://slidepdf.com/reader/full/wq-monitoring 17/31
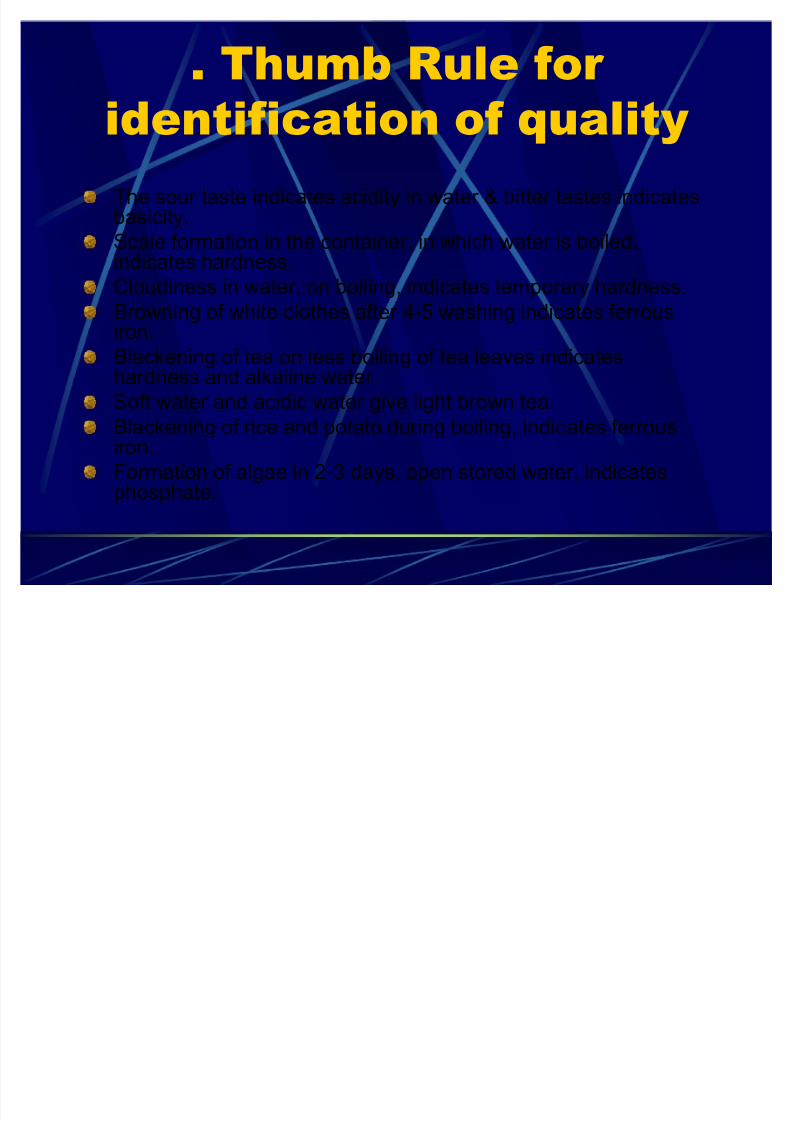
. Thumb Rule for
identification of qualityThe sour taste indicates acidity in water & bitter tastes indicatesbasicity.Scale formation in the container, in which water is boiled,indicates hardness.Cloudiness in water, on boiling, indicates temporary hardness.Browning of white clothes after 4- 5 washing indicates ferrousiron.Blackening of tea on less boiling of tea leaves indicateshardness and alkaline water.Soft water and acidic water give light brown tea.Blackening of rice and potato during boiling, indicates ferrousiron.Formation of algae in 2 -3 days, open stored water, indicatesphosphate.
8/7/2019 WQ monitoring
http://slidepdf.com/reader/full/wq-monitoring 18/31
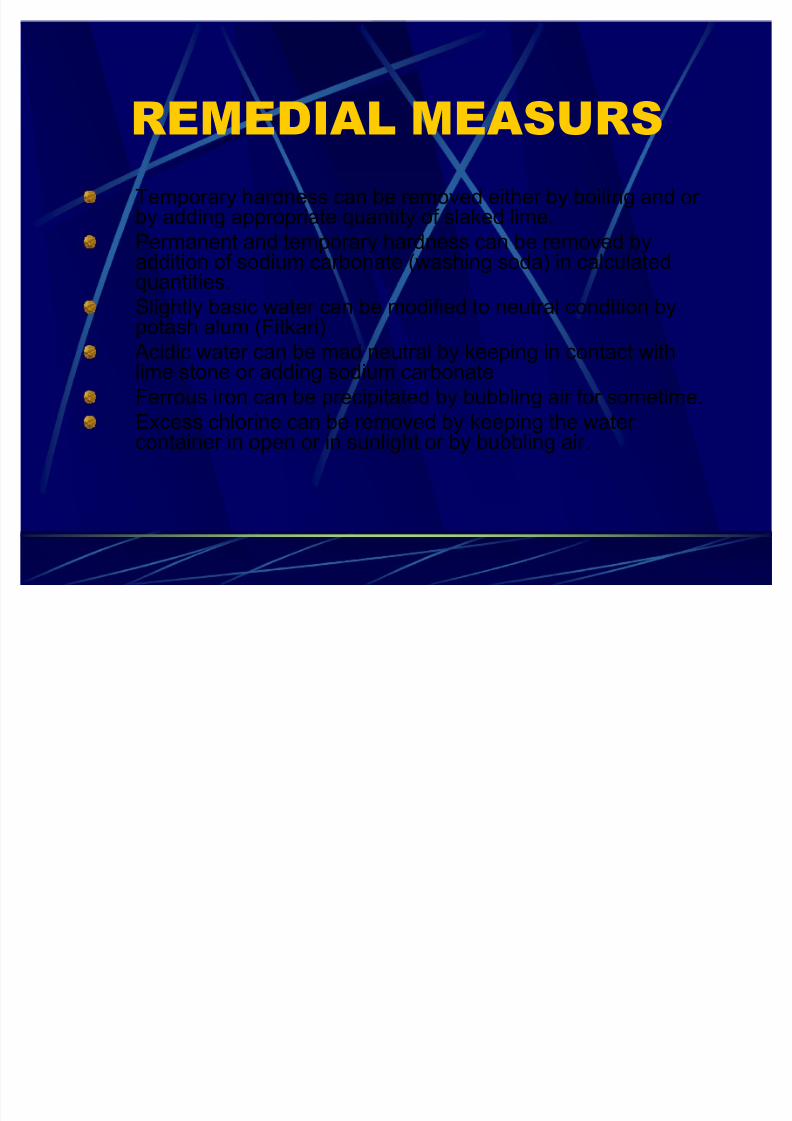
REMEDIAL MEASURSTemporary hardness can be removed either by boiling and or by adding appropriate quantity of slaked lime.Permanent and temporary hardness can be removed byaddition of sodium carbonate (washing soda) in calculatedquantities.Slightly basic water can be modified to neutral condition bypotash alum (Fitkari)
Acidic water can be mad neutral by keeping in contact withlime stone or adding sodium carbonateFerrous iron can be precipitated by bubbling air for sometime.Excess chlorine can be removed by keeping the water container in open or in sunlight or by bubbling air.
8/7/2019 WQ monitoring
http://slidepdf.com/reader/full/wq-monitoring 19/31
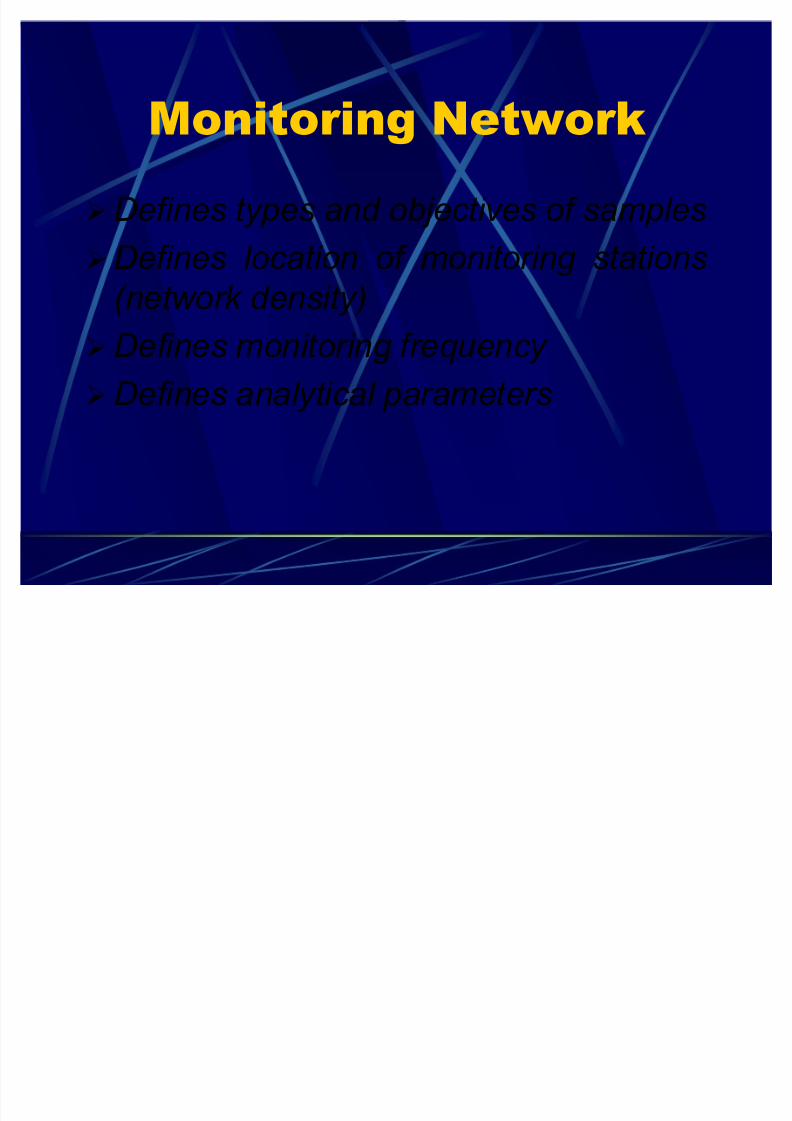
Monitoring NetworkD efines types and objectives of samplesD efines location of monitoring stations(network density)D efines monitoring frequency D efines analytical parameters
8/7/2019 WQ monitoring
http://slidepdf.com/reader/full/wq-monitoring 20/31
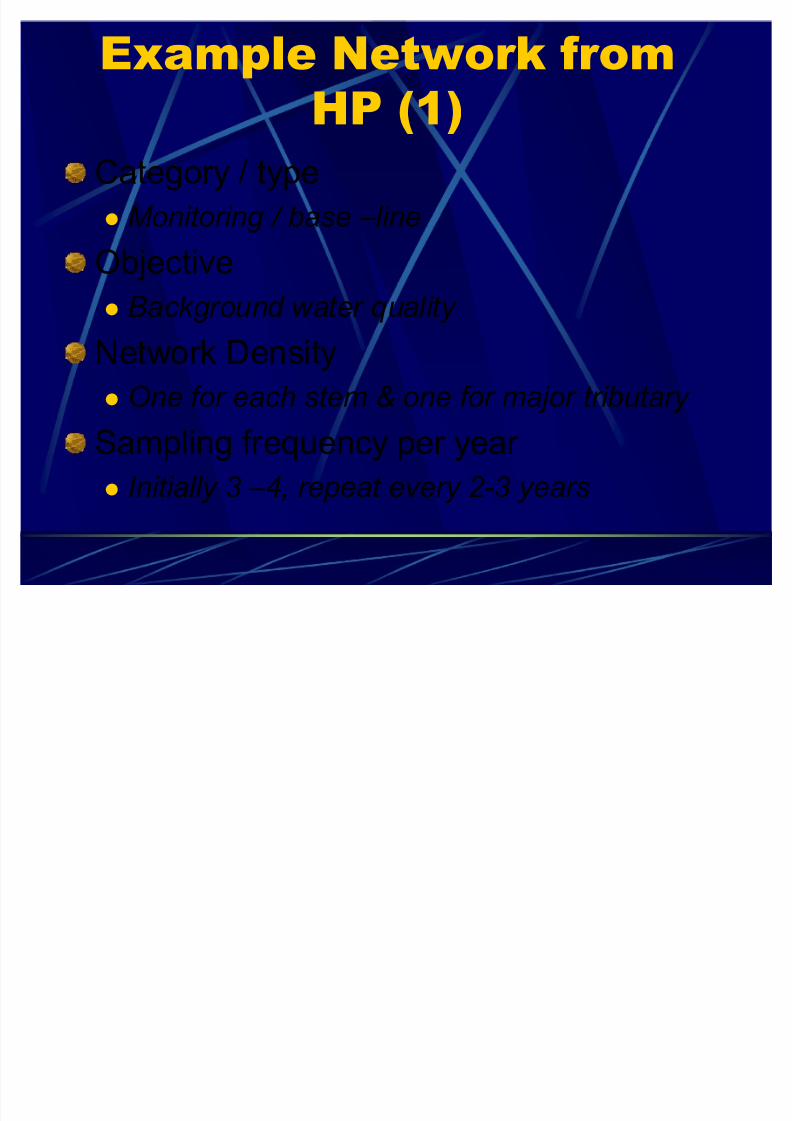
Example Network fromHP (1)
Category / typeM onitoring / base ±line
ObjectiveB ackground water quality
Network DensityO ne for each stem & one for major tributary
Sampling frequency per year I nitially 3 ±4, repeat every 2-3 years
8/7/2019 WQ monitoring
http://slidepdf.com/reader/full/wq-monitoring 21/31
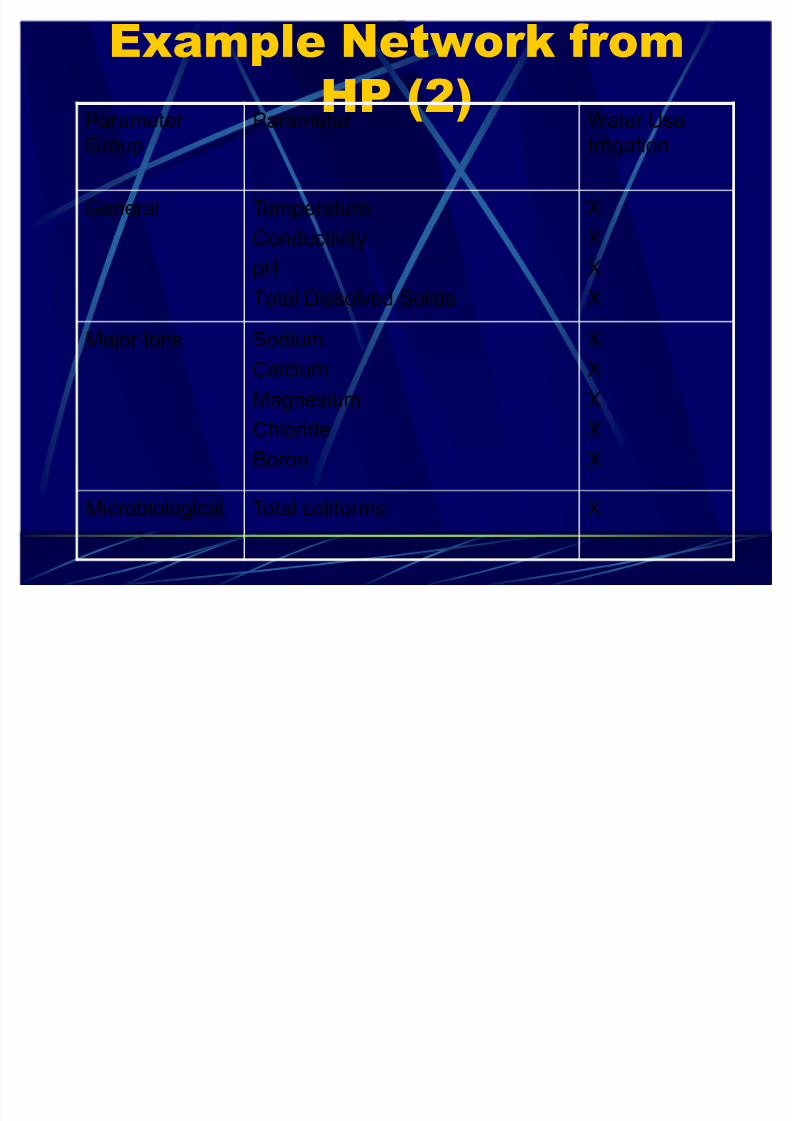
Example Network fromHP (2)
Parameter Group
Parameter Water UseIrrigation
General TemperatureConductivity
pHTotal Dissolved Solids
XX
XX
Major Ions SodiumCalciumMagnesiumChlorideBoron
XXXXX
Microbiological Total coliforms X

8/7/2019 WQ monitoring
http://slidepdf.com/reader/full/wq-monitoring 22/31
Water Quality PlanningFixed emission limits for dischargesControl by means of water qualityobjectives
8/7/2019 WQ monitoring
http://slidepdf.com/reader/full/wq-monitoring 23/31
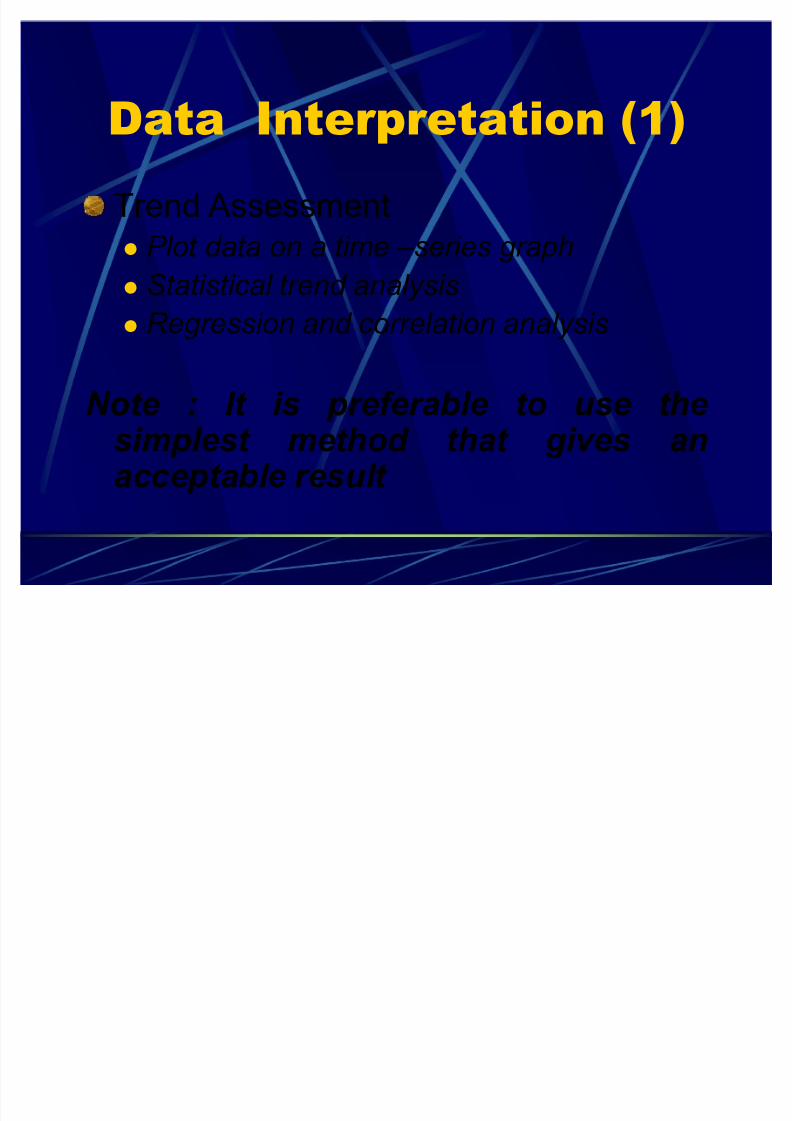
Data Interpretation (1)Trend Assessment
P lot data on a time ±series graph
Statistical trend analysisRegression and correlation analysis
Note : It is preferable to use thesimplest method that gives anacceptable result
8/7/2019 WQ monitoring
http://slidepdf.com/reader/full/wq-monitoring 24/31
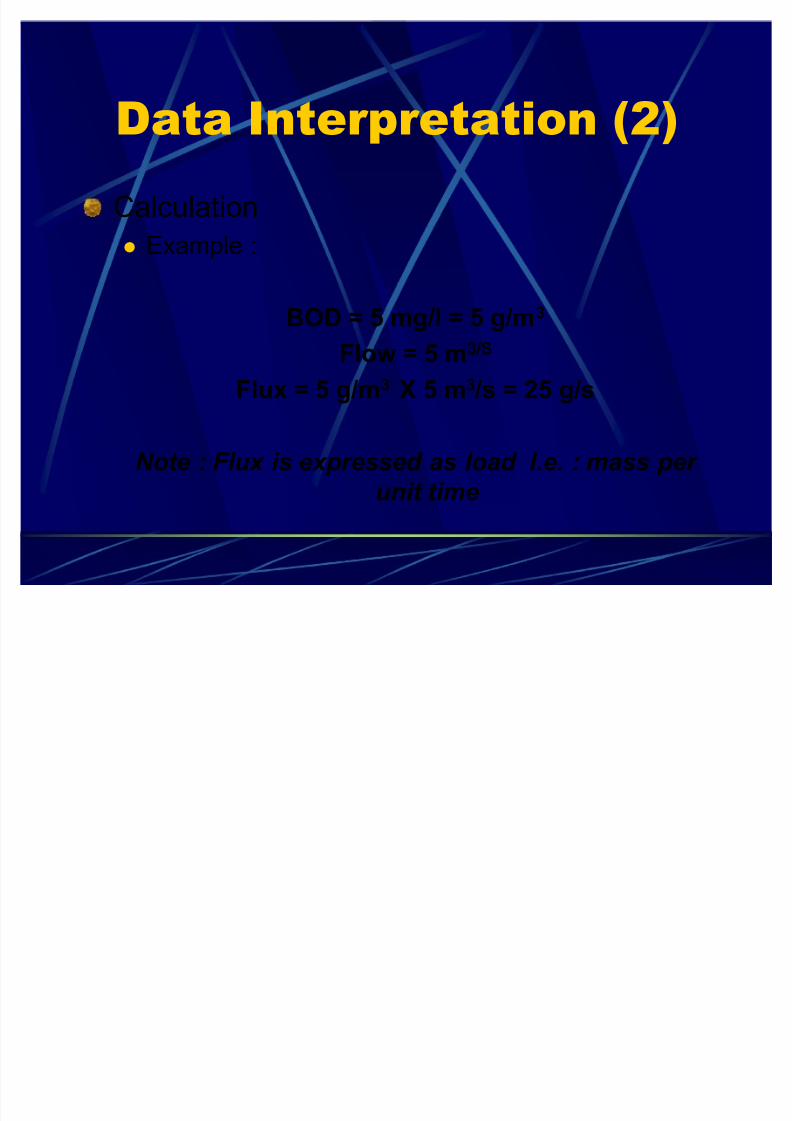
Data Interpretation (2)Calculation
Example :
BOD = 5 mg/l = 5 g/m 3
Flow = 5 m 3/S
Flux = 5 g/m 3 X 5 m 3 /s = 25 g/s
Note : Flux is expressed as load I.e. : mass per unit time

8/7/2019 WQ monitoring
http://slidepdf.com/reader/full/wq-monitoring 25/31
Data Interpretation (4)Presentation of Data
C ompare data with water quality standardsC ompare data with international standardsC ompare data from different areasShow how quality has changed at one point
over time (relating this to particular events, if applicable)
8/7/2019 WQ monitoring
http://slidepdf.com/reader/full/wq-monitoring 26/31
Control Using Water Quality Objectives
Agree legitimate watercourse uses inconsultation with interested parties
Set water quality objectives based oncurrent or future desired useSet water quality standards which allow
desired objectives to be met
8/7/2019 WQ monitoring
http://slidepdf.com/reader/full/wq-monitoring 27/31
Fixed Emission Limits
Are fair to all dischargesMay impose unnecessarily strictconditions
Assimilative capacity of river is nottaken into accountSet discharge limits for effluents whichdo not infringe water quality standards

8/7/2019 WQ monitoring
http://slidepdf.com/reader/full/wq-monitoring 28/31
River Action PlansMeasure present water qualityDetermine present and plannedbeneficial water usesCompare most stringent water qualityrequirement with existing qualityFormulate action plansTake action
8/7/2019 WQ monitoring
http://slidepdf.com/reader/full/wq-monitoring 29/31
Data Interpretation (3)Compliance Assessment
W ater ResourcesC ompare analytical results with water quality standards (singly over a period of time)
EffluentC ompare analytical results with effluent
permit

8/7/2019 WQ monitoring
http://slidepdf.com/reader/full/wq-monitoring 30/31
Data Interpretation (3)Compliance Assessment
W ater ResourcesC ompare analytical results with water quality standards (singly over a period of time)
EffluentC ompare analytical results with effluent
permit
8/7/2019 WQ monitoring
http://slidepdf.com/reader/full/wq-monitoring 31/31
Data Interpretation (4)Presentation of Data
C ompare data with water quality standardsC ompare data with international standardsC ompare data from different areasShow how quality has changed at one point
over time (relating this to particular events, if applicable)


