WRC RESEARCH REPORT NO. 102 A STUDY OF THE TREATMENT OF LAKE MICHIGAN WATER USING DIRECT FILTRATION Raymond D. Letterman Department of Environmental Engineering Illinois Institute of Technology Chicago, Illinois FINAL REPORT Project No. A-062-ILL The work upon which this publication is based was supported by funds provided by the U.S. Department of the Interior as authorized under the Water Resources Research Act of 1964, P.L. 88-379. Agreement No. 14-31-0001-5013 UNIVERSITY OF ILLINOIS WATER RESOURCES CENTER 2535 Hydrosystems Laboratory Urbana, Illinois 61801 June, 1975
Transcript
WRC RESEARCH REPORT NO. 102
A STUDY OF THE TREATMENT OF
LAKE MICHIGAN WATER USING DIRECT FILTRATION
Raymond D. Letterman
Department of Environmental Engineering Illinois Institute of Technology
Chicago, Illinois
F I N A L R E P O R T
Project No. A-062-ILL
The work upon which this publication is based was supported by funds provided by the U.S. Department of the Interior
as authorized under the Water Resources Research Act of 1964, P.L. 88-379.
A STUDY OF THE TREATMENT OF LAKE MICHIGAN WATER USING DIRECT FILTRATION
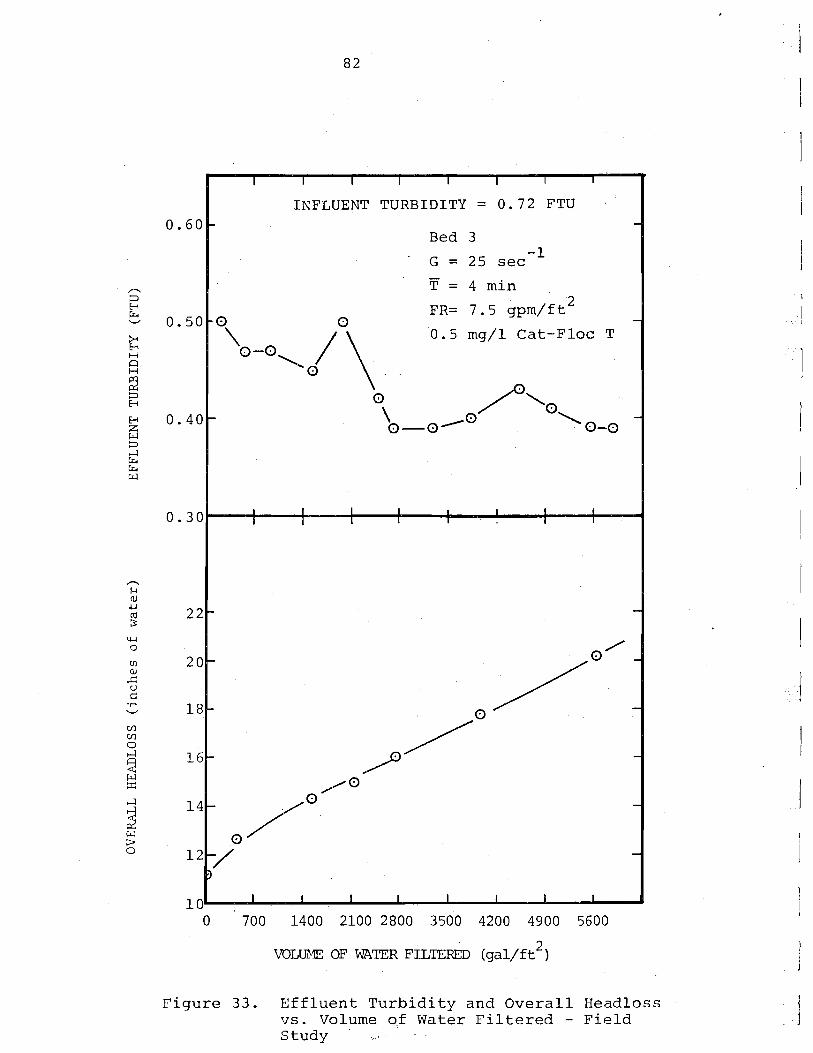
The direct filtration process can be an effective and economical alternative to the conventional sequence of operations used for water clarification. In most cases the process has been used to treat water with a consistently low turbidity. Its effectiveness in other cases, e.g., treating water from Lake Michigan, will require a thorough understanding of process behavior and con- trol techniques. Pilot plant studies were performed using a constant-rate dual-media filter preceded by a pretreatment reactor in which a cationic polyelectrolyte coagulant was added. For each filter design and set of operating conditions there is an optimum distribution of deposit within the filter bed at run termination which maximizes the water production per filter run. It was determined that the pretreatment conditions (the polyelectrolyte concentration and the mixing intensity and duration) can be used to maximize the water production per filter run and maintain an acceptable effluent turbidity. The pretreatment conditions determine the rate of clogging front advancement in the filter bed, which, in conjunction with the terminal headloss, determines the distribution of deposit with- in the bed at run termination.
Letterman, Raymond D. A STUDY OF THE TREATMENT OF LAKE MICHIGAN WATER USING DIRECT FILTRATION Final Report to the Office of Water Research and Technology, Department of the Interior, June, 1975, Washington, D.C.110~. KEYWORDS--water treatment*/direct filtration*/flocculation/ polyelectrolytes
ACKNOWLEDGMENT
The a u t h o r g r a t e f u l l y acknowledges t h e e f f o r t s o f t h e
g r a d u a t e s t u d e n t s i n t h e Department o f Environmental Engineer-
i n g a t I l l i n o i s I n s t i t u t e of Technology who conducted t h e
s t u d i e s which a r e d e s c r i b e d i n t h i s r e p o r t . The p r e l i m i n a r y
f i l t r a t i o n s t udy was conducted by Roy D. Tanner. Rami Reddy
Sama was i n charge o f t h e de s ign and c o n s t r u c t i o n o f t h e l abo ra -
t o r y p i l o t p l a n t and a long w i t h Edward DiDomenico c a r r i e d o u t
t h e l a b o r a t o r y f i l t r a t i o n s t udy . Anthony E . Burgar ino develop-
e d t h e methodology which was u sed t o de te rmine t h e optimum
s p e c i f i c d e p o s i t d i s t r i b u t i o n s by dynamic programming.
Pranee Kulprapha determined t h e f l o c s i z e d i s t r i b u t i o n s and
d e n s i t i e s and Shin-Chang Chay conducted t h e f i e l d s t u d i e s .
S p e c i a l a p p r e c i a t i o n i s extended t o t h e C i t y o f Chicago,
Department o f Water and Sewers, p a r t i c u l a r l y M r . N. J. Davoust,
Engineer o f Water P u r i f i c a t i o n , f o r p rov id ing space and equip-
ment a t t h e C e n t r a l Water F i l t r a t i o n P l a n t f o r t h e f i e l d s t udy .
. . . . . . . . . . . . . . . . L I S T OF FIGURES i v
L I S T OF T A B L E S . . . . . . . . . . . . . . . . . v i i
INTRODUCTION A. O b j e c t i v e s . . . . . . . . . . . . . . . . 1 B. B a c k g r o u n d . . . . . . . . . . . . . . . . 2
EXPERIMENTAL APPARATUS AND PROCEDURES . . . . . . A. L a b o r a t o r y F i l t r a t i o n S t u d i e s . 8
B. P r e l i m i n a r y F i l t r a t i o n S t u d i e s . . . . . . 1 6 C. F l o c S i z e D i s t r i b u t i o n and D e n s i t y . 1 8
D e t e r m i n a t i o n s
I11 RESULTS AND DISCUSSION . . . . . . A. P r e l i m i n a r y F i l t r a t i o n S t u d i e s 2 1
. . . . . . . . . . . . . B. G e n e r a l R e s u l t s . 33 . . . . . . . . . C . O p t i m u m S p e c i f i c D e p o s i t 43
D i s t r i b u t i o n C o n c e p t . . . . . . . . . . . D. P r e t r e a t m e n t S t u d i e s 6 2
. . . . . . . . . . . . . . . E . F i e l d S t u d y . 77
. . . . . . . . . . . . I V SU!IIMARY AND CONCLUSIONS 88
. . . . . . . . . . . . . V RESEARCH APPLICATIOI\SS 9 3
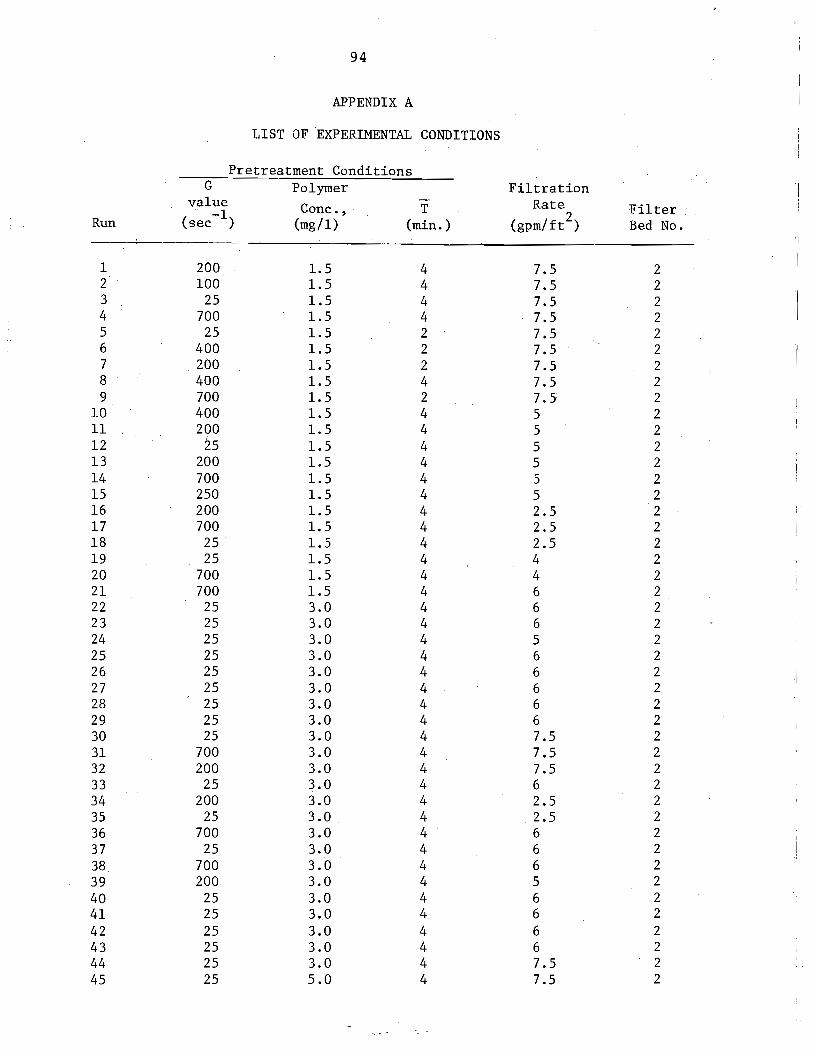
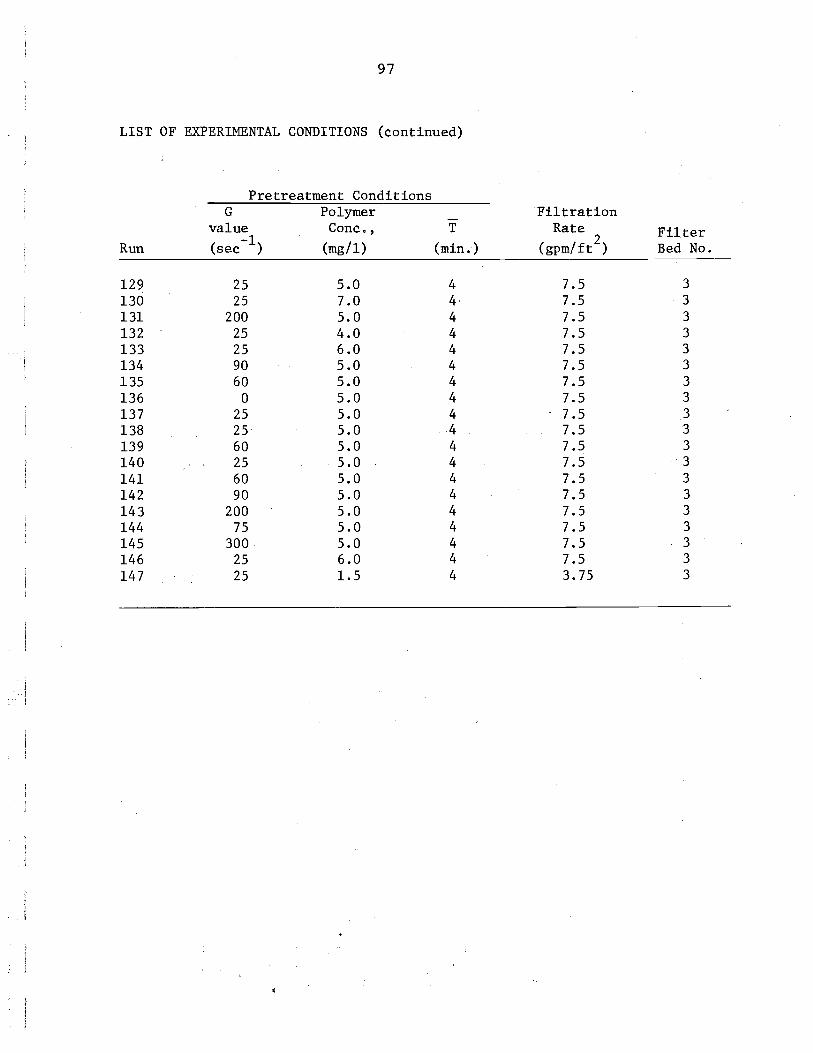
V I APPENDICES A. L i s t of E x p e r i m e n t a l C o n d i t i o n s . . 9 4 B. L i s t of S y m b o l s and A b b r e v i a t i o n s . . 9 8
. . . . . . . . . . . . . . . . . . V I I REFERENCES 1 0 0
. . . . . . . . . . . . . V I I I L I S T OF PUBLICATIONS. 1 0 2
Figu re
i v
LIST OF FIGURES
Page
Schematic Diagram of t h e Exper imenta l Apparatus . . . . . . . . . . . . . . . . . . 9
Geometric Sketch of t h e P r e f i l t r a t i o n . . . . . . . . . . Mixing Reac tor and I m p e l l e r s 11
G v a l u e v e r s u s ' Impe l l e r R o t a t i o n a l Speed . . 13
Schematic Diagram of t h e F i l t e r Assembly . . . 1 4
. . . . . . . . F i l t e r Media S i z e D i s t r i b u t i o n s 15
E f f l u e n t T u r b i d i t y v e r s u s T i m e f o r . . . . . . . . . . . . . . . . Polymers A and D 22
E f f l u e n t T u r b i d i t y and Zeta P o t e n t i a l a s a Func t ion o f Polymer Concen t r a t i on . 25
E f f e c t o f I n f l u e n t T u r b i d i t y on P a r t i c l e Zeta P o t e n t i a l f o r a Given Polymer . . . . . . . . . . . . . . . . . Concen t r a t i on 2 8
E f f e c t o f Polymer Concen t r a t i on on t h e Headloss v e r s u s T i m e R e l a t i o n s h i p f o r . . . . . . . . . . . . . . . . . . . Polymer D 29
E f f e c t o f Polymer Type on Headloss v e r s u s Time R e l a t i o n s h i p f o r a Zero P a r t i c l e Zeta P o t e n t i a l . . . . . . . . . . . . . . . . . 31
Headloss a t 6 . 5 Hours a s a Func t ion o f I n f l u e n t T u r b i d i t y - 5 mg/l Polymer A . . . . . 32
E f f l u e n t T u r b i d i t y v e r s u s Volume o f Water F i l t e r e d With and Without T u r b i d i t y Breakthrough . . . . . . . . . . . . . . . . . 35
E f f l u e n t T u r b i d i t y a t 337 g a l / f t 2 and P a r t i c l e Zeta P o t e n t i a l v e r s u s Polymer
. . . . . . . . . . . . . . . . . Concen t r a t i on 37
O v e r a l l Headloss v e r s u s Volume o f Water F i l t e r e d . . . . . . . . . . . . . . . . . . . . 39
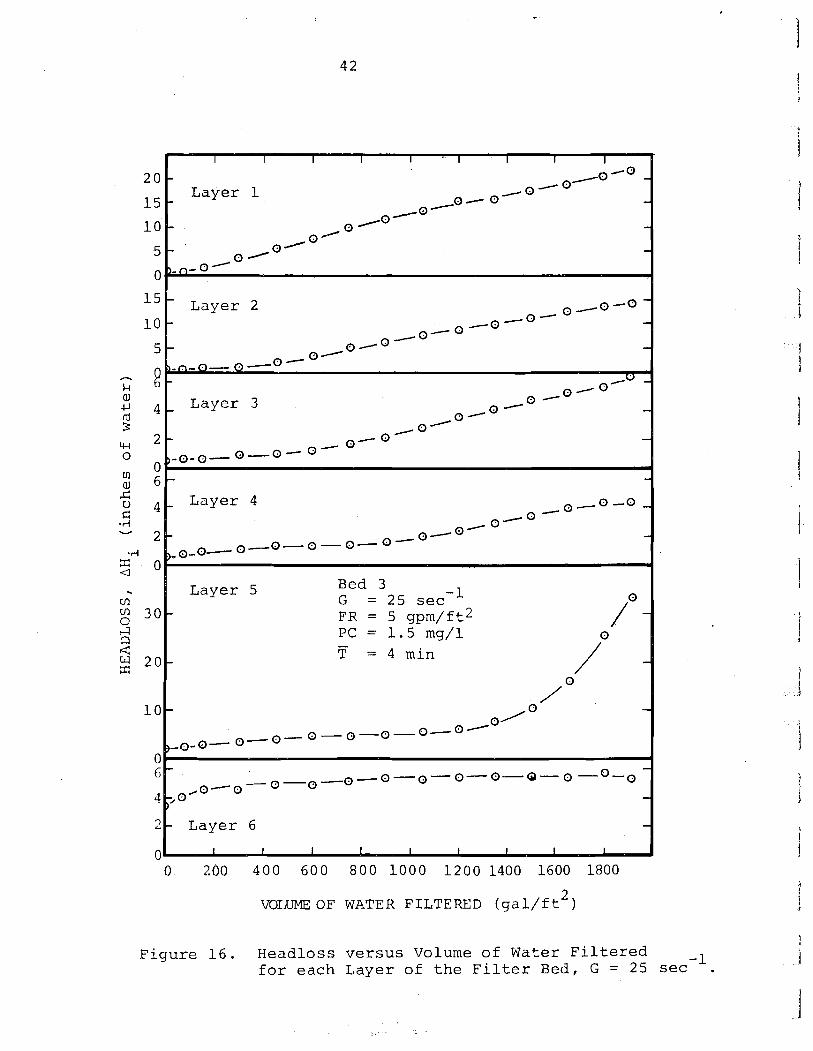
Headloss v e r s u s Volume o f Water F i l t e r e d f o r Each Layer o f t h e F i l t e r Bed,
Headloss v e r s u s Volume o f Water F i l t e r e d f o r Each La er of t h e F i l t e r Bed, G = 25 sec' 31 . . . . . . . . . . . . . . . . . 42
Page F i g u r e
17 Graphs o f Mohanka's (20) and . . . . . . . . . S a k t h i v a d i v e l I s (20) Equa t ions 47
Terminal Headloss and S p e c i f i c Depos i t D i s t r i b u t i o n s . . . . . . . . . . . . . . . . . 5 1
S p e c i f i c Depos i t Parameter v e r s u s ~ o i u m e . . . . o f Water F i l t e r e d f o r Four F i l t e r R u n s . 52
S p e c i f i c Depos i t Pa ramete r v e r s u s Water . . . . . . Produc t i on p e r F i l t e r Run, AH = 30" 54
S p e c i f i c Deposi t Pa ramete r v e r s u s Water . . . . . . Produc t i on p e r F i l t e r Run, AH = 86" 55
Maximum Water P roduc t i on p e r F i l t e r Run . . . . . . . . . . . . v e r s u s F i l t r a t i o n R a t e . 57
Observed Water P roduc t i on p e r F i l t e r Run v e r s u s F i l t r a t i o n Ra te , G = 25 .set PC = 1 . 5 mg/l and T = 4 min. . . . . . . . . . 60
P e r c e n t of Maximum Water P roduc t i on p e r . . . . . . . . . . . F i l t e r Run v e r s u s G v a l u e 63
P e r c e n t of Maximum Water P roduc t i on v e r s u s Polymer Concen t r a t i on . . . . . . . . . . . . . 65
P e r c e n t o f Maximum Water P roduc t i on p e r F i l t e r Run v e r s u s Mean De t en t i on T i m e . 67
F loc S i z e D i s t r i b u t i o n s . . . . . . . . . . . . 70
R e l a t i o n s h i p Between F l o c S i z e and D e n s i t y . . 71
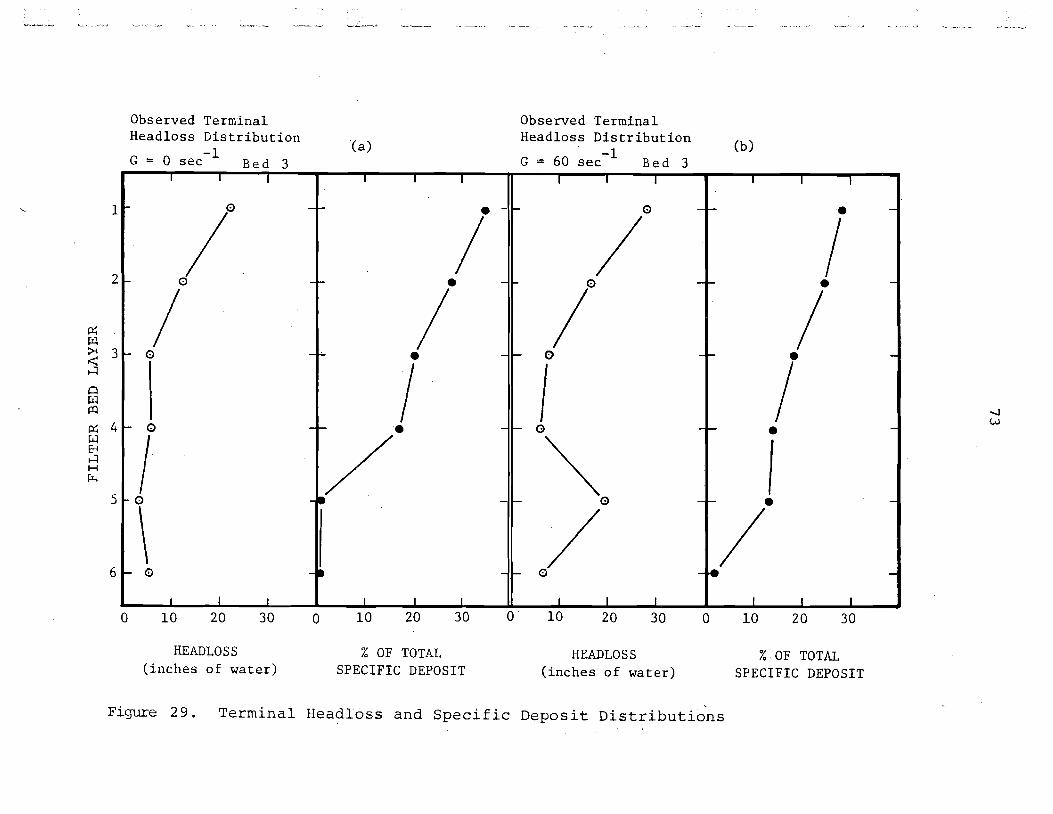
Terminal Headloss and S p e c i f i c Depos i t . . . . . . . . . . . . . . . . . D i s t r i b u t i o n s 73
Terminal Headloss and S p e c i f i c Depos i t . . . . . . . . . . . . . . . . . D i s t r i b u t i o n s 74
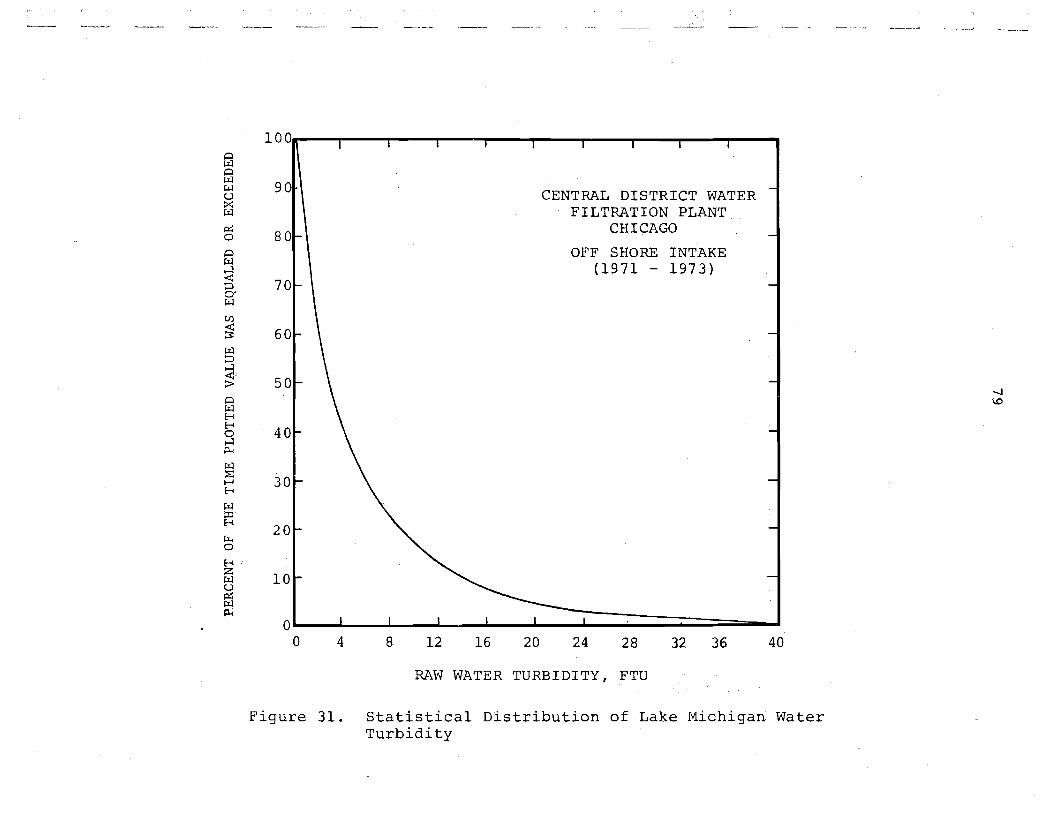
S t a t i s t i c a l D i s t r i b u t i o n o f Lake Michigan . . . . . . . . . . . . . . . . Water T u r b i d i t y 79
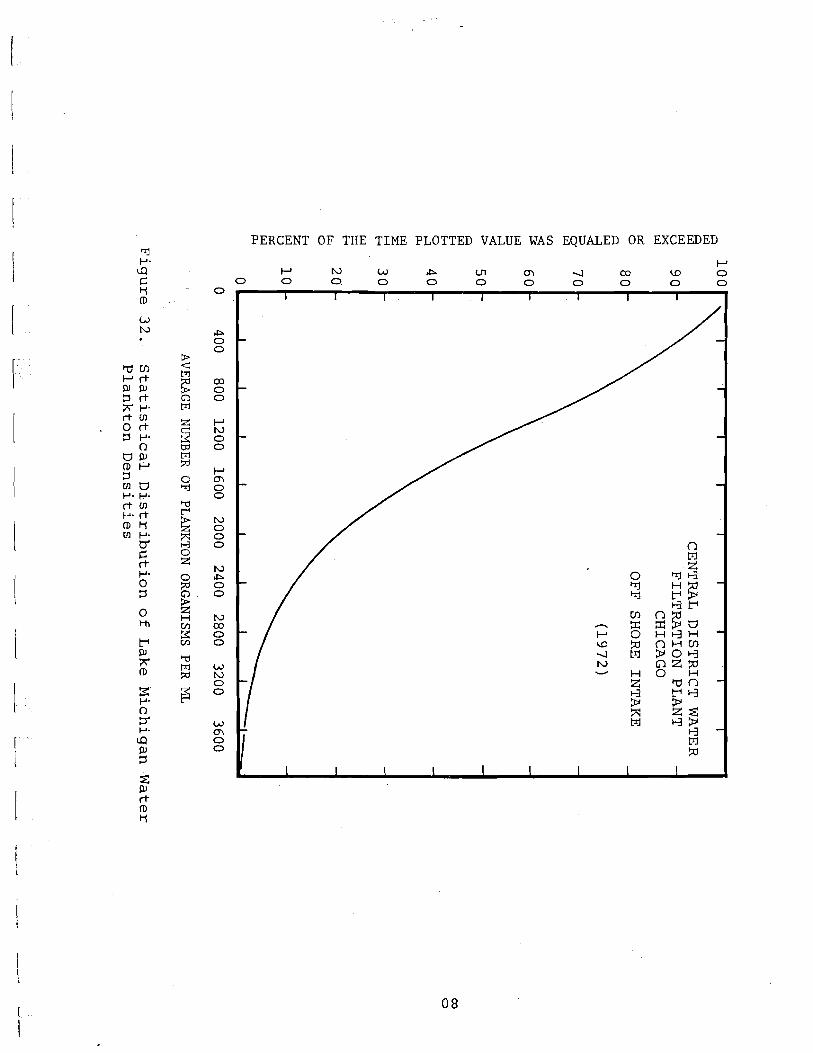
S t a t i s t i c a l D i s t r i b u t i o n o f Lake Michigan Water P lank ton D e n s i t i e s . . . . . . . . . . . 80
E f f l u e n t T u r b i d i t y and O v e r a l l Headloss v e r s u s Volume of Water F i l t e r e d - F i e l d S t u d y . . 82
Figu re Page
3 4 E f f l u e n t T u r b i d i t y and O v e r a l l Headloss v e r s u s Volume of Water F i l t e r e d - F i e l d s t u d y * 84
3 5 E f f l u e n t T u r b i d i t y and O v e r a l l Headloss ve r sus Volume of Water F i l t e r e d - F i e l d S t u d y . . . . . . . . . . . . . 8 6
v i i
LIST OF TABLES
T a b l e Page
1 E f f e c t o f Coagu lan t Type and F i l t e r Media on Length o f F i l t e r Run, Refe rence 7. . . . . . . . . . . . . . . . 6
2 E f f l u e n t T u r b i d i t y a t 6.5 Hours f o r S e v e r a l I n f l u e n t T u r b i d i t y L e v e l s - 5 mg/l Polymer A . . . . . . . . . . . . 23
3 E f f e c t i v e and Optimum Polymer C o n c e n t r a t i o n s and Cor respond ing P a r t i c l e Zeta P o t e n t i a l s . . . . . . . . 2 6
4 Polymer C o n c e n t r a t i o n s Required t o Achieve a Zero Zeta P o t e n t i a l f o r High and Low I n f l u e n t T u r b i d i t i e s . . . . . 26
5 C a l c u l a t e d Optimum Terminal Headloss D i s t r i b u t i o n s . . . . . . . . . . . . . . . 4 9
6 C o e f f i c i e n t s Used t o C a l c u l a t e Layer by Layer Clean Bed Head loss . . . . . . . . 58
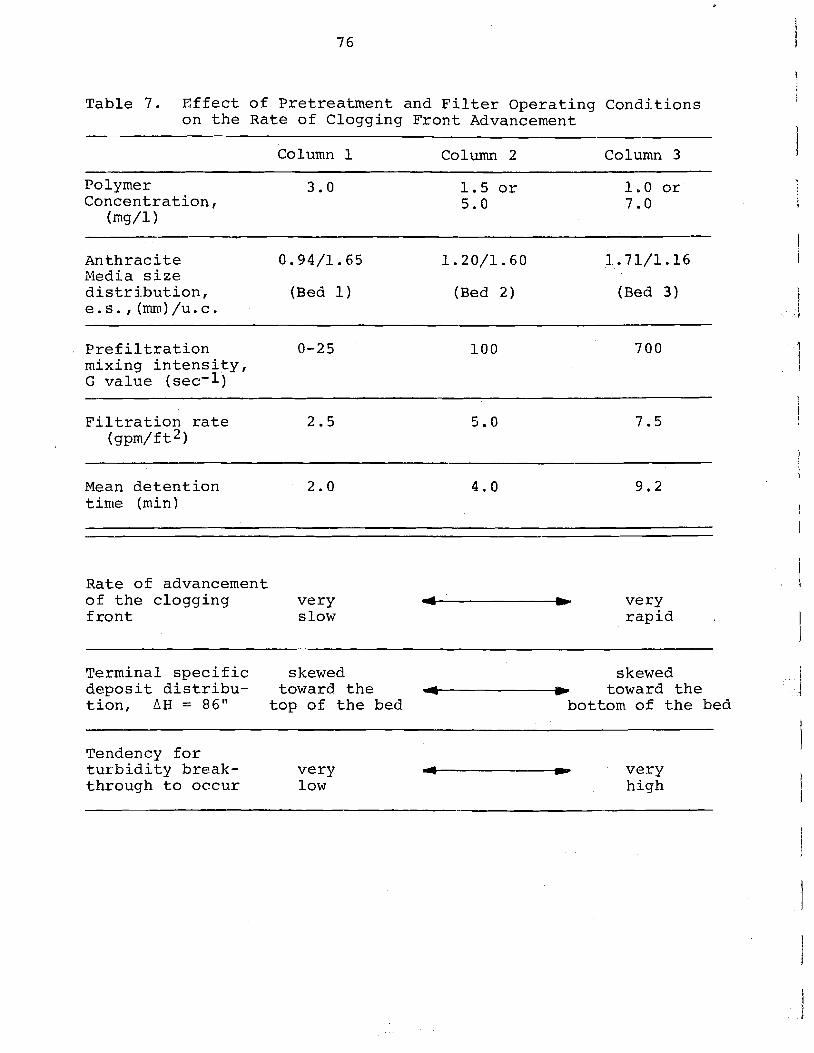
7 E f f e c t o f P r e t r e a t m e n t and F i l t e r O p e r a t i n g C o n d i t i o n s on t h e R a t e o f
. . . . . . . Clogging F r o n t Advancement. 76
I. INTRODUCTION
A. Ob j ec t i ve s : The o v e r a l l o b j e c t i v e o f t h i s p r o j e c t
w a s t o e v a l u a t e , u s i n g a 1 gpm p i l o t p l a n t , t h e e f f e c t i v e n e s s
o f t h e d i r e c t f i l t r a t i o n p r o c e s s i n t r e a t i n g w a t e r o f t h e q u a l i t y
g e n e r a l l y o b t a i n e d from Lake Michigan. The s p e c i f i c o b j e c t i v e s
o f t h e p r o j e c t i n c l u d e d t h e fo l l owing :
( a ) Determine t h e f e a s i b i l i t y o f u s i n g a c a t i o n i c po ly -
e l e c t r o l y t e a s t h e s o l e c o a g u l a n t i n t h e d i r e c t f i l t r a t i o n
p r o c e s s .
( b ) Eva lua t e t h e u s e o f c o n t r o l l e d p r e t r e a t m e n t con-
d i t i o n s such a s t h e c o a g u l a n t c o n c e n t r a t i o n and t h e p r e f i l t r a -
t i o n mixing i n t e n s i t y and d u r a t i o n t o maximize t h e f i l t e r e d
w a t e r produced p e r f i l t e r r u n and m a i n t a i n an a c c e p t a b l e
e f f l u e n t t u r b i d i t y .
( c ) Determine t h e e f f e c t of t h e f i l t e r o p e r a t i n g con-
d i t i o n s i n c l u d i n g t h e t e r m i n a l h e a d l o s s , f i l t r a t i o n r a t e and
media g r a i n s i z e d i s t r i b u t i o n on t h e p r e t r e a t m e n t c o n d i t i o n s
r e q u i r e d t o maximize w a t e r p r o d u c t i o n and m a i n t a i n an a c c e p t -
a b l e e f f l u e n t t u r b i d i t y .
( d ) Der ive and v e r i f y e x p e r i m e n t a l l y mathemat ica l
r e l a t i o n s h i p s which d e s c r i b e t h e d i r e c t f i l t r a t i o n sys tem
and which cou ld be used t o o p t i m i z e t h e sys tem d e s i g n ( i n c l u d -
i n g t h e p r e t r e a t m e n t s t e p ) and de t e rmine optimum o p e r a t i o n a l
s t r a t e g i e s d u r i n g f u t u r e s t u d i e s .
(el Conduct a s t a t i s t i c a l a n a l y s i s o f 1085 d a i l y
ave r age v a l u e s o f wa t e r q u a l i t y pa r ame te r s which a r e p e r t i n e n t
t o t h e f e a s i b i l i t y o f t r e a t i n g Lake Michigan w a t e r u s i n g
d i r e c t f i l t r a t i o n .
(f) Test the relationships and observations from (a)
through (d) using water obtained directly from Lake Michigan.
B. Background: The direct filtration process is a
variation of the conventional water treatment system in which
the raw water is treated with a coagulant during a period of
agitation and then applied directly to the filter without
prior clarification by sedimentation. The absence of sedi-
mentation or large conventional flocculation tanks can de-
crease the size of the treatment plant, decrease capital costs
and eliminate the problen of dealing with two sources of
sludge. Direct filtration is especially effective when the
raw water turbidity is low. The conventional flocculation-
sedimentation sequence is relatively ineffective and therefore
unessential in this situation.
Recent literature contains several articles which deal
with proposed or existing direct filtration facilities,
In the Province of Ontario (1,2) there are four direct filtra-
tior, plants. The original. of these four resulted from the
conversion of an existing plant on Lake Ontario at Toronto to
direct filtration in 1964. In the United States the city of
Springfield, Massachusetts has constructed a 60 ngd direct
filtration addition to its existing facility ( 3 ) . A 200 mgd
direct filtration plant has been constructed in Nevada to
treat water fron Lake Mead ( 4 ) . An 840 rngd high-rate direct
filtration plant will be constructed near Sydney, Australia ( 5 ) .
Construction costs have been shown to be reduced signifi-
cantly by the use of the direct filtration scheme. Savings in
dollars per mgd design capacity for direct filtration over the
convent iona l f l o c c u l a t i o n - s e d i m e n t a t i o n - f i l t r a t i o n sequence
range from 15,000 f o r t h e new p l a n t i n Sydney ( 5 ) t o 42,000
and 72,000 f o r t h e p l a n t a d d i t i o n s i n S p r i n g f i e l d ( 3 ) and
Toronto ( 1 ) . Camp ( 6 ) has claimed t h a t i f t h e d i r e c t f i l t r a -
t i o n p roces s were app l i ed i n a l l new p l a n t c o n s t r u c t i o n i n t h e
U.S. where annual wate r t r ea tmen t p l a n t c o n s t r u c t i o n expendi-
t u r e s amount t o $300 m i l l i o n , approximately $60 m i l l i o n would
be saved annua l ly .
The use of c a t i o n i c p o l y e l e c t r o l y t e s a s primary coagu-
l a n t s and bi-media ( a l s o c a l l e d d u a l media) and multi-media
f i l t e r s has been shown t o be an e f f e c t i v e combination i n t h e
d i r e c t f i l t r a t i o n process ( ' 7 , 8 ) . C a t i o n i c p o l y e l e c t r o l y t e s
a r e high molecular weight , long cha in o r g a n i c polymers wi th
p o s i t i v e ( c a t i o n i c ) i o n i z a b l e groups. When in t roduced t o a
suspension of nega t ive ly charged p a r t i c l e s , e . g . , c l a y
p a r t i c l e s , b a c t e r i a , e t c . , t h e polymer c h a i n s r a p i d l y absorb
on t h e p a r t i c l e s . I f a t y p i c a l , commercially a v a i l a b l e , c a t -
i o n i c p o l y e l e c t r o l y t e i s used, t h e p o s i t i v e charges on t h e
polymer tend t o n e u t r a l i z e t h e s t a b i l i z i n g n e g a t i v e charges
on t h e p a r t i c l e s i n t h e suspension. A t t h e same t i m e t h e
p a r t i a l l y adsorbed polymer cha ins may ex tend i n t o t h e s o l u t i o n
and become adsorbed on o t h e r p a r t i c l e s . This i s known a s
i n t e r p a r t i c l e b r idg ing . Both f a c t o r s , charge n e u t r a l i z a t . i o n
and i n t e r p a r t i c l e b r i d g i n g , p l a y s i g n i f i c a n t r o l e s i n t h e
f l o c c u l a t i o n process .
The mechanisms by which p o l y e l e c t r o l y t e s may enhance t h e
removal o f p a r t i c l e s i n wate r f i l t r a t i o n have been d i s c u s s e d
4
i n d e t a i l by Habibian ( 9 ) and Wnek (10) . I n t e r p a r t i c l e b r idg-
i n g , a c c o r d i n g t o Habibian ( 9 ) , i s a c o n t r o l l i n g mechanism.
The b r i d g i n g which i s s i g n i f i c a n t i n t h i s c a s e i s between
t h e f i l t e r e d p a r t i c l e and t h e media g r a i n s i n t h e f i l t e r
bed. Habibian a l s o n o t e s t h a t t h e r e i s an "optimum dosage"
o f c a t i o n i c p o l y e l e c t r o l y t e a p p l i e d t o t h e f i l t e r i n f l u e n t .
Removal o f p a r t i c l e s i n t h e f i l t e r bed d e c r e a s e s when dosages
less t h a n o r g r e a t e r t h a n t h e optimum d o s e a r e used .
C a t i o n i c p o l y e l e c t r o l y t e s have been shown t o p e r m i t
g r e a t e r f l u c t u a t i o n s i n t h e f i l t r a t i o n r a t e w i t h o u t danger o f
t u r b i d i t y b reak th rough and, i n g e n e r a l , t o p e r m i t t h e u s e of
h i g h e r f i l t r a t i o n r a t e s , e . g . , 1 0 gpm/ft2 ( 7 ) . F i l t r a t i o n
c y c l e o u t p u t i n one s t u d y ( 8 ) was d e c r e a s e d o n l y s l i g h t l y
by h i g h e r f i l t r a t i o n r a t e s when p o l y e l e c t r o l y t e s w e r e used .
Polymer c o a g u l a n t s have been shown t o p e r m i t t h e u s e o f l a r g e r
f i l t e r media g r a i n s ( 8 1 . T h i s was found t o d e c r e a s e t h e r a t e
of h e a d l o s s bu i ld -up , y e t e n a b l e d t h e maintenance o f an a c c e p t -
a b l e e f f l u e n t q u a l i t y .
Adin and Rebhun ( 8 ) have o b s e r v e d t h a t f i l t r a t i o n u s i n g
c a t i o n i c p o l y e l e c t r o l y t e s a s t h e s o l e c o a g u l a n t i s c h a r a c t e r -
i z e d by t h e f o r m a t i o n o f a r e l a t i v e l y narrow "working l a y e r "
w i t h i n t h e f i l t e r bed. The working l a y e r was o b s e r v e d t o
move down th rough t h e bed a t a r a t e which was a f u n c t i o n o f
t h e p o l y e l e c t r o l y t e c o n c e n t r a t i o n and t h e media g r a i n s i z e .
Above t h e working l a y e r t h e f i l t e r was e s s e n t i a l l y " s a t u r a t e d "
w i t h d e p o s i t and below it t h e f i l t e r was r e l a t i v e l y c l e a n .
When alum was used t h e working l a y e r was broad and p o o r l y de-
f i n e d and t ended t o move down th rough t h e bed r a p i d l y .
5
Polymer coagu lan t s i n comparison wi th hydro lyz ing s a l t
coagu lan t s r e s u l t i n less weight and volume of backwash
s ludge which must be handled and d i sposed o f . Sludge d i s -
p o s a l i s a c r i t i c a l problem i n wa te r t r e a t m e n t p r a c t i c e .
When t h e coagulan t used i s aluminum hydroxide, more than
5 0 p e r c e n t o f t h e s ludge by weight may be t h e hydroxide pre-
c i p i t a t e (11) . Dual media f i l t e r s , c o n s i s t i n g t y p i c a l l y o f a l a y e r of
a n t h r a c i t e c o a l on t o p of a l a y e r of sand , a r e advantageous
i n t h e d i r e c t f i l t r a t i o n process . The l a r g e r g r a i n c o a l
l a y e r f i l t e r s and stores p a r t i c l e s w i th less head los s p e r
u n i t o f d e p o s i t compared t o a s t r a t i f i e d s i n g l e media bed
which t e n d s , i n many c a s e s , t o form a compress ible l a y e r
of d e p o s i t on t o p o f t h e media. C r a f t ( 1 2 ) has r e p o r t e d
t h a t s i n g l e media sand f i l t e r beds a r e inadequa te f o r d i r e c t
2 f i l t r a t i o n us ing f i l t r a t i o n r a t e s of from 5 t o 7 gpm/ft . While t h e purpose of t h e cou r se a n t h r a c i t e l a y e r , i n a d u a l
media f i l t e r , i s p r i m a r i l y f o r d e p o s i t s t o r a g e , t h e lower,
s m a l l e r g r a i n s i z e , sand l a y e r i s e s s e n t i a l f o r t h e achieve-
ment of a l o w (c0.3 FTU) e f f l u e n t t u r b i d i t y .
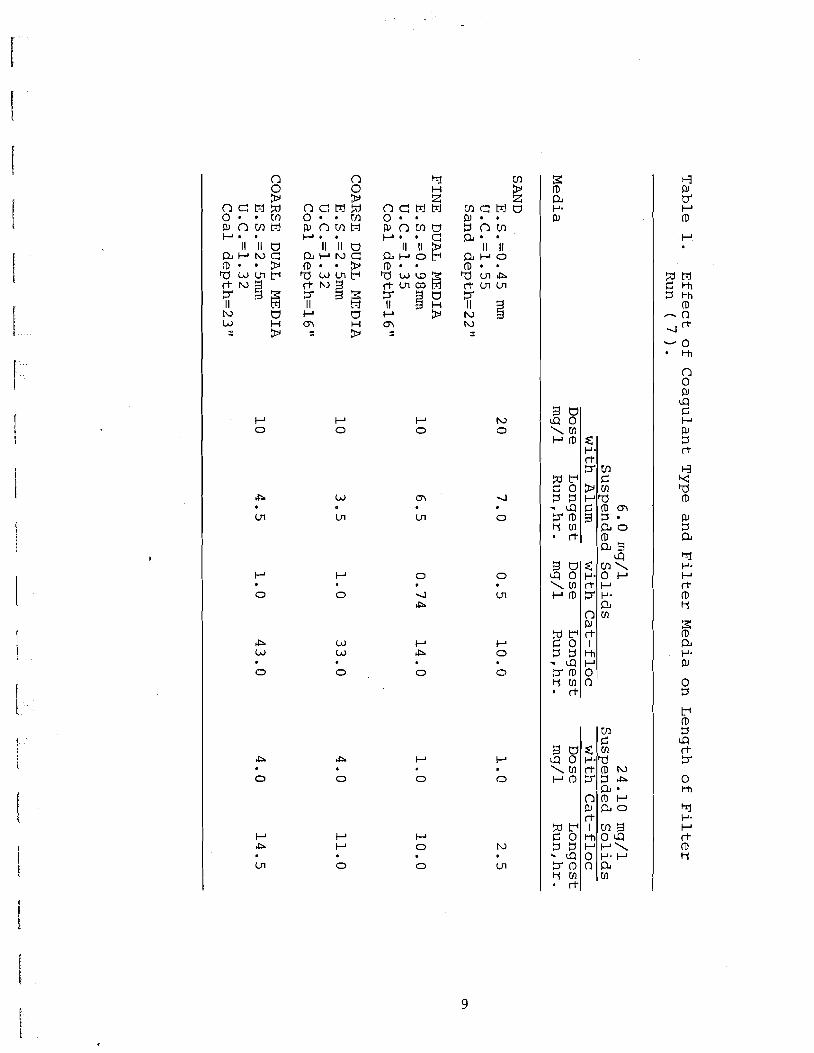
Shea, -- e t a l . ( 7 ) , conducted exper iments u s i n g f o u r
d i f f e r e n t p i l o t p l a n t f i l t e r beds and aluminum s u l f a t e and
a c a t i o n i c p o l y e l e c t r o l y t e a s s o l e coagu lan t s . A conven t iona l
sand f i l t e r and t h r e e dua l media beds , one w i t h a f i n e and two
wi th c o a r s e a n t h r a c i t e l a y e r s were s t u d i e d . A s shown i n Table 1,
t h e l o n g e s t f i l t e r runs were ob ta ined when t h e c a t i o n i c poly-
e l e c t r o l y t e and t h e c o a r s e a n t h r a c i t e l a y e r w e r e used. The
deeper c o a r s e a n t h r a c i t e l a y e r gave t h e l o n g e s t f i l t e r run ,
C] 8 P
n c m g o * * p lC3VlM P *
II II u a r w c ( D * P 2"; II M I-' m
u H
fl pl
5 n,
P
3 m C Ill 3 m
(D 0
.Ie -0 Ill
C3 0 pl 9 C P pl 3 rt
4 '.c 'd n,
pl 3 a ?I P * P (I- n, 11
E a P- pl
0 3
r n, 3 9 (I- 3-
0 Hl
?I P- P (I- n, w
' 7 j W W Y (I-ulcoh 3 Etu II 5 H I-' m
P - -
,+ulUI 3- d I N - -
N 0
4
0
0
ul
I-' 0
0
P . 0
N
ul
I-' 0
I-' 0
cn< 0 I-' I-'
0 I-' P* a II)
I-' 10.
0
I-' ,c.
UI
S (4 0 \cn r n ,
z r c o - a 3-n, w c n
rt
I-' P
0
U I r-'d (I-(D 3-3
nJ (I-
1
33 I - ' I - ' \ o n
cn C cn
N 10.
a * n o r a 0 v l ~ m 0 9 P - P a cn
43.0 hrs. This corresponds to a water production per filter
2 run of 7740 gal/ft . A terminal headloss of 72 inches of
2 water and a filtration rate of 3 gpm/ft were used during
the study. Shea, -- et al. ( 7 ) , also observed the filter run
length was inversely proportional to the influent suspended
solids concentration when the deposit was distributed within
the filter bed at run termination.
Hutchison and Foley ( 1 ) j.n reporting on full scale and
pilot plant experience with direct filtration in Canada noted
that the short filter runs which occurred during periods when
diatom densities increased above 1000/ml could be avoided by
the use of dual media filters in which the anthracite layer
had an effective size of 1.5 rnm. However, it was noted that
these filters required increased operator skill during low
diatom density periods in order to avoid turbidity breakthrough.
In the absence of diatoms overall filter performance was best
when the dual media filters contained 1.0-1.1 mm effective
size anthracite.
In summary, the literature contains a significant amount
of information on the direct filtration process. Its economic
advantages are apparent. The advantages of dual media filters
and cationic polyelectrolyte coagulants have been made apparent
by several studies. However, there is very little, if any,
information in the literature on the use of a short duration
prefiltration mixing step to aid in maximizing water production,
and maintaining an acceptable effluent turbidity. There are
apparently no mathematical relationships which can be used in
lieu of pilot plant studies for process design and optimization.
11. EXPERIMENTAL APPARATUS AND PROCEDURE
A. Labora to ry F i l t r a t i o n S t u d i e s : A c o n s t a n t r a t e d i r e c t
f i l t r a t i o n p i l o t p l a n t system was used i n t h i s s t u d y . The
a p p a r a t u s c o n s i s t e d o f f o u r major s e c t i o n s ; an i n f l u e n t raw
wa te r p r e p a r a t i o n and f e e d sys tem, a polymer f e e d sys tem, a
p r e f i l t r a t i o n mixing r e a c t o r , and an a n t h r a c i t e - s a n d dual-media
f i l t e r w i t h a f low r a t e c o n t r o l assembly. A schemat ic diagram
of t h e e n t i r e sys tem i s shown i n F i g u r e 1 .
The raw w a t e r suspens ion used th roughout t h i s s t udy con-
s i s t e d o f 4 4 mg/l b e n t o n i t e c l a y # and 22 mg/l o f k a o l i n c l a y f
i n Chicago t a p wa te r . The t u r b i d i t y of t h i s suspens ion was
32 FTU (Formazin T u r b i d i t y U n i t s ) . Th i s m ix tu re was chosen
a f t e r a j a r t e s t s t udy was conducted t o f i n d a mix tu re o f
c l a y s which resembled n a t u r a l suspensi .ons from Lake Michigan
i n t e r m s o f i t s response t o c o a g u l a t i o n w i t h c a t i o n i c polymers.
A m ix tu re w i t h a t u r b i d i t y o f 32 FTU was s e l e c t e d because a
s t a t i s t i c a l a n a l y s i s of o f f s h o r e i n t a k e wa te r t u r b i d i t i e s ( a t
Chicago ' s C e n t r a l Water F i l t r a t i o n P l a n t ) showed t h a t a
t u r b i d i t y o f 32 FTU is exceeded on ly abou t one p e r c e n t o f t h e
t i m e . The wate r t empera tu re th roughout t h i s s t udy was 1 8 O ~ + ~ O C .
The 250 g a l . raw wa te r su spens ions were mixed u s i n g f i l t e r e d com-
p r e s s e d a i r . The average c h a r a c t e r i s t i c s o f t h e Chicago t a p
wa te r used d u r i n g t h e l a b o r a t o r y phase o f t h e s t udy were:
a l k a l i n i t y - 108 mg/l a s CaC03; r e s i d u a l c h l o r i n e - 0.7 mq/l;
ha rdnes s - 137 mg/l a s CaC03; t u r b i d i t y - 0.15 JTU and pH - 8.3.
The c a t i o n i c p o l y e l e c t r o l y t e used th roughout t h e l a b o r a t o r y
f i l t r a t i o n s t u d y , Ca t - f l oc T # # , was pumped t o t h e " t e e " f i t t i n g
# F i s h e r S c i e n t i f i c Company, F a i r Lawn, M.S. *J.T. Baker Chemical Company, P h i l i p s b u r g , N . J . ##Calgon Corpo ra t i on , P i t t s b u r g h , Pa.
j u s t below t h e p r e f i l t r a t i o n mixing r e a c t o r u s i n g a p e r i s t a l t i c
a c t i o n pump. The polymer f e e d s o l u t i o n was p r epa red each day
u s ing polymer c o n c e n t r a t i o n s i n t h e range 0 . 0 2 t o 0 . 5 gm/l.
The f e e d s o l u t i o n c o n c e n t r a t i o n used depended on t h e PMR flow-
r a t e and t h e polymer c o n c e n t r a t i o n d e s i r e d i n t h e suspens ion .
A t t h e tee t h e f eed s o l u t i o n mixed w i th t h e i n f l u e n t su spens ion
which flowed by g r a v i t y t o t h i s p o i n t from t h e c o n s t a n t head
t a n k . The t o p o f t h e w e i r i n t h e c o n s t a n t head t ank was l o c a t e d
90 i n c h e s above t h e bottom o f t h e media compartment i n t h e
f i l t e r column. The range o f polymer c o n c e n t r a t i o n s used was
from 0.5 t o 10.0 mg/l.
The 8 . 5 l i t e r , p r e f i l t r a t i o n rr~ixi.ng r e a c t o r was used t o
p r o v i d e a , s h o r t p e r i o d o f f l o c c u l a t i o n f o r t h e po lymer - t r e a t ed
su spens ion . A d iagram o f t h e r e a c t o r i s shown i n F i g u r e 2
The f u l l y - b a f f l e d r e a c t o r con t a ined 4 t u r b i n e - t y p e i m p e l l e r s
which were mounted on a s i n g l e s h a f t . The r o t a t i o n a l speed
of t h e i m p e l l e r s cou ld be v a r i e d o v e r a broad r ange u s i n g an
e l e c t r o n i c c o n t r o l l e r connected t o t h e d r i v e motor. The mixing
i n t e n s i t y w i t h i n t h e r e a c t o r ( a s t h e r m s v e l o c i t y g r a d i e n t o r
G v a l u e ) was determined u s i n g n e t t o r q u e and s h a f t r o t a t i o n a l
speed measurements and t h e e q u a t i o n
where T i s t h e measured n e t t o r q u e on t h e i m p e l l e r s h a f t
(measured u s i n g a c a l i b r a t e d Servodyne motor c o n t r o l l e r ) ,
N i s t h e s h a f t r o t a t i o n a l speed , V i s t h e volume o f
f l u i d i n t h e r e a c t o r , g i s t h e a c c e l e r a t i o n o f g r a v i t y
and u i s t h e a b s o l u t e v i s c o s i t y . The c a l i b r a t i o n
cu rve o b t a i n e d , a s t h e G v a l u e v e r s u s t h e s h a f t r o t a t i o n a l
speed , i s shown i n F i g u r e 3 . The range o f G v a l u e s used
d u r i n g t h e s t u d y was from approx imate ly 0 t o 700 sec-l. The
average d e t e n t i o n t i m e i n t h e PMR was c o n t r o l l e d by was t i ng
p a r t o f t h e PMR e f f l u e n t th rough a r o tome te r and va lve .
Average PMR d e t e n t i o n t i m e s r a n g i n g from 2.0 t o 9.2 minu tes
w e r e used du r ing t h e s t udy .
The p l e x i g l a s f i l t e r column had a 3-inch i n n e r d i a m e t e r ,
and c o n t a i n e d 1 8 i n c h e s o f a n t h r a c i t e c o a l o v e r s i x i n c h e s
o f s i l i c a sand. Manometer t a p s w e r e i n s t a l l e d 4 i n c h e s a p a r t
a l ong t h e e n t i r e column a s shown i n F i g u r e 4 . The f low r a t e
th rough t h e f i l t e r bed was c o n t r o l l e d by pumping a t a c o n s t a n t
r a t e from an e f f l u e n t c o l l e c t i o n t a n k equipped w i t h a f l o a t
va lve . The f i l t r a t i o n r a t e s used i n t h e s t u d y ranged from
2 2.5 t o 7.5 gpm/ft .
During t h e l a b o r a t o r y f i l t r a t i o n s t u d y t h r e e d i f f e r e n t
f i l t e r beds w e r e used. Each had a d i f f e r e n t a n t h r a c i t e media
s i z e d i s t r i b u t i o n . The a n t h r a c i t e e f f e c t i v e s i z e s o f f i l t e r
beds numbered 1, 2 and 3 were, r e s p e c t i v e l y , 0.94 mm, 1 .20 mm
and 1 . 7 1 mm. The un i fo rmi ty c o e f f i c i e n t s w e r e 1 . 6 5 , 1.60 and
1 .16, r e s p e c t i v e l y . The t o t a l a n t h r a c i t e we igh t i n e ach bed
was approx imate ly 1750 grams. The sand media s i z e d i s t r i b u t i o n
was t h e same i n each f i l t e r bed , and had an e f f e c t i v e s i z e o f
0.45 mm and a u n i f o r m i t y c o e f f i c i e n t o f 1 .40. The t o t a l sand
weigh t i n each bed was approx imate ly 1100 grams. Graphs o f
t h e media s i z e d i s t r i b u t i o n s o b t a i n e d by s i e v e a n a l y s i s a r e shown
i n F i g u r e 5,. The a n t h r a c i t e i n Bed 1 was o b t a i n e d d i r e c t l y
7 0 40 60 80 100 200 400
IMPELLER ROTATIONAL SPEED (rpm)
F i g u r e 3 . G v a l u e v e r s u s I m p e l l e r R o t a t i o n a l Speed
Glass
-1 b,, backwash effluent - water
Figure 4. Schematic Diagram of the Filter Assembly
(-) BZIS NIQ83 QIUZJ<
0 - T
from a well-mixed ba.g of P h i l t e r k o l No. 1. The c o a l was back-
washed b e f o r e t h e f i r s t exper iment t o remove d u s t and. f i n e s .
The s i e v e a n a l y s i s was made a f t e r t h e f i l t r a t i o n exper iments
had been comple ted .
The p r e p a r a t i o n o f t h e f i l t e r bed f o r a f i l t e r run i n v o l v -
ed backwashing a t a 30 t o 4 0 p e r c e n t bed expans ion u n t i l t h e
c l e a n bed h e a d l o s s was reduced t o a c o n s t a n t b a s e l e v e l f o r
t h e s p e c i f i c bed and f i l t r a t i o n r a t e used . A f t e r backwashing,
t h e media g r a i n s were a l lowed t o s e t t l e s l o w l y back down i n t o
t h e column by g r a d u a l l y r e d u c i n g t h e backwash f low r a t e o v e r
a p e r i o d of a b o u t 1 . 5 minu tes . The column was t h e n t a p p e d
l i g h t l y i n o r d e r t o compact t h e bed t o a c o n s t a n t d e p t h o f
24 i n c h e s . The w a t e r r e q u i r e d p e r backwash was a p p r o x i m a t e l y
2 250 g a l / f t , i . e . , 25 gpm/ft2 f o r rough ly 1 0 minu tes .
Layer-by- layer h e a d l o s s and column e f f l u e n t t u r b i d i t y were
measured and r e c o r d e d a t r e g u l a r and f r e q u e n t i n t e r v a l s d u r i n g
each f i l t e r run . The e f f l u e n t t u r b i d i t y was moni to red u s i n g a
Hach ~ u r b i d i m e t e r , model 2100 A and i s r e c o r d e d a s FTU, ~ o r m a z i n
T u r b i d i t y U n i t s . The s u s p e n s i o n l e a v i n g t h e mixing r e a c t o r was
sampled p e r i o d i c a l l y and t h e z e t a p o t e n t i a l o f t h e p a r t i c l e s
was de te rmined u s i n g a z e t a meter ( Z e t a Meter, I n c . ) . The pro-
c e d u r e recommended by t h e m a n u f a c t u r e r was used . The ZP measure-
ments w e r e c o r r e c t e d t o 2 2 . 5 O ~ . Runs were g e n e r a l l y t e r m i n a t e d
when e i t h e r t h e t o t a l h e a d l o s s a c r o s s t h e bed r e a c h 86 i n c h e s
o f w a t e r o r t u r b i d i t y b reak th rough o c c u r r e d .
B. F r e l i m i n a r y F i l t r a t i o n S t u d i e s : A s ix-month p r e l i m i n a r y
s t u d y was conduc ted u s i n g p i l o t f i l t e r s a t t h e C e n t r a l Water
F i l t r a t i o n P l a n t i n Chicago t o e v a l u a t e a nunber o f c a t i o n i c
p o l y e l e c t r o l y t e s f o r use i n t h e d i r e c t f i l t r a t i o n p roces s
and t o determine i f and how p a r t i c l e z e t a - p o t e n t i a l measure-
ments can be used t o determine t h e c a t i o n i c p o l y e l e c t r o l y t e
c o n c e n t r a t i o n t h a t is necessary f o r e f f e c t i v e o p e r a t i o n of
t h e d i r e c t f i l t r a t i o n process .
The p i l o t f i l t e r s used c o n s i s t e d o f 2.75 inch I . D .
p l e x i g l a s columns f i l l e d w i th 26 inches of f i l t e r sand w i t h
an e f f e c t i v e s i z e of 0.67 mi and a un i fo rmi ty c o e f f i c i e n t
of 1 . 4 . Each f i l t e r was equipped wi th a p r e s s u r e gauge f o r
measuring head loss a c r o s s t h e e n t i r e f i l t e r bed and a
ro tometer and va lve on t h e e f f l u e n t l i n e f o r manual flow con-
t r o l . The i n f l u e n t t o t h e f i l t e r s was raw water from Lake
Michigan c o n t a i n i n g 8 t o 13 l b . of c h l o r i n e p e r m i l l i o n
gal- lons. A f i l t r a t i o n r a t e of 2 gpm/ft2 was used i n a l l
exper iments . Each f i l t r a t i o n experiment was conducted f o r
6.5 hours .
Four c a t i o n i c p o l y e l e c t r o l y t e s (polymers) were used du r ing
t h e p re l imina ry s tudy . Each accord ing t o t h e manufac ture rs , i s
r e s i s t a n t t o adverse e f f e c t s from c h l o r i n e r e s i d u a l s and i s
approved f o r use i n d r i n k i n g wate r . The polymers s t u d i e d a r e :
Cat-Floc T (Polymer A ) - Calgon Corpora t ion
Nalco ly te 607 (Polymer B) - Nalco Chemical Co.
Na lco ly t e 8101 (Polymer C ) - Nalco Chemical Co.
Magnifloc 570-C (Polymer D ) - Cyanamid Chemical Co.
These polymers were chosen because p rev ious t e s t s conducted
us ing Lake Michigan wate r and approximately t e n polymers i n d i c a t -
ed t h a t t h e s e f o u r were among t h e more e f f e c t i v e polymers f o r
turbidity removal by flocculation and sedimentation (13).
During the study the polymer concentration in the filter in-
fluent was varied in the range 1 to 25 mg/l. The polymer feed
solution was mixed with the raw water at the elbow through
which the raw water flowed as it entered the column. The flow
time between the elbow and the top of the filter bed was
approximately 15 minutes.
During the study the influent turbidity varied from 0.4 to
35 FTU, however, most of the time the turbidity was less than
10 FTU. Influent and effluent turbidity measurements were made
using a Hach turbidimeter, Model 2100 A.
All particle zeta potential determinations were conducted
in the laboratory immediately after a filtration run had been
completed. Measured volumes of the polymer feed solution were
pipetted to aliquots of a raw water sample to give the desired
range of polymer concentrations. After the addition of the
polymer and two minutes of mixing on a magnetic stirrer a part .
of the treated aliquot was poured into the electrophoresis
cell and the mobility of ten particles was measured. The manual
supplied by the zeta meter manufacturer was used to determine
particle zeta potentials. All zeta potential values re-
ported are for 2 2 . 5 ~ ~ ~ . A complete description of the apparatus
and methodology are included in Tanner's thesis (14).
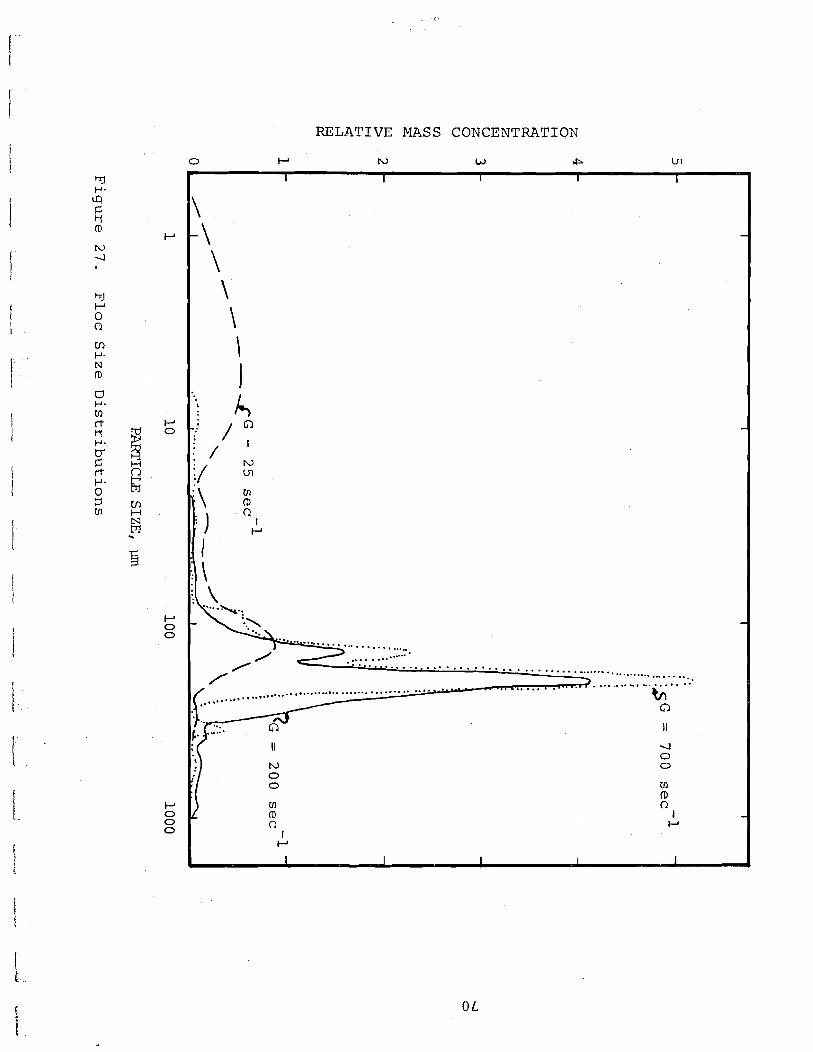
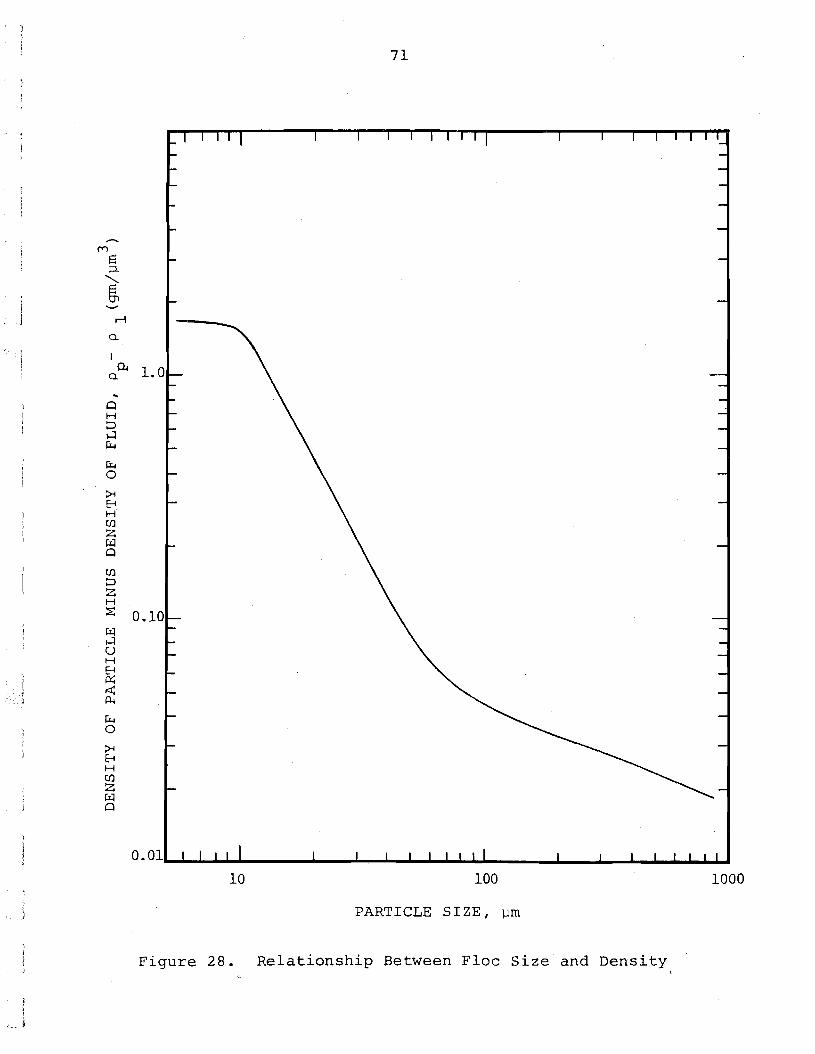
C. Floc Size Distribution and Density Determinations: A
supplementary study was conducted to determine the effect of
the prefiltration mixing intensity on the size and density dis-
tribution of flocs which were applied to the filter. This type
of information is needed to explain the effect of the pre-
treatment step on the filter operation.
The floc size and density distributions were determined
using a somewhat unique settling column analysis. The
flocs were formed in a 500 ml sample bottle which was inserted
in the light path of a 15O forward scatter nephelometer manu-
factured by Monitor Technology, Inc. (Monitek Model 250). The
Monitek unit projects a highly collimated light beam through
the sample bottle at a depth of 5.5 cm below the liquid sur-
face. After the flocculated suspension was inserted in the
instrument the scattered light intensity was measured as a
function of time. This data was then used in conjunction with
the depth of the light beam to determine a cumulative floc settl-
inq velocity distribution. Several separate flocculation experi-
ments were conducted using the same conditions to obtain the
relationship between floc size and settling velocity. In-
dividual flocs were captured using a large bore eyedropper
and inserted in a small settling column containing suspension
supernatant. After the settling velocity was measured the
floc was retrieved and its size was measured using a microscope
equipped with an ocular micrometer. Approximately one hundred
size - settling velocity determinations were made using this
method. The density of each floc was determined using the
measured size and settling velocity and the Stoke's Law equation.
The conditions used during these supplementary experiments were
selected to correspond to some of the conditions used in the
filtration experiments. These conditions were: flocculation
period - 4 minutes; Cat-Floc T concentration - 1.5 mg/l, G values of 25, 200 and 700 sec-I and the clay mixture which
was used in the laboratory filtration experiments. A com-
plete description of the apparatus and methodology is con-
tained in Kulprapha's thesis (15).
21
111. RESULTS AND DISCUSSION
A. P r e l i m i n a r y F i l t r a t i o n Skud ies : The purpose o f t h e
p r e l i m i n a r y s t u d y was t o e v a l u a t e a number o f c a t i o n i c poly-
e l e c t r o l y t e s f o r u s e i n t h e d i r e c t f i l t r a t i o n p r o c e s s and t o
d e t e r m i n e i f and how p a r t i c l e z e t a p o t e n t i a l measurements
can be used t o d e t e r m i n e t h e c a t i o n i c p o l y e l e c t r o l y t e concen-
t r a t i o n t h a t i s n e c e s s a r y f o r e f f e c t i v e o p e r a t i o n o f t h e
d i r e c t f i l t r a t i o n p r o c e s s .
The e f f l u e n t t u r b i d i t y was found t o b e a f u n c t i o n o f
t i m e and t h e polymer c o n c e n t r a t i o n . The t y p e o f polymer
had a n a l m o s t n e g l i g i b l e e f fec t on e f f l u e n t t u r b i d i t y .
F i g u r e 6 i l l u s t r a t e s t h e e f f e c t o f polymer c o n c e n t r a t i o n
and l e n g t h o f t h e f i l t e r r u n on e f f l u e n t t u r b i d i t y f o r polymers
A and D. Graphs s i m i l a r i n form were o b t a i n e d f o r polymers B
and C. Note i n F i g u r e 6 (polymer A) t h a t i n c r e a s i n g t h e polymer
c o n c e n t r a t i o n from 1 . 9 t o 5.0 mg/l d e c r e a s e s t h e l e n g t h of t i m e
r e q u i r e d f o r t h e e f f l u e n t t u r b i d i t y t o r e a c h o r s t a r t t o
approach a c o n s t a n t minimum v a l u e . T h i s l e n g t h o f t i m e i s
known a s t h e r i p e n i n g p e r i o d . The minimum e f f l u e n t t u r b i d i t y
reached also decreases a s t h e polymer c o n c e n t r a t i o n i s i n c r e a s e d
i n t h i s r ange . When t h e c o n c e n t r a t i o n o f polymer A was i n c r e a s -
e d t o 12 .5 mg/l t h e e f f l u e n t t u r b i d i t y i n c r e a s e d w i t h t i m e dur -
i n g t h e r u n . T h i s same g e n e r a l b e h a v i o r was o b s e r v e d when t h e
o t h e r polymers w e r e used . These r e s u l t s a g r e e w i t h H a b i b i a n ' s ( 9 )
o b s e r v a t i o n t h a t t h e r e i s ( w i t h r e s p e c t t o e f f l u e n t t u r b i d i t y )
an optimum polymer dose .
T a b l e 2 shows t h e e f f l u e n t t u r b i d i t i e s measured a t 6 .5
h o u r s f o r a r ange o f i n f l u e n t t u r b i d i t i e s and a 5.0 mg/l
c o n c e n t r a t i o n o f polymer A. Note t h a t t h e e f f l u e n t i n a l l
r uns was approx imate ly 0.07 FTU. The run r e p o r t e d f o r an
i n f l u e n t t u r b i d i t y o f 35 FTU was t e r m i n a t e d a t 2.5 hours
due t o t h e e x c e s s i v e h e a d l o s s which developed, however, t h e
e f f l u e n t t u r b i d i t y a t t h i s p o i n t was c o n t i n u i n g t o d e c r e a s e
w i t h t i m e .
F i g u r e 7 c o n t a i n s g r aphs o f t h e e f f l u e n t t u r b i d i t y a t
6.5 hours o f f i l t r a t i o n and t h e p a r t i c l e z e t a p o t e n t i a l
v e r s u s t h e polymer c o n c e n t r a t i o n . The i n f l u e n t t u r b i d i t y
d u r i n g t h e r u n s used t o o b t a i n t h e d a t a p l o t t e d i n t h e s e
g r aphs was approx imate ly 2 FTU. F i g u r e 7 was used t o de-
t e rmine t h e optimum dosage and t h e e f f e c t i v e dosage range
f o r e ach o f t h e f o u r polymers. The optimum dosage i s d e f i n e d
a s t h e polymer c o n c e n t r a t i o n which minimizes t h e e f f l u e n t
t u r b i d i t y a t 6 .5 hours . A s shown i n ~ i g u r e 6 t h e u s e o f t h e
optimum dosage a l s o minimizes t h e l e n g t h o f t h e r i p e n i n g
p e r i o d . The e f f e c t i v e dosage range i s d e f i n e d a s t h e range
o f polymer c o n c e n t r a t i o n s which r e s u l t s i n an e f f l u e n t t u r - I
b i d i t y a t 6 .5 hours o f f i l t r a t i o n o f 0.3 FTU o r less. Tab le 3 I l i s t s t h e e f f e c t i v e dosage r a n g e s , optimum dosages and cor respond-
1 i n g p a r t i c l e d e t a p o t e n t i a l s f o r a l l f o u r polymers and an i n - ]
f l u e n t t u r b i d i t y o f approx imate ly 2 FTU. Note t h a t w h i l e t h e
e f f e c t i v e dosage ranges and optimum dosages a r e s i g n i f i c a n t l y
d i f f e r e n t , t h e co r r e spond ing p a r t i c l e z e t a p o t e n t i a l s a r e I s i m i l a r . The e f f e c t i v e dosage r ange co r r e sponds t o z e t a p o t e n t i a l s
1 from -6 t o approx imate ly 26 mv and t h e optimum dosage co r r e sponds 3
t o a z e t a p o t e n t i a l o f approx imate ly 13 mv. T h i s cor respondence
was independen t o f i n f l u e n t t u r b i d i t y i n t h e r ange o f 0 . 5 t o 10 FTU.
uorael~ua3uo3 lad~od 30 uoyaaund v se IuyJuaJod eJaZ pue d~ypyqln~ JuanIjjg 'L alnSyd
Table 3. Effective and Optimum Polymer Concentrations and Corresponsing Particle Zeta Potentials.
Effective Range Polymer Conc., Zeta Potential
Optimum Polymer Conc., Zeta Potential
Polymer mg/l mv mg/ 1 mv
Table 4. Polymer Concentrations Required to Achieve a Zero Zeta Potential for High and Low Influent Turbidities.
Polymer Polymer Concentration at a Zeta Potential of Zero, mg/l
However, t h e polymer dose r e q u i r e d t o g i v e a c e r t a i n p a r t i c l e
z e t a p o t e n t i a l was a - f u n c t i o n of t h e i n f l u e n t t u r b i d i t y .
F igure 8 shows t h e e f f e c t o f i n f l u e n t t u r b i d i t y on t h e
ZP o f t h e p a r t i c l e s a t a g iven polymer c o n c e n t r a t i o n f o r
polymers A and C. Note t h a t i f t h e polymer c o n c e n t r a t i o n i s
n o t v a r i e d t o account f o r changes i n i n f l u e n t t u r b i d i t y , t h e
z e t a p o t e n t i a l dec reases approximately 3 t o 8 mv a s t h e i n -
f l u e n t t u r b i d i t y i n c r e a s e s from 1 t o 35 FTU. This dec rease
i s roughly 25 pe rcen t o f t h e 32 mv span of z e t a p o t e n t i a l s
corresponding t o t h e e f f e c t i v e dosage range. This sugges t s
t h a t dosage c o n t r o l i s n o t c r i t i c a l w i th r e s p e c t t o e f f l u e n t
t u r b i d i t y i f a z e t a p o t e n t i a l nea r t h e middle of t h i s
e f f e c t i v e range, f o r example, 13 mv, i s used a s a c o n t r o l
p o i n t . Table 4 shows t h e e f f e c t o f an i n c r e a s e i n i n f l u e n t
t u r b i d i t y from 1 t o 35 FTU on t h e polymer dosage r equ i r ed t o
g i v e a ze ro p a r t i c l e z e t a p o t e n t i a l f o r each of t h e fou r
polymers s t u d i e d . Polymer A r e q u i r e d t h e l a r g e s t i n c r e a s e
of 1 .5 mg/l.
The r a t e o f head loss bui ld-up a c r o s s t h e f i l t e r bed
du r ing t h e course of t h e run was found t o be a f u n c t i o n of t h e
t ype and dosage of polymer and t h e i n f l u e n t t u r b i d i t y . For a
g iven i n f l u e n t t u r b i d i t y t h e polymer dosage which minimized
t h e e f f l u e n t t u r b i d i t y maximized t h e r a t e of head los s build-up.
F igure 9 shows t h e e f f e c t of t h e polymer c o n c e n t r a t i o n (polymer
D ) on head loss a c r o s s t h e f i l t e r bed a s a f u n c t i o n t ime . The
i n f l u e n t t u r b i d i t y was approximately 1 . 5 FTU. Note t h a t t h e
t h r e e polymer dosages used , 1 . 7 , 3.6 and 6 mg/l r e s u l t e d , i n
t h i s c a s e , i n p a r t i c l e z e t a p o t e n t i a l s of -6, 0 and 13 mv
- 5 0 5 10 15 2 0 25
ZETA POTENTIAL (mv)
Figure 8. Effect of Influent Turbidity on Particle Zeta Potential for a Given Polymer Concentration
Figure 9 . E f f e c t of Polymer Concent ra t ion on t h e Headloss ve r sus Time Re la t ionsh ip f o r Polymer D
30
r e s p e c t i v e l y . A l l t h r e e dosages a r e w i t h i n t h e e f f e c t i v e
r ange , however, t h e head los s a t 6.5 hours f i l t r a t i o n f o r t h e
dosage c l o s e s t t o t h e optimum dosage (Curve A ) i s n e a r l y
s i x t i m e s a s h igh as t h e h e a d l o s s f o r a polymer dosage o f
1 .7 mg/l, Curve C. S i m i l a r behav ior was observed f o r t h e o t h e r
polymers. Apparen t ly it i s advantageous , from t h e s t a n d p o i n t
of minimizing head los s development, t o use t h e l owes t p o s s i b l e
polymer dosage i n t h e e f f e c t i v e range . However, t h i s advantage
must be compared w i t h t h e d i s advan t ages o f h i g h e r e f f l u e n t
t u r b i d i t i e s and. l o n g e r r i p e n i n g p e r i o d s which would a l s o r e s u l t
from such a c h o i c e (see F igu re 6 ) .
F i g u r e 10 shows t h e e f f e c t o f polymer t y p e on t h e r a t e o f
head lo s s bui ld-up. For t h i s g raph t h e i n f l u e n t t u r b i d i t y was
i n t h e range 1 . 5 t o 3.6 FTU. For each polymer t y p e t h e dosage
used r e s u l t e d i n a p a r t i c l e z e t a p o t e n t i a l o f approximate ly
0 mv. According t o Table 4 and F i g u r e 10 t h e polymers which
r e q u i r e d t h e h i g h e r c o n c e n t r a t i o n s t o r each a z e r o z e t a p o t e n t i a l .
a l s o developed t h e h i g h e r head los s . The polymers which r e s u l t e d
i n t h e h i g h e r head los s bui ld-up a l s o w e r e t h e polymers which
caused a f i l t e r cake t o form i n and on t h e upper i n c h e s o f
sand . Polymer A appeared t o have t h e l e a s t tendency t o form a
f i l t e r s ake . E f f l u e n t t u r b i d i t y was lower f o r polymer A t h a n
f o r t h e o t h e r t h r e e polymers y e t t h e head los s bu i ld -up was less
f o r polymer A s u g g e s t i n g t h a t t h e e f f e c t o f t h e n a t u r e o f t h e
polymer on head los s bui ld-up i s g r e a t e r t h a n t h e e f f e c t o f t h e
removal e f f i c i e n c y d i s c u s s e d p r e v i o u s l y .
F i g u r e 11 i l l u s t r a t e s t h e e f f e c t o f t h e i n f l u e n t t u r b i d i t y
on t h e head los s a t 6.5 hours o f f i l t r a t i o n u s i n g a 5 mg/l
INFLUENT EFFLUENT TURBIDITY TURBIDITY
1.5 - 1.8 0.16-0.33
1.5 - 2.1 0.11-0.22
1.4 - 2.0 0.10-0.34
2.6 - 3.6 0.08-0.18
0 L 2 3 4 5 6
TIME ( h o u r s )
Figure 10. Effect of Polymer Type on Headloss versus Time Relationship for a Zero Particle Zeta Potential
2 4 6 8 10
INFLUENT TURBIDITY (FW )
Figu re 11. Headloss a t 6 .5 Hours as a Funct ion of I n f l u e n t T u r b i d i t y - 5 mg/l Polymer A
concentration of polymer A. The particle zeta potential was
approximately 7 mv for all data points. When the influent
turbidity was 3 5 FTU the headloss reached 8.6 feet in 2 . 5 hours
and the run had to be terminated. This run illustrates the
shortcomings of a single media filter for the direct filtration
of high turbidity water. Dual or multi-media filters have
been shown to be more practicable for high influent turbidities.
Using these preliminary results the major effort of this
study was then directed toward determining how a pretreatment
step could be used to maximize the performance and efficiency -
of a dual-media filter, direct filtration system when the sole
coagulant was a cationic polyelectrolyte. Cat-Floc T was
chosen for study as a result of these preliminary experiments.
B. General Results - Laboratory Filtration Study: During
this part of the study 147 experimental filtration runs were
conducted using the ranges of pretreatment and filter operating
conditions described previously in Section 11-A. All experi-
ments were conducted using the cationic polyelectrolyte Cat-Floc T
except for several experiments in which Nalco 607 was used. The
kaolin/bentonite clay suspension described in Section 11-A was
used in all experiments. A list of the experimental conditions
used for each filtration run is contained in Appendix A. During
each experiment effluent turbidity and headloss across four-inch
layers of the filter bed were measured as a function of the
volume of water filtered per unit area of bed. Each experiment
was continued until the overall headloss reached the terminal
value (usually 86 inches of water) and/or turbidity breakthrough
occurred. To determine the approximate reproducibility of the
34
exper iments one experiment was r epea t ed 1 4 t i m e s du r ing t h e
r e s e a r c h per iod . The p re t r ea tmen t and f i l t e r o p e r a t i n g con-
d i t i o n s used f o r t h e s e exper iments were: polymer concent ra -
t i o n , PC = 3.0 mg/l, p r e f i l t r a t i o n mixing i n t e n s i t y a s t h e
G v a l u e , G = 25 s e c - l , mean d e t e n t i o n t ime i n t h e p r e f i l t r a -
- 2 t i o n r e a c t o r , T = 4 minutes , f i l t r a t i o n ra te , FR = 6 gpm/ft ,
t e rmina l head los s , AH = 30 inches of wate r and f i l t e r bed 2 .
The mean va lue o f t h e wate r p roduc t ion , ~ 3 0 , ( t h e s u b s c r i p t
deno te s t h e t e r m i n a l head los s ) f o r t h e 1 4 exper iments was
2 3 3 3 g a l / f t . The 95 pe rcen t conf idence i n t e r v a l was + 13 q a l / f t
2 -
2 Qr + - 4 p e r c e n t and t h e range was 305 t o 378 g a l / f t . The mean
2 e f f l u e n t t u r b i d i t y a t 300 g a l / f t was 0.04 FTU and t h e range
was 0.03 t o 0.05 FTU.
F igure 1 2 c o n t a i n s p l o t s of e f f l u e n t t u r b i d i t y v e r s u s t h e
volume of wa te r f i l t e r e d p e r u n i t a r e a of bed f o r two s e t s
-1 of p re t r ea tmen t c o n d i t i o n s . I n t h e c a s e o f G = 700 s e c ,
t u r b i d i t y breakthrough occur red . This i s i n d i c a t e d by t h e
ab rup t i n c r e a s e i n e f f l u e n t t u r b i d i t y a t approximately 1200 g a l /
2 -1 f t f i l t e r e d . I n t h e o t h e r c a s e , G = 25 s e c , t h e run con-
t i n u e d u n t i l t h e t e r m i n a l head loss o f 86 inches was reached.
Note t h a t i n both c a s e s t h e e f f l u e n t t u r b i d i t y decreased du r ing
t h e r i p e n i n g pe r iod t o a va lue o f approximately 0.05 FTU and
remained a t t h i s l e v e l u n t i l run t e r m i n a t i o n . Th i s gene ra l
f e a t u r e was observed i n a l l exper iments . Within a range of
polymer c o n c e n t r a t i o n s t h e e f f l u e n t t u r b i d i t y was independent
of t h e o t h e r p re t r ea tmen t and t h e f i l t e r o p e r a t i n g c o n d i t i o n s
i n c l u d i n g t h e a n t h r a c i t e media g r a i n s i z e d i s t r i b u t i . o n . Th i s
i s a p p a r e n t l y t h e r e s u l t of t h e p o l i s h i n g a c t i o n of t h e sand
i 7 m m I-' C ID 3 rt
-3 P- I-' R t'D 1 ID a
n 09 P, I-' 1 m rt N
w
E F F L U E N T T U R B I D I T Y ( F T U )
l a y e r ( t h e s i z e d i s t r i b u t i o n o f which was t h e same i n a l l
expe r imen t s ) and t h e h i g h f i l t r a t i o n e f f i c i e n c y ach ieved
i n t h i s r ange o f polymer c o n c e n t r a t i o n s .
F i g u r e 13a shows t h e mean e f f l u e n t t u r b i d i t y o b t a i n e d f o r
t h e t h r e e f i l t e r beds a t 337 g a l / f t 2 f i l t e r e d p l o t t e d v e r s u s
t h e polymer c o n c e n t r a t i o n . The r ange o f t u r b i d i t y v a l u e s a t
each polymer c o n c e n t r a t i o n was w i t h i n + 0.01 FTU. T h i s i s - w i t h i n t.he r e p e a t a b i l i t y range o f t h e i n s t rumen t used f o r
t u r b i d i t y neasurements . Note t h a t polymer c o n c e n t r a t i o n s
between abou t 1 . 5 and 5 mg/l e s s e n t i a l l y minimized t h e e f f l u e n t
t u r b i d i t y a t 337 g a l / f t 2 f i l t e r e d . F i g u r e 13b shows t h a t t h i s
range o f polymer c o n c e n t r a t i o n s co r r e sponds t o p a r t i c l e z e t a
p o t e n t i a l s i n t h e range -5 t o + 12 mv. I n t h e p r e l i m i n a r y
f i l t r a t i o n s t u d i e s , when Cat-Floc T was used f o r t h e d i r e c t
f i l t r a t i o n o f n a t u r a l su spens ions from Lake Michigan, p a r t i c l e
z e t a p o t e n t i a l s i n t h e range from -4 t o 1 3 mv cor responded t o
an i n t e r v a l o f minimum e f f l u e n t t u r b i d i t y (see F i g u r e 7 ) . The
r e s u l t s o f t h e p r e l i m i n a r y and l a b o r a t o r y s t u d i e s a r e i n agree -
men t . The e f f e c t t h e polymer c o n c e n t r a t i o n ha s on t h e e f f l u e n t
t u r b i d i t y r e s u l t s from two f a c t o r s , t h e f l o c fo rma t ion which
o c c u r s i n t h e p r e f i l t r a t i o n f l o c c u l a t i o n reac to ' r and t h e f l o c
t o f i l t e r g r a i n (or d e p o s i t ) c o l l i s i o n e f f i c i e n c y . The r a t e o f
f l o c c u l a t i o n i n t h e p r e f i l t r a t i o n r e a c t o r i s a maximum a t a
z e r o p a r t i c l e z e t a p o t e n t i a l ( 1 6 ) . According t o Yao, -- e t a l . , (1711
t h e f i l t r a t i o n e f f i c i e n c y i n c r e a s e s a s t h e p a r t i c l e s i z e
i n c r e a s e s above approx imate ly 1 um. The re fo r e ; a n i n c r e a s e d
*Calculated using Sakthivadivels eq. and dynamic programming. **Calculated using Eq. 7.
* where WPAH i s t h e maximum w a t e r p roduc t i on p e r f i l t e r r un
f o r an o v e r a l l t e r m i n a l headl-oss , A H . The l a y e r by l a y e r
h e a d l o s s e s cor responding t o t h e optimum s p e c i f i c d e p o s i t
d i s t r i b u t i o n c a l c u l a t e d by t h i s s i m p l i f i e d p rocedu re a r e i n -
c l u6ed i n Tab le 5 . These v a l u e s a r e n o t s i g n i f i c a n t l y
d - i f f e r e n t from t h o s e c a l c u l a t e d by t h e f i r s t method.
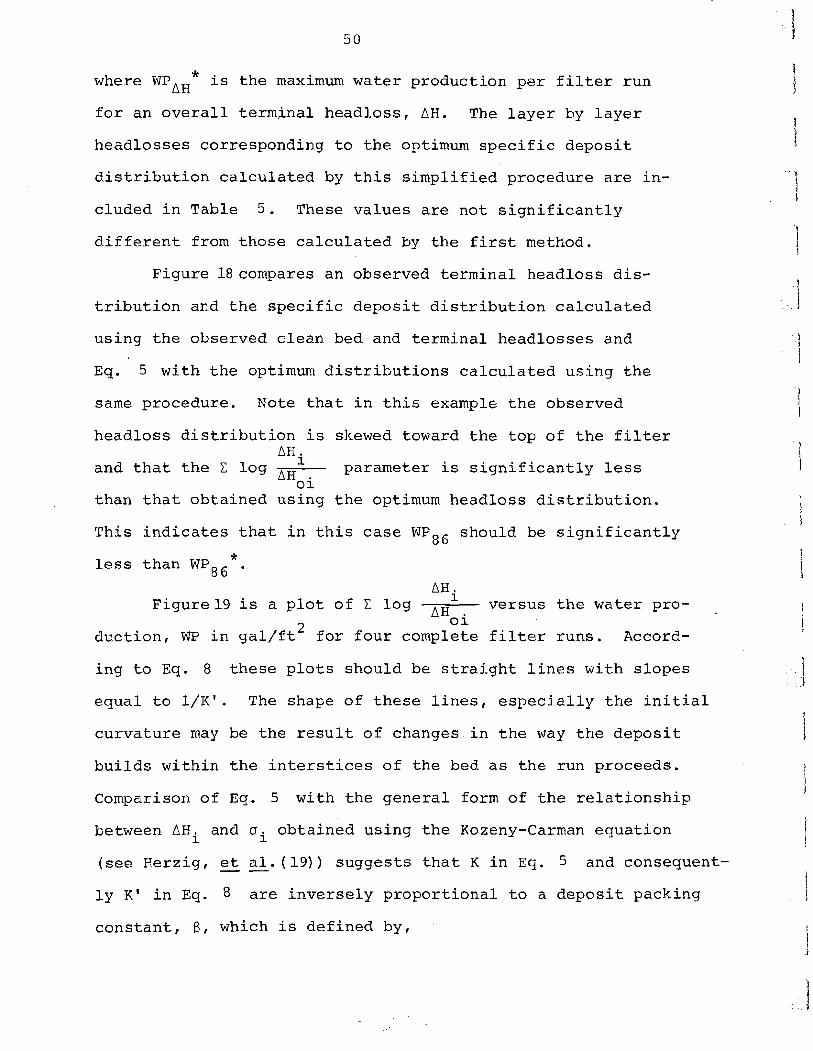
F igu re 18compares an observed t e r m i n a l h e a d l o s s d i s -
t r i b u t i o n and t h e s p e c i f i c d e p o s i t d i s t r i b u t i o n c a l c u l a t e d
u s i n g t h e obse rved c l e a n bed and t e r m i n a l h e a d l o s s e s a.nd
Eq. 5 w i t h t h e optimum d i s t r i b u t i o n s c a l c u l a t e d u s i n g t h e
same procedure . Note t h a t i n t h i s example t h e obse rved
hea-dloss d i s t r i b u t i o n i s skewed toward t h e t o p o f t h e f i l t e r a s .
and t h a t t h e C l o g pa ramete r i s s i g n i f i c a n t l y less A H o i
t h a n t h a t o b t a i n e d u s i n g t h e optimum h e a d l o s s d i s t r i b u t i o n .
T h i s i n d i c a t e s t h a t i n t h i s c a s e WEB6 shou ld be s i g n i f i c a n t l y
* less t h a n WP86 .
AH, I
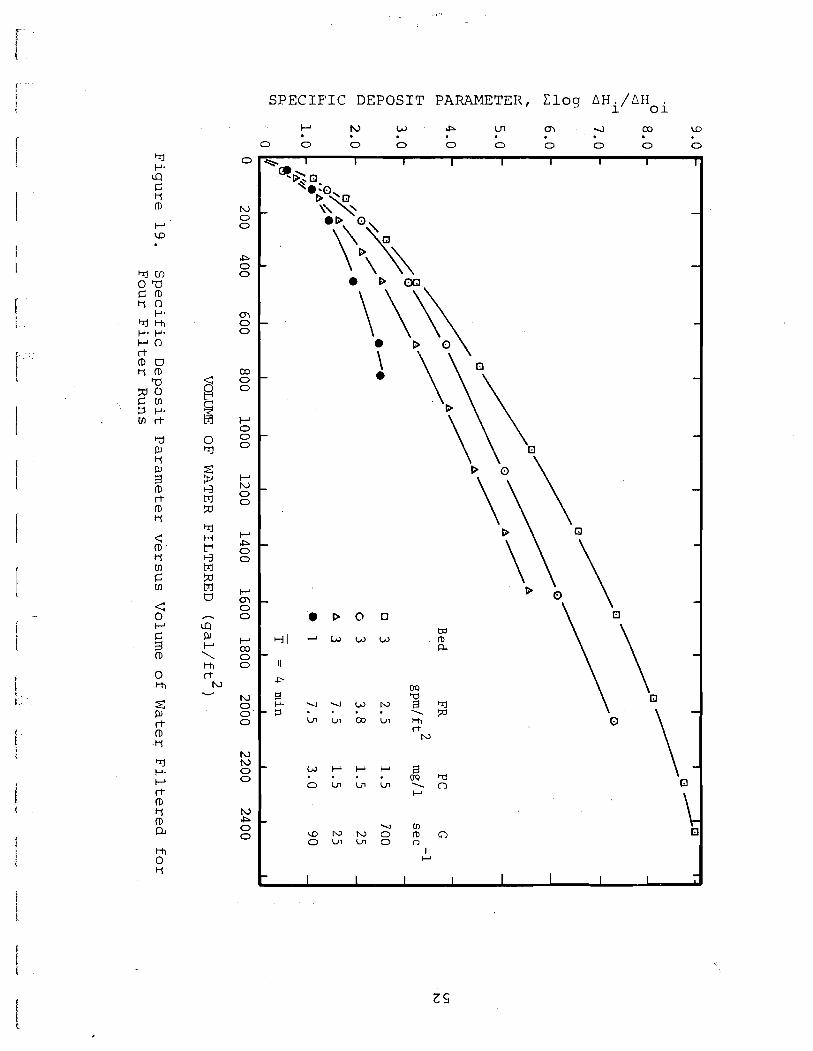
F i g u r e 1 9 i s a p l o t o f C l o g A H v e r s u s t h e w a t e r pro- - o i d u c t i o n , WP i n g a l / f t L f o r f o u r complete f i l t e r r uns . Accord-
i n g t o E q . 8 t h e s e p l o t s shou ld be s t r a i g h t l i n e s w i t h s l o p e s
e q u a l t o l / K 1 . The shape of t h e s e l i n e s , e s p e c i a l l y t h e i n i t i a l
c u r v a t u r e may be t h e r e s u l t o f changes i n t h e way t h e d e p o s i t
b u i l d s w i t h i n t h e i n t e r s t i c e s o f t h e bed a s t h e run p roceeds .
Comparison o f Eq . 5 w i t h t h e g e n e r a l form o f t h e r e l a t i o n s h i p
between AHi and oi o b t a i n e d u s i n g t h e Kozeny-Carman e q u a t i o n
( s e e Herz ig , -- e t a l . ( 1 9 ) ) s u g g e s t s t h a t K i n E q . 5 and consequent-
l y K 1 i n Eq. 8 a r e i n v e r s e l y p r o p o r t i o n a l t o a d e p o s i t packing
c o n s t a n t , B , which i s d e f i n e d by,
F I L T E R BED LAYER
m Cn 4& W h) I-'
U E l O r - n , a c n Y c n r t 3 m Y r.8 r-3 c aa,(D G I - ' & I-'
03
El n, Y 3 I-'- 3 Zll I-'
r - m 3 I-' tfr-PJ pl G o r r t r t (D
m 'U n, Q t-' -
n
t-' . 3
t-' - a C rt
' U Y I - ' 0 3 0 cn r. c I-'- 3 I-'
I-' 0
@-a M
I-' l a a - 0 11 9
S P E C I F I C DEPOSIT Clog A H . / A H 1 oi
'Ti P-
I-' w
I-' C r (D
'Ti I-'- I-' rt (D e (D a
. D o 0
HI r u w w
g . . . .
N
w r r r 3 . a . m ' d O L n L n L n \ n
v
- u cn
W N N O ( D O o m u o I7
I r
- I I I I I I I -
volume o f vo id space e f f e c t i v e l y f i l l e d B = volume o f d e p o s i t
An example o f t h e a p p l i c a t i o n o f B i s t h e fo l l owing e x p r e s s i o n
f o r t h e i n t e r s t i t i a l f l u i d v e l o c i t y v l ,
where v i s t h e s u p e r f i c i a l v e l o c i t y and 0 i s t h e p o r o s i t y .
It i s p o s s i b l e t h a t i n t h e e a r l y s t a g e s o f d e p o s i t f o r -
mat ion t h e d e p o s i t b u i l d s i n an i r r e g u l a r manner r a t h e r a s a
uniform c o a t i n g on t h e media g r a i n s . Th i s might o c c u r , f o r
example, a s a r e s u l t o f p r e f e r e n t i a l a t t achment o f p a r t i c l e s
t o p r e v i o u s l y d e p o s i t e d m a t e r i a l r a t h e r t han c l e a n f i l t e r
g r a i n s . A s t h e run proceeds and t h e g r a i n s e v e n t u a l l y became
comple te ly c o a t e d , t h e bu i ld -up would become more r e g u l a r .
An i r r e g u l a r bui ld-up o f d e p o s i t might cor respond t o a h i g h e r
v a l u e o f B which would. be i n agreement w i t h t h e h i g h e r i n i t i a l
s l o p e s o f t h e cu rves i n F i g u r e 1 9 . A s d e p o s i t i o n con t inued and B
dec rea sed t h e c u r v a t u r e would become less and t h e p l o t s would
t e n d t o s t r a i g h t e n . AHi
F i g u r e s 20 and 2 1 a r e g r aphs o f C l o g v e r s u s AHoi
t h e w a t e r p roduc t i on p e r f i l t e r run f o r o v e r a l l t e r m i n a l head-
l o s s e s o f 30 and 86 i n c h e s o f wa t e r . The p l o t t e d d a t a p o i n t s
r e p r e s e n t o v e r 4 0 randomly s e l e c t e d f i l t e r r u n s i n which t h e
e n t i r e range of p r e t r e a t m e n t and f i l - t e r o p e r a t i n g c o n d i t i o n s AHi
and a l l t h r e e f i l t e r beds w e r e used . The p l o t t i n g o f C l o g A H o i
v e r s u s wa te r p roduc t i on f o r a p a r t i c u l a r o v e r a l l head lo s s
a p p a r e n t l y minimizes t h e e f f e c t o f t h e v a r i a b l e packing c o e f f i c i e n t .
A s shown i n F i g u r e s 2 0 and 2 1 t h e r e l a t i o n s h i p i s e s s e n t i a l l y l i n e a r
as p r e d i c t e d by E q . 8 . Note, however, t h a t t h e s l o p e o f t h e
PI;
A H , I
S P E C I F I C DEPOSIT PARAMETER, Clog - AHoi
Cn '0 rD C) I-'- l-h I-'. C)
l i n e i n F i g u r e 2 1 i s less t h a n t h a t i n F i g u r e 20. Th is i s
a p p a r e n t l y a r e s u l t o f t h e same phenomenon which determined t h e
shape o f t h e cu rves i n F igu re 19. Much of t h e s c a t t e r o f t h e
p o i n t s i n F i g u r e s 20 and 2 1 i s a r e s u l t o f t h e s e n s i t i v i t y o f t h e AHi
C l o g paramete r t o t h e c l e a n bed h e a d l o s s e s , AH , which AHoi o i
were d i f f i c u l t t o measure a c c u r a t e l y and r e p r o d u c i b l y a t low
f i l t r a t i o n r a t e s .
An impor tan t a p p l i c a t i o n o f F i g u r e s 20 and 2 1 i s i n t h e
d e t e r m i n a t i o n o f , i n con junc t i on w i t h Eq. 9 , t h e maximum w a t e r
* produc t i on v a l u e s WP30 * and WPs6 . Using t h e s l o p e s o f t h e l i n e s
i n F i g u r e s 20 and 2land Eq. 9 ,
and
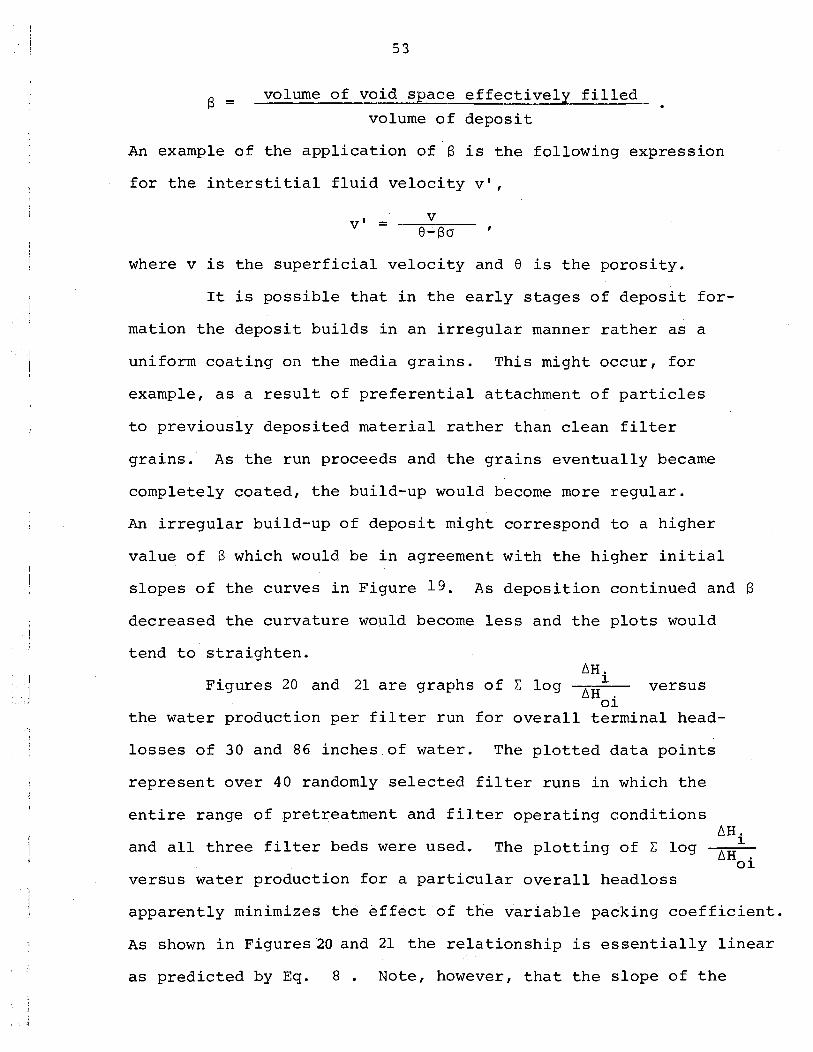
F i g u r e 22 i s a p l o t o f WP * and WP * 30 86 v e r s u s t h e f i l t r a -
t i o n r a t e f o r t h e t h r e e f i l t e r beds . The c l e a n bed h e a d l o s s e s ,
AIIoi, which w e r e used w i th Eqs. 10 and 11 t o c a l c u l a t e t h e p l o t t e d
* v a l u e s o f WPAH were o b t a i n e d i n t h e fo l l owing manner. The c l e a n
bed head los se s o b t a i n e d d u r i n g t h e s t udy f o r each f i l t r a t i o n r a t e
and each l a y e r o f e ach bed w e r e averaged and p l o t t e d v e r s u s t h e
f i l t r a t i o n r a t e . I n each c a s e t h e p c i n t s fo l lowed a s t r a i g h t
l i n e , t h e r e l a t i o n s h i p expec ted f o r l aminar f low. The s l o p e s
a r e l i s t e d i n Table 6 . Using Tab le 6 t h e AHoi f o r a p a r t i c u l a r
bed, l a y e r and f i l t r a t i o n r a t e was c a l c u l a t e d u s i n g
AHoi = k Q ( 1 2 1
where k is t h e s l o p e f o r t h a t p a r t i c u l a r l a y e r and bed and Q i s
Table 6. C o e f f i c i e n t s Used t o C a l c u l a t e Clean Bed Headloss
k (Eq. 1 2 ) , inches of water p e r gpm/ft2 Bed Bed Bed
Layer 1 2 3
2 the filtration rate in gpm/ft . Figure 22 illustrates an important point. If the optimum
deposit distribution (equal headloss in each layer) is achieved
at the same time the overall terminal headloss is reached then
the greatest water production per filter run will be obtained
when the lowest filtration rate, highest terminal headloss and
largest anthracite media grain size are used.
Figure 22 also illustrates indirectly the potential
advantages of variable declining-rate filtration, a method of
operation described by Cleasby (23). If the filtration rate
during the filter run cycle declines uniformly from, for example,
7.5 to 2.5 gpm/ft2 then the total filter area required for a par-
ticular design flow rate would be based on a filtration rate of -
2 approximately 5 gpm/ft . However, the maximum possible water
production, WPAHf, would be related to the filtration rate at
run termination, 2.5 gpm/ft2, which according to Figure 22 is
* greater than the WPAH at 5 gpm/ft2, the filtration rate correspond-
ing to the constant-rate design. For the WPAH * to be achieved, how-
ever, the variable declining-rate method would have to be amenable
to achieving the optimum deposit distribution at the point the
terminal headloss is reached. This should be possible using proper
pretreatment control. Pretreatment control for constant-rate
filtration will be discussed in the next section.
Figure 23 shows experimental WP values obtained using the
three filter beds, several filtration rates and terminal headlosses
of 86 and 30 inches of water. The prefiltration mixing intensity
as the G value was 25 sec-l and the polymer concentration was
1.5 mg/l. These pretreatment conditions tended to result in a
'umu p = L pue ~/6u 5.1 = 3d '32s sz = 3 'aqeg uo?qexqT?a snsxan
high filtration efficiency, i.e., efficient particle removal
in the upper layers of the filter bed, especially at low
filtration rates. For this reason the deposit distributions at
run termination for Beds 1 and 2 (the low effective size
coal beds) and a filtration rate of 2.5 gpm/ft2 were skewed
toward the top layer of the anthracite and the water production
per filter run was significantly below the maximum. Under these
pretreatment conditions more favorable deposit distributions
were obtained at higher filtration rates and with the larger
effective size coal bed. A detailed discussion of the effect
of the pretreatment and filter operating conditions on WPnH
is given in the next section.
D . P r e t r e a t m e n t S t u d i e s : The purpose o f t h i s p o r t i o n
of t h e s t udy was t o de te rmine how t h e p r e t r e a t m e n t v a r i a b l e s
i n c l u d i n g t h e polymer c o n c e n t r a t i o n and t h e mixing i n t e n s i t y
and mean d e t e n t i o n t ime i n t h e p r e f i l t r a t i o n r e a c t o r cou ld
b e used t o maximize t h e wa te r p roduc t i on p e r f i l t e r run and
avo id t u r b i d i t y breakthrough. The r e s u l t s a r e summarized i n
F i g u r e s 24, 25 and 26. I n t h e s e g raphs w a t e r p roduc t i on p e r
f i l t e r run i s exp re s sed a s a p e r c e n t o f t h e maximum wate r
* produc t i on p e r f i l t e r run , WPnH , which was o b t a i n e d frcm
F i g u r e 22. S e v e r a l o f t h e v a l u e s p l o t t e d exceed 100 p e r c e n t
a p p a r e n t l y because o f t h e method used t o e s t i m a t e WPhH * (u s ing
F i g u r e s 20 and 21 and E q . ( 9 ) ) and t h e expe r imen ta l e r r o r i n
each v a l u e o f t h e wa te r p roduc t i on p e r f i l t e r run.
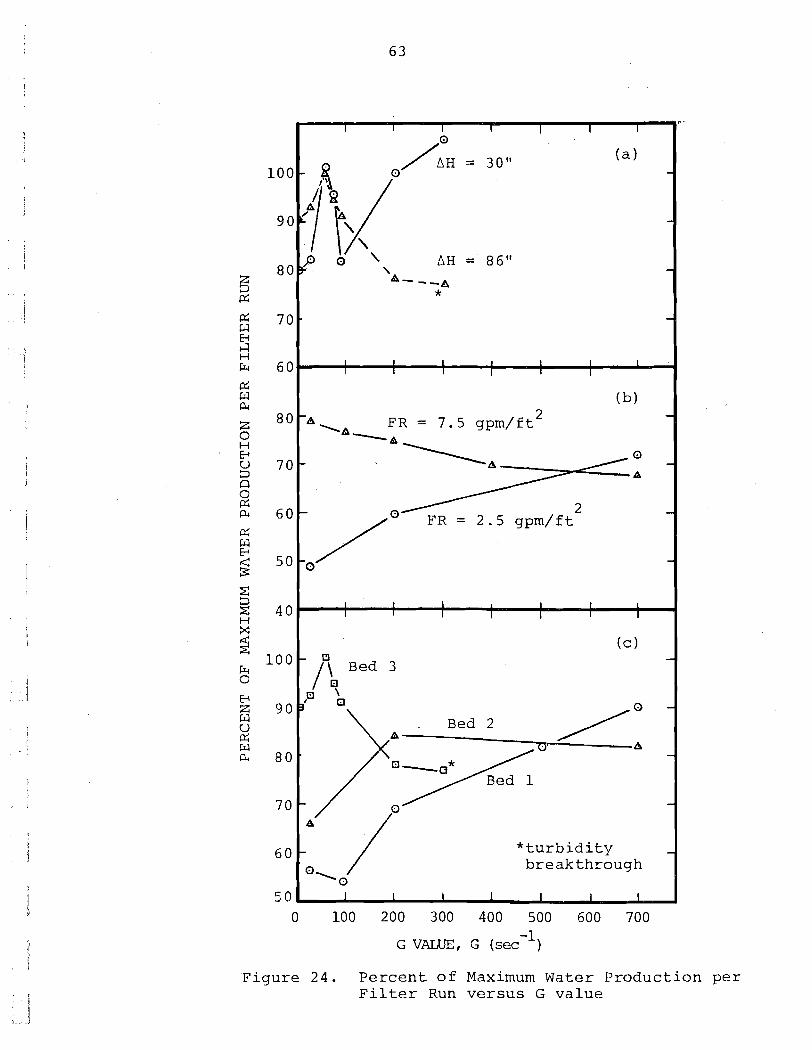
In Figu re 24a wa te r p roduc t i on is p l o t t e d v e r s u s t h e p re -
f i l t r a t i o n mixing i n t e n s i t y ( a s t h e G v a l u e ) f o r t e r m i n a l
h e a d l o s s e s o f 8 6 and 30 i n c h e s o f w a t e r . For OH = , 8 6 " t h e
wate r p roduc t i on is a nlaximum a t G = 60 sec-l. For AH = 30"
t h e water p roduc t i on i n c r e a s e s as t h e G v a l u e i n c r e a s e s from
0 t o 60 sec-I and from 100 t o 300 s e c - l . I n g e n e r a l , t h e
G v a l u e s which maximized t h e w a t e r p roduc t i on were h i g h e r f o r
t h e lower , 30-inch, t e r m i n a l head lo s s . The expe r imen ta l con-
d i t i o n s used i n t h e exper iments summarized i n F i g u r e 24a were
Bed 3 , a polymer c o n c e n t r a t i o n o f 5 mg/l, a f i l t r a t i o n r a t e o f
7.5 gpm/ft2 and mean d e t e n t i o n t ime of 4 rnin.
F i g u r e 24b i s a p l o t o f wa t e r p r o d u c t i o n v e r s u s t h e PMR
2 G v a l u e f o r f i l t r a t i o n r a t e s o f 2.5 and 7.5 gpm/ft . A s t h e
G v a l u e i n c r e a s e s from 25 t o 700 sec-I t h e wa te r p roduc t i on
d e c r e a s e s from 79 t o 68 p e r c e n t of WPs6 ~r for 7.5 gpm/ft2 and
( 33s) 3 'm 3 1 -
OOL 009 00s OOP OOE 002 001 0
i n c r e a s e s from 49 t o 72 p e r c e n t o f WPs6 * f o r 2.5 gpm/ft 2 .
Note t h a t Bed 2 , a polymer c o n c e n t r a t i o n o f 1 . 5 mg/l, a
t e r m i n a l head lo s s o f 86" and a mean d e t e n t i o n t i m e o f 4 min.
were used i n t h e s e exper iments .
F i g u r e 24c i s a p l o t s i m i l a r t o F i g u r e 24a and 24b i n
which Beds 1, 2 and 3 a r e compared. For Eed 3 , t h e bed w i t h
t h e c o a r s e s t a n t h r a c i t e l a y e r (e.s. = 1 .71 mm), t h e wate r
-1 produc t i on i s a maximum a t G = 60 sec . For Beds 2 (e.s. =
1.20 mm) and 1 (e.s. = 0.94 mrn) t h e G v a l u e s which maximize
t h e wa te r p roduc t i on a r e approx imate ly 200 sec-' and 700 sec-I
r e s p e c t i v e l y . The d a t a p l o t t e d i n F igu re 2 4 c were determined
u s i n g a polymer c o n c e n t r a t i o n o f 5.0 mg/l w i t h Bed 3 and
3.0 mg/l w i t h Beds 1 and 2 . The t e r m i n a l h e a d l o s s was 86 - 2 i n c h e s , T was 4 minu tes and. t h e f i l t r a t i o n r a t e was 7 .5 gpm/ft .
F i g u r e 25 i l l u s t r a t e s t h e e f f e c t o f t h e polymer concen t ra -
t i o n on wa te r p roduc t i on . F i g u r e 25a is a p l o t o f wa t e r pro-
d u c t i o n v e r s u s t h e polymer c o n c e n t r a t i o n f o r Beds 1, 2 and 3.
The w a t e r p roduc t i on i s a minimum a t a polymer c o n c e n t r a t i o n
o f 3.0 mg/l f o r Beds 1 and 2 . For Bed 3 t h e w a t e r p roduc t i on
i n c r e a s e s con t inuous ly a s t h e polymer c o n c e n t r a t i o n is i n c r e a s -
ed from 1 .0 t o 7.0 mg/l. A G v a l u e o f 25 sec-', a o f 4.0
min, a f i l t r a t i o n r a t e o f 7 .5 gpm/ft2 and a t e r m i n a l h e a d l o s s
o f 86 i n c h e s were used i n t h e s e exper iments .
F i g u r e 25b i s p l o t o f w a t e r p roduc t i on v e r s u s t h e polymer
c o n c e n t r a t i o n f o r t e r m i n a l h e a d l o s s e s o f 86 and 30 i n c h e s o f
wa te r . The exper imenta l c o n d i t i o n s i n c l u d e a G v a l u e o f
25 sec-l , Bed 3 and Y = 4 min. The wa te r p roduc t i on i s a
minimum a t a polymer c o n c e n t r a t i o n o f 3.0 mg/l when t h e t e r m i n a l
h e a d l o s s i s 30 i n c h e s , however, a s no ted i n t h e d i s c u s s i o n
o f F i g u r e 25a, when a t e r m i n a l head lo s s o f 86 i n c h e s i s used
t h e w a t e r p roduc t ion i n c r e a s e s con t inuous ly a s t h e polymer
c o n c e n t r a t i o n i n c r e a s e s from 1 . 0 t o 7.0 mg/l.
F i g u r e 26 i l l u s t r a t e s t h e e f f e c t of t h e p r e f i l t r a t i o n -
r e a c t o r mean d e t e n t i o n t i m e , TI on t h e wa te r p roduc t i on p e r
f i l t e r run. The d a t a was determined u s i n g Bed 1, a polymer
c o n c e n t r a t i o n o f 1 .5 mg/l, t e r m i n a l head lo s se s o f 75 and
30 i n c h e s o f wa t e r and t h e G v a l u e s l i s t e d w i t h t h e f i g u r e .
I t was neces sa ry t o u s e a t e r m i n a l head lo s s o f 75 i n c h e s
because h y d r a u l i c l o s s e s i n t h e wa te r supp ly sys tem reduced
t h e t o t a l a v a i l a b l e head t o 75 i n c h e s when t h e f low r a t e was
i nc r ea sed t o produce a r of 2.0 min. The optimum G v a l u e s
l i s t e d w i t h t h e f i g u r e a r e t h e G v a l u e s which maximized t h e
w a t e r p roduc t i on f o r AH = 75". For example, i n F i g u r e 2 4 C ,
Bed 3, t h e optimum G v a l u e i s 60 sec-l. For t h e c o n d i t i o n s
used i n F i g u r e 26 t h e G v a l u e which maximized WF dec rea sed 75
-1 from 400 s e c - ' a t = 2 . 0 m i n t o 100 sec a t T = 9 . 2 m i n . he' r e l a t i o n s h i p between t h e optimum G v a l u e and T i s a f u n c t i o n
of t h e polymer c o n c e n t r a t i o n . A t a polymer c o n c e n t r a t i o n o f
1 .0 mg/l and + = 9 . 2 rrin. t h e optimum G v a l u e was 275 sec-l.
I n g e n e r a l , t h e r e s u l t s p l o t t e d and t a b u l a r i z e d i n F i g u r e 26 ,
i n d i c a t e t h a t t h e w a t e r p roduc t i on i n c r e a s e s a s i n c r e a s e s
from 2.0 t o 9.2 minutes . Th i s t r e n d i s a l s o t h e c a s e when t h e
optimum G v a l u e cor responding t o each i s used.
The r e s u l t s o b t a i n e d i n t h e p r e t r e a t m e n t s t u d i e s can be
i n t e r p r e t e d by c o n s i d e r i n g t h e r e l a t i o n s h i p s between t h e
p r e t r e a t m e n t and f i l t e r o p e r a t i n g c o n d i t i o n s and t h e r a t e o f
--a G = optimum ( s e e above) AH = 75"
0-0 G = 100 sec-1, AH = 75" .--. G = optimum ( s e e above) AH = 30% 0-0 G = 100 sec-1, AH = 30"
PC = 1 . 5 mg/ l
I I I I 1 1 1 I I I 1 0 1 2 3 4 5 6 7 8 9 1 0
- MEAN DETENTION TIME, T (min )
F i g u r e 2 6 . P e r c e n t of M a x i m u m Water P r o d u c t i o n per F i l t e r Run ve r sus Mean D e t e n t i o n T i m e
advancement o f t h e c logg ing f r o n t down th rough t h e f i l t e r
media. The r a t e o f advancement o f t h e c logg ing f r o n t
de t e rmines t h e d i s t r i b u t i o n o f s p e c i f i c d e p o s i t a t r un
t e r m i n a t i o n and whether o r n o t t u r b i d i t y b reak through o c c u r s
b e f o r e t h e t e r m i n a l head lo s s i s reached . The t e r m i n a l
s p e c i f i c d e p o s i t d i s t r i b u t i o n , a s d i s c u s s e d i n t h e p r ev ious
s e c t i o n , i s r e l a t e d t o t h e w a t e r p roduc t i on p e r f i l t e r run.
The r a t e o f advancement o f t h e c l c ~ g g i n g f r o n t i s an
i n v e r s e f u n c t i o n o f t h e p a r t i c l e removal e f f i c i e n c y w i t h i n
t h e f i l t e r . The more e f f i c i e n t l y p a r t i c l e s a r e removed a t
any l o c a t i o n i n t h e f i l t e r t h e s lower t h e r a t e o f advancement
o f t h e c logg ing f r o n t . A concep tua l f i l t r a t i o n model by
OVPelia ( 2 1 ) and Yao, -- e t a l . (17) , a l t hough it i s no l o n g e r
s t a t e - o f - t h e - a r t , can be used t o es t . imate t h e e f f e c t o f
v a r i o u s f a c t o r s on t h e p a r t i c l e removal e f f i c i e n c y . The
model p r e d i c t s t h a t t h e p a r t i c l e removal e f f i c i e n c y of a
c l e a n g r a n u l a r f i l t e r w i l l i n c r e a s e a s :
1. t h e p a r t i c l e d i ame te r i n c r e a s e s above o r d e c r e a s e s below approximate ly 1 t o 10 y,
2 . t h e f i l t e r media g r a i n d i ame te r d e c r e a s e s ,
3 . t h e f i l t r a t i o n r a t e d e c r e a s e s ,
4 . t h e deg ree o f p a r t i c l e d e s t . a b l i z a t i o n i n c r e a s e s and
5. t h e d e n s i t y o f t h e p a r t i c l e s i n c r e a s e s .
O 'Mel ia ' s ( 2 1 ) model p r o v i d e s a u s e f u l q u a l i t a t i v e re-
l a t i o n s h i p between most of t h e v a r i a b l e s s t u d i e d i n t h i s in -
v e s t i g a t i o n and t h e r a t e o f advancement o f t h e c logg ing f r o n t .
However, t h e r e l a t i o n s h i p between t h e p r e f i l t r a t i o n r e a c t o r
mixing i n t e n s i t y and t h e r a t e of advancement o f t h e c logg ing
f r o n t i s n o t obvious. The supplementary s tudy desc r ibed
i n Sec t ion 11-C was conducted t o determine t h e e f f e c t o f
t h e p r e f i l t r a t i o n mixing i n t e n s i t y on t h e s i z e d i s t r i b u t i o n
and d e n s i t y of t h e f l o c s t h a t a r e a p p l i e d t o t h e f i l t e r .
A polymer concen t r a t i on of 1 . 5 mg/l and a 4 min. pe r iod of
mixing w e r e used i n t h e s e batch- type exper iments .
F igure 27 is a p l o t o f t h e r e l a t i v e mass c o n c e n t r a t i o n
o f f l o c ve r sus t h e f l o c d iameter f o r G v a l u e s o f 25, 200
and 700 s e c - l . The bimodal d i s t r i b u t i o n f o r G = 25 sec - I
s u g g e s t s t h a t under t h e s e c o n d i t i o n s a s i g n i f i c a n t popula-
t i o n o f primary p a r t i c l e s e x i s t s a f t e r t h e 4 min. f l o c c u l a -
-1 t i o n pe r iod . For G = 2 0 0 s e c t h e primary p a r t i c l e peak
has d i sappeared and t h e f l o c d i s t r i b u t i o n i s c e n t e r e d a t a
f l o c diameter of approximately 2 0 0 pm. For G = 700 s e c -1
t h e f l o c d i s t r i b u t i o n has narrowed somewhat and primary
s i z e p a r t i c l e s o r f l o c s a r e appa ren t .
Floc d e n s i t y was determined a s a func t ion of f l o c d iameter
u s i n g t h e method desc r ibed i n Sec t ion 11-C. The f i n a l r e s u l t s
are p l o t t e d i n F igu re 28. F loc d e n s i t y d e c r e a s e s w i t h f l o c
d iameter i n two s t a g e s . Between f l o c d i ame te r s of 1 0 and 80 u m
3 t h e d e n s i t y dec reases from 2.6 t o 1 .05 gm/cm . Above a f l o c
d i ame te r of approximately 1 0 0 pm t h e dependence of f l o c d e n s i t y
on s i z e i s s i g n i f i c a n t l y less. The r e s u l t s sugges t t h a t f l o c
growth occu r s i n two s t a g e s . Michaels and Bolger ( 2 4 ) have
no ted t h a t f l o c growth may occur by t h e agglomerat ion of primary
p a r t i c l e s followed by a second s t a g e i n which t h e f l o c s j o i n t o
form l o o s e agg rega t e s .
RELATIVE MASS CONCENTRATION
F N W &
I t i s a p p a r e n t from t h e s e supplementary e x p e r i ~ n e n t s t h a t
t h e p r e f i l t r a t i c n mixing i n t e n s i t y has a s i g n i f i c a n t e f f e c t
on t h e s i z e d i s t r i b u t i o n and d e n s i t y o f t h e f l o c s t h a t a r e
a p p l i e d t o t h e f i l t e r . According t o t h e f i l t r a t i o n model o f Yao,
e t -- a l e , (17) t h e p r e f i l t r a t i o n mixing i n t e n s i t y shou ld t h e r e f o r e
b e r e l a t e d t o t h e f i l t r a t i o n e f f i c i e n c y and consequen t ly t o t h e
r a t e o f advancement o f t h e c logg ing f r o n t . A complete i n t e r -
p r e t a t i o n o f t h e e f f e c t o f t h e p r e f i l t r a t i o n mixing i n t e n s i t y
on t h e c logg ing f r o n t advancement and t e r m i n a l s p e c i f i c d e p o s i t
d i s t r i b u t i o n i s made d i f f i c u l t by t h e f a c t t h a t t h e p a r t i c l e
s i z e and d e n s i t y f a c t o r s a r e c o u n t e r a c t i n g , i . e . , t h e p a r t i c l e
d e n s i t y d e c r e a s e s a s t h e p a r t i c l e s i z e i n c r e a s e s . I n F i g u r e 24b
t h e w a t e r p roduc t i on f o r t h e 7.5 gpm/ft2 f i l t r a t i o n r a t e decreas -
es con t inuous ly from G = 25 sec-I t o G = 700 sec-I because o f an
i n c r e a s i n g amount o f bu i l dup i n t h e sand l a y e r . Apparen t ly t h e
p r imary p a r t i c l e s remaining a f t e r t h e f l o c c u l a t i o n s t e p a t
-1 G = 25 sec e i t h e r f l o c c u l a t e wh i l e moving between t h e PMR and
t h e f i l t e r o r t h e y a r e e f f i c i e n t l y removed because o f t h e i r s i z e .
I t i s a l s o p o s s i b l e , based on a review o f j a r t es t r e s u l t s ( 2 5 ) ,
t h a t t h e pr imary p a r t i c l e s formed i n t h e PMR by t h e e r o s i o n
o r break-up of f l o c s a r e i n e f f i c i e n t l y removed i n t h e uppe r ,
d e p o s i t - c o n t a i n i n g l a y e r s o f t h e bed. The number o f pr imary
p a r t i c l e s formed by t h e e r o s i o n o r break-up mechanism would
i n c r e a s e a s t h e G v a l u e i s i n c r e a s e d .
The e f f e c t o f t h e G v a l u e on head los s and s p e c i f i c d e p o s i t
d i s t r i b u t i o n s a t run t e r m i n a t i o n is i l l u s t r a t e d i n F i g u r e s 2 9
and 30. The d a t a p l o t t e d w e r e o b t a i n e d from t h e exper iments
used t o deve lop t h e AH = 86 i n c h e s cu rve i n F i g u r e 24a . Note
HEADLO S S % OF TOTAL HEADLOS S % OF TOTAL ( i n c h e s of w a t e r ) SPECIFIC DEPOSIT ( i n c h e s o f w a t e r ) SPECIFIC DEPOSIT
Figure 29. Terminal Headloss and Specific Deposit Distributions
r- 2. ti-
x N
0 r- ,? O
rn 0 rF mi+ . - i-1 0 W p- 8 ; 0 0- t-t C ID ti- r( P-
w r m 0 n 0- H r 0 t r w N n 0
6 u 0 m H w * O r ' 0 m tr H
F I L T E R BED LAYER W l C W N P
u 6 P. CD V) rl t - t 3 rl P P. 3 0- PI ?= r t-t P . 0 3
3: 0 ID 'u PI t-t p. t-'. r 3 O t
7 5
-1 that a G value of 60 sec produced the terminal distribu-
tions closest to the optimum distributions plotted in
Figure 30b. The distributions for G = 0 sec-I are skewed
toward the upper layers of the bed and for G = 300 sec-l
they are skewed toward the lower layers. The headloss
build-up in layer 6 at G = 300 sec-I indicates that turbidity
breakthrough was imminent. The rate of advancement of the
clogging front under these conditions was increased by in-
creasing the G value from 0 to 300 sec-'.
Table 7 illustrates the general relationship between
the combined pretreatment and filter operating conditions
and the rate of advancement of the clogging front, the ter-
minal specific deposit distribution for AH = 86" and the
tendency for turbidity breakthrough. The lowest rate of
advancement of the clogging front was observed when the
combination of conditions listed in column 1 was used and
the highest rate was observed when the combination listed
in column 3 was used. When the conditions of column 2 or
a combination from all three colu~~ms was used the rate was
intermediate.
The rate of advancement of the clogging front which will
result in the optimum specific deposit distribution at run
termination depends on the terminal headloss. The lower the
terminal headloss the higher the acceptable rate. For
example, when the terminal headloss was 86 inches, the con-
,ditions in column 2 or any other combination which resulted
in an intermediate rate of advancement tended to produce the
maximum water production. As shown in Figure 24a, when the
Tab le 7 . E f f e c t o f P r e t r e a t m e n t and F i l t e r Ope ra t i ng Cond i t i ons on t h e Ra te of Clogging F r o n t Advancement
Column 1 Column 2 Column 3
Polymer 3.0 1 . 5 o r 1 . 0 o r Concen t r a t i on , 5.0 7.0
(mg/l)
A n t h r a c i t e Media s i z e d i s t r i b u t i o n , e . s . , ( m ) / u . c .
0.94/1.65
(Bed 1)
1.20/1.60
(Bed 2 ) (Bed 3 )
P r e f i l t r a t i o n mixing i n t e n s i t y , G v a l u e (sec-1)
F i l t r a t i o n r a t e (gpm/ft2)
Mean d e t e n t i o n t i m e (min)
Rate o f advancement o f t h e c logg ing v e r y f r o n t s low
very r a p i d
Terminal s p e c i f i c skewed skewed d e p o s i t d i s t r i b u - toward t h e P toward t h e t i o n , AH = 86" t o p o f t h e bed bottom o f t h e bed
Tendency f o r t u r b i d i t y break- th rough t o o c c u r
ve ry low
v e r y h igh
t e r m i n a l head lo s s was 30 i n c h e s a combinat ion o f c o n d i t i o n s
w i t h a l l o r s e v e r a l t end ing toward t h e v a l u e s i n column 3
was more accep t ab l e .
Within t h e range o f magnitudes used i n t h i s s t u d y t h e
e f f e c t o f c e r t a i n c o n d i t i o n s on t h e r a t e o f advancement o f
t h e c logg ing f r o n t was more s i g n i f i c a n t t h a n o t h e r s . The
sys tem was ve ry s e n s i t i v e t o t h e polymer c o n c e n t r a t i o n and
much less s o t o t h e mean d e t e n t i o n t ime. For example,
when a polymer c o n c e n t r a t i o n o f 3 mg/l was used w i t h Beds 1
and 2 it was n o t p o s s i b l e (F igu re 24c) t o i n c r e a s e t h e wa te r
p roduc t i on above 90 p e r c e n t of WPs6 * by i n c r e a s i n g t h e
G v a l u e . Apparent ly t h e deg ree o f p a r t i c l e d e s t a b i l i z a t i o n
a t a polymer c o n c e n t r a t i o n o f 3.0 mg/l c r e a t e s a tendency
f o r p a r t i c l e removal i n t h e upper l a y e r s o f t h e bed which
i s d i f f i c u l t t o c o u n t e r a c t .
E. F i e l d Study: The f i e l d s t u d y was conducted u s i n g t h e
l a b o r a t o r y f i l t r a t i o n a p p a r a t u s and raw w a t e r drawn d i r e c t l y
from t h e o f f s h o r e i n t a k e a t Ch icago ' s C e n t r a l Dis t r ic t
F i l t r a t i o n P l a n t on Lake Michigan. The f i l t r a t i o n a p p a r a t u s
was o p e r a t e d i n t e r m i t t e n t l y d u r i n g p a r t o f t h e months o f May and
June, 1975. Unfo r tuna t e ly d u r i n g t h i s p e r i o d t h e raw wa te r
t u r b i d i t y neve r i n c r e a s e d above 1 .5 F'TU f o r a s i g n i f i c a n t
p e r i o d o f t i m e . P lankton d e n s i t i e s were a l s o r e l a t i v e l y low
d u r i n g t h i s p e r i o d rang ing from 380 t o 800/ml. The wa te r
t empe ra tu r e ranged from 1 0 t o 1 4 O ~ .
The f i e l d s t udy was preceded by a s t a t i s t i c a l a n a l y s i s
o f ave rage d a i l y v a l u e s o f t h e t u r b i d i t y and t h e d e n s i t y o f
p l ank ton organisms i n t h e wa t e r drawn from t h e o f f s h o r e i n t a k e .
The d a t a was o b t a i n e d from t h e l o g a t t h e C e n t r a l D i s t r i c t
F i l t r a t i o n P l a n t . F igu re 31 is graph o f t h e p e r c e n t o f t h e
t i m e t h e o f f s h o r e wate r t u r b i d i t y e q u a l l e d o r exceeded t h e
p l o t t e d va lue s . Th i s graph was p l o t t e d u s i n g d a t a from t h e
y e a r s 1971 t o 1973. Note t h a t 50 p e r c e n t o f t h e t i m e t h e
o f f s h o r e wate r t u r b i d i t y was less t h a n approx imate ly 3 FTU.
F igu re 32 i s a g raph s i m i l a r t o F i g u r e 31 f o r t h e
ave rage number of p lank ton organisms p e r m l . One y e a r o f
r eco rd was used f o r t h i s p l o t . F i f t y p e r c e n t o f t h e t i m e
t h e p lank ton d e n s i t y was less t h a n approx imate ly 1200/ml.
The o r i g i n a l purpose of t h e f i e l d s t udy was t o v e r i f y
t h e r e s u l t s of t h e l a b o r a t o r y exper iments , i . e . , t o f o c u s
on t h e u se o f t h e p r e t r e a t m e n t s t e p t o maximize wate r pro-
d u c t i o n p e r f i l t e r run. However, t h e low o f f s h o r e wa te r
t u r b i d i t y l e v e l s d u r i n g t h e l i m i t e d p e r i o d a v a i l a b l e f o r t h e
f i e l d s t udy exper iments made t h i s t y p e o f exper iment ve ry
t i m e consuming and t h e r e s u l t s e s s e n t i a l l y moot. A t t e n t i o n
was d i r e c t e d i n s t e a d toward t h e e f f l u e n t t u r b i d i t y and t h e
s o - c a l l e d r i p e n i n g pe r iod . I n o r d e r t o s t u d y t h e e f f l u e n t
t u r b i d i t y problem under c r i t i c a l f i l t e r o p e r a t i n g c o n d i t i o n s
Bed 3 , t h e bed w i t h t h e c o a r s e s t a n t h r a c i t e l a y e r , and a
2 f i l t r a t i o n r a t e o f 7.5 gpm/ft were used i n most o f t h e s e ex-
pe r iments .
F i g u r e 33 i s a p l o t of e f f l u e n t t u r b i d i t y and o v e r a l l
head lo s s v e r s u s khe volume o f wa t e r f i l t e r e d . A polymer con-
c e n t r a t i o n o f 0.5 mg/l (Cat-Floc T ) , a C v a l u e o f 25 sec-'
and a mean d e t e n t i o n t i m e o f 4 min were nsed i n t h i s e x p e r i -
ment. A p r e l i m i n a r y s tudy i n which t h e polymer c o n c e n t r a t i o n
RAW WATER TURBIDITY, FTU
Figure 31. Statistical Distribution of Lake Michigan Water Turbidity
PERCENT OF THE TIME PLOTTED VALUE WAS EQUALED OR EXCEEDED
was v a r i e d from 0 .1 t o 1.0 mg/l i n a series o f r u n s i n d i c a t -
e d t h a t a 0.5 mg/l c o n c e n t r a t i o n minimized t h e e f f l u e n t
t u r b i d i t y . P a r t i c l e z e t a p o t e n t i a l s were n o t measured d u r i n g
t h e fie1.d s tudy .
I t i s appa ren t from F igu re 33 t h a t t u r b i d i t y removal
under low i n f l u e n t t u r b i d i t y c o n d i t i o n s i s poor compared t o
t h e removals o b t a i n e d i n t h e l a b o r a t o r y s t udy when t h e 32 FTU
k a o l i n / b e n t o n i t e suspens ion was used (See F igu re 1 2 ) . I n t h e
l a b o r a t o r y s t u d y e f f l u e n t t u r b i d i t i e s less t h a n 0 .1 FTU were
o b t a i n e d c o n s i s t e n t l y w i t h t h e s e f i l t e r o p e r a t i n g c o n d i t i o n s .
I n t h e p r e l i m i n a r y s t udy ( S e c t i o n 1 1 1 - A ) e f f l u e n t t u r b i d i t i e s
less t h a n 0 . 1 FTU w e r e o b t a i n e d w i t h t h e 0.67 mm e f f e c t i v e
s i z e sand f i l t e r , however, h igh r a t e s o f h e a d l o s s bui ld-up
w e r e a l s o observed (F igu re 7 ) .
Severa.1 s h o r t f i l t e r r uns were conducted d u r i n g t h e
f i e l d s t udy when t h e i n f l u e n t t u r b i d i t y i n c r e a s e d t o abou t
3.2 FTU. The t u r b i d i t y removal e f f i c i e n c y a t 200 g a l / f t 2
f i l t e r e d i n c r e a s e d from approx imate ly 30 p e r c e n t when t h e
i n f l u e n t was 0.72 FTU t o approximate ly 80 p e r c e n t when t h e
i n f l u e n t was 3.2 FTU. A 0.1 FTU e f f l u e n t , however, was n o t
o b t a i n e d .
A series o f f i l t e r r u n s were conducted when t h e i n f l u e n t
t u r b i d i t y was 1 . 4 FT!J t o d.etcrmine t h e e f f e c t o f t h e f i l t r a -
t i o n r a t e on t h e t u r b i d i t y removal e f f i c i e n c y a t 200 g a l / f t 2
f i l t e r e d . The removal i n c r e a s e d from 45 p e r c e n t a t 7.5 gpm/ft 2
2 t o 55 p e r c e n t a t 2.5 gpm/ft . I t d i d n o t appea r , however, t h a t
e f f l u e n t t u r b i d i t y l e v e l s on t h e o r d e r o f 0 .1 FTU could be
o b t a i n e d by d e c r e a s i n g t h e f i l t r a t i o n r a t e .
VOLUME OF WATER FILTERED (gal/ft2)
Figure 33. Effluent Turbidity and Overall Headloss vs. Volume of Water Filtered - Field Study -
An exper iment was conducted t o de t e rmine i f t h e e f f l u e n t
t u r b i d i t y cou ld be improved by i n c r e a s i n g t h e r a t e a t which
t h e f i l t e r was " r i p e n e d " , i . e . , t h e r a t e a t which a c o a t i n g
o f d e p o s i t w a s formed on t h e f i l t e r media. Bed 3 , a G v a l u e
2 o f 25 sec-I and a f i l t r a t i o n r a t e o f 7 .5 gpm/ft w e r e used
i n t h i s exper iment . A c o n c e n t r a t e d su spens ion o f b e n t o n i t e
c l a y was pumped t o t h e c o n s t a n t head t a n k o f t h e f i l t e r
a p p a r a t u s . The b e n t o n i t e c o n c e n t r a t i o n i n t h e wa t e r f lowing
t o t h e f i l t e r was 30 mg/l. A polymer c o n c e n t r a t i o n o f 3 .0 mg/l
was used . (No e f f o r t was made t o de t e rmine t h e optimum polymer
c o n c e n t r a t i o n . ) The b e n t o n i t e a d d i t i o n was con t i nued u n t i l
t h e e f f l u e n t t u r b i d i t y appeared t o have reached a minimum.
A t t h i s p o i n t t h e b e n t o n i t e f e e d was t e r m i n a t e d and t h e
polymer c o n c e n t r a t i o n was reduced t o 0.5 mg/l.
The r e s u l t s o f t h i s exper iment a r e p l o t t e d i n F i g u r e 34.
Note t h a t t h e e f f l u e n t t u r b i d i t y dec r ea sed t o a l e v e l lower
t h a n o b t a i n e d w i t h o u t t h e b e n t o n i t e and t h a t t h i s minimum
2 w a s r e ached by approx imate ly 800 g a l / f t . However, t h e over -
a l l h e a d l o s s i n c r e a s e d a t a much g r e a t e r r a t e t h a n t h e c a s e
w i t h o u t b e n t o n i t e shown i n F i g u r e 33. Without b e n t o n i t e t h e
volume f i l t e r e d a t a 20 i n c h h e a d l o s s was 5500 g a l / f t 2 and
2 w i t h t h e b e n t o n i t e t h e volume f i l t e r e d was 200 g a l / f t .
A f t e r t h e b e n t o n i t e a d d i t i o n was t e r m i n a t e d t h e e f f l u e n t
t u r b i d i t y i n c r e a s e d t o l e v e l s comparable t o t h o s e expec t ed
i f no b e n t o n i t e had e v e r been added. T h i s s u g g e s t s t h a t t h e
h i g h e r e f f l u e n t t u r b i d i t i e s o b t a i n e d w i t h low i n f l u e n t t u r -
b i d i t i e s a r e n o t t h e r e s u l t o f a s low r i p e n i n g o f t h e f i l t e r
media b u t a r e s u l t o f i n s u f f i c i e n t f l o c c u l a t i o n i n t h e PMR.
0 200 400 600 800 1000 1200 1400 1600 1800
2 VOLUME OF WATER FILTERED (gal/ft )
F i g u r e 3 4 . E f f l u e n t T u r b i d i t y and Overa l l H e a d l o s s v e r s u s Volume o f Water F i l t e r e d - F i e l d S tudy
The d i f f i c u l t i e s involved i n t h e f l o c c u l a t i o n of d i l u t e
suspensions u s ing c a t i o n i c p o l y e l e c t r o l y t e s p r i o r t o removal
by sed imenta t ion a r e w e l l known (11).
I n one s h o r t f i l t e r run t h e G va lue was inc reased t o
200 sec - I and a mean d e t e n t i o n t i m e o f 9.2 minutes was used
t o p rov ide a g r e a t e r oppor tun i ty f o r f l o c format ion i n t h e PMR.
2 A f i l t r a t i o n rate o f 5 gpm/ft was used. No improvement i n
t h e e f f l u e n t t u r b i d i t y over t h e exper iments i n which = 4 min,
2 G = 25 s e c and FR = 7.5 gpm/ft were used was observed.
A common p r a c t i c e i n t r e a t i n g 1-ow t u r b i d i t y wate r w i th .
d u a l media f i l t e r s i s t h e use of a hydrolyzing s a l t coagu lan t
such a s aluminum s u l f a t e i n a d d i t i o n t o a polymer coagulan t .
Shea, -- e t a l . ( 7 ) found t h a t t h e r i p e n i n g p e r i o d , which was
e x c e s s i v e when a c o a r s e (2.5 mm e f f e c t i v e s i z d a n t h r a c i t e l a y e r
w a s used , could be reduced s u b s t a n t i a l l y by t h e a d d i t i o n o f
alum a long wi th a c a t i o n i c p o l y e l e c t r o l y t e . The p o l y e l e c t r o -
l y t e , it was found, was necessary t o " s t r eng then" t h e f l o c
t o p reven t it from p e n e t r a t i n g t h e bed.
Fj-gure 35 is a graph of e f f l u e n t t u r b i d i t y and o v e r a l l
head los s ve r sus volume of wate r f i l t e r e d when t h e i n f l u e n t
t u r b i d i t y was 0.8 FTU and 10 mg/l of A12(S04)3 . 18 H 2 0 p l u s
0.5 mg/l of Cat-Floc T were used. Experiments were n o t conduct-
e d t o op t imize t h e polymer c o n c e n t r a t i o n . I t i s expec ted , based
on t h e r e s u l t s o f Shea, -- e t a l . ( 7 ) , t h a t e f f l u e n t t u r b i d i t i e s
less t h a n 0 .1 FTU and an a c c e p t a b l e r i p e n i n g p e r i o d could have
been ach ieved by a b e t t e r cho ice of t h e polymer c o n c e n t r a t i o n .
The absence o f a r i p e n i n g p e r i o d i n F igu re 35 i s appa ren t .
The e f f l u e n t t u r b i d i t y i s e s s e n t i a l l y c o n s t a n t a t 0.22 FTU.
Note t h a t t h e r a t e of head loss bui ld-up i s , a s expec ted ,