Page 1
1
WTO Accession and Performance of
Chinese Manufacturing Firms
Loren Brandt, Johannes Van Biesebroeck,
Luhang Wang, and Yifan Zhang§
March 24, 2017
Abstract
We examine the effects of the trade liberalization that accompanied China’s WTO
accession on the evolution of markups and productivity of Chinese manufacturing
firms. Although these two dimensions of performance cannot be separately
identified when firm output is measured by revenue, we show that detailed price
deflators make it possible to estimate the average effect of industry-level tariff
reductions on both dimensions separately. Several novel findings emerge. First,
cuts in output tariffs reduce markups, but raise productivity. Second, the pro-
competitive effects are most important for incumbents, while efficiency gains
dominate for new entrants. Third, cuts in input tariffs raise both markups and
productivity. We highlight several mechanisms operating in liberalized sectors that
help explain our findings in the Chinese context. Liberalized sectors saw an increase
in the exit of private firms and more frequent replacement of management in badly
performing state-owned firms. Both patterns are likely to reduce agency problems.
The initial productivity of new entrants is higher in more open sectors. And while
lower input tariffs had only a limited role in increasing access to imported
intermediates, they had a strong price-reducing effect, even on domestically
produced intermediates.
We thank seminar participants at Columbia, Frankfurt, Nottingham, Princeton, Yale, the World Bank, and
Zurich, and several conferences for comments. Special thanks to Jan De Loecker for extensive feedback on
estimation and identification problems. Financial support from ERC grant No. 241127, SSHRC, and CFI/OIT is
gratefully acknowledged.
§ Brandt: University of Toronto; Van Biesebroeck (Corresponding author): KU Leuven and CEPR,
Naamsestraat 69, 3000 Leuven, Belgium, E-mail: [email protected] ; Wang: Xiamen University;
Zhang: Chinese University of Hong Kong.
Page 2
2
“The competition arising [from WTO membership] will also promote a more rapid and more healthy
development of China’s national economy”
Premier Zhu Rongji (Press release, Washington, DC, April 1999)
1 Introduction
China’s manufacturing sector experienced impressive productivity growth over much of the 1990s and
2000s before the onset of the Great Recession (Brandt, Van Biesebroeck and Zhang, 2012). Expanded
access to international markets and export growth are often cited as key drivers of this improvement
(Yu, 2014; Khandelwal, Schott and Wei, 2013).1 Largely neglected is the impact on local firms of
reforms that facilitated access to China’s domestic market for the rest of the world. Chinese leaders
such as Premier Zhu Rongji, constrained by domestic political economy considerations in their efforts
to restructure major segments of industry, believed that reforms required as a condition for WTO
accession would be an important catalyst for change.2
A large literature examines the effects of trade liberalizing reforms on productivity, but there is little
work estimating the effects of these same policies on markups. An advantage of looking at markups
compared to productivity is that they can be estimated without observing firm-level prices. A
complication is that, in addition to efficiency gains, they also capture effects on equilibrium prices in
output and input markets. From the definition of the markup, i.e. the ratio of price to marginal cost, we
can decompose trade-induced changes in output prices into changes in markups, input prices, and
production efficiency. These correspond to three independent, welfare-enhancing effects of trade
liberalization. First, lowering import tariffs increases competition and induces firms with market power
to lower their markups (Levinsohn, 1993). This behavior raises consumer surplus at the expense of
producer surplus, but also reduces allocative distortions. Second, lowering tariffs on imports of
intermediate goods directly reduces marginal costs (Tybout and Westbrook, 1995). And third, marginal
costs can also fall due to higher productivity or efficiency. While all three mechanisms, ceteris paribus,
reduce output prices and raise welfare, the second two will increase markups unless pass-through of cost
savings is perfect. The relationship between the markup and gains from trade is thus not monotonic, but
depends on the mechanism at work.3
We use firm-level data that covers most of the manufacturing sector in China to investigate the role
of domestic trade liberalization over a period that spans China’s entry into the WTO in 2001. Our results
indicate that differences in performance across industries are systematically related to variation in tariff
reductions. Although productivity cannot be separately identified from the markup when one does not
observe firm-level output and input prices (Garcia and Voigtländer, 2013), our interest is not in the
levels, but rather in the covariance of the performance dimensions with tariffs. The productivity measure
that we estimate using detailed industry-level price deflators to deflate nominal values contains firm-
specific price deviations from the average price evolution. However, these price deviations are by
construction uncorrelated with changes in industry-level tariffs if the regression applies the same weight
1 The important consequences of these changes for global welfare have been noted as well, see di Giovanni,
Levchenko and Zhang (2014) and Autor, Dorn and Hanson (2013).
2 The sentiments in the quote above, made after ironing out final details about the WTO accession with
President Clinton, is echoed by several researchers. For example, Branstetter and Lardy (2008) also view more
competition as an essential source of pressure that forced structural reforms.
3 Moreover, while the last two mechanisms are expected to raise markups, the extent depends on the pass-
through of cost savings into prices, further complicating the link from markups to welfare.
Page 3
3
to firms as their products receive in the construction of the industry deflator. Thus, if price deflators
and tariff cuts are observed at the same level of detail, it is possible to estimate the average effect of
trade liberalization separately on efficiency and markups.
We estimate the production function and recover markups as in De Loecker and Warzynski (2012),
who implement the estimator proposed by Ackerberg, Caves and Frazer (2016). Consistent estimation
in the absence of firm-specific price information requires that the unobservable firm heterogeneity can
be represented by a single-dimensional state variable (Ackerberg et al., 2007). In this case, the control
function that absorbs the effects of unobservable productivity differences controls for both endogenous
input choices and the possible endogeneity of output or input prices (De Loecker et al. 2016). ‘Revenue’
TFP, so-called TFPR, is obtained as a residual of the production function.
Our first contribution is to separately identify the effects on firm-level markups of reducing output
tariffs and tariffs applied to an industry’s inputs, as Amiti and Konings (2007) originally did for
productivity. We find a negative effect of input tariffs on markups, which reflects their direct effect on
input prices. The effect of output tariffs, on the other hand, is positive, but only statistically significant
if we use firm weights. Trade liberalization reduces markups of larger firms, but has no significant
effect on the average over the entire sample. Note that this effect introduces a systematic relationship
between the deviations of firm-specific prices from the industry price deflator. The gap will be
decreasing in size, i.e. positive for small firms that do not adjust their markup and negative for large
firms. As a result, if all firms are given equal weight, the coefficient on output tariffs in the productivity
regression will be biased downwards, and the productivity-boosting effect of trade liberalization will be
overestimated. The use of within-industry firm weights corrects for this.
Our second contribution is to contrast effects on markups with those on productivity in order to
provide insights into the mechanisms through which trade liberalization effects materialize. Our results
for China confirm that lower input tariffs lead to higher productivity, as was the case for Indonesia
(Amiti and Konings, 2007) and India (Topolova and Khandelwal, 2011). 4 For a Cobb-Douglas
production function, the effect of an external factor on the markup can be decomposed into an effect on
TFP and the net impact of opposing effects on output and input prices (De Loecker and Goldberg, 2014).
Given that we find a larger effect of input tariffs on productivity than on markups (in absolute value),
the pass-through of cost savings into lower output prices must outweigh the direct input price effect of
the input tariff cut. This is only possible if the cost savings include some efficiency gains.
In contrast with the studies mentioned above, we find that cuts in output tariffs also raise productivity,
indicating that more competition triggers efficiency improvements.5 Combined with the insignificant
coefficient of output tariffs in the markup regression, our results imply that competition puts downward
pressure on output prices and that most efficiency gains are passed on to consumers. This is consistent
with the directly estimated effect of tariffs on output prices which is of a similar magnitude as the effect
on productivity, but has an opposite sign. For large firms, the pro-competitive and price-reducing effect
even dominates and the coefficient on markups turns positive.
4 Note that the average effect on input prices is already accounted for through the effect on the input price
deflator and we should interpret the effect on productivity as an efficiency effect. Separate price regressions show
a remarkably strong effect of tariff reductions on domestic price deflators, even exceeding the share of imports in
domestic consumption.
5 When Amiti and Konings (2007) include both tariff rates in their productivity regression, the input tariff
coefficient is six times the size of the output tariff coefficient, and the latter is statistically insignificant when they
cluster standard errors at the industry-year level. The output tariff coefficient is only significant at the 10% level
in Topolova and Khandelwal (2011) who cluster only at the firm level.
Page 4
4
Our third contribution is to obtain further insights into the mechanisms by decomposing the aggregate
effect. Several of the patterns that we document are intuitive. The pro-competitive effect of output
tariff cuts on markups only shows up robustly for incumbents, who are more likely to possess market
power. The efficiency gains associated with input tariff cuts are much stronger for new entrants, who
likely have more flexibility to adjust their production process and take advantage of the new
opportunities. We find some efficiency gains for incumbents, but they are offset by a deterioration in
resource allocation as the correlation between market share growth and the firm-level productivity level
becomes weaker in sectors where input tariffs fall the most.
One pattern unique to China is a significant negative effect of output tariffs on TFP, even after
controlling for input tariffs. Effects of trade liberalization in other countries point mostly to benefits
from the availability or cheaper access to imported intermediates, but we find that their share in total
input use barely increased in China.6 The productivity effects in China show up for both incumbents
and new entrants. For incumbent firms, one plausible mechanism is that increased competition affects
the agency problem between managers and owners. It can both strengthen incentives to make
productivity-enhancing investments (Raith, 2003; Chen, 2014) and weaken resistance to productivity-
enhancing reorganizations (Schmitz, 2005). For private firms, we show that the probability of exit
increases in liberalized industries, providing direct performance incentives through a greater threat of
bankruptcy. For state-owned firms that face softer budget constraints, we show that the probability of
replacing the CEO after a spell of low growth increases, pointing to a deliberate change in governance
practice. A separate channel we document is a higher initial productivity for entrants relative to
incumbents in liberalized industries. With stronger competition, selection at entry becomes more
stringent which raises the relative productivity of successful entrants, as in the model with spatial
competition of Syverson (2004). This pattern is consistent with the large role that Khandelwal et al.
(2013) attribute to net entry in explaining the surge in Chinese exports after the removal of textile quotas.
Our results are most closely related to the work of De Loecker et al. (2016) for India. In a similar
specification as ours, they also find a strong negative relationship between markups and input tariffs,
but no significant relationship between markups and output tariffs. They emphasize that cost-reducing
effects of trade liberalization, either directly through input prices or indirectly through improved
efficiency as we found in China, give firms a strong incentive to raise markups. Since they observe
firm-level prices, they are able to construct an estimate for marginal cost. Once controlled for, they find
an unambiguous pro-competitive effect of output tariff cuts on markups. Their point estimates of this
effect for India is remarkably similar to the (combined) effect we estimate for China: each percentage
point reduction in output tariffs lowers markups between 0.10 and 0.15 log-points.
Two other studies have looked at the impact of trade liberalization on markups, but focus on markup
dispersion and its effect on resource misallocation. Edmond, Midrigan and Xu (2015) calculate gains
from trade by comparing the observed equilibrium for Taiwan with a simulated autarky situation,
assuming oligopolistic competition throughout. They find that the pro-competitive effect in
concentrated industries has a first-order effect on welfare by reducing misallocation and this effect is
increasing in the cross-country correlation in sectoral productivity. Lu and Yu (2015) show that the
dispersion in markups in China decreased following its entry in the WTO, mostly due to a relative
decline at the top which is consistent with our findings.
6 Lower input tariffs have a strong price-reducing effect in upstream industries, even for domestically produced
intermediates, but the average effect is already controlled for through the (input) price deflators. These benefits
could include higher quality of imported inputs that are not be fully reflected in prices or greater input variety that
generates a production complementarity (Halpern, Koren and Szeidl, 2015).
Page 5
5
Finally, our findings are related to several strands in the literature that aim to understand the
aggregate productivity effects of trade liberalization. Decomposing aggregate changes, several
influential studies highlight the important benefits due to exit of unproductive firms (Eslava et al., 2013)
and the reallocation of market share away from unproductive firms (Pavcnik, 2002). The theoretical
framework that Arkolakis et al. (2012) use to assess the gains from trade does not allow any role for
within-firm productivity growth, which we estimate to be an important mechanism in China. Moreover,
complementarity between trade and industrial policy has been a central issue in the study of transitions
to a market economy (Murphy, Shleifer and Vishny, 1992). Our estimates provide micro-level evidence
for the complementarity between trade liberalization on one hand and deregulation of firm entry or
reforming loss-making state-owned firms on the other.7
The remainder of the paper is organized as follows. Section 2 discusses the relevant policy history
that led to increased international competition in China. Section 3 provides a conceptual framework for
the analysis and discusses estimation issues. Section 4 describes the data. Section 5 shows the impact
of tariff reductions on several margins and in Section 6 we discuss corroborating evidence for several
mechanisms that could explain the estimated effects. Section 7 concludes.
2 Increased international competition
2.1 Policy regime
In the late 1970s China embarked on a radical path of economic reforms. Opening the economy to the
rest of the world was an integral part of these reforms from the beginning. China established four Special
Economic Zones in 1980 and Economic and Technical Development Zones in fourteen coastal cities in
1984, to encourage entry of foreign direct investment (FDI) and the development of a manufacturing
export sector through the importation of much-needed capital, managerial know-how, and technology.
Outside of these zones it allowed the importation and licensing of new technologies and capital goods
as part of a policy to modernize existing domestic enterprises. It concurrently reduced tariff and non-
tariff barriers on a unilateral basis and extended direct trading rights to more firms, culminating in its
entry into the World Trade Organization (WTO) at the end of 2001.
Even before its accession to WTO, China’s manufacturing sector was already relatively open on
several dimensions. First, as part of its policy of encouraging FDI for exporting, China exempted mostly
foreign firms involved in export processing from tariffs on imported raw materials, intermediates, and
capital equipment. Exemption of import duties was expanded in the second half of the 1990s to certain
types of domestic firms. Branstetter and Lardy (2008) report that in 2000 less than 40 percent of imports
were subject to tariffs. Second, beginning in the early 1990s, China started to reduce its domestic tariffs,
from 43.2 percent in 1992 (unweighted average at the 8-digit HS level) to 15.3 in 2001. These measures
were accompanied by a reduction in the share of imports regulated by non-tariff barriers through licenses
and quotas (Branstetter and Lardy, p. 635). This process continued as part of its negotiated WTO entry,
only now some tariff reductions were less voluntary.
China’s renewed openness complemented reform initiatives geared towards the domestic economy.
Thousands of state and collective-owned enterprises were either sold off or allowed to go bankrupt,
7 Using cross-country regressions, Freund and Bolaky (2008) establish a similar connection between trade
liberalization and deregulation of entry at the aggregate level.
Page 6
6
while entry restrictions on domestic private firms were relaxed tremendously.8 Imperceptible in the
mid-1990s, employment in private firms rose to almost one-third of manufacturing employment by 2007
(Brandt et al. 2012). These wide-ranging reforms served as catalyst for economic growth that has
averaged nearly 8 percent per annum in per capita terms since the start of reforms.
2.2 Quantifying the extent of trade liberalization
We obtained import tariff rates at the 8-digit level of the Harmonized System (HS) product classification
from the World Bank’s WITS dataset. We map them into China’s Industrial Classification (CIC) system
at the 4-digit level (424 manufacturing industries) to obtain output tariffs that we use in the firm and
industry-level analysis.9 To avoid any bias in the industry average due to low trade volumes in heavily
protected product lines, we use an unweighted average. Input tariffs are a weighted average of output
tariffs, using as weights the industry input shares from the 2002 Input-Output (IO) table. Reflecting the
higher level of aggregation of the Chinese IO table, the input tariffs are effectively at the 3-digit level.
By constructing a consistent industry classification over time, accounting for important changes in 2003,
we obtain a measure of inward tariff protection at the industry level that is comparable over the period
from 1994 to 2007.
Figure 1 shows the evolution of import tariffs including several years before our sample period. A
number of patterns stand out. First, tariff reduction proceeded in spurts, with large and widespread
reductions occurring between 1994 and 1997, and then again in 2002; reductions are more gradual and
idiosyncratic in other years. Second, output tariffs were on average substantially higher than input
tariffs, reflecting the different treatment of final goods from raw materials, intermediates inputs and
capital imports. And third, by the end of the period the median output tariff was only 7.5 percent, far
below the average for countries with a similar income level as China. The gap between the median
output and input tariff also narrowed to less than two percentage points.
[Insert Figure 1 approximately here]
The average evolution hides important variation both across industries and within industries over
time that we exploit to estimate the effects of the trade liberalization on productivity and markups. The
shaded area in Figure 1 denotes the inter-quartile range for industry output tariffs, and the dashed lines
the corresponding inter-quartile range for input tariffs. Industries initially differed tremendously in the
protection they received. The narrowing of the two bands over time highlights the important tariff
compression: For output tariffs, the inter-quartile range declined from 18-55 percent in 1994 to 6-12
percent in 2007. As a result, the extent of trade liberalization experienced by industries often differed
substantially.
Non-tariff barriers (NTBs) and restrictions on foreign investment were also part of the policy
landscape. Annual circulars of the Ministry of Foreign Trade and Economic Cooperation and the
Ministry of Commerce provide information on the licensing of imports and exports, as well as FDI
8 Revision of the constitution in 1999, for example, improved the political environment for private
entrepreneurs, while amendments in 2004 signaled better safeguards for private property rights.
9 We extend the HS–CIC concordance table constructed by the NBS to include all manufactured products (HS)
and manufacturing industries (CIC) and correct several mistakes. Changes in the HS system in 2002 (affecting
nearly ten percent of all product lines) and in the CIC system in 2003 required multiple concordance tables.
Page 7
7
restrictions.10 In some sectors foreign firms were required to work with a domestic partner, while in
others they were prohibited from entering entirely. In Figure 2, we graph the fraction of industries that
contain at least one 8-digit product line subject to some form of FDI restriction. The number declined
from a high of 87 (out of 424 industries) in 1995 to 47 in 2007, with most of the liberalization happening
at the moment of WTO entry. The decline is more rapid for the restrictions than for outright prohibitions,
which made up one-fifth of the total in 2007. The total number of industries subject to some form of
import licenses also fell, but the decline was both less monotonic and more drastic. After a brief rise
from 15.3 percent in 1997 to 22.6 percent in 2000, it declined to only 1.2 percent in 2007.
[Insert Figure 2 approximately here]
In our analysis, we use import tariffs as the key explanatory variables because they provide the most
accurate and detailed information on trade openness. The overall pattern of trade liberalization is
apparent for all three indicators shown in Figure 2. In the cross-section, the correlation between the
different forms of protection is significantly positive in 1997. By 2007, however, the correlations
between tariffs and either NTBs or FDI restrictions had become very weak, reflecting the convergence
of import tariffs to a fairly uniform level in all industries and the dwindling importance of recorded
NTBs.
2.3 Endogeneity of tariffs
There are two endogeneity concerns when using tariffs as explanatory variable for the extent of trade
liberalization. A first concern is reverse causality. A negative association between tariffs and
productivity might not be due to lower tariffs inducing improved productivity, but to policymakers
lowering tariffs selectively only in industries that are able to compete with less expensive imports, for
example, in industries experiencing a productivity spurt. A second concern is misattribution. Industry
characteristics that are merely correlated with tariff cuts might be the real reason for the subsequent
productivity growth.
There are several reasons why the first of these concerns is unlikely to be a serious problem. The
low remaining variation in tariff rates by 2007 implies that there was little room for policy discretion in
tariff reductions. The inter-quartile range for output tariffs was only 6-12 percent at the end of the
sample period and for input tariffs the range was even narrower, 5-7 percent. The average import tariff
declined from 44 to 10 percent between 1992 and 2007, but equally remarkable was the decline in the
standard deviation across industries from 28 to 7 percent. Moreover, the partial correlation between
tariff rates in the first and last year is extremely high at 0.70. An industry’s relative protection in 2007
is well explained by its initial protection.
Figure 3 shows this pattern explicitly, plotting the change in import tariffs between 1992 and 2007
on the vertical axis against the initial level on the horizontal axis. The dispersion of protection across
industries is extremely wide in 1992, with nine industries receiving protection of more than 100 percent.
By 2007, only a single industry had an import tariff above 40 percent and only nine were above 25
percent. The relationship between tariff reduction and initial protection is almost one-to-one, as can be
seen from the close fit with the dashed line, which has a slope of -1.
10 The Chinese government first published the Catalogue for the Guidance of Foreign Investment Industries
in 1995. It was revised in 1997, 2002, 2004, 2007, 2011 and 2014. It classifies all industries, which we mapped
into the CIC classification, into “encourage”, “permit”, “restrict” and “prohibit” categories.
Page 8
8
[Insert Figure 3 approximately here]
The bottom panel of Figure 3 shows that there is more heterogeneity in the extent of tariff reductions
in the post-WTO period (2001-2007). There could be some policy endogeneity, but only in an expected
sense as tariff cuts after 2001 were already fixed in the WTO accession agreement. For these cuts to
depend on an industry’s strong productivity evolution, this performance either had to be predicted at the
time of negotiations or, more plausibly, actual tariffs had to deviate from the agreed rates. We observe
some deviations and to rule out this form of policy endogeneity, we use the rates from the accession
agreement, which were mostly fixed by 1999, as instruments for the actual tariff rates.11 We report this
first stage regression for the period between 2002 and 2007 in Column (5) of Table 1. The maximum
tariff level is a good predictor of the actual tariff and the coefficient below one suggests that tariff
reductions were often implemented earlier than the accession agreement mandated.
To investigate more formally whether industry variation in trade liberalization is related to past
performance, we regress changes in tariffs between 1998 and 2007 on initial productivity, similar to
Topalova and Khandelwal (2011). Because we estimate productivity separately for each two-digit
sector, comparisons of productivity levels are only valid within these sectors. We resolve this in two
ways. First, when using the initial level of TFP in 1998, we include two-digit sector dummies such that
we only compare productivity levels between 4-digit industries within the same 2-digit sector. Second,
we use TFP growth in the three years prior to 1998, exploiting variation in pre-1998 productivity trends
across all 4-digit industries.
The baseline results in columns (1) and (2) of Table 1 show that neither of these two measures of
initial productivity is correlated with the subsequent tariff cuts. Only when both measures are included
simultaneously, in column (3), are the point estimates marginally significant, but they are of opposite
signs and equally important in size (we report beta-coefficients, normalizing both variables by their
standard deviation). More productive industries receive deeper tariff cuts, but industries experiencing
faster productively growth before 1998 receive smaller tariff cuts afterwards. The latter relationship is
in line with the expressed goal of using WTO entry as a catalyst for reforming lagging sectors in
manufacturing, and it works against the reverse causality concern in the analysis below.
[Insert Table 1 approximately here]
Once we include additional controls, in column (4), the correlation between tariff cuts and initial
productivity disappears entirely. These controls include previous and concurrent export performance,
indicators for the type of good produced (intermediate, capital or consumer goods), and a number of US
and Chinese industry characteristics that are predictive of cross-industry tariff variation in 1998. As
noted above, a potential concern is that industry characteristics correlated with tariffs cuts might be the
real source of the subsequent productivity growth. Exports, for example, grew rapidly following WTO
entry and a strong export performance of an industry could raise its domestic productivity. However,
we do not find any relationship between sectoral differences in export growth and tariff cuts. In fact,
very few industry-level characteristics are correlated with the tariff changes. In the performance
regressions below, we will control for industry-fixed effects at the 4-digit level, as well as employment
levels and shares of state and foreign-owned firms.
11 This instrument does not resolve endogeneity caused by policymakers’ correct anticipation of future
performance when negotiating the WTO agreement. However, the inclusion of industry-fixed effects, a substantial
lag between the negotiations and much of our sample period, and great uncertainty regarding industries’ future
performance in the Chinese high-growth environment makes this a secondary concern.
Page 9
9
3 Empirical framework
Estimating equation
To identify the effects of tariff reductions, we follow the two-step approach of Pavcnik (2002). We
first construct the performance measures 𝑦𝑖𝑡 , starting with firm-level price-cost markups and
productivity. We next regress them on the indicators of trade openness, i.e. one-year lagged output and
input tariffs at the industry level,
𝑦𝑖𝑡 = 𝛼𝑂 output tariff𝑠𝑡−1 + 𝛼𝐼 input tariff𝑠𝑡−1 + 𝑍𝑠𝑡𝛾 + 𝛾𝑡 + 𝛾𝑖 + 𝛾𝑠 + 𝜖𝑖𝑡 , (1)
where we include a vector of time-varying industry controls (𝑍𝑠𝑡) and year-fixed effects (𝛾𝑡). . .We.
include. firm-fixed effects (𝛾𝑖)..and. in. the. few. cases. where. the. sample. contains. firms that switch
industries we also include industry-fixed effects (𝛾𝑠). In the post-WTO period we instrument the applied
import tariffs with the pre-determined maximum tariffs rates in the WTO agreement, as discussed above.
Because of the firm-fixed effects, the coefficients of interest are identified from the correlation
between the average growth rate of 𝑦𝑖𝑡.across.all.firms.in. industry s.and.the.change.in.import.tariffs.
applied.to.the.output.or.inputs.of.industry s. The year-fixed effects control for the average growth rate
for the entire manufacturing sector and the average evolution of import tariffs. We investigate
robustness by estimating a specification that introduces 2-digit sector by year interaction fixed effects,
in which case only the deviations across 4-digit industries within each 2-digit sector contribute to the
identification. In a final set of regressions, where the objective is to investigate where in the productivity
distribution new firms enter, we omit the firm-fixed effects.
We use a variation of equation (1) without firm-fixed effects for the industry-level.regressions where
the performance variables 𝑦𝑠𝑡 are price indices and four decomposition terms for the growth in average
markup or productivity. We calculate these decompositions over two sub-periods and pool them such
that we can use industry-fixed effects. Identification still comes from the correlation between industry-
variation in growth rates and tariff changes. Finally, we can estimate the same regression using product-
level imports as a dependent variable with product-fixed effects included.
Standard errors in firm-level regressions are clustered two-ways: (1) At the industry-year level since
the explanatory variables of interest only vary at that level; and (2) at the firm level to account for
possible serial correlation in the dependent variable. In regressions using industry-year or product-year
observations, standard errors are clustered at the industry or product level.
Markup
To measure the effects of trade liberalization on markups, we calculate the price-cost ratio as in De
Loecker and Warzynski (2012):
𝜇𝑖𝑡 = (𝑝𝑄
𝑀𝐶)𝑖𝑡
=𝛽𝑚
�̃�𝑖𝑡𝑀 , with 𝑠𝑖𝑡
𝑀 =exp(𝑚𝑖𝑡
𝑛 )
exp(𝑟𝑖𝑡 − 𝜖�̂�𝑡) . (2)
The markup is the ratio of the output elasticity 𝛽𝑚 for a variable input to the corresponding adjusted
revenue share 𝑠𝑖𝑡𝑀 (using the nominal variables 𝑟𝑖𝑡 and 𝑚𝑖𝑡
𝑛 ). An important advantage of this approach
is that it provides a measure of firm performance that varies with market power without having to make
functional form assumptions on demand or behavioral assumptions on competition. We use materials
and intermediate inputs as our variable input because firms can adjust this more flexibly than either
capital or labor use, and it is least likely to suffer from measurement error.
Page 10
10
The intuition for equation (2) is as follows. Holding other inputs fixed, the marginal product of
material inputs declines in the intensity of their use. In a competitive situation, the firm faces a fixed
output price, and maximizes profit at output level at which the marginal value product of material inputs
equals their price. At this point, the output elasticity equals the revenue share and the ratio in (2) equals
one. In contrast, an output elasticity larger than the revenue share indicates that the firm decided not to
increase material input use to exploit fully its marginal productivity; instead, the firm exercised market
power and raised the final good price, producing a lower quantity of output and purchasing less inputs.
With a Cobb-Douglas production function, the numerator of equation (2) is simply the coefficient on
material inputs. If we use ln(𝜇𝑖𝑡) as the dependent variable, the numerator is absorbed by the industry
or firm-fixed effects and the expression simplifies to − ln(𝑠𝑖𝑡𝑀). We still have to estimate the production
function to calculate the markup in order to adjust the material share by the idiosyncratic productivity
shock 𝜖�̂�𝑡,.which.is.recovered in the first stage of the production function estimation. As a result, we are
not able to calculate the markup in the first year of the sample. With a more flexible production function,
the log-markup would additionally depend on a firm-specific output elasticity ln 𝛽𝑚𝑖 , but even the
average of this elasticity over the sample period would be absorbed by the firm-fixed effect. We only
fail to control for changes in the firm-specific output elasticity ln(𝛽𝑚𝑖𝑡/�̅�𝑚𝑖) that are correlated with
the trade liberalization.
Productivity
Our second dependent variable is revenue productivity (TFPR), obtained as a residual from a gross-
output production function estimated separately for each 2-digit sector. Nominal output and material
inputs are deflated by industry-level price indices. As mentioned, we assume a Cobb-Douglas functional
form for the underlying physical production function:
𝑞𝑖𝑡 = 𝛽𝑘𝑘𝑖𝑡 + 𝛽𝑙𝑙𝑖𝑡 + 𝛽𝑚𝑚𝑖𝑡 +𝜔𝑖𝑡 + 𝜖𝑖𝑡 .
In the absence of firm-level output and input prices, we rewrite it using deflated nominal variables:
�̃�𝑖𝑡 = 𝛽𝑘�̃�𝑖𝑡 + 𝛽𝑙𝑙𝑖𝑡 + 𝛽𝑚�̃�𝑖𝑡 + (𝑝𝑖𝑡𝑄− 𝑝𝑡
𝑄) − 𝛽𝑚 (𝑝𝑖𝑡
𝑀 − 𝑝𝑡𝑀) + 𝜔𝑖𝑡 + 𝜖𝑖𝑡 , (3)
where deflated revenue �̃�𝑖𝑡 equals 𝑞𝑖𝑡 + 𝑝𝑖𝑡𝑄 − 𝑝𝑡
𝑄, with a similar expression for materials. �̃�𝑖𝑡 is a
measure of real capital using a capital deflator.12 Employment is measured by the number of workers.
We distinguish between a persistent productivity term 𝜔𝑖𝑡 and an idiosyncratic term 𝜖𝑖𝑡 that captures
transitory productivity shocks and measurement error. As firms condition input decisions on 𝜔𝑖𝑡 ,
consistent estimation of (3) faces an endogeneity problem. We implement the GMM estimator of De
Loecker and Warzynski (2012) that implicitly inverts the material input demand equation to obtain a
proxy for unobserved productivity. Relying on the persistence in productivity, we use lagged material
inputs to make sure the exclusion restriction is satisfied. Importantly, as argued by De Loecker (2013),
we explicitly introduce the policy variables of interest in the equation governing the evolution of firm-
level productivity, which makes the tariffs also appear in the control function. This proved vital to
obtain reasonable point estimates, which is intuitive since firms’ input demand (or investment) is likely
to shift with trade liberalization.
12 If one suspected firm-level differences in capital prices to be important as well, it would introduce an
additional price-deviation term.
Page 11
11
It is well known that using nominal variables introduces firm-specific price deviations in the error of
equation (3), which leads to a second endogeneity problem. The lack of output prices can be overcome
with an explicit demand function, as in De Loecker (2011), or with additional data, as in Lu and Yu
(2015). However, information on the full price vector of inputs is rarely available and even then one
needs to observe the exact input mix for each firm to construct an appropriate price index. Multiproduct
firms pose additional problems, as discussed by De Loecker and Goldberg (2014), since the output mix
needs to be observed as well. When input expenditure is only recorded at the firm level, estimation is
only possible if all products are produced with the same production technology.
Several factors are likely to limit the severity of this problem. First, we use a detailed price deflator
at the 4-digit industry level that already captures price evolutions common to all firms in a narrowly
defined industry. Estimates below show that the industry price index adjusts strongly to tariffs and these
effects are already controlled for. Second, differences between firm-specific deviations from output and
input price indices appear with opposite signs in the estimating equation. To the extent that firms paying
higher input prices also charge higher output prices, the two terms cancel out. In the absence of input
prices, it might be better not to control for either form of price variation than only control for output
prices (De Loecker and Goldberg, 2014). Third, consistent estimation is not a problem if firm-specific
price variation is a monotonic function of the same state variable that also determines the firm’s input
choices. In the estimation, the non-parametric proxy for unobservable productivity differences already
controls for this factor, as shown explicitly in De Loecker et al. (2016). Fundamentally, it assumes that
the unobservable firm heterogeneity can be represented by a single-dimensional state variable.
Firm-level growth in deflated productivity, i.e. the residual from equation (3), is an estimate of the
following expression:
Δ𝑇𝐹𝑃𝑅𝑖𝑡 = Δ𝜔𝑖𝑡 + Δ𝜖𝑖𝑡 + (Δ𝑝𝑖𝑡𝑄 − Δ𝑝𝑡
𝑄) − 𝛽𝑚 (Δ𝑝𝑖𝑡𝑀 − Δ𝑝𝑡
𝑀). (4)
By construction this expression is only correlated with industry-level variables such as output or input
tariffs through the first term on the right hand side if we use the same weights in the regression as in the
construction of the sectoral price indices. In that case, the price deviations are mean zero for each
industry-year and guaranteed to be uncorrelated with industry-level tariff rates. Hence, it is possible to
draw inferences about the productivity effects of tariff declines independently from effects on
markups.13 In the discussion of results we will thus interpret the effects of changes in industry-level
tariffs on TFPR as efficiency effects, even though the efficiency level of firms is not identified.
Relationship between markup and productivity effects
A similar time-difference of the markup evolution amounts to
Δ ln 𝜇𝑖𝑡 = Δ𝑝𝑖𝑡𝑄 − ΔMC(
−Δ𝜔𝑖𝑡,
+Δ𝑝𝑖𝑡
𝑊, Δ𝑞𝑖𝑡 ), (5)
with Δ𝑝𝑖𝑡𝑊 representing a vector of all factor price changes. If the production function takes a constant
returns-to-scale Cobb-Douglas form and all inputs are variable in the short run, the change in the log-
13 Equation (4) in De Loecker and Goldberg (2014) shows the same relationship in levels. Our comparison
between different industries over time is in contrast with Garcia and Voigtländer (2013) who compare exporters
and non-exporters, in which case Δ refers to a difference between two types of firms. As they further assume that
all firms face the same input prices, differences between firms in revenue productivity and price-cost margin are
identical.
Page 12
12
markup simplifies to Δ𝜔𝑖𝑡 + Δ𝑝𝑖𝑡𝑄− 𝛽𝑊Δ𝑝𝑖𝑡
𝑊, subtracting a linear combination of factor price changes
using the appropriate weights from the production function.
Effects of tariff cuts on markups differ from the effects on productivity by the additional effects on
output and input prices, which work in opposite directions. A reduction in input tariffs, for example,
lowers input costs and would, ceteris paribus, raise markups. But if the firm passes some cost savings
on to consumers in the form of lower prices, markups will increase by less than the decrease in marginal
costs. Similarly a trade-induced productivity gain will have a smaller effect on the markup than in the
productivity regression if some of its effect is passed on to consumers in the form of lower output prices.
Equation (5) suggests that in principle it is possible to recover efficiency effects from the total effect
of tariffs on markups by subtracting the differential effect on output and input prices, which we estimate
separately. We will use this to validate the estimated effect of tariff changes on productivity. In practice,
several measurement issues make such decomposition less than exact. First, industry prices need to
reflect correctly the average output prices charged by all firms in the sample. Compositional changes
in the group of active firms due to tariff cuts need to be reflected immediately in the price indices.
Second, the input price index must reflect the price faced by the average firm for its entire input bundle.
Differences across firms within the same industry in their input mix makes the input price index for the
industry that is constructed using input-output tables a theoretical construct that is inherently only correct
on average. Third, the linear relationship between productivity, markups and input prices is only
appropriate for a Cobb-Douglas production function. And fourth, if some inputs are not variable in the
short run, changes in output quantities will also influence marginal costs and introduce yet another
wedge between productivity and markup effects.
Aggregation & decomposition
To quantify the additional effects of tariff cuts through reallocation, we decompose the change in
average industry productivity or mark-up into a within-firm term and three between-firm terms. We
combine the approach in Haltiwanger (1997), normalizing current levels of firm i by 𝑦𝑠𝑡−𝑘, the average
for industry s in the initial period t-k, with time-average weights for continuing firm (�̅�𝑖.and.�̅�𝑖) as used
by Griliches and Regev (1995). It amounts to splitting a third covariance term, containing 𝛥𝑠𝑖𝑡𝛥𝑦𝑖𝑡
interactions, equally between the first two terms:
𝛥𝑦𝑠𝑡 =∑(�̅�𝑖 𝛥𝑦𝑖𝑡⏟ + 𝛥𝑠𝑖𝑡 [�̅�𝑖 − 𝑦𝑠𝑡−𝑘]⏟ )
𝑖∈𝐶
+∑𝑠𝑖𝑡 [𝑦𝑖𝑡 − 𝑦𝑠𝑡−𝑘]
𝑖∈𝐸
−∑𝑠𝑖𝑡−𝑘 [𝑦𝑖𝑡−𝑘 − 𝑦𝑠𝑡−𝑘]
𝑖∈𝑋
(6)
where C, E, and X denote the sets of continuing, entering, and exiting firms, respectively, in industry s.
The decomposition in (6) is exact for an industry aggregate growth 𝛥𝑦𝑠𝑡 that is defined as the change
in a share weighted average of firm-level 𝑦𝑖𝑡. We are not interested in the absolute magnitude of each
term, but in the strength of the correlation with tariff changes, which we measure by using each term as
the dependent variable in a separate regression. The first term measures within-firm growth and should
mimic results from the firm-level regressions. The second, between-firm term, contributes positively to
aggregate growth if trade liberalization helps firms with above average 𝑦𝑖𝑡 (𝑇𝐹𝑃𝑅𝑖𝑡 or ln 𝜇𝑖𝑡) to increase
their market share. The third, the entry term, contributes positively if entrants tend to have higher levels
of 𝑦𝑖𝑡 relative to incumbents in liberalized sectors. The fourth term, measuring the exit margin, makes
a positive contribution if trade liberalization disproportionately forces the least productive or lowest
markup firms to exit.
Page 13
13
4 Data
We use annual data for 1998-2007 that includes information for all state-owned industrial firms and
non-state owned firms with sales above 5 million RMB. The information is collected through annual
surveys by China’s National Bureau of Statistics (NBS) and discussed in detail in Brandt et al. (2014).
Aggregates for employment, sales, capital, and exports for these firms match almost perfectly the totals
reported annually in China’s Statistical Yearbook. Compared to the universe of firms observed in the
2004 Economic Census, our sample of above-scale industrial firms represents the bulk of industrial
activity in China. In 2004, they accounted for 91 percent of the gross output, 71 percent of employment,
97 percent of exports, and 91 percent of total fixed assets.
Our final dataset is an unbalanced panel that increases from 145,511 firms in 1998 to 311,323 firms
in 2007. As firm IDs often change due to restructuring or M&A activity, we utilize information on
firms’ name, industry, and address to establish links over time. Only four percent of the links rely on
this additional information, but one-sixth of the firms that are observed for more than one year
experience a change in their official ID at some point. To estimate firm-level productivity we use the
following variables: total production (output), use of materials, intermediates and service inputs
(materials), total employment (labor), and the real capital stock constructed from fixed assets
information using the algorithm discussed in Brandt et al. (2012).
We utilize information on firms’ registered type (qiye dengji zhuce leixing) to construct ownership
categories. For types that include firms with mixed ownership, we assigned the category with the largest
ownership share in registered capital. Firms are grouped into three categories: state, foreign, which
includes subsidiaries of firms from Hong Kong, Macao or Taiwan (HMT), and private, which includes
township & village enterprises and joint ventures with local governments. Other firm characteristics
used in the analysis are the location (province), year of establishment, and export status.
To deal with changes in the Chinese Industry Classification (CIC) codes in 2003, some industries are
merged to obtain a consistent classification over the entire sample period.14 The industry characteristics
used in Table 1 are merged in at this level. Chinese industry characteristics are constructed from the
information in the 1995 and 2004 industrial censuses. US characteristics are taken from the FTC and
described in Ravenscraft and Wagner (1991). The trade policy instruments that were discussed before—
tariffs, non-tariff barriers, and FDI restrictions—are aggregated to the same level. Import flows by trade
type (ordinary or processing trade) and type of importer (regular or trading firm) are from China’s
Customs Office and are aggregated to the 6-digit HS product level.15
Price deflators
To construct an output deflator at the most detailed level possible, we use information from the 1998-
2003 firm surveys. For these years, firms were asked to report the value of their output in nominal terms
as well as in real prices using a set of ‘reference prices’ provided by the NBS.16 The ratio of nominal to
14 The industry concordance as well as deflators, tariff rates, the input-output table, and programs to construct
the firm panel and real capital stock are available online at http://feb.kuleuven.be/public/N07057/CHINA/
appendix/.
15 Trading companies are identified by the following words in the firm name: 贸易, 进出口, 经贸, 工贸, 外经, 外贸.
16 Before 1993, most industrial firms only reported output in reference prices; from 1993 onwards, the NBS
additionally asked to report current price output. In 2004, the NBS stopped collecting the constant price output
series, claiming that as industrial firms’ innovation accelerated, many new varieties of products emerged, and
frequently determining and updating all constant price became too costly.
Page 14
14
real output provides a firm-specific index of a firm’s price level in that year relative to the base year of
the reference prices. The change in this index between two years measures the firm-specific price
change, which we average to the four-digit industry level. We drop as outliers those observations for
which the price change differs by more than half of the standard deviation from the mean, or
approximately 15-25% of observations. We then recalculate the weighted average price change for each
industry, using current output weights. Annual price changes are linked over time to construct an output
deflator for each of the 425 four-digit industries.
We extend the series forward for the remainder of the sample period, to 2007, using a two-digit (39
industries) ex-factory price index constructed by the NBS that we take from China’s Statistical
Yearbook. When investigating the impact of tariff reductions on domestic prices, we show results for
two alternative price series as robustness checks: using the two-digit NBS price series for the entire
sample period and using a less conservative deflator constructed from the firm-level information, but
only dropping outliers that see a price change that is at least one standard deviation different from the
mean change (dropping 8% of observations). Results in Table A.1 in the Appendix show that all three
series are highly correlated at the 2-digit level.
The input price deflator for each industry is constructed as a weighted average of the output deflators
of all manufacturing industries, using as weights the input shares from the 2002 National Input-Output
(IO) table. As the IO table only distinguishes 80 industrial sectors, which is less detailed than the
industry classification used in the firm-level data, we constructed a concordance table linking the two
classifications. We calculate an aggregate output price index for each IO sector as an output-weighted
average of the underlying industry prices and then obtain the input price deflator for each IO sector as
an input-share weighted average of these output deflators. The same input weights are used to construct
input tariffs for each sector based on the output tariffs for all manufacturing sectors.
5 Results
5.1 Effects of trade liberalization on firm-level markups and productivity
Imports and domestic prices
We measure industry variation in the extent of trade liberalization by tariff reductions rather than the
resulting import growth. One reason is that tariffs immediately reflect the policy change and firms might
change their behavior anticipating future import growth. The change in import penetration is likely to
have a more gradual effect on domestic firms. A second reason is that tariff reductions can trigger
domestic price responses, in which case the observed import growth underestimates the increased
competition. The evidence for the Brazilian cement industry in Salvo (2010) provides an extreme
illustration. Following a reduction in import tariffs, limit-pricing by a domestic cartel kept imports out
entirely, even though competitive pressure greatly increased and profits fell.
Estimates in panel (a) of Table 2 use imports at the product level, aggregated from detailed trade
transaction records at the firm-product-destination level from China’s Customs, as dependent variable.
They show that following China’s WTO entry, tariff reductions lead to strong import growth. We
excluded imports entering China as processing trade that was exempt from import duties, approximately
Page 15
15
one half of the total, and focused on growth in ordinary trade.17 Using the same specification at the
product level as we use below for markups and productivity, we find an average semi-elasticity of tariffs
on import flows of -3.1. The response is highest (equal to -4.3) for intermediate inputs, the largest
product category, and slightly smaller (equal to -2.8) when we do not instrument the tariff change. With
ordinary trade imports growing at an annual rate of 13.7%, the average tariff decline of 1.2% per year
accounts for approximately one quarter of the import growth.
[Insert Table 2 approximately here]
With trade liberalization, domestic firms not only lose market share to imports; tariff cuts also lead
to lower domestic prices. This is shown in panel (b) of Table 2 using similar regressions, now using the
domestic (output) deflator as dependent variable. The estimates in row (i) are for the benchmark
deflator, using detailed 4-digit price deflators from Brandt et al. (2012), which are available between
1998 and 2003, extended to the end of the sample period using the 2-digit deflators that the Chinese
NBS calculates. The estimates in column (ii) use an alternative price series where fewer outliers are
dropped in the construction of the detailed deflator. Row (iii) uses the more aggregate 2-digit price
deflator throughout.
The point estimates indicate that the effect of tariff cuts on domestic prices is both large and estimated
relatively precisely. A one-percentage point reduction in import tariffs leads on average to a 0.30 percent
price reduction. Given that import penetration averages only 10 percent, this strong price response
suggests not only a large pass-through of tariff declines into the prices of imported goods, but also that
domestic producers adjust their local prices in response to these cuts.18
The estimates are notably higher for some product categories than for others. In columns (2)-(5), we
report estimates for separate product categories defined using the Broad Economic Classification of
goods.19 Prices of materials (column 2) and intermediate inputs (column 3) are most sensitive to tariff
changes, suggesting that price competition is strongest in those sectors. Recall that the import response
was also most pronounced for intermediate inputs. Prices for capital goods (in column 4) are less
responsive to tariffs and for consumer goods there is no significant effect over the full sample period
using any of the three deflators. Brandt and Thun (2010) provide evidence for China that suggests
domestically produced and imported capital or consumer goods often compete in different market
segments, which helps shelter domestic firms from import competition.
Markups
A price reduction following a tariff cut can be due to lower markups, lower input prices, or higher
efficiency. As we constructed separate variables to measure tariffs applied to each industry’s output and
inputs and we estimated firm-level markups and productivity as separate performance variables, we now
investigate the relative strength of different mechanisms using the specification of equation (1). We
17 The effects reported in Table 2 are for imports not entering through trading companies, which represent a
significant but declining portion of imports over this period. Results are qualitatively similar for trading companies
which are included in the regression, but are allowed to be affected differentially by import tariffs.
18 Note that competition can lower prices in two ways: either, direct by lowering markups, or indirectly by
triggering actions that lead to efficiency gains.
19 The BEC categories are partitioned into four product groups as follows: materials (111, 21, 31), intermediate
goods (121, 22, 322, 42, 53), consumer goods (112, 122, 61-63), and capital goods (41, 51, 52).
Page 16
16
include firm-fixed effects such that all coefficients are identified from changes over time. Results are
based on a sample of firms that did not switch between different 4-digit industries.20
In panel (a) of Table 3 we report baseline results for firm-level markups using three weighting
schemes: no weights, within-industry output shares, and total output weights. With only one exception,
the effects of input and output tariffs on markups are of opposite signs.21 Lowering input tariffs leads
to higher markups, as expected. It directly reduces marginal costs and as long as these cost savings are
not perfectly passed on to consumers, markups should increase. In the even-numbered columns, we
supplement the firm-fixed effects with sector-year interaction fixed effects which greatly raises the
absolute size of the point estimate. This is a mechanical result as the input tariff variable is constructed
using the Chinese input-output table and only varies at the 3-digit level. More of its variation is already
absorbed by the interaction fixed effects than is the case for the more disaggregate output tariffs. The
mean effect of a one standard deviation reduction in input tariffs (which is now much smaller) on the
firm-level dependent variable is of similar magnitude in the odd and even numbered columns. A one-
percentage point decline in input tariffs on top of the average decline of the sectoral average implies a
much larger change.22
[Insert Table 3 approximately here]
In contrast, a reduction in output tariffs leads to lower markups (positive coefficient in Table 3), and
is the net result of two opposing effects. On the one hand, the increase in foreign competition can spur
firms to implement efficiency-raising investments, which raises markups if the resulting cost savings
are not perfectly passed-on. On the other hand, the pro-competitive effect of the tariff reductions is
likely to depress markups as firms adjust their optimal pricing. The point estimates indicate that the
latter effect dominates for large firms since the positive coefficient only turns statistically significant if
we weight observations within industry by size, as we do in columns (3) and (4). Weighting industries
differently as well, as happens when we use absolute output weights in columns (5) and (6), further
increases the absolute magnitude of the coefficient, i.e. the markup-reducing effect.
The combined effect we estimate is smaller than the point estimate of 0.109 for India in De Loecker
et al. (2016) obtained using a similar specification, but for a product-level markup. As they use a small
sample with relatively large firms, the most comparable estimate is the 0.095 effect we report in column
(4) which implies that each percentage point decline in the output tariff lowers the markup by 0.1
percent. The trade liberalization over the entire 1998-2007 period reduced markups by approximately
1.1% permanently. Given a median markup over all sectors of around 26%, this is a rather small effect.
20 Approximately twenty percent of firms switched industry at least once over the sample period. Our
motivation for dropping them is two-fold: first, for firms that switched between 2-digit sectors, their markup and
productivity estimates are incomparable over time; and second, for firms switching industries it is not obvious
which (lagged) tariff rates to include, which might bias our estimates.
21 Standard errors in Table 3 are clustered two-ways, at the industry-year and at the firm level. If we cluster at
the industry level, the output tariff coefficient becomes statistically insignificant in the markup regression in
column (3a), while remaining insignificant in columns (1a) and (2a); in the productivity regression the output
tariff coefficient in column (4b) becomes insignificantly different from zero, while other coefficients remain
significant, but only at a lower level.
22 We do not observe the same increase in the (absolute) input tariff coefficient in the productivity regression.
The reason is that the production function parameters are estimated at the 2-digit level. In that regression, the
dependent variable also sees a substantial reduction in standard error after controlling for the interaction FE.
Page 17
17
The estimated effect of input tariff reductions on markups goes in the other direction and is of much
larger magnitude such that the average markup rises with trade liberalization, as in De Loecker et al.
(2016). A point estimate of zero would indicate that the entire cost saving is passed on to customers,
which we can reject for all estimates except in column (3). If there was no pass-through at all, the point
estimate should equal the share of intermediates in marginal cost (88%) multiplied by the average effect
of the input tariff reduction on input prices (49%).23 Hence, each percentage point cut in input tariffs
should increase the markup by 0.43% in the absence of any pass-through. The estimate of -0.23 in (1a)
(without weighting) suggests that firms retain more than half of the surplus gain, which may seem large
given the strong competition we expect to prevail in many Chinese industries. However, this calculation
ignores that as trade liberalization lowers input prices and thus marginal costs, a profit maximizing firm
with market power is expected to raise its markup. If that is the case, the estimated coefficient implies
a larger rate of pass-through than calculated above.
Note that the inclusion of the input tariffs in the markup regression already controls for one effect of
trade liberalization through lower input prices, but to the extent that efficiency gains raise markups, the
pro-competitive effect itself will be higher than the output tariff coefficient. The results of De Loecker
et al. (2016) for India do not attribute an important role for increased efficiency. As they observe firm-
level prices, they can control explicitly for marginal costs—which controls for both input cost reductions
and efficiency gains. As a result, their point estimate, reflecting only the pro-competitive effects,
increases to 0.143. We do not observe firm-level prices to perform a similar exercise, but as argued
above we can look directly at the effect of trade liberalization on productivity to isolate any efficiency
effect.
Productivity
The estimated effects of tariff reductions on firm-level (revenue) productivity are net of the average
price evolutions in each industry. The average price responses shown in Table 2 are netted out and the
remaining firm-level price deviations in equation (3) will not be correlated with industry tariffs if we
use appropriate weights. We therefore focus on estimates in columns (3) to (6), which are the only
effects of tariffs on productivity (TFPR) that can be interpreted as efficiency effects. All point estimates
are negative suggesting that both type of tariff declines promote efficiency gains.
The most notable difference with the results for markups is that the coefficient on the output tariff is
now estimated to be consistently negative, equal to -0.176 for the preferred estimator in column (3). As
the output price responses to tariff cuts in Table 2 were larger than the markup responses in panel (a) of
Table 3, we could already deduce that Chinese firms must have implemented efficiency-enhancing
changes. Effects are slightly smaller (in absolute value) if we use sector-year interaction fixed effects,
in column (4), but differences are not statistically significant for the two sets of fixed effects using any
of the three weighting schemes.
It is instructive to note that point estimates on output tariffs are larger in absolute value without
weights than with weights. We saw earlier that markups only fell with output tariff reductions if we
weight firms by size and thus identify the effect primarily from the responses of larger firms. The more
negative effects on input tariffs without weights than with weights further point to lower prices for larger
firms in liberalized sectors. Small firms are thus more likely to have a positive deviation between firm-
level prices and the sectoral average in more liberalized industries and the reverse for larger firms. As
these price deviations ends up in the TFP variable, it will erroneously induce a stronger negative
23 A median share of intermediates in revenue of 70% with a median markup of 26% implies a cost share of
intermediates of 88%.
Page 18
18
relationship between tariffs and TFP if each of the many small firms receives the same weight as the
few large firms. This prediction is borne out in Table 1, as can be seen comparing results without and
with weights. Results in columns (1) and (2) are biased downward in a predictable way.
The point estimates on the input tariffs are always estimated strongly negative, with benchmark
estimates in columns (3) and (4) equal to -1.79 and -1.62. They are much larger in absolute value than
the output tariff effects. The total impact of input tariff reductions on output prices are the sum of three
effects—on productivity, on input prices, and on markups—and we can use this decomposition to
deduce the rate of pass-through. The estimated efficiency increase in column (4b) implies that a one
percentage point reduction in input tariffs lowers output prices by 1.6 percent. Results in Table 2 implies
that tariff declines show up in domestic prices at a rate of 0.30 percent for each percentage point
reduction and pro-rated this should lower output prices by a further 0.26 percent. The point estimate of
input tariffs on the markup of -0.73 in (4a) suggests that more of the cost savings are passed-on to
consumers in the form of lower prices than kept by the firm as a larger mark-up (which totals 0.63 or
1.62 – 0.26 – 0.73), a similar conclusion as before.
The pattern of a robust and significantly negative coefficient on output tariffs in the TFP regression
even when we control for input tariffs, is in contrast with the experience of many other developing
countries examined in the literature, including Brazil (Schor, 2004), Indonesia (Amiti and Konings,
2007), and India (Topalova and Khandelwal, 2011; De Loecker et al., 2016). In those countries, the
effect of output tariffs on productivity becomes insignificant once input tariffs are added to the
regression. Several factors unique to the Chinese manufacturing sector, such as the large scale of the
internal market, its early export success in a wide variety of products, and the important presence of
foreign-owned firms, are likely to lower the benefits associated with improved access to high quality
imported inputs. At the same time, the presence of state-owned firms with sizable monopoly power
raises the potential benefit of increasing import competition. These and other factors will be discussed
below in Section 6.
Finally, we verify whether the differential impact of tariffs on markup and productivity is consistent
with the wedge that output and input prices drives between them, as illustrated by equation (5). In the
constant returns-to-scale case, the difference in the effects of a tariff reduction on the markup and on
productivity should equal the effect of such tariff reduction on Δ𝑝𝑖𝑡𝑄 − 𝛽𝑊Δ𝑝𝑖𝑡
𝑊, with the last term a
weighted average of input price changes for all input factors entering marginal costs. For output tariffs,
the difference in effects equals 0.246 in column (3) and 0.202 in column (4). These are broadly in line
with the 0.296 average effect of tariffs on prices shown in Table 2, which is the only relevant mechanism
as output tariff cuts do not affect prices of input factors (𝑝𝑖𝑡𝑊). For input tariffs, the coefficient is
generally estimated to be more negative in the TFP regression than in the markup regression, which
implies that on balance an input tariff reduction leads to a lower output price.
We can learn more about the underlying mechanisms by estimating whether trade liberalization has
heterogeneous effects on different sub-groups of firms. For example, we find that efficiency gains
following output tariff cuts are larger in the period after WTO entry or in coastal provinces. A difficulty,
however, is that the tariff rates can be correlated with the firm-specific price-deviations remaining in the
productivity estimates if different sub-groups experience systematically different price evolutions.
When we allow the markup effects to differ across groups, we find for example that the pro-competitive
effects were stronger in the period before WTO entry and for older firms or exporters. This is not
unexpected for the latter two groups as we already found markup effects to be increasing in firm size,
but it implies that we cannot interpret productivity effects anymore on these subgroups.
Page 19
19
Decomposing industry performance
Another way to learn about the underlying mechanisms for the trade liberalization effects is by
identifying how strongly the contribution to the industry-average markup or aggregate productivity of
different groups of firms—incumbents, entrants, or exiting firms—correlates with the tariff rates. We
accomplish this by using the four terms on the right-hand side of equation (6) as dependent variables:
within-firm changes, between-firm reallocation, entry, and minus-exit. As discussed, we performed the
decomposition separately for the pre- and post-WTO periods and pool growth rates across the two sub-
periods and industries for a total of 844 observations. Results are reported in Table 4.
[Insert Table 4 approximately here]
For the total effects at the industry level in column (1), the signs on both tariff variables are the same
as for the firm-level results in Table 3. It is intuitive that the magnitudes in the first specification with
industry-fixed effects are closer to the within-industry share weighted results, while the magnitudes in
the second specification with industry-year weights are closer to the earlier results using absolute output
shares. Because of the linear decomposition and linear regression, the effects of tariffs on the four terms
in the decomposition listed in columns (2)-(5), sum exactly to the coefficient estimate on the total in
column (1).
The results with industry-fixed effects that weight all industries the same are unequivocal in the
attribution: The effect of output tariffs on markups, which combines the pro-competitive and the
efficiency effect, operates almost entirely through the within-firm margin, while the increase in markups
due to lower input tariffs is due to new entrants. When we weight industries by output, the overall
effects become stronger and for both tariff variables incumbents and entrants play some role, but it
remains the case that the behavior of incumbents dominates the output tariff effects, while entrants
dominate the input tariff effect.
The effects on aggregate productivity in panel (b) are also driven primarily by the within and entry
channels, but they are the result of different types of firm-level adjustments. The strongly negative
output tariff coefficient in column (2c) suggests that existing firms in liberalized industries are forced to
improve their efficiency, but this does not translate into improved markups, as seen in (2a). In liberalized
industries, new firms enter with weakly lower price-cost markups, see (4a), which makes it harder for
them to recover their entry costs. They enter, however, with higher relative productivity, indicating that
the selection mechanism in these industries is more stringent.
The entry channel is particularly important when we use industry-fixed effects and implicitly assign
all industries the same weight. In that case, the absolute magnitude of the coefficient on input tariffs in
the productivity regression for entrants is also notable. It suggests that new firms have greater flexibility
to take advantage of opportunities to improve efficiency by exploiting the availability and lower cost of
imported intermediates, which are often of higher quality. We should note, however, that the
decomposition of the productivity effect comes with the same caveat as before. To the extent that
different groups have systematically different price evolutions, the firm-specific price deviations that
remain in the productivity measures might be correlated with tariff declines. For example, we saw in
panel (a) that entrants do not show the same decline in markup as incumbents (within term) in liberalized
sectors. As a result, we are likely to overestimate their productivity level (as a group) which could partly
explain the very negative coefficient (-0.428) for them in panel (b).
There is only one term, the “between” term in column (3), that has coefficients with opposite signs.
This is most striking, but also an intuitive pattern, in the case of the input tariff coefficient in the
productivity regression. Industries where input tariffs decline more, experience less of a shift in output
Page 20
20
shares from underperforming to better performing firms. The best firms are not able to grab additional
market share while weaker firms maintain their share. It leads to a lower correlation between changes
in output share and performance and is a drag on aggregate performance, offsetting some of the
beneficial effects of input tariff liberalization.
One notable finding that holds for both dependent variables, both explanatory variables, and both
specifications is the absence of any significant effects at the exit margin. In the Chinese high-growth
context, the exit of low productivity firms contributes only marginally to aggregate productivity growth
(Brandt et al. 2012). The results in column (5) further indicate that this contribution is almost entirely
uncorrelated with tariff rates. The competitive selection mechanism (e.g. Melitz, 2003) predicts that
with lower output tariffs, the least productive firms will be forced to exit as they lose market share to
imports and cannot cover their fixed cost of operation anymore. The negative coefficients on the output
tariffs in the regression using the negative of the exit term as dependent variable, in (5c) and (5d), are
consistent with this mechanism, but the highly insignificant point estimates indicate this channel is
extremely weak.
Government behavior may have prevented the exit mechanism from playing its usual role, especially
in strategic and pillar sectors. China 2030, a joint report from 2013 by the World Bank and China’s
Development Research Center documents the institutional constraints on exit of both state-owned and
other enterprises. After the establishment of the State-owned Assets Supervision and Administration
Commission (SASAC) in 2003, the downsizing in the state sector that was prominent in the late 1990s
and early 2000s more or less stopped.
6 Discussion of underlying mechanisms
Pro-competitive effects of output tariff reductions
The direct pro-competitive effect of imports through their downward pressure on domestic price-cost
margins is easy to understand and a widely expected consequence of trade liberalization. This prediction
has been derived under a number of setups. Levinsohn (2003) uses an oligopoly model that includes a
market conduct parameter and a single local demand elasticity. Melitz and Ottaviano (2008) assume
monopolistic competition and a linear demand system with horizontal product differentiation. Trade
liberalization and the resulting import increase shifts the residual demand curves of surviving firms
down, who respond by lowering their markup. Edmond, Midrigan and Xu (2015) use an oligopoly
model and CES preferences, but assume that domestic goods are closer substitutes for each other than
for imports. The implicit demand elasticity faced by domestic firms depends on an industry’s import
penetration and the elasticity increases following trade liberalization. Firms adjust by lowering their
markups. In their application to Taiwan, this price disciplining effect dominates the overall welfare
effects from trade and is almost entirely due to industries with only one or two domestic firms.
Trade liberalization can have an indirect, but opposing effect on the price-cost markup. If it lowers
the marginal cost of surviving firms, through lower input prices or efficiency gains, there can be an
offsetting, upward pressure on markups if price elasticities are lower further down the demand curve
(De Loecker et al. 2016). Alternatively, if it leads to the exit of less productive, high marginal cost firms
that tend to charge low markups, the reallocation of market share to more productive firms will also
increase the average markup (Arkolakis et al. 2015).
Our finding that output tariff reductions are associated with lower markups indicates that these
indirect effects might mitigate the direct markup-reducing effect, but they do not overturn it.
Page 21
21
Increased imports of intermediate inputs
The recent trade literature stresses an entirely different channel, namely that trade liberalization can
raise domestic productivity through an input effect. Halpern, Koren, and Szeidl (2009) describe two
static sources of gains from trade. First, quality advantages of imported inputs might not be entirely
reflected in their price. Second, a complementarity in production can raise the aggregate production
function in a love-of-variety sense. A third, dynamic benefit is described in Goldberg et al. (2010).
They adopt a production structure from endogenous growth models with a domestic production cost that
declines in the number of imported input varieties. When the range of imports expands following trade
liberalization, the domestic industry endogenously raises its productivity and is able to introduce new
products. De Loecker and Goldberg (2014) show that in a simplified model this input mechanism
introduces an additional term in the production function. This unobservable term is increasing in the
number of imported intermediates and ends up in the residual of the production function and thus in
measured productivity.
For China, the results in Table 3 indicate a strong link between input tariff cuts and firm-level
productivity and results in Table 4 suggest that at the industry level the effect is of a similar magnitude
as the effect from output tariff cuts. This is in contrast with findings for other developing countries
where most of the impact of trade liberalization worked through imported intermediates. We can look
directly at the relative increase in the use of imported inputs using a dataset that matches the detailed
trade transactions in China’s Customs records to the firm-level sample. 24 We rely on the BEC
classification to identify imports that are unprocessed or processed intermediate goods (categories 121,
22, 42, and 53) or materials (categories 111, 21 and 31). We use this information in two ways: first, to
estimate the fraction of manufacturing firms that use imported inputs, and second, to calculate the share
of intermediate input use reported in the firm-level data that consist of imports.
[Insert Table 5 approximately here]
The estimates in Table 5 illustrate that in spite of a huge increase in total Chinese imports, the
importance of imported intermediate inputs remains very low for Chinese manufacturing firms. The
percentage of firms directly importing intermediate inputs increased only slightly from 9.6 to 10.9
between 2000 and 2007. A disproportionate share of this increase comes from firms in the processing
trade regime. Their inputs enter the country duty-free and do not benefit from the reduction in input
tariffs.25 It is likely that the type of inputs that these firms require is not as easily found domestically.
The share of imported intermediates in total inputs across all firms that we were able to match even
decreased from 29.1 to 27.3 percent over the same period. It is consistent with the evidence of increased
domestic sourcing by Chinese firms in Kee and Tang (2016). Less than 10 percent of inputs enter
through the ordinary trade regime, facing import duties, and this share barely increased. It is unlikely
that access to imported intermediates is the dominant channel through which the estimated productivity
effect is realized. The share differs hugely across ownership types and firm-level regressions similar to
those reported in Table 2 indicate that imports of private firms engaged only in ordinary trade are the
24 In 2006, approximately one half of total imports by value are accounted for. The balance is imports by firms
that could not be matched, including trading firms that act as agents for firms importing indirectly and imports by
non-manufacturing firms such as retailers. Over time, the role of trading companies declined as more firms
obtained direct trading rights. As a result, the statistics in Table 5 might even overestimate the increase in both
the fraction of firms using imported intermediate goods and their share of inputs.
25 The sum of the two forms of trade in columns (2a) and (3a) exceeds the total in column (1a) because some
firms import under both regimes.
Page 22
22
most responsive to tariff cuts. However, imported inputs represent on average only 1 percent of their
total input use and thus cannot account for much of their productivity growth.
In panel (c) we report a similar calculation, but now reflecting the share of imported intermediates
for the entire manufacturing sector, i.e. not limited to the matched sample of firms. We divide aggregate
imports for all BEC categories of intermediate inputs and materials by total input use in manufacturing.26
This overall share is virtually unchanged over the period, but for ordinary imports it increases modestly
from 7.2 to 7.5 percent. The share of imports is lower for the entire manufacturing sector than for the
matched sample, but the relative importance of ordinary trade imports is higher. Both patterns are
intuitive since more important importers are more likely to be matched. Most importantly, the key
finding is unchanged: Imported inputs that are subject to import tariffs were not very important in 2000
and this changed little following the decline in input tariffs.
Agency Issues
A finding unique to the Chinese context is that both the firm-level and sector-level analysis point to
within-firm improvements in productivity following an output tariff reduction. As increased competition
squeezes markups and threatens firms’ survival, it should induce firms to make productivity-enhancing
changes. The literature has considered several channels through which these type of efficiency gains
could be realized, such as the utilization of “trapped factors” (Bloom et al. 2011), accelerated adoption
of new technology (Ederington and McCalman, 2009), or a greater willingness of the workforce to
accept changes to work practices (Schmitz, 2005).
Yet another channel are changes in the incentive structure and equilibrium effort level of managers
in models with agency costs, as in Schmidt (1997), Raith (2003), and Chen (2014). Given the well-
documented problems with incentivizing managers in state-owned enterprises, we expect this channel
to be especially important in a transition economy like China. In the NBS data we observe the name of
the legal person representative of most firms, typically the top manager which we will denote by CEO.27
This information allows us to construct an indicator for the replacement of top managers and test whether
competition leads to changes in the incentive structure they face.
In theory, the relationship between competition and the optimal incentive scheme is ambiguous.
Schmidt (1997) argues that a “threat-of-liquidation effect” and a “value-of-a-cost-reduction effect” can
have opposing effects. The first effect of increased competition is to increase the risk of bankruptcy
which raises the expected cost for a manager of providing sub-optimal effort. The second effect reflects
that conditional on survival, the potential value of cost-saving innovations is likely to decrease with
competition due to a lower market share or profit margin. When the manager’s participation constraint
binds, the first channel dominates and tougher competition unambiguously improves incentives for
effort. Raith (2003) further shows that depending on the form of competition and exit options, the value
of a cost reduction could even increase with competition, further strengthening the positive effect on
effort.
26 To calculate total input use in manufacturing, we use the sum of inputs over all firms in the NBS firm-level
sample, but that underestimates the total due to the exclusion of below-scale firms. We construct a second estimate
based on national accounts data, but rely on an estimate of the value added to gross output ratio. If this increases
over time, as shown in Kee and Tang (2016), it overstates growth in input use. To average out both biases, we use
a geometric mean of both estimates for the denominator.
27 For three years, 1998-2000, the NBS data provides in addition to the name also the title of the “legal person
representative” Only 16% of observations list the chairman of the board of directors (董事长), while more than
80% list the general manager (总经理 or 厂长).
Page 23
23
Before investigating the impact of increased competition on CEO turnover, we first compare
performance, measured here by output growth or firm survival, between state-owned and privately-
owned firms. We expect more severe agency problems for state-owned enterprises (SOEs) and estimate
how the performance gap varies with output tariffs. Results in column (1) of Table 6 show that SOEs
tend to grow more slowly than private firms and the difference increases with the level of tariff
protection. The estimates in column (2) further indicate that SOEs have a lower survival rate and,
importantly, this difference increases with tariff protection. A higher likelihood of exit following trade
liberalization provides increased incentives for effort provision for managers in private firms, but this
mechanism is not operating for SOEs. Lingering soft budget constraints for the SOEs help explain their
weaker growth performance after trade liberalization, as shown in column (1).
[Insert Table 6 approximately here]
The results in columns (3) and (4), however, suggest that the government chooses to strengthen direct
oversight of management in SOEs. In the absence of an automatic effect on effort through a greater risk
of bankruptcy, they adjust the incentive scheme for CEOs when an industry is liberalized. We measure
performance-incentives with the probability of replacing a firm’s legal person representative when
performance is bad. For a dummy dependent variable that indicates CEO turnover, we find a negative
coefficient on output growth as well as on output growth interacted with the SOE dummy. Weaker
growth is associated with a higher likelihood of CEO turnover on average, and especially for SOEs.
The specification reported in column (4) adds interactions of all variables with the output tariff. For
private firms, the negative point estimate on the interaction between growth and tariffs indicates that
higher competition (lower tariff) weakens the association between firm growth and the likelihood of
CEO replacement. The increased likelihood of bankruptcy, see column (2), already provides sufficient
effort incentives after liberalization. For state-owned firms, however, the triple interaction term has a
positive coefficient and outweighs the negative effect. For these firms, increased competition
strengthens the association between firm growth and the likelihood of CEO replacement. It confirms
the hypothesis that firms suffering from more severe agency problems adopt higher-powered incentive
schemes to induce effort when competition increases.28
Productivity levels of new entrants
A notable finding from the decomposition in Table 4 is the strong correlation between output tariff
reductions and the contribution of new entrants to industry TFP growth. This effect could work through
higher entry rates or through the average productivity level of entering firms. Results in Table A.6 in
the Appendix show that output tariffs do not raise entry rates.29 Entry rates are high in most industries,
with the differences between sectors almost entirely unrelated to tariff reductions. Only in the post-
WTO period is there a positive relationship (negative coefficient), but the magnitude of the effect is very
small. Even if the full extent of tariff liberalization happened in a single year, it would raise the entry
rate by less than 1 percentage point.
We next compare the relative markups and productivity levels for different types of firms. In
particular, we verify whether new firms enter at different points in the distribution in industries that
experienced trade liberalization. We regress 𝑦𝑖𝑡 on firm-status categories, distinguishing between
28 Similar patterns have been documented in other contexts where the competitive environment varied across
industries, e.g. Giroud and Mueller (2010) and Cuñat and Guadalupe (2009).
29 The only systematic effect is for a decline in input tariffs to predict a lower number of active firms through
reduced entry rates, but this does not help to explain the impact on industry productivity in Table 4.
Page 24
24
incumbents, entrants, and exiting firms, interacted with both tariff variables. Importantly, we omit firm-
fixed effects and only include industry-fixed effects (to normalize the dependent variables by industry)
and firm-status interacted with year dummies (to control for changes in the sample composition and
differential evolution of performance). As a result, the effects are identified from comparing levels
across firms within each industry, not from the within-firm changes as in Table 3.
[Insert Table 7 approximately here]
The results in Table 7 show the same signs on all tariff variable interactions as in Table 3: an
insignificant coefficient on the output tariff in the markup regression and otherwise all negative
coefficients. It suggests that the mechanisms affect incumbent, entering, and exiting firms alike,
although there are a few patterns to note.
Most importantly, coefficients on both tariff measures in the productivity regression are estimated to
be larger (in absolute value) for new entrants. These firms adjust more strongly to the increased import
competition in their output markets as well as to the availability of cheaper inputs.30 The point estimates
imply that evaluated at the full tariff decline over the sample period the productivity of entrants increased
on average by 4.7 percentage points relative to incumbents in the same industry following trade
liberalization.31 The difference is proportionately larger in industries that experienced larger tariff
declines. For example, for industries experiencing tariff reductions of one standard deviation above the
mean, the relative productivity increase is 7 percent.
A second pattern that stands out is the large and significant estimate on the input tariff for entrants
in the productivity equation. Lowering input tariffs raises the productivity level of new entrants. The
channel we discussed before, i.e. firms benefitting from access to a greater variety and higher quality
foreign inputs, might be stronger for entrants that have more flexibility in adjusting their production
process and take advantage of new opportunities. Fan, Li and Yeaple (2015) propose a complementary
mechanism. In their model input tariff reductions provide incentives to upgrade product quality and
they provide empirical evidence for this in the case of Chinese exporters. Quality upgrades require fixed
cost investments and input tariff reductions provide the resources to finance such investment through
increased price-cost margins.
We estimated similar regressions as reported in Table 7 further distinguishing firms by ownership
type: private, state, or foreign owned. An interesting finding is that the pro-competitive effects of output
tariff reductions on markups are estimated almost the same for all entrants, regardless of ownership type,
while incumbent SOEs saw a smaller decline in liberalized sectors. Moreover, for exiting SOEs the
coefficient on output tariffs in the productivity regression is negative and significant. In liberalized
industries, these firms have a higher productivity level when they exit than in industries where
protectionism remained, indicative of a more stringent selection process.
As China transitioned to a more market-based economy, the relaxation of entry restrictions was
expected to generate considerable new firm entry. While entry rates do not correlate with tariff
reductions, the productivity level of entrants varies positively with the openness of an industry. Access
30 Note that the same caveat applies as for the results on the decomposition in Table 4. To distinguishing
productivity from markup effects for different types of firms one needs to assume that different groups do not
experience different price evolutions from the average captured by the industry price deflators. At least the markup
regression does not suggest a differential effect on pricing.
31 The cumulative reduction over the entire sample period averaged to 8 and 6 percent for output and input
tariff reductions, respectively, with standard deviations of 7.2 and 2.3.
Page 25
25
to low cost inputs makes it possible for entrants to produce with higher productivity, while lower output
tariffs reduce domestic prices and raise the productivity threshold that new entrants much achieve in
order be able to enter an industry profitably. A reduction in external barriers accelerated the exit of
unproductive SOEs. These results are consistent with other evidence from China in Khandelwal et al.
(2013), which shows that an important cost of textile quotas was their inefficient allocation. The end of
the Multi-Fiber Arrangement made it possible for more efficient entrants to capture a significant share
of the market and increase aggregate productivity. The influence on entry and exit patterns is but one
example of how trade liberalization interacts with domestic reforms.
7 Conclusions
The objective of this paper has been to analyze the impact of China’s domestic trade liberalization on
markups and productivity. Although these two performance measures cannot be separately identified
using our Chinese firm-level data, detailed price deflators allow us to distinguish the average effects of
tariff cuts on both measures separately.32 We find that input tariffs cuts raise both markups and TFP,
while output tariff cuts have two opposite effects: they lower markups, but raise TFP. Compared to
existing estimates in the literature, the negative and significant effect of output tariff reductions on TFP,
even after controlling for input tariffs, is the most novel.
While most of the empirical literature has been concerned with the effect of tariffs on continuing
firms, the theoretical literature emphasizes the important role for changes at the extensive margin.
Decomposing the industry-level effect reveals that in China the entry channel was critical in improving
resource allocation. It contributes more than half of the total effect of tariff changes on industry-level
productivity growth.
In the Chinese context, several mechanisms are important in explaining these patterns. First, for
output tariff cuts, the pro-competitive effect of trade liberalization on markups dominates countervailing
forces that increase markups at the firm level (due to lower marginal costs) and at the industry level (due
to a reallocation of output to more productive firms with larger markups). Second, the productivity-
enhancing effects of output tariff cuts can be linked to reduced agency problems amongst incumbent
firms, notably SOEs, and to a more positive selection of new entrants in sectors that liberalized most.
And third, contrary to other developing countries, access to a greater variety and higher quality inputs
is unlikely to be an important channel for productivity growth: Imported intermediates increased only
marginally as a share of total intermediate input use. Nonetheless, lower input tariffs that raise markups
contribute to productivity growth through providing additional resources for firms to implement
productivity-enhancing investments.
In terms of broader implications, our results highlight a complementary role of internal and external
reforms. Several features of the Chinese economy shaped the effects of trade liberalization and are
worth mentioning. First, a more liberal environment for inward FDI, which facilitated learning and
technology spillovers, preceded domestic market reforms. The presence of foreign-invested firms may
have diminished the importance of the mechanism working through imported inputs. Second, tariff
reductions were accompanied by domestic reforms to reduce the size of the state-owned sector and relax
restrictions on private firm entry. Epifani and Gancia (2011) show theoretically that welfare gains from
32 A limitation of the analysis is the absence of firm-specific prices, which requires additional assumptions to
estimate the production function. The detailed price deflators mitigate the measurement problem to some extent.
Using weights, we are able to distinguish between effects of tariff reductions on markups and productivity, but we
can only identify the average effect for each industry and we cannot distinguish effects for sub-groups of firms.
Page 26
26
trade liberalization are more likely to be positive under free entry, while asymmetric tariff reductions
might exacerbate misallocation and even reduce aggregate welfare if entry barriers are important. An
industrial policy that facilitates firm entry is complementary to trade liberalization, in line with the cross-
country evidence in Freund and Bolaky (2008) and with the evidence from the removal of textile quotas
in Khandelwal et al. (2013).
Our findings have implications for the welfare gains from trade. In particular, Arkolakis et al. (2012,
2015) show that in a broad class of models aggregate welfare gains can be captured a few sufficient
statistics. However, Edmond et al. (2015) have shown that welfare gains can be far greater in models
where trade reduces monopoly or duopoly power. De Loecker et al. (2016) further showed that
imperfect pass-through of input tariff reductions and price-cost margins that vary with output tariffs are
quantitatively important in India. Both of our findings, a within-firm productivity boost due to import
competition and a pre-selection of entrants that raises their productivity relative to incumbents add to
the list of factors not included in the class of models considered by Arkolakis et al. (2012, 2015).
Page 27
27
References
Ackerberg, Daniel A., C. Lanier Benkard, Steven Berry, and Ariel Pakes (2007). “Econometric tools for
analyzing market outcomes ” In James J. Heckman and Edward E. Leamer (eds.) Handbook of
Econometrics, Volume 6A, Elsevier.
Ackerberg, Daniel A., Kevin Caves, and Garth Frazer (2016). “Identification properties of recent
production function estimators.” Econometrica 83(6): 2411–2451.
Amiti, Mary and Jozef Konings (2007). “Trade liberalization, intermediate inputs and productivity:
Evidence from Indonesia ” American Economic Review 97(5): 1611–1638.
Arkolakis, Costas, Arnaud Costinot, Dave Donaldson, and Andrés Rodríguez-Clare (2015). “The
elusive pro-competitive effects of trade ” NBER Working Paper No. 21370.
Arkolakis, Costas, Arnaud Costinot, and Andrés Rodríguez-Clare (2012). “New trade models, same old
gains?’ American Economic Review 102(1): 94–130.
Autor, David H., David Dorn, and Gordon H. Hanson (2013). “The China syndrome: Local labor market
effects of import competition in the United States,” American Economic Review 103(6): 2121–2168.
Brandt, Loren and Eric Thun (2010). “The fight for the middle: Upgrading, competition, and industrial
development in China ” World Development 38(11): 1555–1574.
Brandt, Loren, Johannes Van Biesebroeck, and Yifan Zhang (2012). “Creative accounting or creative
destruction? Firm-level productivity growth in Chinese manufacturing ” Journal of Development
Economics 97(2): 339–351.
Brandt, Loren, Johannes Van Biesebroeck, and Yifan Zhang (2014). “Challenges of working with the
Chinese NBS firm-level data ” China Economic Review 30: 339–352.
Branstetter, Lee and Nicholas R. Lardy (2008). “China's embrace of globalization ” In Loren Brandt and
Tom G. Rawski (Eds.), China's Economic Transition: Origins, Mechanisms, and Consequences.
New York: Cambridge University Press.
Chen, Cheng (2014). “Import competition, agency problem, and aggregate productivity: Theory and
Evidence ” University of Hong Kong Working Paper.
Cuñat, Vicente and Maria Guadalupe (2009). “Globalization and the provision of incentives inside the
firm: The effect of foreign competition ” Journal of Labor Economics 27(2): 179–212.
De Loecker, Jan (2011). “Product differentiation, multiproduct firms, and estimating the impact of trade
liberalization on productivity.” Econometrica 79(5): 1407–1451.
De Loecker, Jan (2013). “Detecting learning by exporting ” American Economic Journal: Micro-
economics 5(3): 1–21.
De Loecker, Jan and Pinelopi K. Goldberg (2014). “Firm performance in a global market ” Annual
Review of Economics 6: 201–227.
De Loecker, Jan, Pinelopi K. Goldberg, Amit K. Khandelwal, and Nina Pavcnik (2016). “Prices,
markups and trade reform ” Econometrica 84(2): 445–510.
De Loecker, Jan and Frederic Warzynski (2012). “Markups and firm-level export status ” American
Economic Review 102(6): 2437–2471.
di Giovanni, Julian, Andrei A. Levchenko, and Jing Zhang (2014). “The global welfare impact of China:
Trade integration and technological change ” American Economic Journal: Macroeconomics 6(3):
153–183.
Ederington, Josh and Phil McCalman (2009). “The impact of trade liberalization on productivity within
and across industries: Theory and evidence ” Working Paper, University of California at Santa Cruz.
Page 28
28
Edmond, Chris, Virgiliu Midrigan, and Daniel Y. Xu (2015). “Competition, markups, and the gains
from international trade,” American Economic Review 105(10): 3183–3221.
Epifani, Paolo and Gino Gancia (2011). “Trade, markup heterogeneity and misallocations ” Journal of
International Economics 83: 1–13.
Eslava, Marcela, John C. Haltiwanger, Adriana Kugler, and Maurice Kugler (2013). “Trade and market
selection: Evidence from manufacturing plants in Colombia ” Review of Economic Dynamics 16(1):
135–158.
Freund, Caroline and Bineswaree Bolaky (2008). “Trade, regulations, and income ” Journal of
Development Economics 87(2): 309–321.
Fan, Haichao, Yao A. Li, and Stephen R. Yeaple (2015). “Trade liberalization, quality, and export
prices ” Review of Economics and Statistics 97(5): 1033–1051.
Garcia Marin, Alvaro and Nico Voigtländer (2013). “Exporting and plant-level efficiency gains: It’s in
the measure ” NBER Working Paper No. 19033.
Giroud, Xavier and Holger M. Mueller (2010). “Does corporate governance matter in competitive
industries? ” Journal of Financial Economics 95(3): 312–331.
Goldberg, Pinelopi K., Amit K. Khandelwal, Nina Pavcnik, and Petia Topalova (2010). “Imported inter-
mediate inputs and domestic productivity growth ” Quarterly Journal of Economics 125(4): 1727-67.
Griliches, Zvi and Haim Regev (1995). “Firm productivity in Israeli industry: 1979-1988 ” Journal of
Econometrics 65(1): 175–203.
Halpern, László, Milós Koren, and Adam Szeidl (2015). “Imported inputs and productivity ” American
Economic Review 105(12): 3660–3703.
Haltiwanger, John C. (1997). “Measuring and analyzing aggregate fluctuations: The importance of
building from microeconomic evidence ” Federal Reserve Bank St. Louis Review 79(3): 55–77.
Kee, Hiau Looi and Heiwai Tang (2016). “Domestic value added in exports: Theory and firm evidence
from China ” American Economic Review 106(6): 1402–1436.
Khandelwal, Amit K., Peter K. Schott, and Shang-Jin Wei (2013). “Trade liberalization and embedded
institutional reform: Evidence from Chinese exporters.” American Economic Review 103(6): 2169-95.
Levinsohn, James (1993). “Testing the imports-as-market-discipline hypothesis.” Journal of
International Economics, 35(1-2): 1–22.
Lu, Yi and Linhui Yu (2015). “Trade liberalization and markup dispersion: Evidence from China’s WTO
accession ” American Economic Journal: Applied Economics 7(4): 221–253.
Melitz, Marc J. (2003). “The impact of trade on intra-industry reallocations and aggregate industry
productivity ” Econometrica 71(6): 1695–1725.
Melitz, Marc J. and Gianmarco I.P. Ottaviano (2008). “Market size, trade, and productivity ” Review of
Economic Studies 75(1): 295–316.
Murphy, Kevin, Andrei Shleifer and Robert Vishny (1992). “The transition to a market economy:
Pitfalls of partial reform ” Quarterly Journal of Economics 107(3): 889–906.
Pavcnik, Nina (2002). “Trade liberalization, exit, and productivity improvement: Evidence from Chilean
plants ” Review of Economic Studies 69(1): 245–276.
Ravenscraft, David J. and Curtis L. Wagner III (1991). “The role of the FTC’s line of business data in
testing and expanding the theory of the firm. Journal of Law and Economics 34(2): 703–739.
Raith, Michael (2003). “Competition, risk, and managerial incentives ” American Economic Review
93(4): 1425–1436.
Page 29
29
Salvo, Alberto (2010). “Inferring market power under the threat of entry: The case of the Brazilian
cement industry ” RAND Journal of Economics 41(2): 326–350.
Schmidt, Klaus M. “Managerial incentives and product market competition.” Review of Economic
Studies 64(2): 191–213.
Schmitz Jr., James A. (2005). “What determines productivity? Lessons from the dramatic recovery of
the U.S. and Canadian iron ore industries following their early 1980s crisis ” Journal of Political
Economy 113(3): 582–625.
Schor, Adriana (2004). “Heterogeneous productivity response to tariff reduction. Evidence from
Brazilian manufacturing firms ” Journal of Development Economics 75(2): 373–396.
Syverson, Chad (2004). “Market structure and productivity: A concrete example ” Journal of Political
Economy 112(6): 1181–1222.
Topalova, Petia and Amit Khandelwal (2011). “Trade liberalization and firm productivity: The case of
India ” Review of Economics and Statistics 93(3): 995–1009.
Tybout, James R. and M. Daniel Westbrook (1995). “Trade liberalization and the dimensions of
efficiency change in Mexican manufacturing industries.” Journal of International Economics, 39(1-
2): 53–78.
Yu, Miaojie (2014). “Processing trade, tariff reductions and firm productivity: Evidence from Chinese
firms ” Economic Journal 125: 943–988.
Page 30
30
Material for Online Appendix
Page 31
31
Appendix
A. TFP estimation
We next describe how we estimate the sector-specific production functions (at the 2-digit level), which
allow us to calculate firm-level TFP and markups. The estimation closely follows De Loecker and
Warzynski (2012) and Ackerberg et al. (2016). We start from a Cobb-Douglas production function that
describes gross output as a function of labor, capital and intermediate input:
𝑞𝑖𝑡 = 𝛽𝑘𝑘𝑖𝑡 + 𝛽𝑙𝑙𝑖𝑡 + 𝛽𝑚𝑚𝑖𝑡 +𝜔𝑖𝑡 + 𝜖𝑖𝑡 . (2)
In the absence of firm-level output and input prices, we rewrite it using nominal variables:
�̃�𝑖𝑡 = 𝛽𝑘�̃�𝑖𝑡 + 𝛽𝑙𝑙𝑖𝑡 + 𝛽𝑚�̃�𝑖𝑡 + �̃�𝑖𝑡 + 𝜖𝑖𝑡 (A. 1)
where �̃�𝑖𝑡 = 𝑞𝑖𝑡 + 𝑝𝑖𝑡𝑄− 𝑝𝑡
𝑄 is deflated revenue, �̃� is fixed assets deflated by a capital deflator, l is labor
input and �̃� is deflated intermediate input use defined similarly as �̃�𝑖𝑡 . �̃�𝑖𝑡 represents the sum of
productivity and the deviations between the firm-level prices and industry price deflators, �̃�𝑖𝑡 = 𝜔𝑖𝑡 +
(𝑝𝑖𝑡𝑄 − 𝑝𝑡
𝑄) − 𝛽𝑚 (𝑝𝑖𝑡𝑀 − 𝑝𝑡
𝑀). The firm-specific prices are assumed to be monotonic functions of the
state variable in the production function 𝜔𝑖𝑡, such that �̃�𝑖𝑡 = 𝑓(𝜔𝑖𝑡) is a monotonic function as well.
As in Levinsohn and Petrin (2003), our control function is based on the use of intermediate inputs.
Firm i’s intermediate input demand is
𝑚𝑖𝑡 = 𝑚(�̃�𝑖𝑡 , 𝑙𝑖𝑡 , 𝑒𝑖𝑡 , 𝜏𝑠𝑡−1𝑂 , 𝜏𝑠𝑡−1
𝐼 , 𝜔𝑖𝑡) (A 2)
Where 𝑒𝑖𝑡 is a dummy indicating firm i’s exporting status; 𝜏𝑠𝑡𝑂 is the output tariff of the 4-digit industry
and 𝜏𝑠𝑡𝐼 is the input tariff of the 2-digit sector that firm i belongs to. Under the assumption that 𝜔𝑖𝑡 is
the only unobserved firm-specific factor and that there is a conditionally monotonic relationship between
𝑚𝑖𝑡 and 𝜔𝑖𝑡, we invert this function to get the following function h(.) as a proxy for productivity
𝜔𝑖𝑡 = ℎ(𝑚𝑖𝑡 , �̃�𝑖𝑡 , 𝑙𝑖𝑡 , 𝑒𝑖𝑡 , 𝜏𝑠𝑡−1𝑂 , 𝜏𝑠𝑡−1
𝐼 ) (A 3)
We allow the law of motion of productivity to depend on lagged output and input tariffs, as well as
firms export status, as described by the following function
𝜔𝑖𝑡 = 𝑔(𝜔𝑖𝑡−1, 𝑒𝑖𝑡 , 𝜏𝑠𝑡−1𝑂 , 𝜏𝑠𝑡−1
𝐼 ) + 𝜉𝑖𝑡 (A 4)
where 𝜉𝑖𝑡 is the innovative part of the productivity evolution process. Assuming that the stock of
working capital is predetermined one period earlier and that lagged variable inputs, labor and materials,
are orthogonal to contemporary productivity shocks, we use (�̃�𝑖𝑡, 𝑙𝑖𝑡−1,𝑚𝑖𝑡−1) as instrumental variables
and set up moment conditions to identify the coefficients in the production function.
The estimation procedure takes two steps. In a first stage, we run the following regression
�̃�𝑖𝑡 = 𝜑(�̃�𝑖𝑡 , 𝑙𝑖𝑡 , �̃�𝑖𝑡 , 𝑒𝑖𝑡 , 𝜏𝑠𝑡−1𝑂 , 𝜏𝑠𝑡−1
𝐼 , 𝑍𝑖) (A 5)
where �̃�𝑖𝑡 is firm i’s deflated revenue in year t. Function 𝜑(. ) is proxied by a 3rd order polynomial of
capital, labor and intermediate inputs, as well as the interactions of the terms in the polynomial with
' (.)g
Page 32
32
industry-level input and output tariffs and the export status dummy. Meanwhile, we also control for
ownership, year, province and 4-digit industry fixed effects that are combined in the vector 𝑍𝑖.
After this first stage estimation, we use the predicted value of 𝜑𝑖𝑡 to construct a productivity estimate
for each value of (𝛽𝑘 , 𝛽𝑙 , 𝛽𝑚 ) as follows:
�̂�𝑖𝑡 = 𝜑𝑖𝑡 − 𝛽𝑘�̃�𝑖𝑡 − 𝛽𝑙𝑙𝑖𝑡 − 𝛽𝑚�̃�𝑖𝑡 ................(A 6)
In the second stage, we proxy the law of motion of productivity 𝜔𝑖𝑡 with a linear function
𝜔𝑖𝑡 = 𝛼0 + 𝛼1𝜔𝑖𝑡−1 + 𝛼𝑂𝜏𝑠𝑡−1𝑂 + 𝛼𝐼𝜏𝑠𝑡−1
𝐼 + 𝛼𝑒𝑒𝑖𝑡 + 𝜉𝑖𝑡 (A 7)
We estimate this linear function with �̂�𝑖𝑡 and �̂�𝑖𝑡−1 as constructed in (A.6) to obtain an estimate of
the residual 𝜉𝑖𝑡 . Given our identifying assumptions on the timing of input choices, 𝜉𝑖𝑡 should be
independent of the predetermined stock of capital, as well as the lagged variable inputs. We thus use
the following moment condition to estimate parameters in the production function.
𝐸 [𝜉𝑖𝑡(𝜷). [�̃�𝑖𝑡𝑙𝑖𝑡−1�̃�𝑖𝑡−1
]] = 0 (A 8)
We use the same GMM algorithm as De Loecker and Warzynski (2012) and use the OLS estimates as
starting values. The parameter estimates and standard errors are shown in Table A.2.
Once we obtain the estimates for the production function parameters, we calculate TFP estimates as
𝑇𝐹𝑃𝑖𝑡 = �̃�𝑖𝑡 − �̂�𝑘�̃�𝑖𝑡 − �̂�𝑙𝑙𝑖𝑡 − �̂�𝑚�̃�𝑖𝑡 (A 9)
B. Markup estimation
As detailed in De Loecker and Warzynski (2012), one can obtain the firm-level price-cost markup by
dividing the output elasticity with respect to a variable input with the corresponding revenue share. In
principle, one can also use labor input and the output elasticity of labor to estimate markup. We choose
to use intermediate input because labor is unlikely to be as easily adjustable as material inputs. If an
input is quasi-fixed, the first order condition will not always hold and the input demand equation needs
to condition on firm-specific information. Moreover, there is also a concern that labor input is under-
estimated (See the discussion in Hsieh and Klenow (2009)).
From the production function estimates, we can calculate the output elasticity in the numerator of
equation (6). The firm-level data directly provides an estimate on the revenue share of intermediates,
but we adjust this in the denominator of (6) by stripping out the idiosyncratic error 𝜖 in the production
function and using the intermediate estimate �̂�𝑖𝑡 instead of deflated revenue directly. The ratio of these
two quantities provides then an estimate for the markup.
Column (1) of Table A.3 shows the annual average median TFP growth for the period 1998-2007
by industry. Note that weighting TFP growth by firm size, as in Brandt et al. (2012), raises the sectoral
averages substantially and leads to an overall average growth of 1.95% per year. A second difference
with Brandt et al. (2012) is that the current estimates impose the same technology on all firms in a sector,
due to the parametric production function framework. At the same time, it avoids the assumption of
perfect competition that the index number framework requires, and markup increases do not end up in
Page 33
33
TFP growth estimates anymore, depressing the average relative to Brandt et al. (2012). The median
markup across firms are shown in column (2) to (5) for years 1998, 2001, 2004 and 2007 respectively.
Page 34
Figure 1: Evolution of import tariffs on each sector's output and inputs
Page 35
Note: The annual statistics average sectoral dummies across 424 4-digit (CIC) manufacturing sectors. Tarrif
rates are from WITS; FDI restrictions and NTB barriers are from annual circulars of the Ministry of Foreign
Trade and Economic Cooperation and the Ministry of Commerce.
Figure 2: Fraction of manufacturing sectors subject to high tariffs, non-tariff barriers,
or investment restrictions
0%
20%
40%
60%
80%
1995 1996 1997 1998 1999 2000 2001 2002 2003 2004 2005 2006 2007
Tariff > 15% Any FDI restriction Any NTB
Page 36
Figure 3: Changes in import tariffs by initial tariff level
Note: Observations are 4-digit CIC manufacturing sectors. The solid line is the regression line of
tariff changes on initial tariffs (with a slope of -0.84 over 1992-2007 and -0.46 over 2001-2007); the
dashed line has a slope of -1 (for comparison).
-12
0-1
00
-80
-60
-40
-20
02
0
Import
tariff
change
: 19
92-2
007
0 20 40 60 80 100 120 140
1992 import tariff
-50
-40
-30
-20
-10
01
0
Import
tariff
change
: 20
01-2
007
0 20 40 60
2001 import tariff
Notes: Observations are 4-digit manufacturing sectors. Dashed line has slope -1. Solid line is regression with slope -0.84 above, and -0.46 below.
Page 37
Table 1: Predicting changes in tariff protection
Dependent variable:
Tariff level
(2002-
2007)(1) (2) (3) (4) (5)
TFP1998 -0.428 -0.852* -0.467
(0.293) (0.448) (0.499)
TFP1998 - TFP1995 0.371 0.822* 0.335
(0.302) (0.450) (0.532)
TFP1998 x (TFP1998 - TFP1995) 0.005 -0.019
(0.111) (0.127)
EXP1998 - EXP1995 0.249
(0.822)
EXP2007 - EXP1998 0.001
(0.026)
Trade categories (BEC)
Intermediates (dummy) 0.043
(0.032)
Capital goods (dummy) 0.017
(0.033)
Consumer goods (dummy) 0.007
(0.031)
U.S. industry characteristics
Differentiated goods (Rauch dummy) -0.008
(0.012)
Sales expenditure intensity 0.053**
(0.021)
R&D intensity -0.497
(0.395)
Advertising intensity -0.315
(0.193)
Chinese industry characteristics
Top 4 market share -0.016
(0.023)
Log employment -0.837** -0.003**
(0.343) (0.001)
Log(K/Y) ratio 0.925
(0.963)
SOE share in sectoral sales -0.011 0.004
(0.019) (0.002)
Elementary education share 0.133
(0.099)
Maximum tariff level 0.524***
(0.018)
Sector (2-digit) FE yes yes yes
Industry (4-digit) FE yes
R-squared 0.35 0.01 0.41 0.49 0.98
Observations 410 410 410 370 2,484
Note: Estimates in column (4) additionally contain year FE and the same additional controls as used in firm-
level regressions below (sectoral output, export, and the foreign firm share). ***,**, and * indicate
significance at the 1%, 5%, and 10% level.
Change in tariffs from 1998 to 2007
(τ2007 - τ1998)
Page 38
Table 2 Effect of tariffs on imports and domestic prices
(a) Imports (2000-2007)
All goods Materials Intermediate
inputs
Capital goods Consumer goods
(1) (2) (3) (4) (5)
Import tariff (lagged) -3.112*** -1.559* -4.349*** -2.325*** -1.980***
(0.331) (0.826) (0.668) (0.692) (0.631)
Observations 127,049 8,458 73,351 19,013 26,061
Year FE yes yes yes yes yes
Product FE yes yes yes yes yes
(b) Domestic price level (1998-2007)
All goods Materials Intermediate
inputs
Capital goods Consumer goods
(1) (2) (3) (4) (5)
(i) Preferred series: 4-digit where available and 2-digit elsewhere
Import tariff (lagged) 0.296*** 0.320 0.492*** 0.174** 0.011
(0.090) (0.212) (0.191) (0.088) (0.106)
(ii) Alternative series (1): constructed from the firm-level information
Import tariff (lagged) 0.283*** -0.309 0.493** 0.197** 0.049
(0.100) (0.212) (0.204) (0.091) (0.112)
(iii) Alternative series (2): aggregate deflators constructed by NBS for 2-digit sectors
Import tariff (lagged) 0.255*** 0.298 0.442*** 0.182 -0.085
(0.092) (0.244) (0.169) (0.158) (0.089)
Observations 4,240 70 1,950 1,180 980
Year FE yes yes yes yes yes
Industry or sector FE yes yes yes yes yes
Dependent variable is ordinary trade imports into China (in logs)
at the product level (6-digit HS)
Note: All coefficients are estimated using separate regressions based on information of firm-level trade transactions from
China Custom's that are aggregated to the product level. Duty-free imports are excluded. The regressions allow for a
different elasticity for imports entering through trade intermediaries (not reported). The instrument, from 2001 onwards, is
the maximum allowable tariff under the WTO agreement. Standard errors in parentheses are clustered at the product level;
***, **, and * indicate significance at the 1%, 5%, and 10% level.
Dependent variable is an index of the Chinese domestic price level
at the industry (4-digit) level
Note: All coefficients are estimated using separate regressions for 4-digit industries. The instrument, from 2001 onwards, is
the maximum allowable tariff under the WTO agreement. In panel (i), the price index from 1998 to 2003 is calculated by
aggregating firm-level price changes to the 4-digit industry level as described in Section 4; the index is extended to the end of
the sample period using a sectoral (2-digit) price index taken from China's Statistical Yearbook. In panel (ii), the detailed
price index for 1998-2003 is calculated omitting fewer outlier observations. In Panel (iii), the 2-digit sector-level price index
is used throughout. Standard errors in parentheses are clustered at the industry level; ***, **, and * indicate significance at
the 1%, 5%, and 10% level.
Page 39
(a) Markups
(1a) (2a) (3a) (4a) (5a) (6a)
Output tariff (lagged) 0.045 0.058 0.070* 0.095* 0.375*** 0.543***
(0.041) (0.044) (0.043) (0.051) (0.110) (0.120)
Input tariff (lagged) -0.227** -0.969*** 0.016 -0.733*** -0.651* -1.173***
(0.106) (0.074) (0.169) (0.094) (0.354) (0.181)
Firm FE yes yes yes yes yes yes
Year FE yes yes yes
Sector-year FE yes yes yes
Observations 1,293,495 1,295,372 1,211,861 1,213,586 1,293,495 1,295,372
(b) Productivity
(1b) (2b) (3b) (4b) (5b) (6b)
Output tariff (lagged) -0.369*** -0.316*** -0.176** -0.107* -0.263* -0.387***
(0.139) (0.097) (0.088) (0.062) (0.155) (0.115)
Input tariff (lagged) -0.806** -1.031*** -1.790*** -1.621*** -2.395*** -0.682***
(0.385) (0.167) (0.323) (0.144) (0.616) (0.249)
Firm FE yes yes yes yes yes yes
Year FE yes yes yes
Sector-year FE yes yes yes
Observations 1,275,041 1,276,922 1,194,720 1,196,451 1,275,041 1,276,922
Table 3: Effect of tariffs on firm-level markups and productivity (1998-2007)
dependent variable is the firm-level markup (in logs)
dependent variable is firm-level productivity (TFP, in logs)
Output weightsWithin-industry output
share weights
Note: Instrument from 2001 onwards is the maximum allowable tariff under the WTO agreement. The sample only
includes firms that did not switch industry. Standard errors in parentheses are clustered two-ways at the industry-year
and the firm level; ***,**, and * indicate significance at the 1%, 5%, and 10% level.
No weightsWithin-industry output
share weightsOutput weights
No weights
Page 40
(a) Price-cost markups
Total effect Within Between Entry -Exit
(1a) (2a) (3a) (4a) (5a)
Change in Output tariff 0.152** 0.122*** 0.010 0.014 0.005
(0.066) (0.043) (0.013) (0.039) (0.009)
Change in Input tariff -0.292** -0.045 0.040 -0.282*** -0.005
(0.149) (0.098) (0.030) (0.088) (0.021)
Industry FE yes yes yes yes yes
Observations 844 844 844 844 844
(1b) (2b) (3b) (4b) (5b)
Change in Output tariff 0.221*** 0.150*** -0.023** 0.095*** 0.001
(0.049) (0.032) (0.009) (0.026) (0.006)
Change in Input tariff -0.400*** -0.146* 0.068*** -0.319*** -0.002
(0.127) (0.083) (0.024) (0.068) (0.015)
Industry-year weights yes yes yes yes yes
Observations 844 844 844 844 844
(b) Productivity
Total effect Within Between Entry -Exit
(1c) (2c) (3c) (4c) (5c)
Change in Output tariff -0.569*** -0.200*** 0.042 -0.428*** -0.017
(0.137) (0.074) (0.028) (0.106) (0.016)
Change in Input tariff -1.160*** -0.297* 0.246*** -1.080*** -0.030
(0.312) (0.168) (0.065) (0.241) (0.036)
Industry FE yes yes yes yes yes
Observations 844 844 844 844 844
(1d) (2d) (3d) (4d) (5d)
Change in Output tariff -0.465*** -0.209*** 0.049** -0.302*** -0.003
(0.141) (0.071) (0.022) (0.097) (0.010)
Change in Input tariff -1.236*** -0.551*** 0.170*** -0.837*** -0.019
(0.363) (0.184) (0.056) (0.252) (0.026)
Industry-year weights yes yes yes yes yes
Observations 844 844 844 844 844
Table 4: Decomposing the effect of tariffs on industry performance (1998-2007)
Note: Separate regressions in each column. The instrument from 2001 onwards is the change in the
maximum allowable tariff under the WTO agreement. Dependent variables are the terms of a linear
decomposition of industry-level change in markup or productivity. The sample pools growth rates over 2 sub-
periods (1998-2002 and 2002-2007) that cover 424 and 420 industries, respectively. Standard errors in
parentheses; ***,**, and * indicate significance at the 1%, 5%, and 10% level.
Page 41
All imports Processing trade Ordinary trade
(1a) (2a) (3a)
2000 9.6% 6.9% 6.6%
2007 10.9% 8.7% 7.1%
(1b) (2b) (3b)
2000 29.1% 19.7% 9.3%
2007 27.3% 17.5% 9.8%
(1c) (2c) (3c)
2000 13.4% 6.2% 7.2%
2007 13.5% 5.9% 7.5%
(c) Share of imported intermediates in total input use for the entire manufacturing sector
Table 5: Use of imported intermediates
Note: Calculations in panels (a) and (b) are based on a sample of firms merged between the NBS firm-
level data and the Custom's trade-transactions data; in panel (c), the denominator is calculated using all
firms from the Custom's data and the numerator uses a weighted average of the aggregate input use over
all firms in the NBS data or using the estimate for manufacturing from the National Accounts.
(a) Fraction of firms using imported intermediates
(b) Share of imported intermediates in total input use for the sample of matched firms
Page 42
Dependent variable: Output growth
(year on year)
Dummy for firm
survival
Dummy for CEO
replacement
Dummy for CEO
replacement
(1) (2) (3) (4)
SOE dummy -0.1187*** -0.0776*** 0.0537*** 0.0606***
(0.0059) (0.0035) (0.0013) (0.0025)
output tariff (lagged) -0.0110*** 0.0005** 0.0004**
(0.0004) (0.0002) (0.0002)
output tariff (lag) * SOE -0.0013*** -0.0004** -0.0004**
(0.0004) (0.0002) (0.0002)
output growth -0.0099*** -0.0055***
(0.0008) (0.0014)
output growth * SOE -0.0057*** -0.0075**
(0.0016) (0.0029)
output growth * output tariff (lag) -0.00021**
(0.00010)
output growth * output tariff (lag) * SOE 0.00036**
(0.00016)
Firm FE, Year FE, control variables Yes Yes Yes Yes
Observations 1,318,033 1,341,456 924,693 841,921
Note: All regressions control for capital-intensity and CEO tenure. Standard errors in parentheses are clustered two-
ways, at the industry-year and at the firm level; ***,**, and * indicate significance at the 1%, 5%, and 10% level.
Table 6: Effect of tariffs on growth, exit, and management replacement
Page 43
Table 7: Effect of tariffs on the level of markup and productivity by firm status
Dependent variable: Productivity
(1) (2)
Output tariff (lagged)
* Incumbent 0.004 -0.454***
(0.040) (0.143)
* Entrant 0.017 -0.568**
(0.054) (0.202)
* Exiting firm -0.010 -0.373***
(0.044) (0.148)
Input tariff (lagged)
* Incumbent -0.185* -0.284
(0.107) (0.386)
* Entrant -0.153 -0.914*
(0.164) (0.507)
* Exiting -0.083 -0.363
(0.141) (0.403)
Industry FE yes yes
Year by firm-status interaction FE yes yes
Observations 901,048 904,960
Markup
Note: Sample covers the period 1999-2006 and only includes firms that do not switch
industry and survive for at least two years. For entrants and exiting firms we exclude,
respectively, their first and last year of operation to avoid calculating productivity using
output for less than a full year. Instrument from 2001 onwards is the maximum allowable
tariff under the WTO agreement. Standard errors in parentheses are clustered two-ways at
the industry-year and at the firm level. ***, **, and * indicate significance at the 1%, 5%,
and 10% level.
Page 44
Preferred series Alternative series (1) Alternative series (2)
Firm-level price
changes, aggregated to
4-digit industry
dropping many outliers
Firm-level price
changes, aggregated to
4-digit industry
dropping fewer outliers
China's Statistial
Yearbook,
2-digit industry series
China's Industrial Classification (2-digit) (1) (2) (3)
13. Agriculture Food Processing 96.7 96.0 96.6
14. Other Food Production 98.7 97.9 97.2
15. Beverages 99.4 97.7 97.3
16. Tobacco Products 143.1 148.6 125.2
17. Textiles 100.8 100.0 97.8
18. Textile Wearing Apparel, Footwear, Caps 101.0 100.9 99.1
19. Leather, Fur, Feather & Related Products 102.5 102.8 100.5
20. Processing of Timber, Articles of Wood, etc. 98.5 97.9 95.0
21. Furniture 100.6 101.0 98.9
22. Paper and Paper Products 99.9 100.9 96.0
23. Printing, Reproduction of Recording Media 98.5 98.4 94.1
24. Cultural, Educational, Arts and Crafts, Sports
and Entertainment Products
99.0 99.0 97.6
25. Processing of Petroleum, Coke, Nuclear Fuel 121.3 122.8 119.9
26. Chemicals and Chemical Products 98.8 98.8 100.5
27. Pharmaceutical Products 94.3 91.3 93.9
28. Man-made Fibres 104.1 104.4 100.1
29. Rubber Products 95.7 95.9 93.4
30. Plactics Products 98.9 98.3 96.0
31. Non-metallic Mineral Products 98.2 97.3 95.0
32. Smelting & Processing of Ferrous Metals 102.7 103.8 107.4
33. Smelting & Proc. of Non-ferrous Metals 102.6 101.0 101.1
34. Metal Products 98.8 98.6 97.3
35. General-purpose Machinery 98.5 97.7 97.0
36. Special-purpose Machinery 98.9 98.2 97.9
37. Transport Equipment 96.1 95.5 93.1
39. Electrical Machinery and Equipment 98.3 97.2 93.6
40. Comm. Eq., Computer & Other Electronic Eq. 96.6 94.4 89.8
41. Measuring Instruments and Machinery for
Cultural Activity and Office Work
96.2 96.2 88.2
42. Artwork and Other Manufacturing 100.0 100.1 97.3
Weighted average 100.6 100.2 98.2
Alternative series (1) Alternative series (2)
Preferred series 0.997 / 0.957 0.923 / 0.898
Alternative series (1) 0.920 / 0.871
Table A.1 Comparing alternative price deflators over the 1998-2003 period (1998=100)
Notes: This table shows the 2003 value of three alternative price deflators (1998=100). The preferred series is created from the firm-level
information on current and constant price output. The 4-digit industry-year aggregate is constructed as an output-weighted average, omitting
outliers more than 0.5 standard deviation different from the average change (15-25% per year). For the alternative series (1), we omit
outliers outside a 1 standard deviation (7-10% per year). The table shows the output-weighted deflators at the 2-digit level.
parial / spearman rank correlation:
Page 45
Table A.2 Estimates of Cobb-Douglas production function coefficients
China's Industrial Classification material labor capital Obs.
0.933 0.027 0.021 82,823
(0.066) (0.113) (0.014)
0.934 0.047 0.017 29,890
(0.013) (0.024) (0.005)
0.926 0.043 0.032 24,222
(0.006) (0.005) (0.004)
0.788 0.061 0.291 1,853
(0.135) (0.177) (0.197)
0.956 0.012 0.007 113,468
(0.006) (0.004) (0.002)
0.872 0.104 0.026 61,769
(0.007) (0.013) (0.004)
0.911 0.063 0.025 30,060
(0.008) (0.006) (0.005)
0.921 0.048 0.014 26,579
(0.006) (0.007) (0.003)
0.922 0.051 0.018 14,157
(0.010) (0.012) (0.005)
0.930 0.052 0.012 41,525
(0.034) (0.051) (0.005)
0.895 0.059 0.052 28,523
(0.010) (0.017) (0.004)
0.888 0.083 0.028 16,589
(0.013) (0.020) (0.005)
0.881 0.049 0.044 3,961
(0.164) (0.220) (0.073)
0.939 0.011 0.026 86,155
(0.018) (0.031) (0.005)
0.918 0.037 0.037 29,187
(0.007) (0.008) (0.010)
0.957 0.002 0.025 4,230
(0.071) (0.074) (0.016)
0.930 0.032 0.023 13,862
(0.264) (0.484) (0.116)
0.918 0.047 0.026 54,939
(0.003) (0.003) (0.002)
0.981 0.016 0.005 123,687
(0.088) (0.073) (0.043)
0.923 0.091 -0.002 21,197
(0.048) (0.073) (0.029)
0.931 0.070 -0.008 9,759
(0.122) (0.094) (0.067)
0.919 0.035 0.029 47,438
(0.117) (0.167) (0.039)
0.937 0.013 0.028 77,313
(0.045) (0.041) (0.021)
0.935 0.016 0.023 44,044
(0.021) (0.024) (0.006)
0.907 0.033 0.042 55,616
(0.056) (0.090) (0.008)
0.922 0.039 0.025 50,400
(0.051) (0.075) (0.004)
0.884 0.058 0.047 37,249
(0.026) (0.027) (0.012)
0.915 0.052 0.026 15,584
(0.160) (0.243) (0.031)
0.807 0.230 0.004 22,225
(0.079) (0.147) (0.022)
18. Textile Wearing Apparel, Footwear and Caps
13. Agriculture Food Processing
14. Other Food Production
15. Beverages
16. Tobacco Products
17. Textiles
30. Plactics Products
19. Leather, Fur, Feather and Related Products
20. Processing of Timber, Articles of Wood, Bamboo, Rattan,
Palm and Straw
21. Furniture
22. Paper and Paper Products
23. Printing and Reproduction of Recording Media
24. Cultural, Educational, Arts and Crafts, Sports and
Entertainment Products
25. Processing of Petroleum, Coking and Nuclear Fuel
26. Chemicals and Chemical Products
27. Pharmaceutical Products
28. Man-made Fibres
29. Rubber Products
Note: Cobb-Douglas production function coefficients estimated using the methology of De Loecker and Warzynski
(2012), estimated separately by 2-digit sector. Block-bootstrapped standard errors in brackets.
31. Non-metallic Mineral Products
32. Smelting and Processing of Ferrous Metals
33. Smelting and Processing of Non-ferrous Metals
34. Metal Products
35. General-purpose Machinery
36. Special-purpose Machinery
37. Transport Equipment
39. Electrical Machinery and Equipment
40. Communication Equipment, Computer and Other Electronic
Equipment
41. Measuring Instruments and Machinery for Cultural Activity
and Office Work
42. Artwork and Other Manufacturing
Page 46
Table A.3 Summary statistics by sector for TFP growth and markup estimates
CIC
1998-2007 2001-2007 2001 2004 2007
13. Agriculture Food Processing 0.01 0.01 0.22 0.23 0.23
14. Other Food Production 0.00 0.00 0.30 0.32 0.36
15. Beverages 0.01 0.01 0.29 0.30 0.36
16. Tobacco Products -0.02 0.01 0.38 0.63 0.62
17. Textiles 0.02 0.02 0.28 0.26 0.30
18. Textile Wearing Apparel, Footwear and Caps 0.02 0.02 0.15 0.17 0.18
19. Leather, Fur, Feather and Related Products 0.01 0.01 0.17 0.19 0.22
20. Processing of Timber, Articles of Wood, etc. 0.07 0.08 0.23 0.22 0.25
21. Furniture 0.09 0.12 0.23 0.21 0.23
22. Paper and Paper Products 0.03 0.04 0.20 0.20 0.22
23. Printing and Reproduction of Recording Media 0.03 0.05 0.24 0.23 0.25
24. Cultural, Educational, Arts and Crafts, Sports goods, etc. 0.03 0.04 0.16 0.15 0.18
25. Processing of Petroleum, Coking and Nuclear Fuel -0.05 -0.06 0.01 0.14 0.17
26. Chemicals and Chemical Products 0.00 0.00 0.23 0.26 0.30
27. Pharmaceutical Products 0.02 0.02 0.29 0.31 0.35
28. Man-made Fibres 0.00 0.00 0.20 0.20 0.23
29. Rubber Products 0.00 0.00 0.23 0.23 0.27
30. Plactics Products 0.02 0.03 0.20 0.17 0.20
31. Non-metallic Mineral Products 0.04 0.05 0.31 0.32 0.36
32. Smelting and Processing of Ferrous Metals 0.00 -0.01 0.15 0.10 0.14
33. Smelting and Processing of Non-ferrous Metals -0.05 -0.07 0.15 0.19 0.24
34. Metal Products -0.02 -0.02 0.20 0.19 0.22
35. General-purpose Machinery 0.00 0.01 0.25 0.23 0.27
36. Special-purpose Machinery 0.02 0.03 0.24 0.23 0.26
37. Transport Equipment 0.01 0.01 0.20 0.21 0.25
39. Electrical Machinery and Equipment -0.02 -0.03 0.17 0.18 0.20
40. Communication Eq., Computer & Other Electronic Eq. 0.04 0.05 0.17 0.19 0.19
41. Measuring Instr & Machinery for Cultural, Office Work 0.07 0.06 0.25 0.27 0.29
42. Artwork and Other Manufacturing 0.05 0.05 0.08 0.08 0.09
Median Annual TFP growth Median markup (P/MC - 1)
Note: All firms with non-missing information are included for calculating the summary statistics. TFP growth measures are based on
production function parameter estimates in Table A.2. Markups are measured as the ratio of the output elasticity of materials over its revenue
share minus 1, where the revenue has been adjusted to remove the impact of idiosyncratic ex-post shocks.
Page 47
Table A.4 Robustness checks for the effect of tariffs on imports and domestic prices
(a) Imports (2000-2007)
All goods Materials Intermediate
inputs
Capital goods Consumer goods
(1) (2) (3) (4) (5)
(a) OLS estimates
Import tariff (lagged) -2.769*** -1.558* -3.736*** -2.099*** -1.844***
(0.304) (0.813) (0.613) (0.665) (0.565)
Observations 127,049 8,458 73,351 19,013 26,061
Year FE yes yes yes yes yes
Product FE yes yes yes yes yes
(b) Domestic price level
All goods Materials Intermediate
inputs
Capital goods Consumer goods
(1) (2) (3) (4) (5)
(i) Preferred series: OLS estimates (1998-2007)
Import tariff (lagged) 0.245** 0.446** 0.396*** 0.145*** 0.000
(0.032) (0.175) (0.064) (0.045) (0.029)
Observations 4,240 70 1,950 1,180 980
(ii) 4-digit deflator without extrapolation: IV estimates (1998-2003)
Import tariff (lagged) 0.147** 0.138 0.246* 0.052 -0.027
(0.075) (0.136) (0.147) (0.078) (0.123)
Observations 2,544 49 1,170 708 588
Year FE yes yes yes yes yes
Industry or sector FE yes yes yes yes yes
Note: All coefficients are estimated using separate regressions. We exclude duty-free imports and aggregate firm-level trade
flows to the product level. The regressions allow for a different elasticity for imports entering through trade intermediaries
(not reported). Standard errors in parentheses are clustered at the product level; ***, **, and * indicate significance at the
1%, 5%, and 10% level.
Dependent variable is ordinary trade imports into China (in logs)
at the product level (6-digit HS)
Dependent variable is an index of the Chinese domestic price level
at the sector (2-digit) or industry (4-digit) level
Note: All coefficients are estimated using separate regressions for 4-digit industries. The instrument in panel (ii), from 2001
onwards, is the maximum allowable tariff under the WTO agreement. In panel (i), the price index from 1998 to 2003 is
calculated by aggregating firm-level price changes to the 4-digit industry level as described in Section 4; we extrapolate the
index to the end of the sample period using a sectoral price index taken from China's statistical yearbook and observed at the
2-digit sector level. In panel (ii), the sample is limited to the 1998-2003 period where the detailed index is defined. Standard
errors in parentheses are clustered at the industry level; ***, **, and * indicate significance at the 1%, 5%, and 10% level.
Page 48
(a) OLS estimates
dependent variable:
(1a) (2a) (3a) (4a)
Output tariff (lagged) 0.061* 0.090** -0.194** -0.124**
(0.037) (0.047) (0.086) (0.065)
Input tariff (lagged) 0.164 0.686*** -1.455*** -1.532***
(0.144) (0.091) (0.286) (0.136)
Firm FE yes yes yes yes
Year FE yes yes
Sector-year FE yes yes
Observations 1,211,861 1,213,586 1,194,720 1,196,451
(b) Alternative TFP measures
wage bill as labor
input
alternative price
index
produduction fct.
at 4-digit level
include 4-digit
industry switchers
(1b) (2b) (3b) (4b)
Output tariff (lagged) -0.143** -0.113* 0.170 -0.097*
(0.068) (0.064) (0.134) (0.058)
Input tariff (lagged) -1.044*** -2.307*** -2.369*** -1.745***
(0.136) (0.133) (0.252) (0.265)
Firm FE yes yes yes yes
Sector-year FE yes yes yes yes
Observations 1,196,391 1,196,467 1,196,814 1,424,428
Within-industry output share weights Within-industry output share weights
Table A.5 Robustness check on the effect of tariffs on firm-level markup & productivity (1998-2007)
Note: Sample only includes firms that did not switch industry. Standard errors in parentheses are clustered two-ways at the
industry-year and at the firm level; ***,**, and * indicate significance at the 1%, 5%, and 10% level.
dependent variable = alternative TFP measures
Note: All regressions use as instrument for tariffs from 2001 onwards the maximum allowable tariff under the WTO
agreement. Sample in columns (1b)-(3b) only includes firms that did not switch industry. Standard errors in parentheses
are clustered two-ways, at the industry-year and at the firm level; ***,**, and * indicate significance at the 1%, 5%, and
10% level.
firm-level markup firm-level productivity
Page 49
Dependent variable: No. of active
firms (log)
Entry rate Exit rate Switch-in
rate
Switch-out
rate
Restructuring
rate
(1) (2) (3) (4) (5) (6)
(a) benchmark
Output tariff (lagged) 0.001 -0.052 0.046 0.037 0.063 -0.011
(0.018) (0.036) (0.029) (0.033) (0.038) (0.013)
Input tariff (lagged) 0.330*** 0.402*** -0.091 0.009 -0.098 0.031
(0.059) (0.115) (0.093) (0.107) (0.124) (0.040)
Industry-fixed effects Yes Yes Yes Yes Yes Yes
Year-fixed effects Yes Yes Yes Yes Yes Yes
Observations 4,238 4,237 4,237 4,237 4,237 4,238
(b) normalized by incumbents or survivors
Output tariff (lagged) 0.001 -0.074 0.051 0.031 0.098 -0.005
(0.018) (0.073) (0.059) (0.071) (0.070) (0.024)
Input tariff (lagged) 0.330*** 0.891*** -0.134 0.088 -0.126 0.020
(0.059) (0.236) (0.189) (0.227) (0.222) (0.078)
Observations 4,238 3,558 3,781 3,699 3,695 3,810
(c) current tariff rates
Output tariff 0.004 -0.051 0.067** 0.082** 0.042 -0.016
(0.019) (0.036) (0.029) (0.034) (0.039) (0.013)
Input tariff 0.342*** 0.213* -0.104 -0.020 -0.116 0.040
(0.059) (0.114) (0.092) (0.106) (0.123) (0.040)
Observations 4,228 4,227 4,227 4,227 4,227 4,228
(d) estimation with OLS
Output tariff (lagged) -0.006 -0.000 0.054** 0.040 0.076** -0.013
(0.017) (0.033) (0.027) (0.030) (0.035) (0.012)
Input tariff (lagged) 0.342*** 0.311*** -0.105 0.003 -0.120 0.033
(0.058) (0.112) (0.091) (0.105) (0.121) (0.039)
Observations 4,238 4,237 4,237 4,237 4,237 4,238
(e) Post-WTO period
Output tariff (lagged) -0.019 -0.101* 0.065* 0.030 0.092 -0.039**
(0.023) (0.054) (0.037) (0.053) (0.063) (0.019)
Input tariff (lagged) 0.493*** 0.506*** 0.146 0.072 -0.247 0.076
(0.070) (0.163) (0.113) (0.160) (0.190) (0.058)
Observations 2,967 2,967 2,967 2,966 2,967 2,967
Note: All regressions include industry and year fixed effects. Estimation is with IV (except panel (d)) over the 1998-2007
period (except panel (e)). Number of firms entering, exiting, or switching industries are normalized by total number of active
firms (except panel (b)); ratios above 1 are excluded. The log of number of firms in (1) is divided by 10 to normalize
coefficient estimates to be of similar magnitude. Standard errors in parentheses; ***,**, and * indicate significance at the
1%, 5%, and 10% level.
Table A.6 Effect of tariffs on entry, exit, and industry transitions


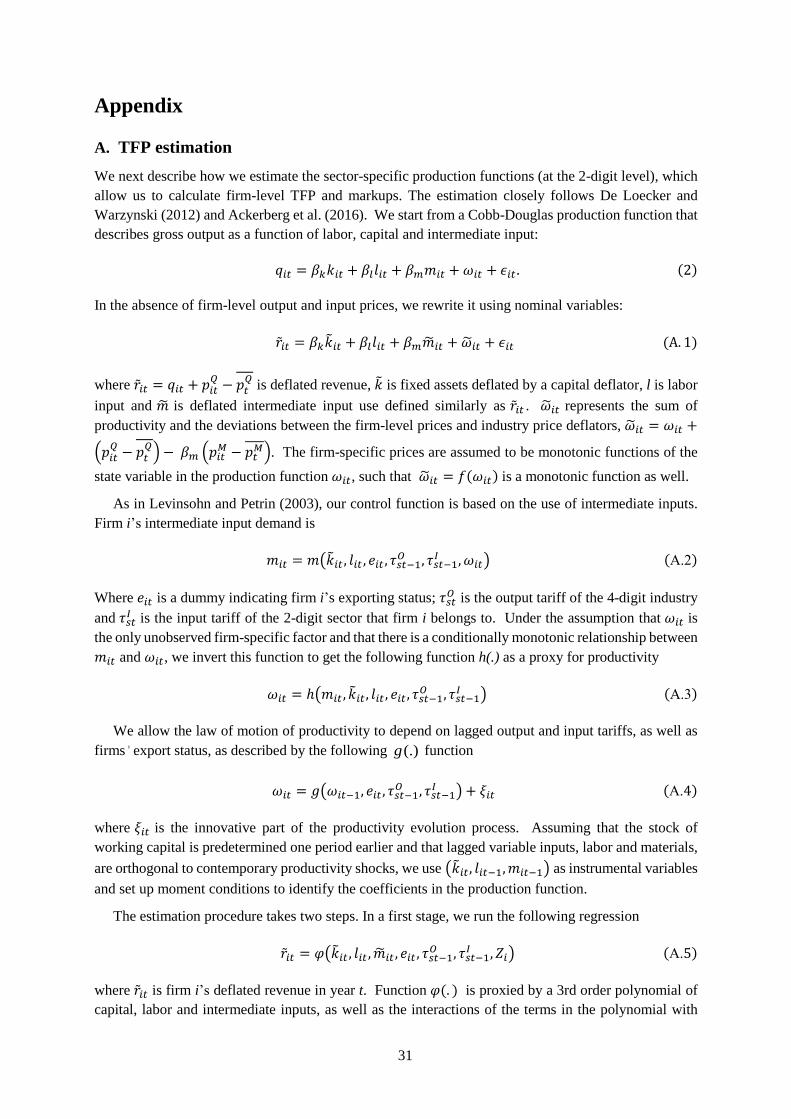
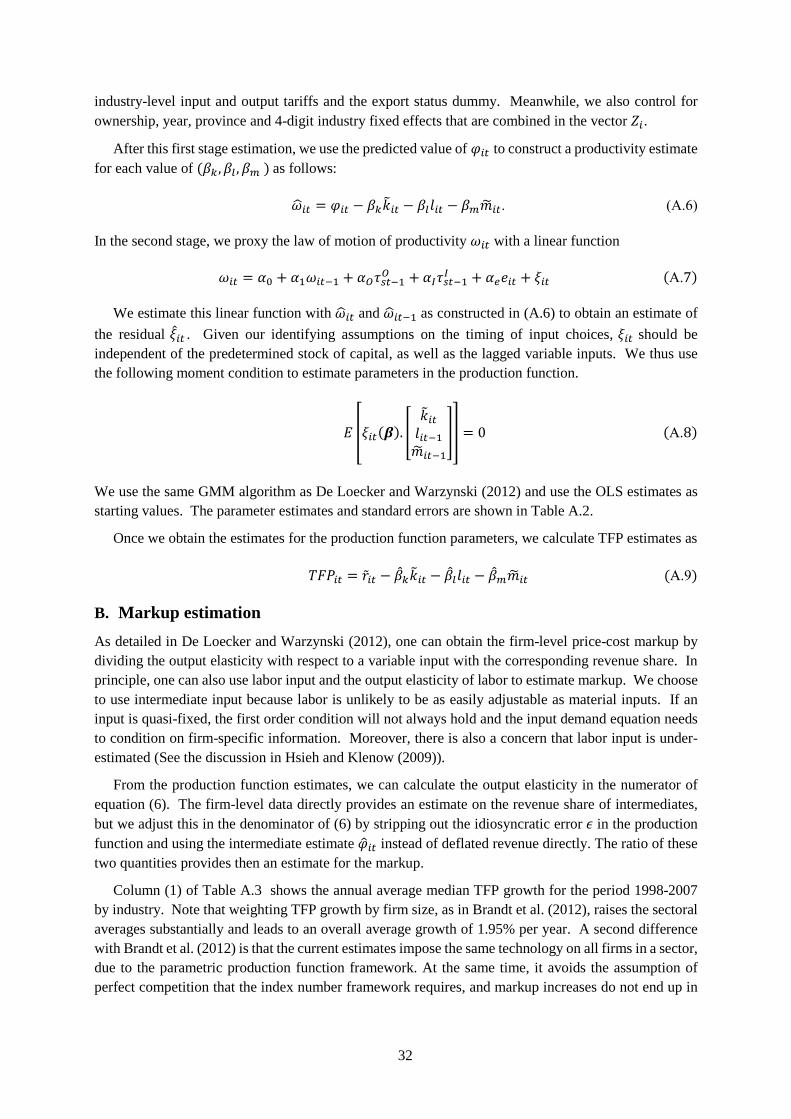


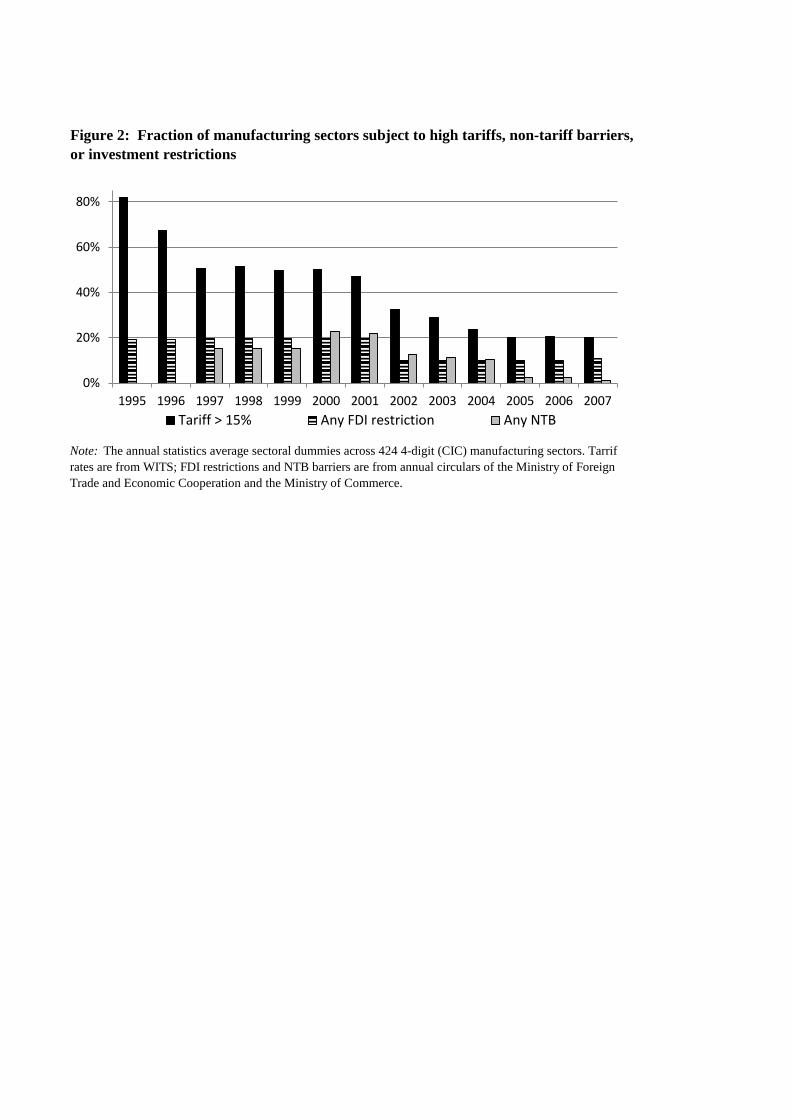
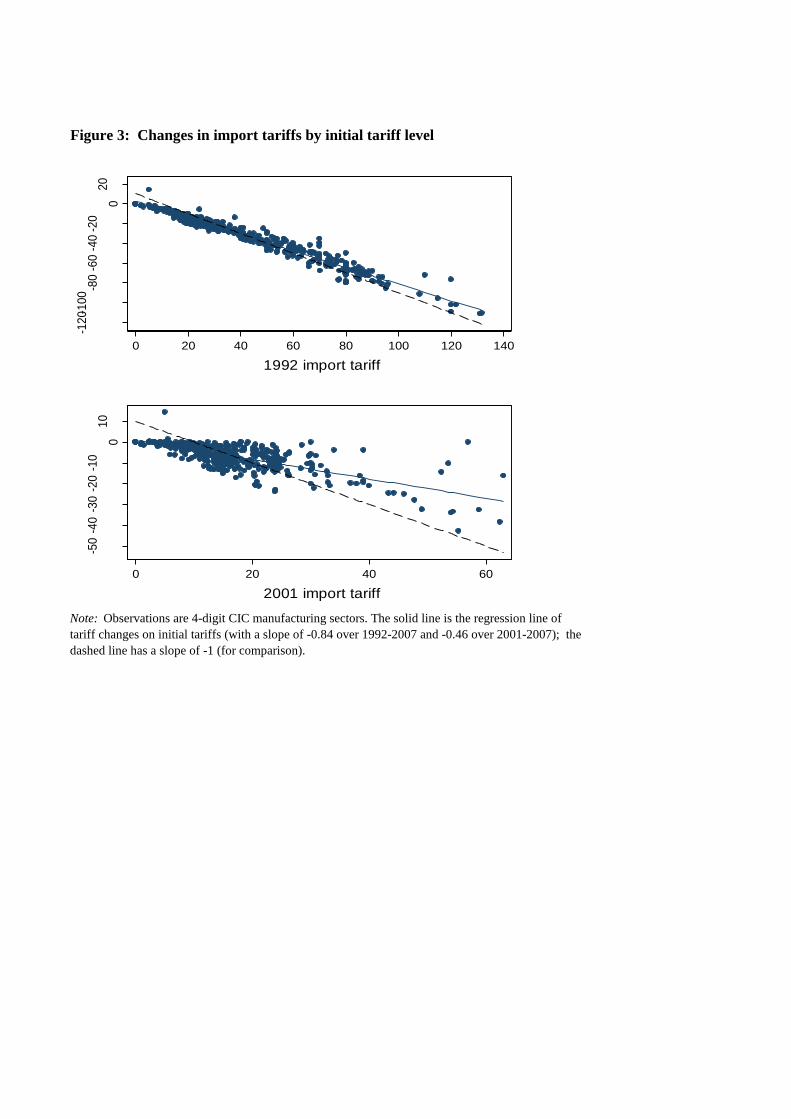

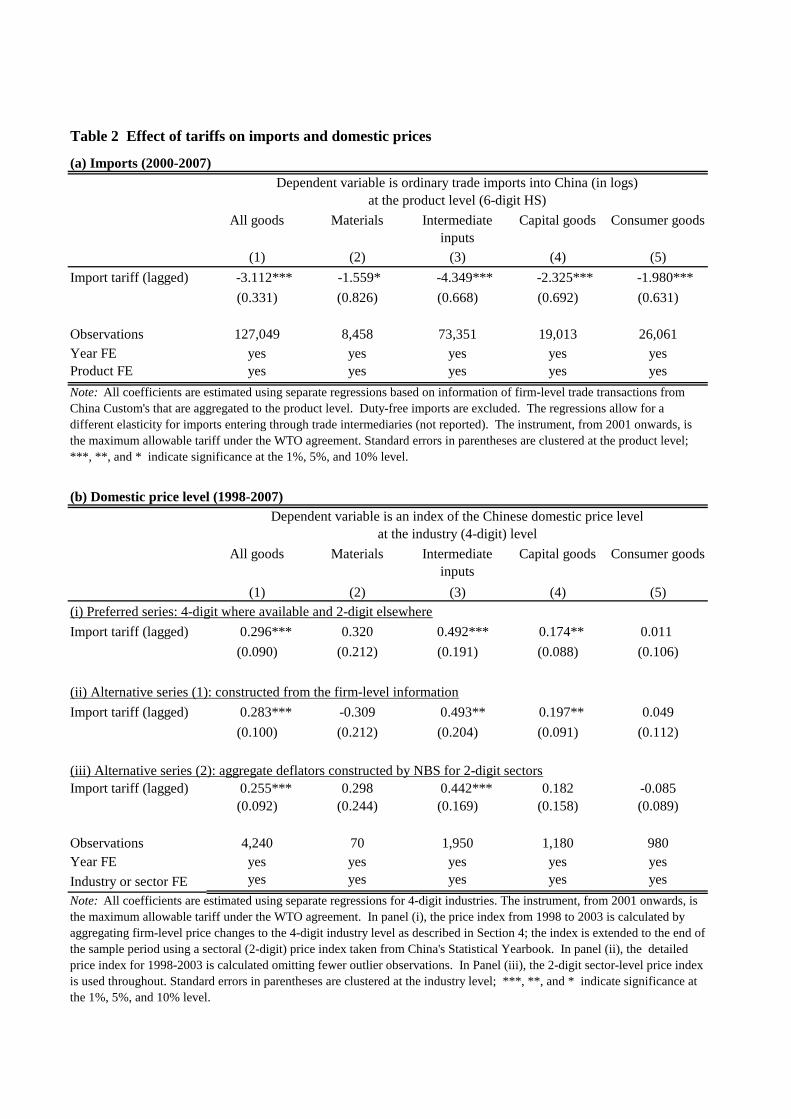


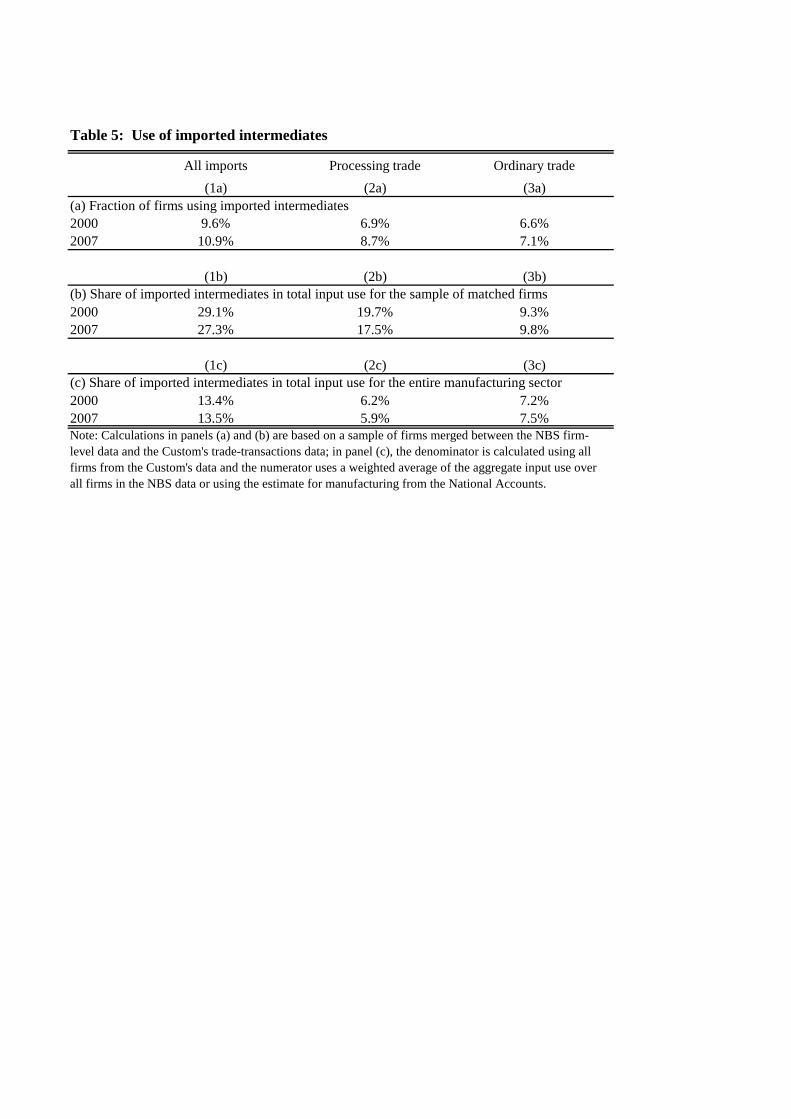
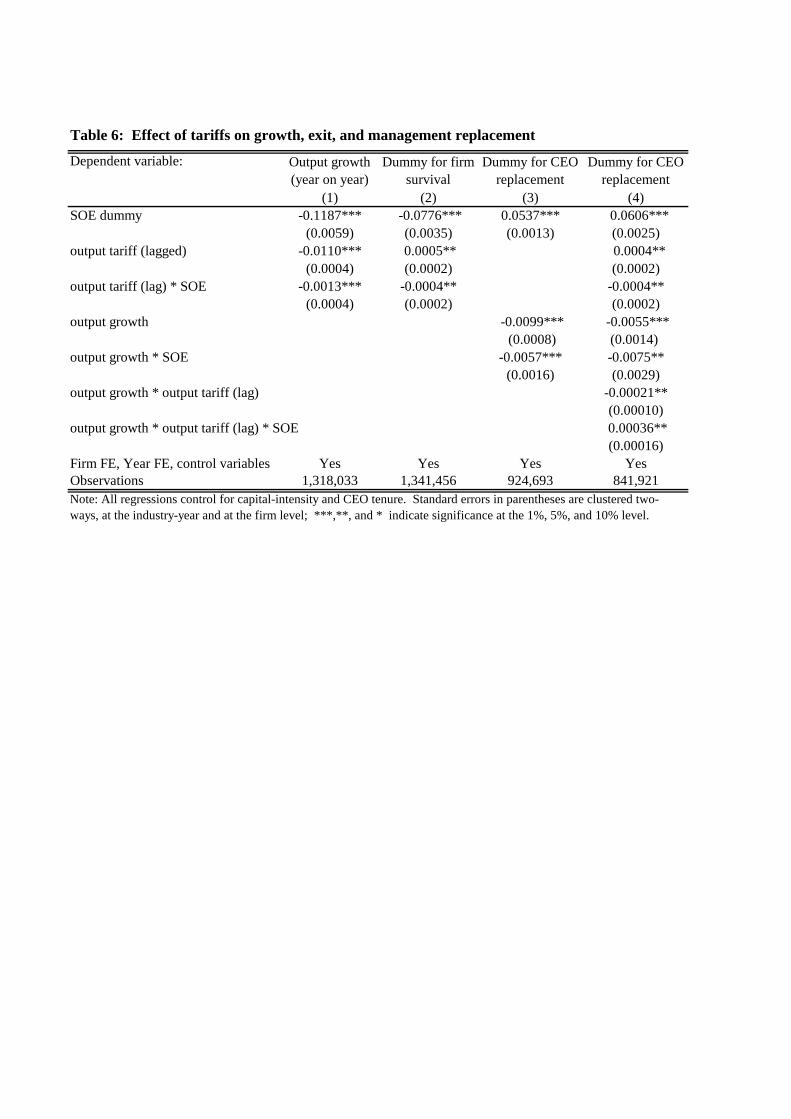

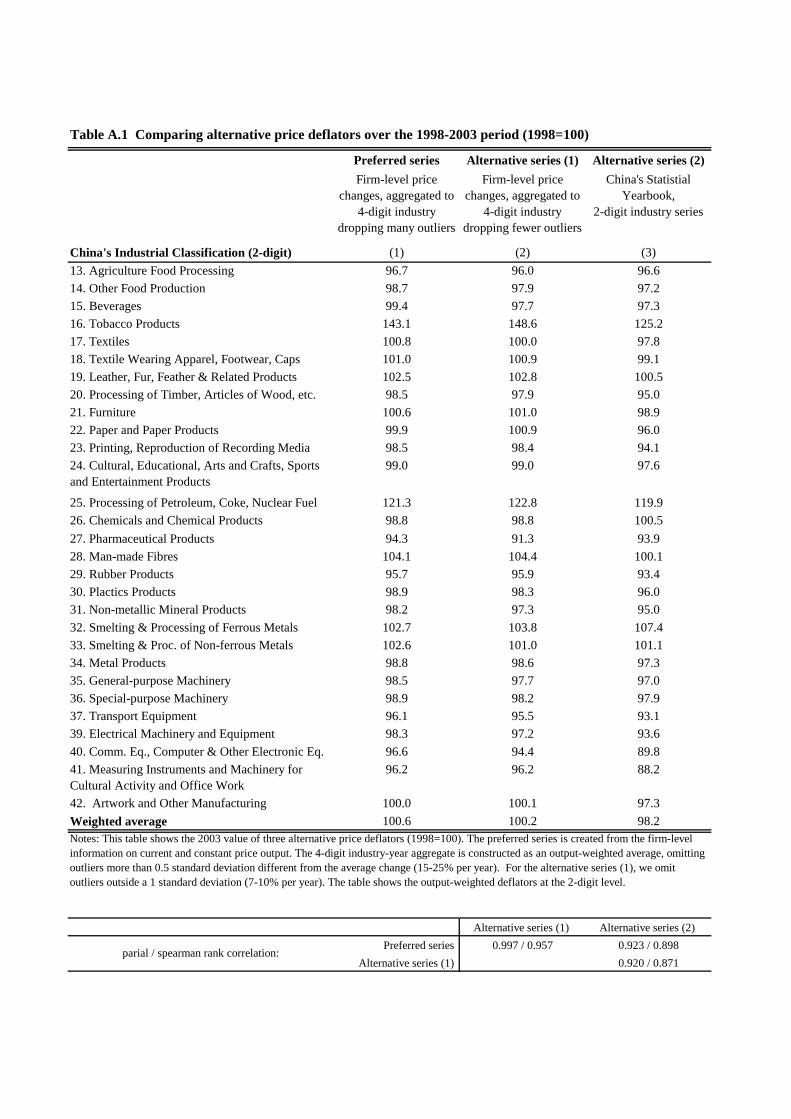
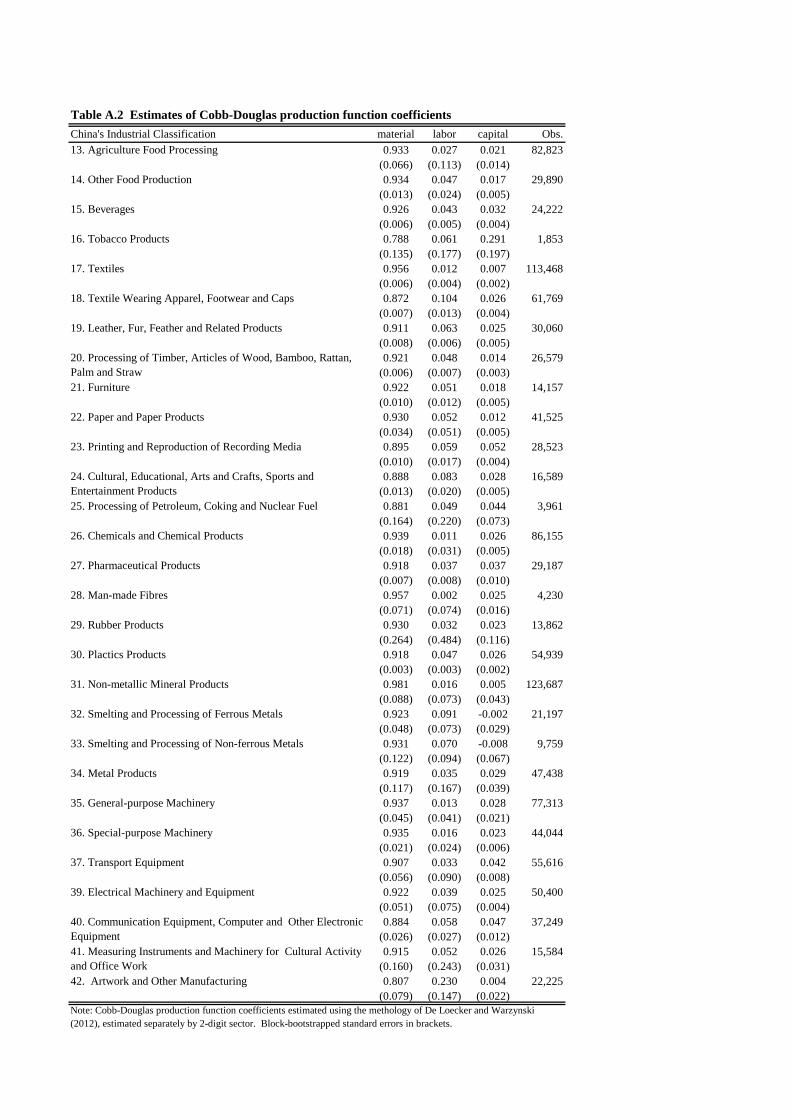

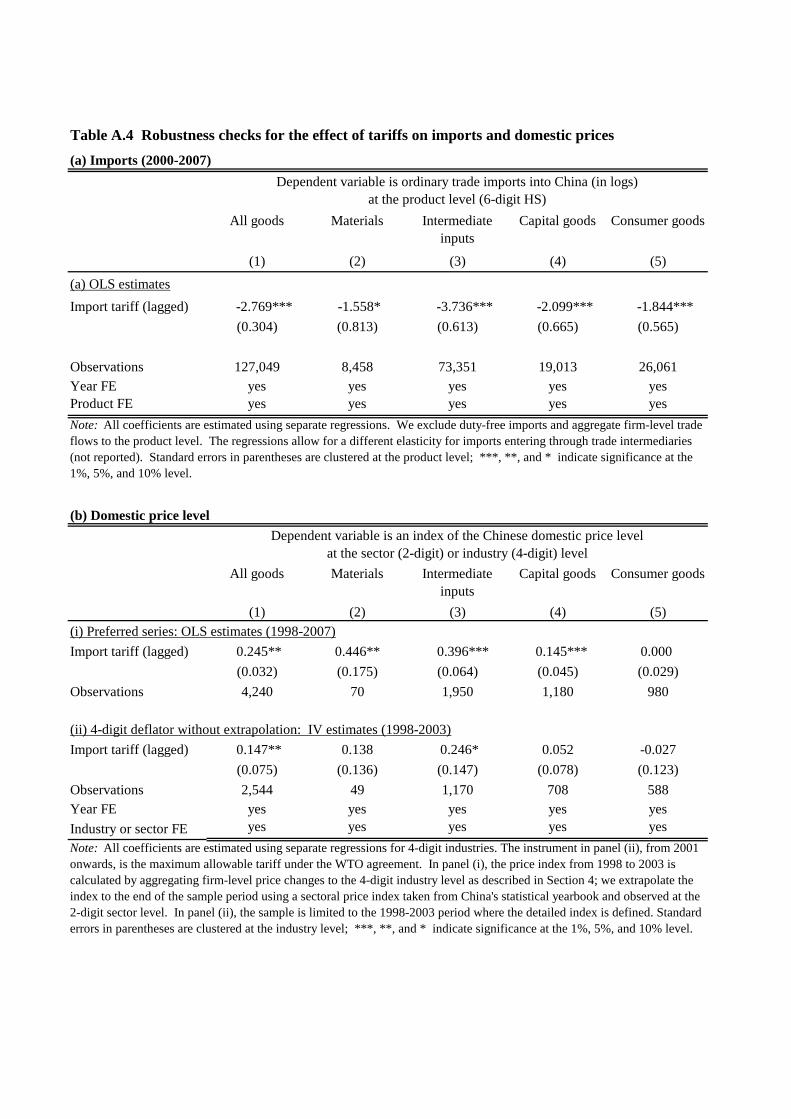
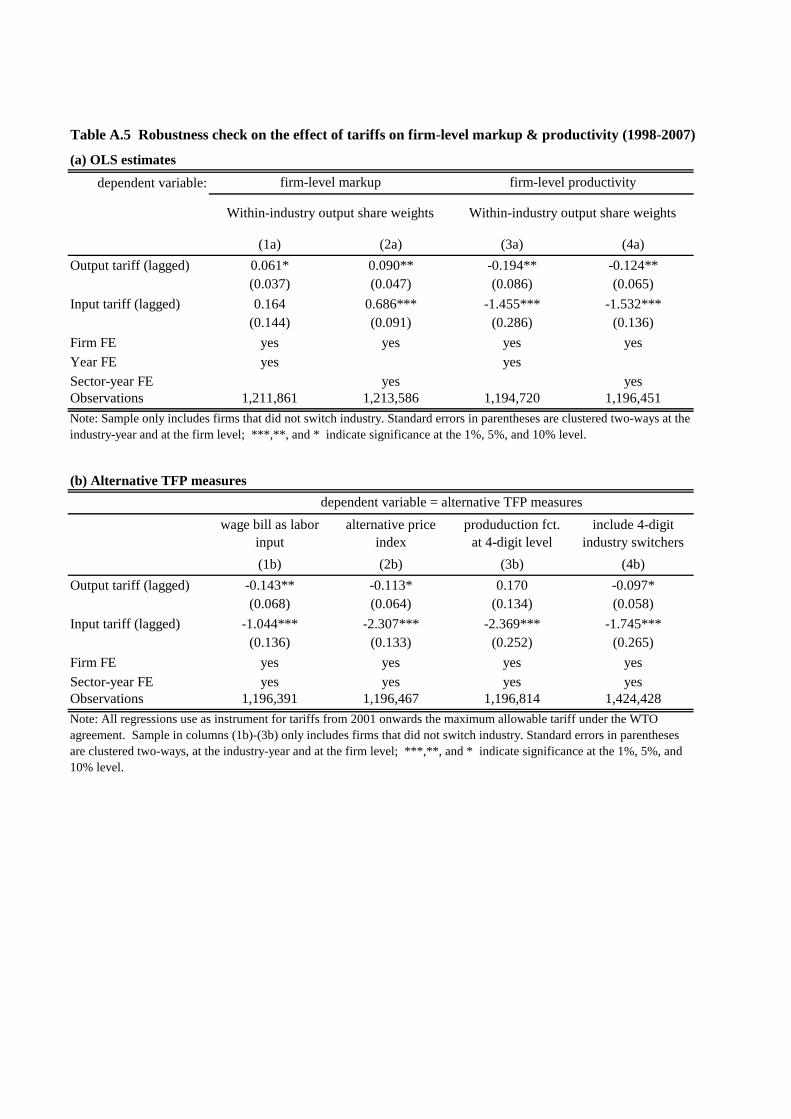
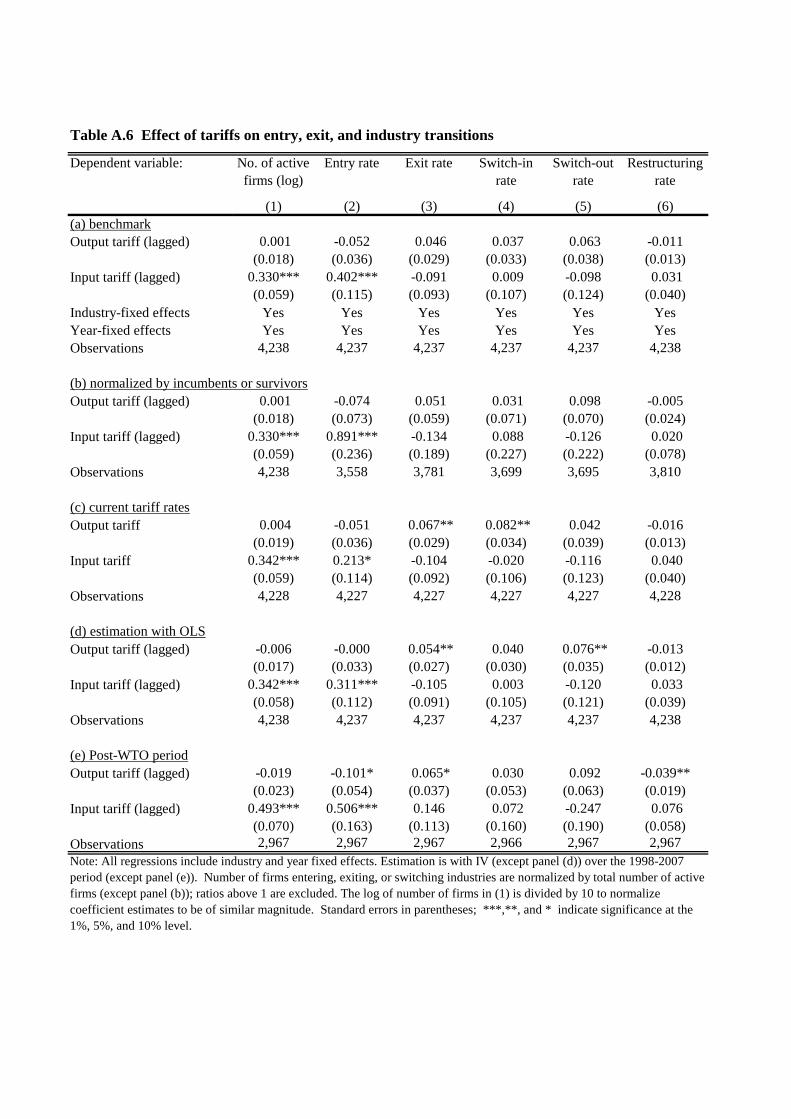


![Accession to the WTO - WHO · © WTO - OMC 2004 Accession to the WTO ... WORLD TRADE ORGANIZATION ... Microsoft PowerPoint - WHOpres.ppt [Read-Only] Author:](https://static.documents.pub/doc/80x56/5aea95b97f8b9a90318bd175/accession-to-the-wto-wto-omc-2004-accession-to-the-wto-world-trade-organization.jpg)

