35
WWE INVESTOR PRESENTATION- JANUARY 2017
| Date post: | 08-Mar-2018 |
| Category: |
Documents |
| Upload: | phungthuan |
| View: | 233 times |
| Download: | 5 times |

W W E I N V E S T O R P R E S E N TAT I O N - J A N U A R Y 2 0 1 7
This presentation contains forward-looking statements pursuant to the safe harbor provisions of the Securities Litigation Reform Act of 1995, which are subject to various risks and
uncertainties. These risks and uncertainties include, without limitation, risks relating to: WWE Network (including the risk that we are unable to attract, retain and renew subscribers);
major distribution agreements; our need to continue to develop creative and entertaining programs and events; the possibility of a decline in the popularity of our brand of sports
entertainment; the continued importance of key performers and the services of Vincent K. McMahon; possible adverse changes in the regulatory atmosphere and related private
sector initiatives; the highly competitive, rapidly changing and increasingly fragmented nature of the markets in which we operate and greater financial resources or marketplace
presence of many of our competitors; uncertainties associated with international markets; our difficulty or inability to promote and conduct our live events and/or other businesses if
we do not comply with applicable regulations; our dependence on our intellectual property rights, our need to protect those rights, and the risks of our infringement of others’
intellectual property rights; the complexity of our rights agreements across distribution mechanisms and geographical areas; potential substantial liability in the event of accidents or
injuries occurring during our physically demanding events including, without limitation, claims relating to CTE; large public events as well as travel to and from such events; our
feature film business; our expansion into new or complementary businesses and/or strategic investments; our computer systems and online operations; privacy norms and
regulations; a possible decline in general economic conditions and disruption in financial markets; our accounts receivable; our revolving credit facility; litigation; our potential failure
to meet market expectations for our financial performance, which could adversely affect our stock; Vincent K. McMahon exercises control over our affairs, and his interests may
conflict with the holders of our Class A common stock; a substantial number of shares are eligible for sale by the McMahons and the sale, or the perception of possible sales, of
those shares could lower our stock price; and the relatively small public “float” of our Class A common stock. In addition, our dividend is dependent on a number of factors, including,
among other things, our liquidity and historical and projected cash flow, strategic plan (including alternative uses of capital), our financial results and condition, contractual and legal
restrictions on the payment of dividends (including under our revolving credit facility), general economic and competitive conditions and such other factors as our Board of Directors
may consider relevant. Forward-looking statements made by the Company speak only as of the date made and are subject to change without any obligation on the part of the
Company to update or revise them. Undue reliance should not be placed on these statements. For more information about risks and uncertainties associated with the Company’s
business, please refer to the “Management’s Discussion and Analysis of Financial Condition and Results of Operations” and “Risk Factors” sections of the Company’s SEC filings,
including, but not limited to, our annual report on Form 10-K and quarterly reports on Form 10-Q. All forward-looking statements described herein are qualified by these cautionary
statements and there can be no assurance that the actual results, events or developments referenced herein will occur or be realized. The company does not undertake any
obligation to update or revise forward-looking statements to reflect changed assumptions, the occurrence of unanticipated events or changes to future operation results.
This presentation contains non-GAAP financial information, including OIBDA, Adjusted OIBDA, Net Debt and Free Cash Flow. We define OIBDA as operating income before
depreciation and amortization, excluding feature film and television production amortization and related impairments. OIBDA is a non-GAAP financial measure and may be different
than similarly-titled non-GAAP financial measures used by other companies. A limitation of OIBDA is that it excludes depreciation and amortization, which represents the periodic
charge for certain fixed assets and intangible assets used in generating revenues for the Company's business. In addition, we define Free Cash Flow as net cash provided by
operating activities less cash used for capital expenditures. We believe that operating income is the most directly comparable GAAP financial measure to OIBDA and Adjusted
OIBDA, Total Debt is the most directly comparable GAAP financial measure to Net Debt, and net cash provided by operating activities is the most directly comparable GAAP financial
measure to Free Cash Flow. Neither OIBDA, Adjusted OIBDA, Net Debt nor Free Cash Flow should be regarded as an alternative to the most directly comparably GAAP financial
measure as an indicator of operating performance, or to the statement of cash flows as a measure of liquidity, nor should either metric be considered in isolation or as a substitute for
financial measures prepared in accordance with GAAP. See the Appendix at the end of this presentation for a reconciliation of the non-GAAP measures presented herein.
Forward-Looking Statements
2
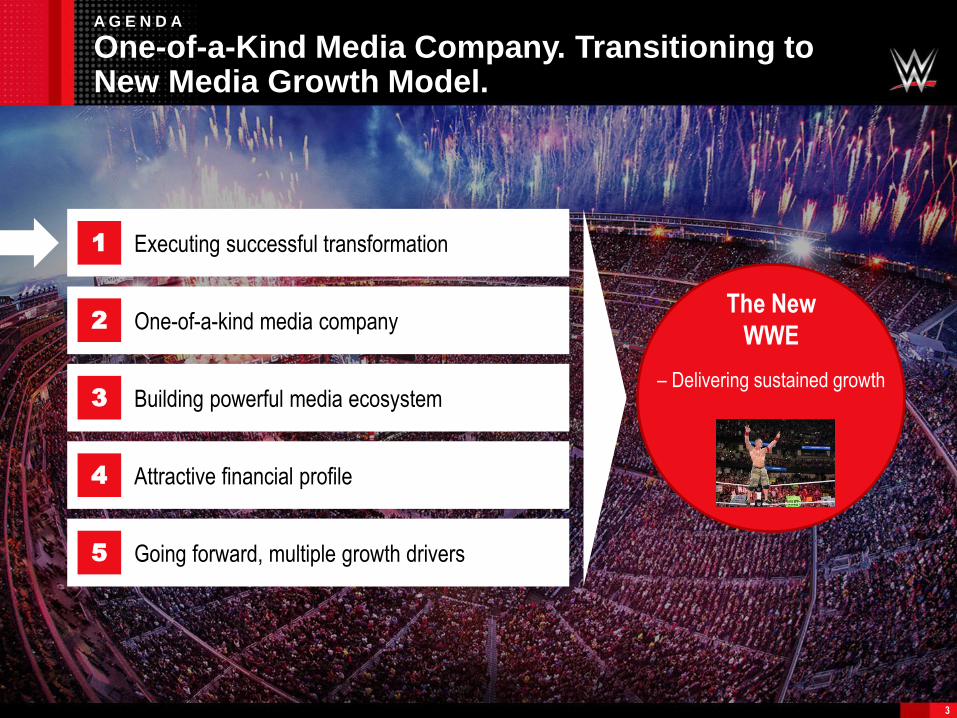
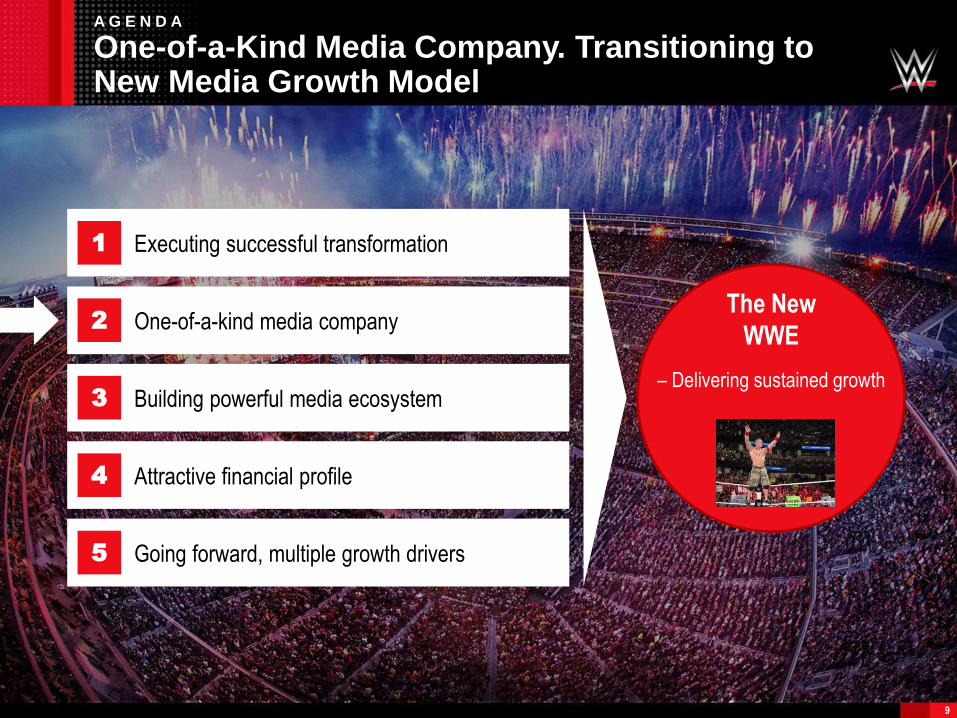
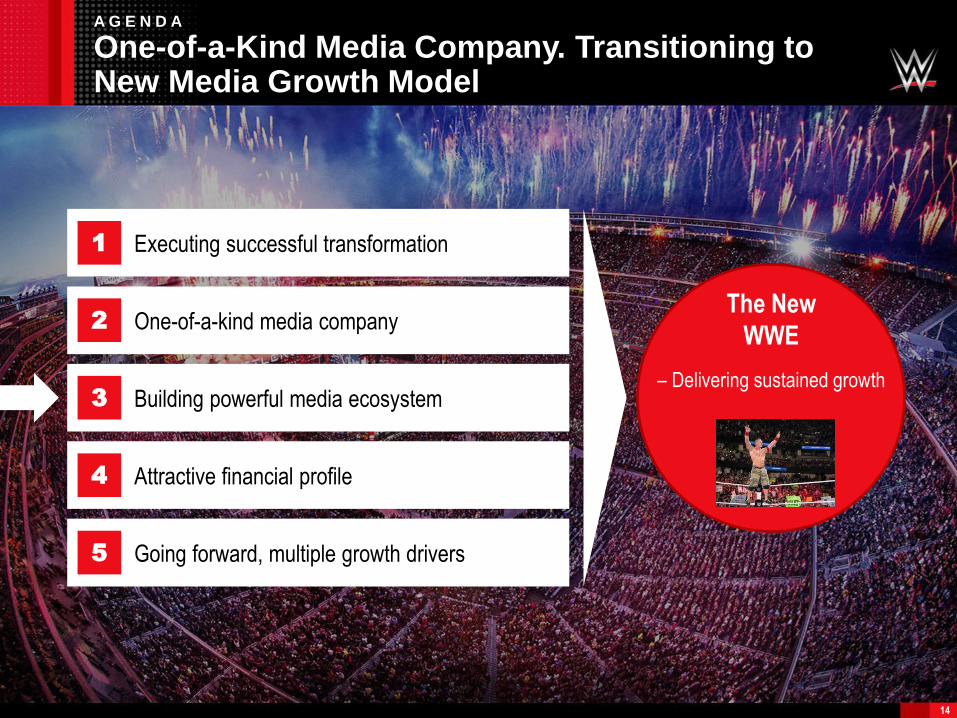
A G E N D A
One-of-a-Kind Media Company. Transitioning to New Media Growth Model.
3
Executing successful transformation1
One-of-a-kind media company2
Building powerful media ecosystem3
Attractive financial profile4
Going forward, multiple growth drivers5
The New
WWE
– Delivering sustained growth
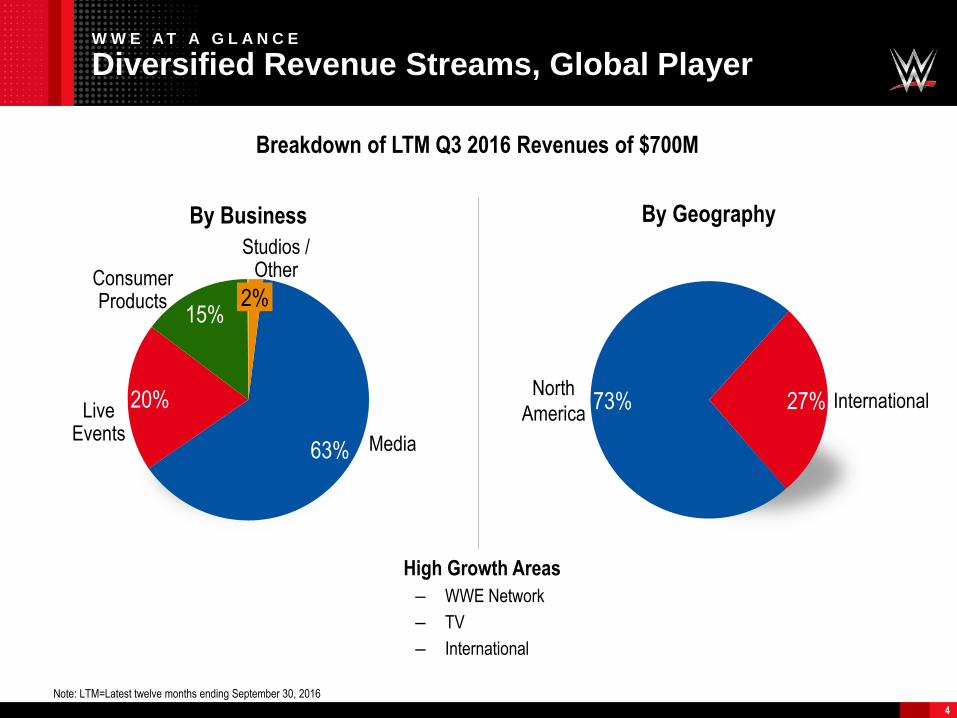
W W E A T A G L A N C E
Diversified Revenue Streams, Global Player
Breakdown of LTM Q3 2016 Revenues of $700M
By Business By Geography
High Growth Areas
– WWE Network
– TV
– International
4
Note: LTM=Latest twelve months ending September 30, 2016
20%
2%15%
63%
International73% 27%North
America
Media
Consumer Products
Studios /Other
Live Events
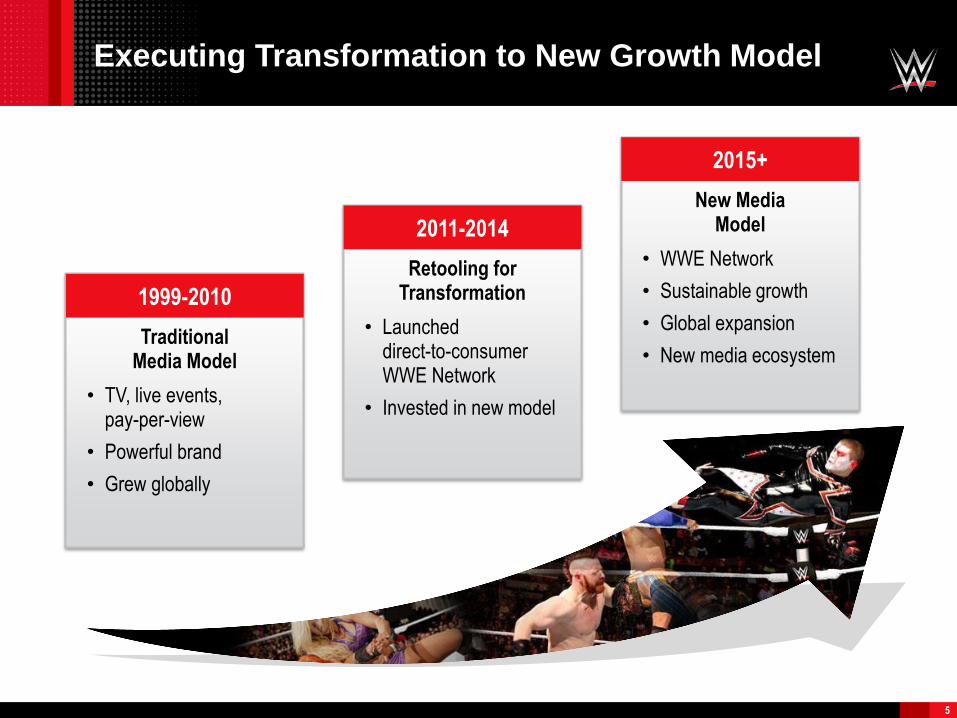
Executing Transformation to New Growth Model
1999-2010
TraditionalMedia Model
• TV, live events, pay-per-view
• Powerful brand
• Grew globally
2011-2014
Retooling for Transformation
• Launched direct-to-consumer WWE Network
• Invested in new model
2015+
New MediaModel
• WWE Network
• Sustainable growth
• Global expansion
• New media ecosystem
5
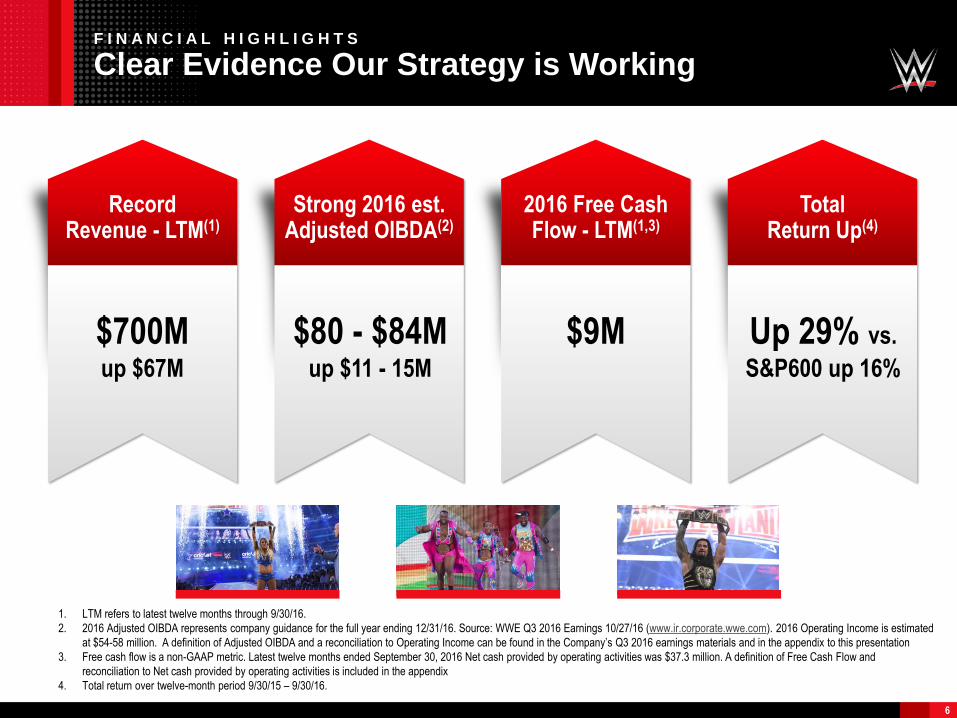
F I N A N C I A L H I G H L I G H T S
Clear Evidence Our Strategy is Working
RecordRevenue - LTM(1)
Strong 2016 est.Adjusted OIBDA(2)
2016 Free Cash Flow - LTM(1,3)
Total Return Up(4)
$700Mup $67M
$80 - $84Mup $11 - 15M
Up 29% vs.
S&P600 up 16%
6
$9M
1. LTM refers to latest twelve months through 9/30/16.
2. 2016 Adjusted OIBDA represents company guidance for the full year ending 12/31/16. Source: WWE Q3 2016 Earnings 10/27/16 (www.ir.corporate.wwe.com). 2016 Operating Income is estimated
at $54-58 million. A definition of Adjusted OIBDA and a reconciliation to Operating Income can be found in the Company’s Q3 2016 earnings materials and in the appendix to this presentation
3. Free cash flow is a non-GAAP metric. Latest twelve months ended September 30, 2016 Net cash provided by operating activities was $37.3 million. A definition of Free Cash Flow and
reconciliation to Net cash provided by operating activities is included in the appendix
4. Total return over twelve-month period 9/30/15 – 9/30/16.
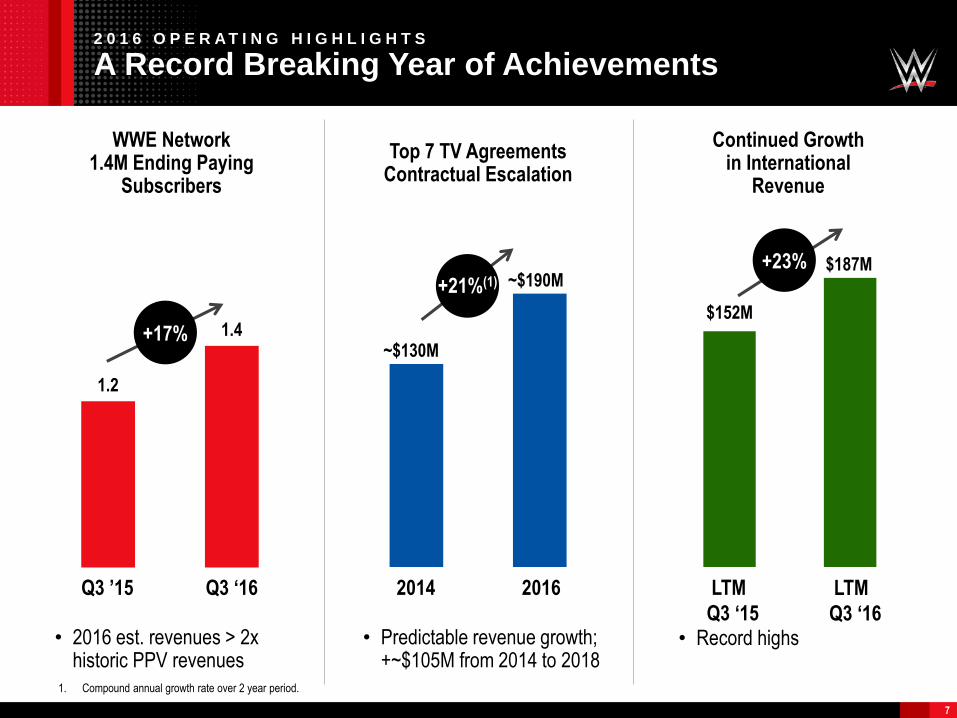
2 0 1 6 O P E R A T I N G H I G H L I G H T S
A Record Breaking Year of Achievements
WWE Network1.4M Ending Paying
Subscribers
Continued Growthin International
Revenue
Top 7 TV Agreements Contractual Escalation
1.2
1.4~$130M
~$190M
2014 2016
+21%(1)
$152M
$187M+23%
+17%
• 2016 est. revenues > 2x historic PPV revenues
• Predictable revenue growth; +~$105M from 2014 to 2018
• Record highs
7
Q3 ’15 Q3 ‘16 LTM
Q3 ‘16
LTM
Q3 ‘15
1. Compound annual growth rate over 2 year period.
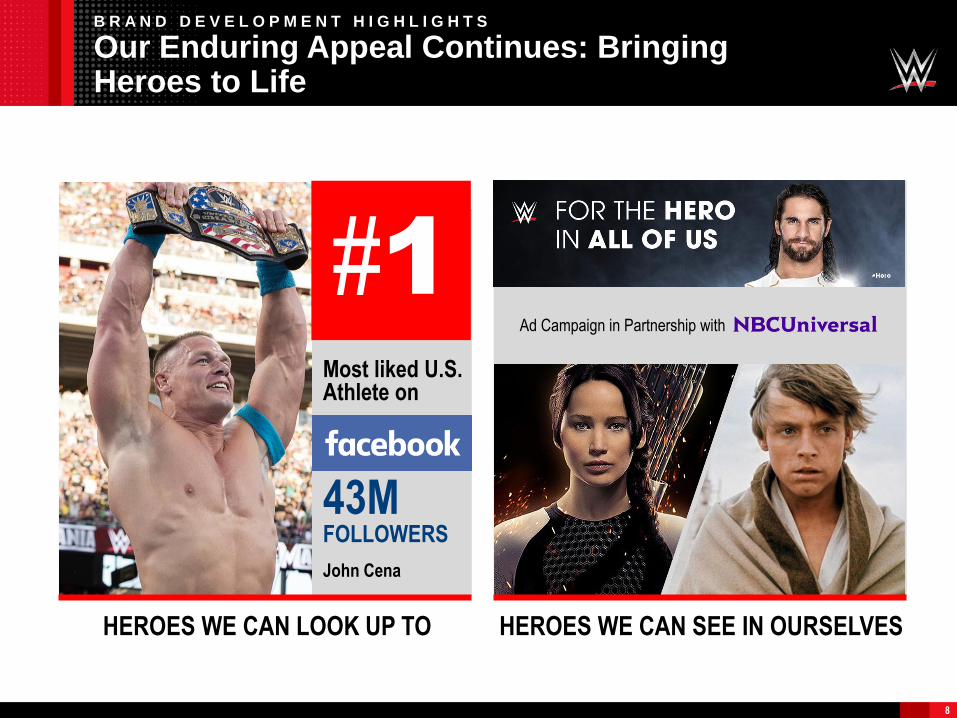
B R A N D D E V E L O P M E N T H I G H L I G H T S
Our Enduring Appeal Continues: Bringing Heroes to Life
Ad Campaign in Partnership with
Most liked U.S.Athlete on
43MFOLLOWERS
HEROES WE CAN LOOK UP TO HEROES WE CAN SEE IN OURSELVES
8
John Cena
#1
A G E N D A
One-of-a-Kind Media Company. Transitioning to New Media Growth Model
9
Executing successful transformation1
One-of-a-kind media company2
Building powerful media ecosystem3
Attractive financial profile4
Going forward, multiple growth drivers5
The New
WWE
– Delivering sustained growth
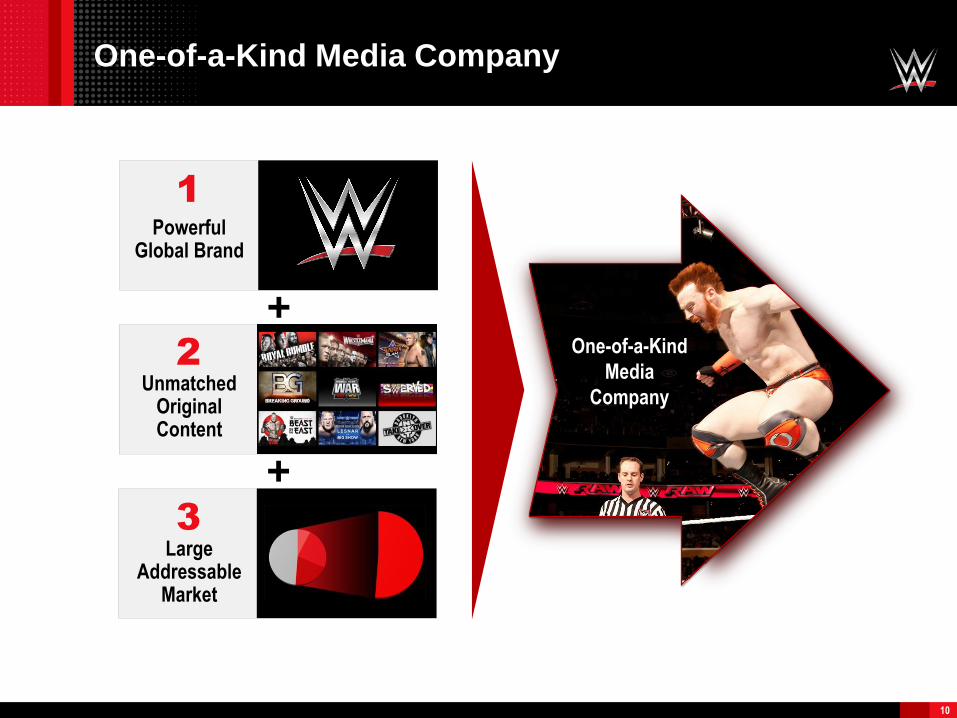
One-of-a-Kind Media Company
Powerful Global Brand
Large Addressable
Market
One-of-a-Kind
Media
Company
10
1
UnmatchedOriginalContent
2
3
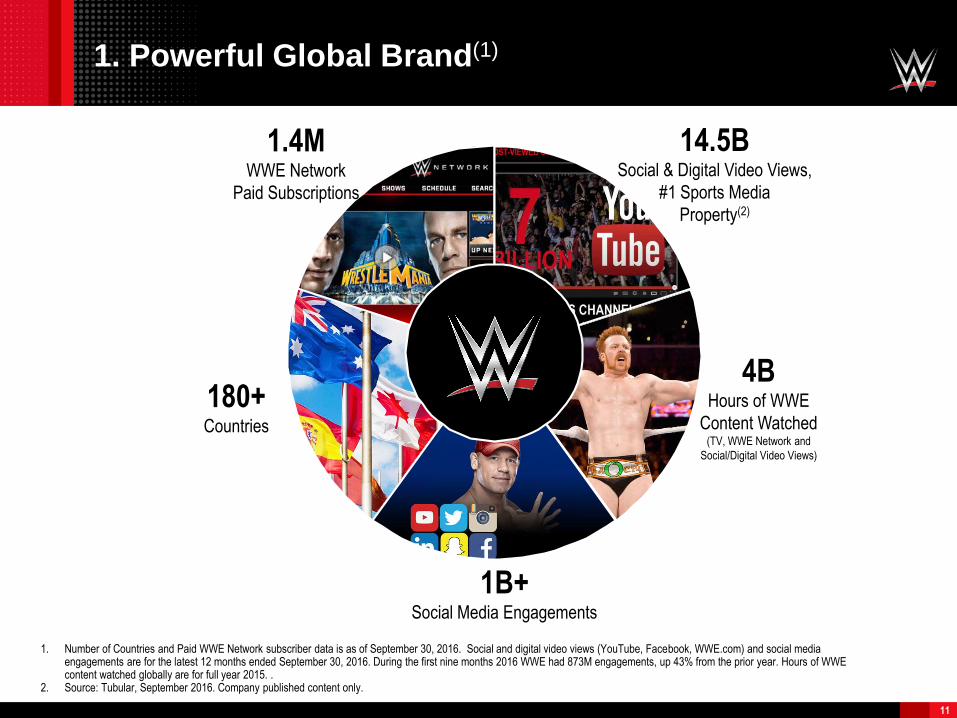
1. Powerful Global Brand(1)
11
1B+Social Media Engagements
180+Countries
1.4MWWE Network
Paid Subscriptions
4BHours of WWE
Content Watched(TV, WWE Network and
Social/Digital Video Views)
14.5BSocial & Digital Video Views,
#1 Sports Media
Property(2)
1. Number of Countries and Paid WWE Network subscriber data is as of September 30, 2016. Social and digital video views (YouTube, Facebook, WWE.com) and social media engagements are for the latest 12 months ended September 30, 2016. During the first nine months 2016 WWE had 873M engagements, up 43% from the prior year. Hours of WWE content watched globally are for full year 2015. .
2. Source: Tubular, September 2016. Company published content only.
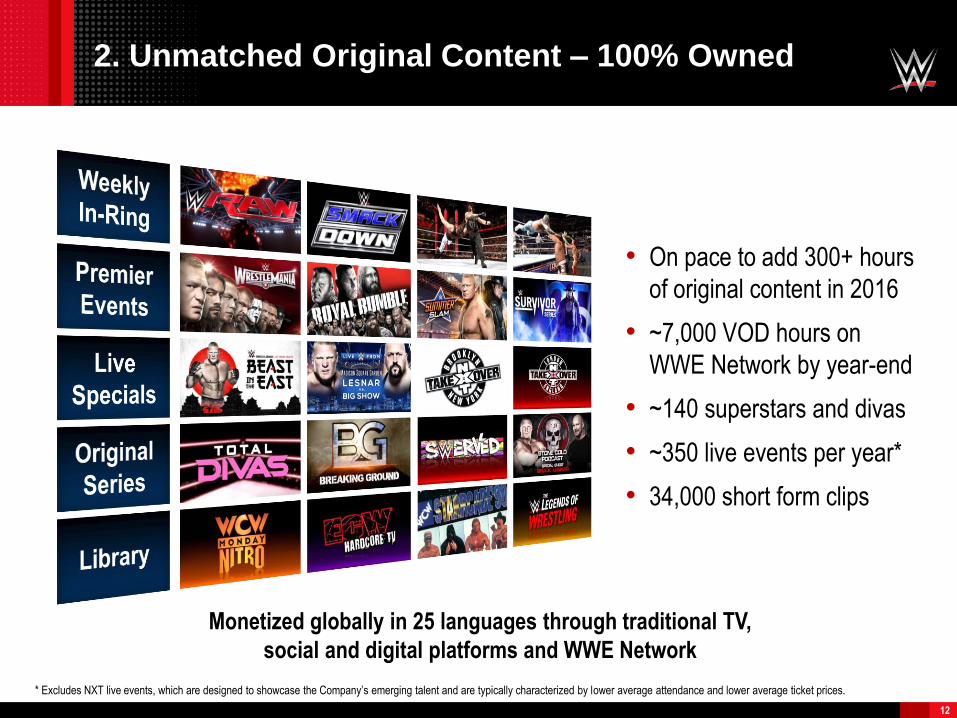
2. Unmatched Original Content – 100% Owned
• On pace to add 300+ hours
of original content in 2016
• ~7,000 VOD hours on
WWE Network by year-end
• ~140 superstars and divas
• ~350 live events per year*
• 34,000 short form clips
Monetized globally in 25 languages through traditional TV,
social and digital platforms and WWE Network
12
* Excludes NXT live events, which are designed to showcase the Company’s emerging talent and are typically characterized by lower average attendance and lower average ticket prices.
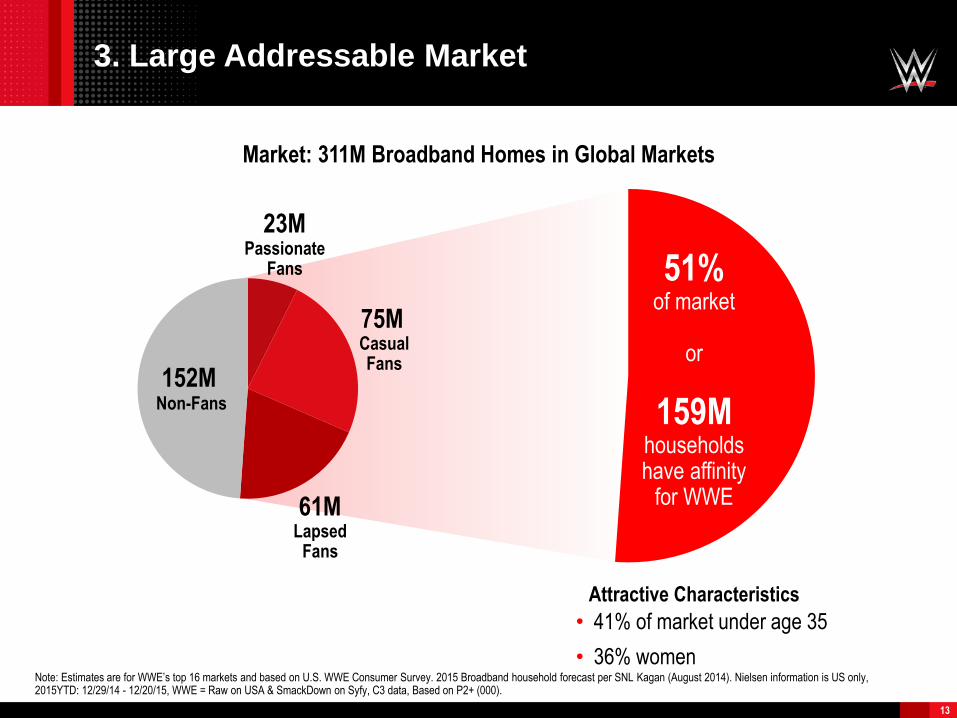
3. Large Addressable Market
13
Note: Estimates are for WWE’s top 16 markets and based on U.S. WWE Consumer Survey. 2015 Broadband household forecast per SNL Kagan (August 2014). Nielsen information is US only, 2015YTD: 12/29/14 - 12/20/15, WWE = Raw on USA & SmackDown on Syfy, C3 data, Based on P2+ (000).
Market: 311M Broadband Homes in Global Markets
• 41% of market under age 35
• 36% women
Attractive Characteristics
51%of market
or
159Mhouseholdshave affinity
for WWE
Passionate Fans
CasualFans
23M
75M
LapsedFans
61M
Non-Fans
152M
A G E N D A
One-of-a-Kind Media Company. Transitioning to New Media Growth Model
14
Executing successful transformation1
One-of-a-kind media company2
Building powerful media ecosystem3
Attractive financial profile4
Going forward, multiple growth drivers5
The New
WWE
– Delivering sustained growth
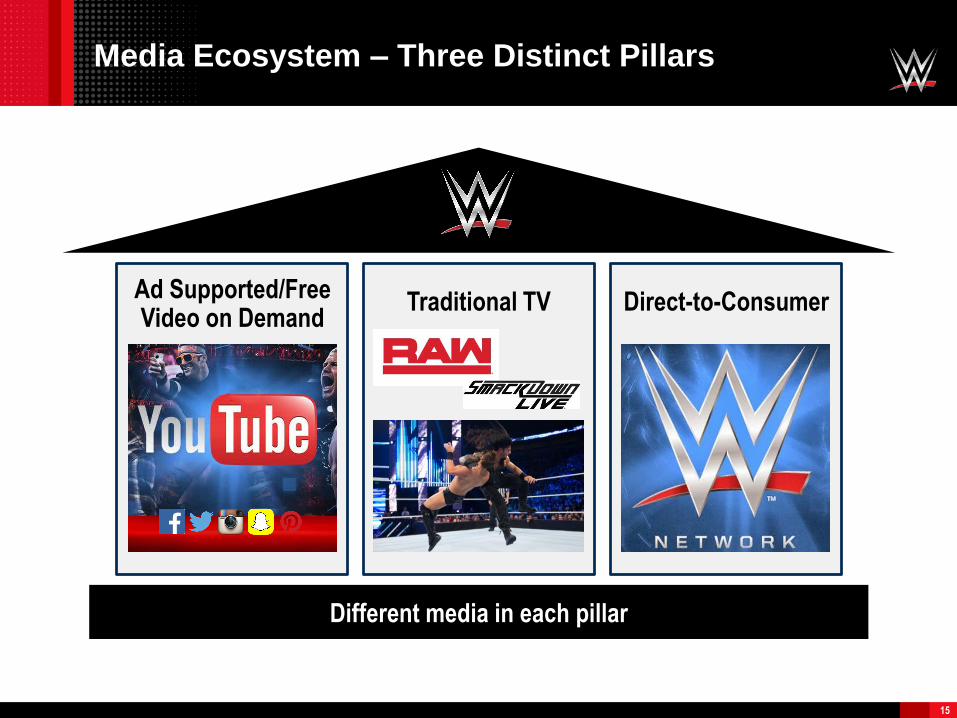
Media Ecosystem – Three Distinct Pillars
Ad Supported/FreeVideo on Demand
Traditional TV Direct-to-Consumer
Different media in each pillar
15
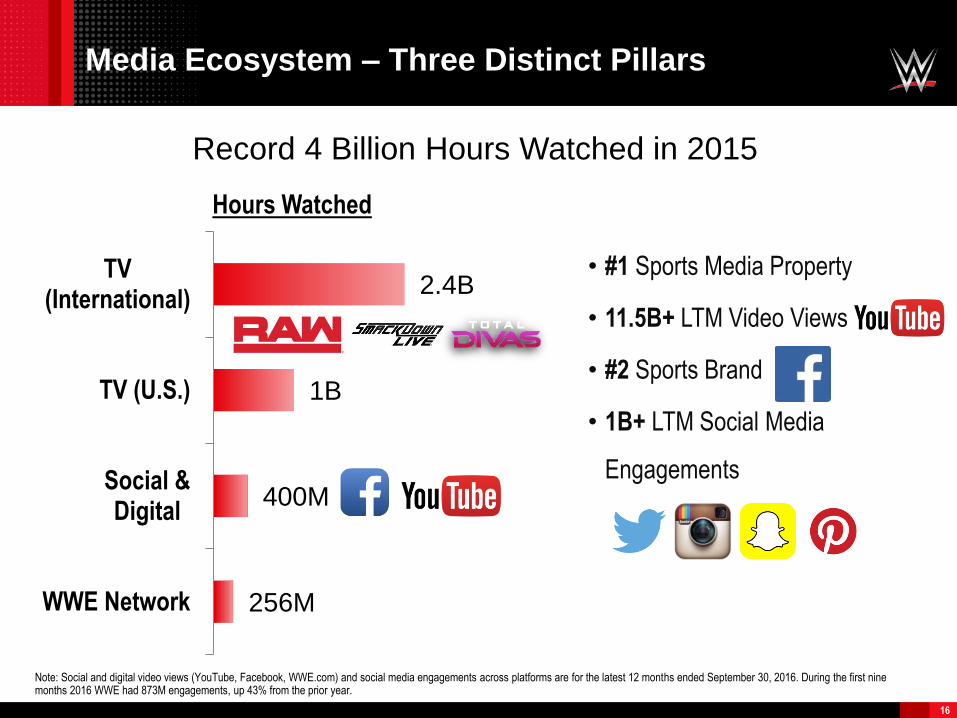
• #1 Sports Media Property
• 11.5B+ LTM Video Views
• #2 Sports Brand
• 1B+ LTM Social Media
Engagements
Media Ecosystem – Three Distinct Pillars
16
Record 4 Billion Hours Watched in 2015
256M
400M
1B
2.4B
WWE Network
Social &Digital
TV (U.S.)
TV(International)
Hours Watched
Note: Social and digital video views (YouTube, Facebook, WWE.com) and social media engagements across platforms are for the latest 12 months ended September 30, 2016. During the first nine months 2016 WWE had 873M engagements, up 43% from the prior year.
Traditional TV Direct-to-Consumer
Different media in each pillar
Ad Supported/FreeVideo on Demand
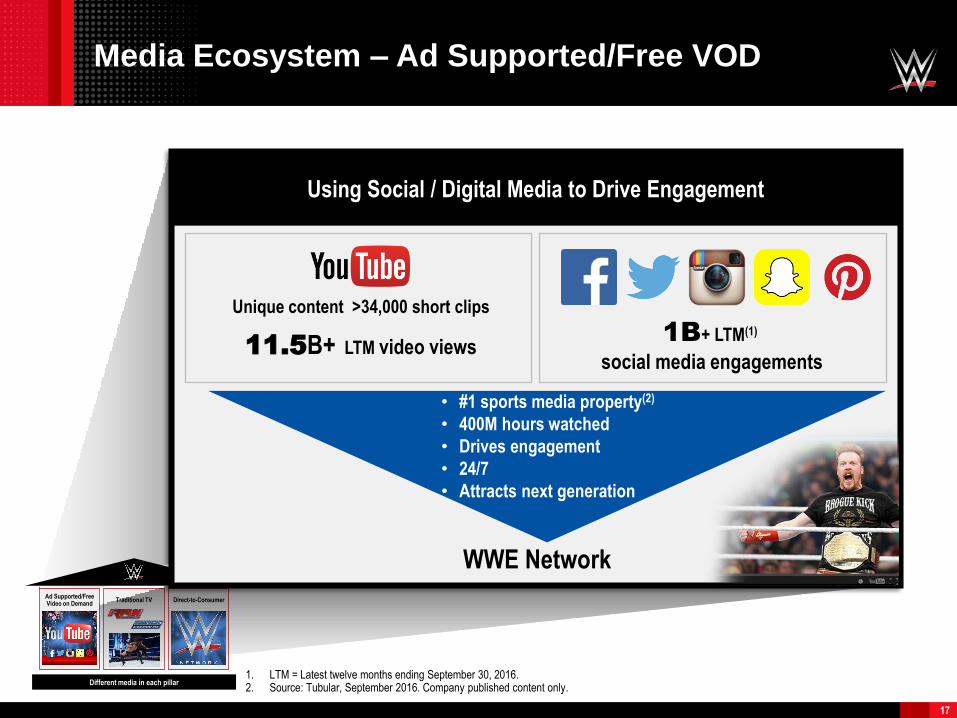
Media Ecosystem – Ad Supported/Free VOD
Using Social / Digital Media to Drive Engagement
1B+ LTM(1)
social media engagements11.5B+ LTM video views
Unique content >34,000 short clips
• #1 sports media property(2)
• 400M hours watched
• Drives engagement
• 24/7
• Attracts next generation
WWE Network
17
1. LTM = Latest twelve months ending September 30, 2016.2. Source: Tubular, September 2016. Company published content only.
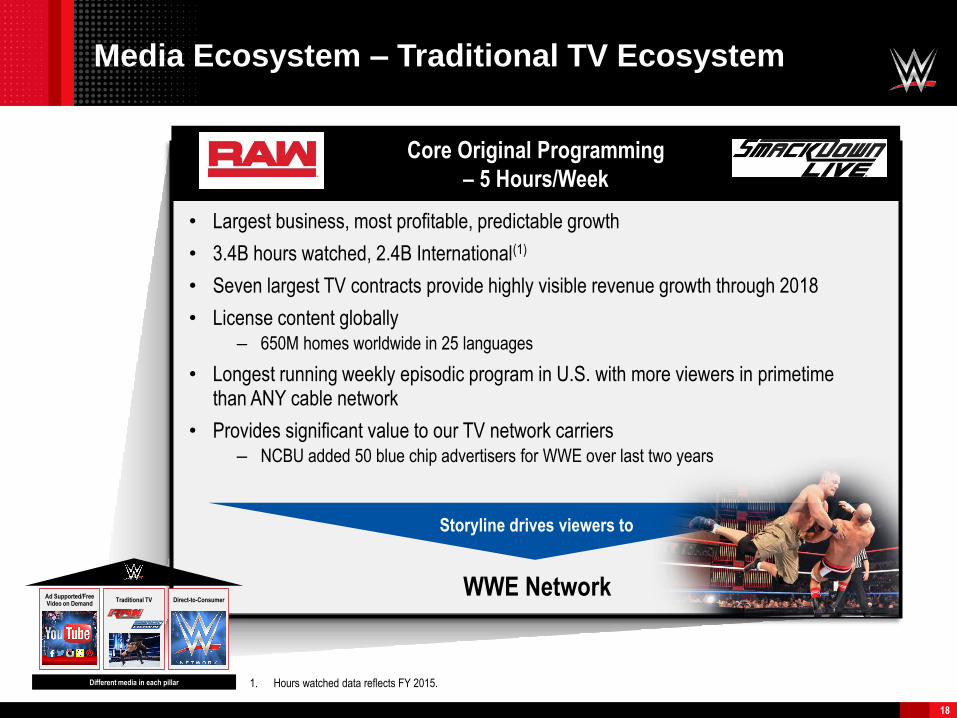
Media Ecosystem – Traditional TV Ecosystem
• Largest business, most profitable, predictable growth
• 3.4B hours watched, 2.4B International(1)
• Seven largest TV contracts provide highly visible revenue growth through 2018
• License content globally– 650M homes worldwide in 25 languages
• Longest running weekly episodic program in U.S. with more viewers in primetime than ANY cable network
• Provides significant value to our TV network carriers– NCBU added 50 blue chip advertisers for WWE over last two years
Core Original Programming
– 5 Hours/Week
WWE Network
Storyline drives viewers to
18
Traditional TV Direct-to-Consumer
Different media in each pillar
Ad Supported/FreeVideo on Demand
1. Hours watched data reflects FY 2015.
Traditional TV Direct-to-Consumer
Different media in each pillar
Ad Supported/FreeVideo on Demand
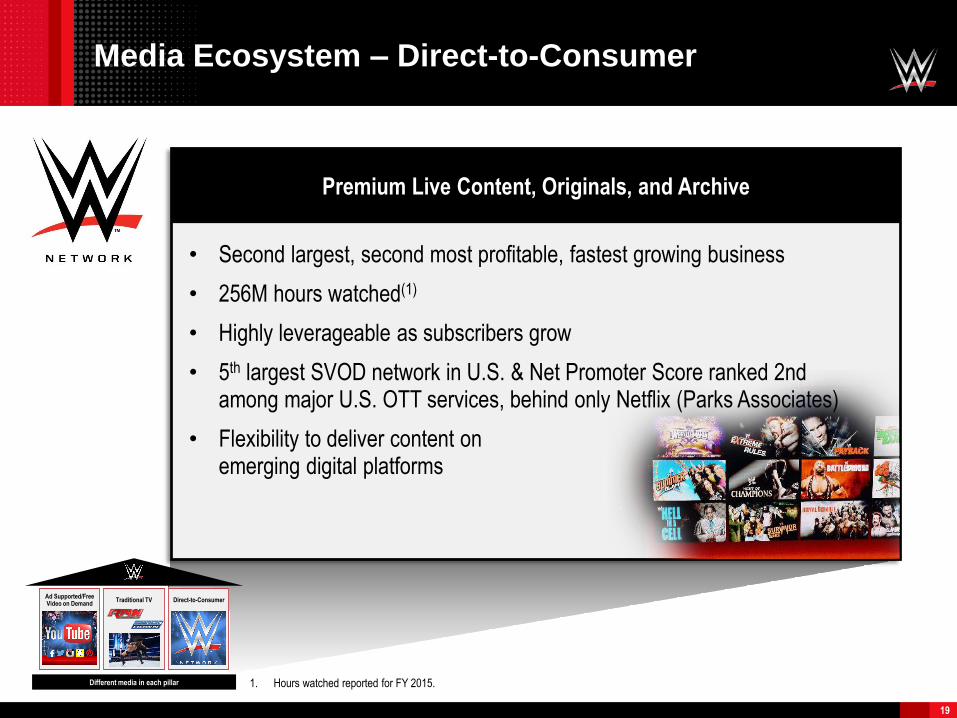
Media Ecosystem – Direct-to-Consumer
Premium Live Content, Originals, and Archive
• Second largest, second most profitable, fastest growing business
• 256M hours watched(1)
• Highly leverageable as subscribers grow
• 5th largest SVOD network in U.S. & Net Promoter Score ranked 2nd among major U.S. OTT services, behind only Netflix (Parks Associates)
• Flexibility to deliver content on emerging digital platforms
Pic
19
1. Hours watched reported for FY 2015.
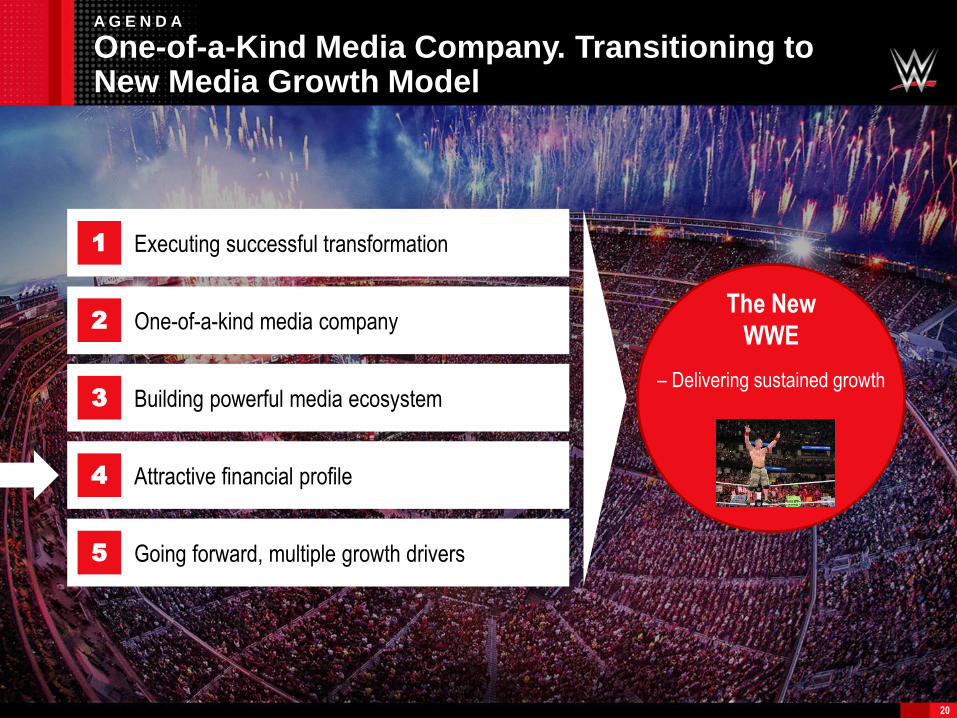
A G E N D A
One-of-a-Kind Media Company. Transitioning to New Media Growth Model
20
Executing successful transformation1
One-of-a-kind media company2
Building powerful media ecosystem3
Attractive financial profile4
Going forward, multiple growth drivers5
The New
WWE
– Delivering sustained growth
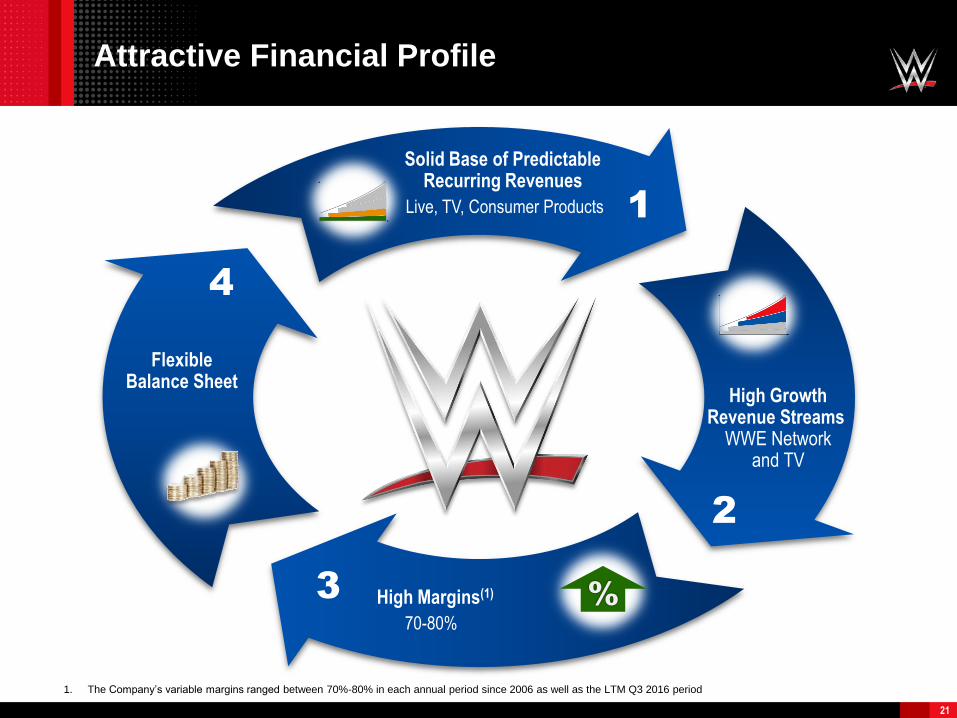
Attractive Financial Profile
1
High GrowthRevenue Streams
WWE Networkand TV
FlexibleBalance Sheet
High Margins(1)
70-80%
Solid Base of PredictableRecurring Revenues
Live, TV, Consumer Products
2
3
4
%
21
1. The Company’s variable margins ranged between 70%-80% in each annual period since 2006 as well as the LTM Q3 2016 period
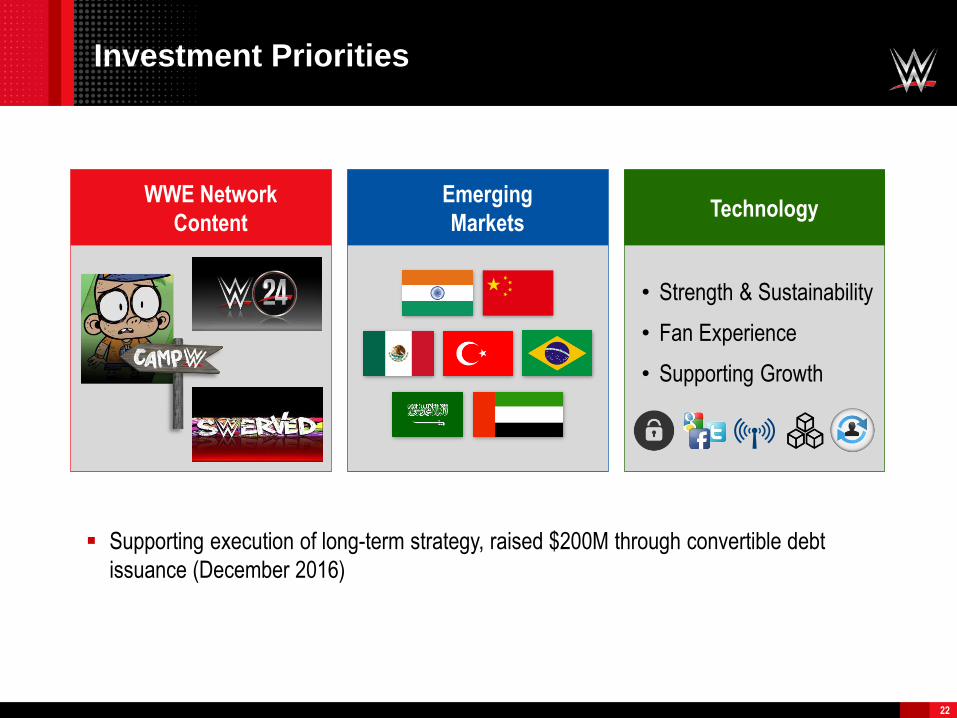
Investment Priorities
WWE Network
Content
22
Emerging
MarketsTechnology
• Strength & Sustainability
• Fan Experience
• Supporting Growth
Supporting execution of long-term strategy, raised $200M through convertible debt
issuance (December 2016)
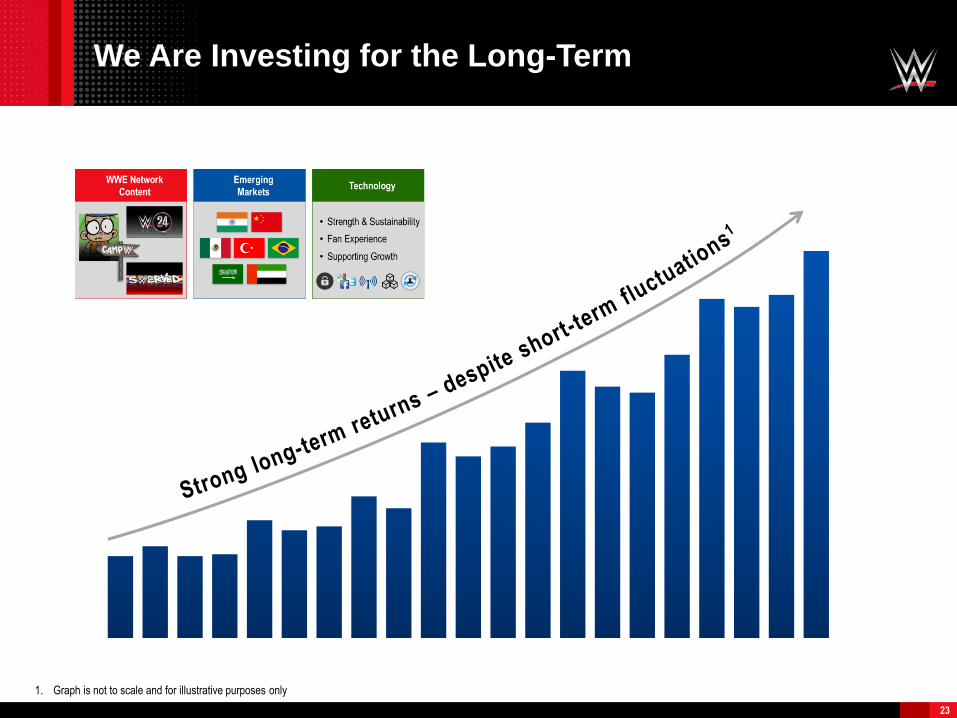
We Are Investing for the Long-Term
23
1. Graph is not to scale and for illustrative purposes only
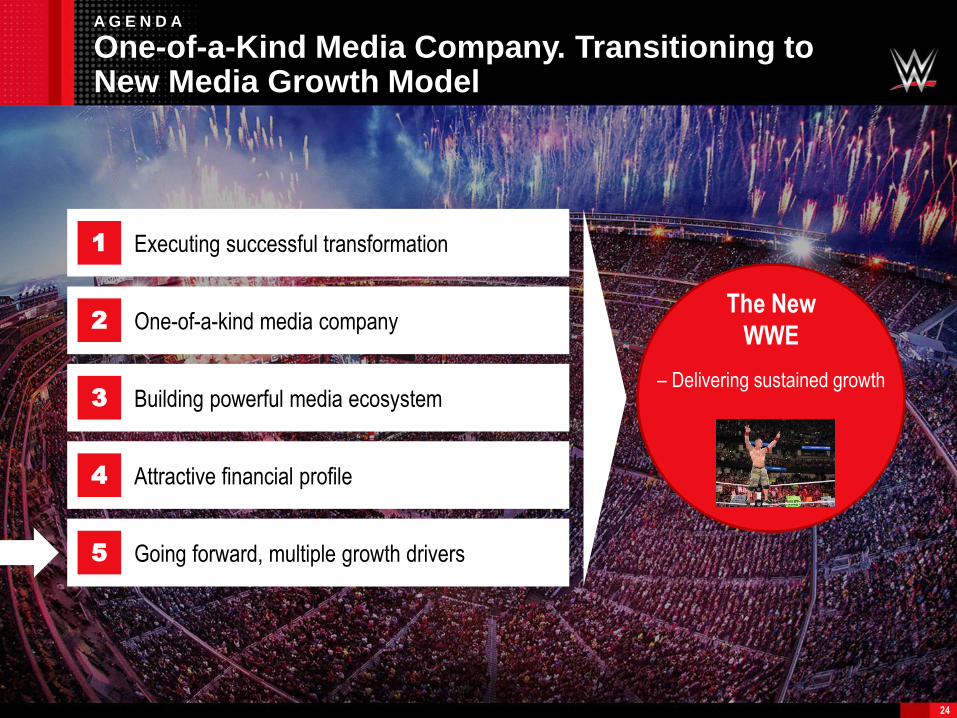
A G E N D A
One-of-a-Kind Media Company. Transitioning to New Media Growth Model
24
Executing successful transformation1
One-of-a-kind media company2
Building powerful media ecosystem3
Attractive financial profile4
Going forward, multiple growth drivers5
The New
WWE
– Delivering sustained growth
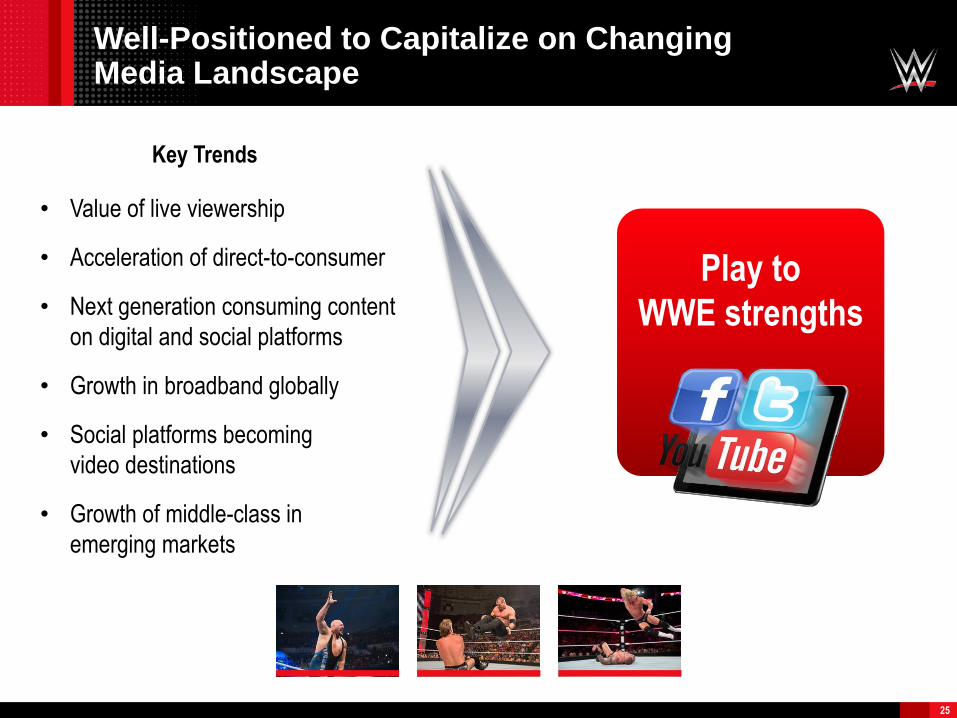
Well-Positioned to Capitalize on Changing Media Landscape
Key Trends
• Value of live viewership
• Acceleration of direct-to-consumer
• Next generation consuming content
on digital and social platforms
• Growth in broadband globally
• Social platforms becoming
video destinations
• Growth of middle-class in
emerging markets
Play to
WWE strengths
25
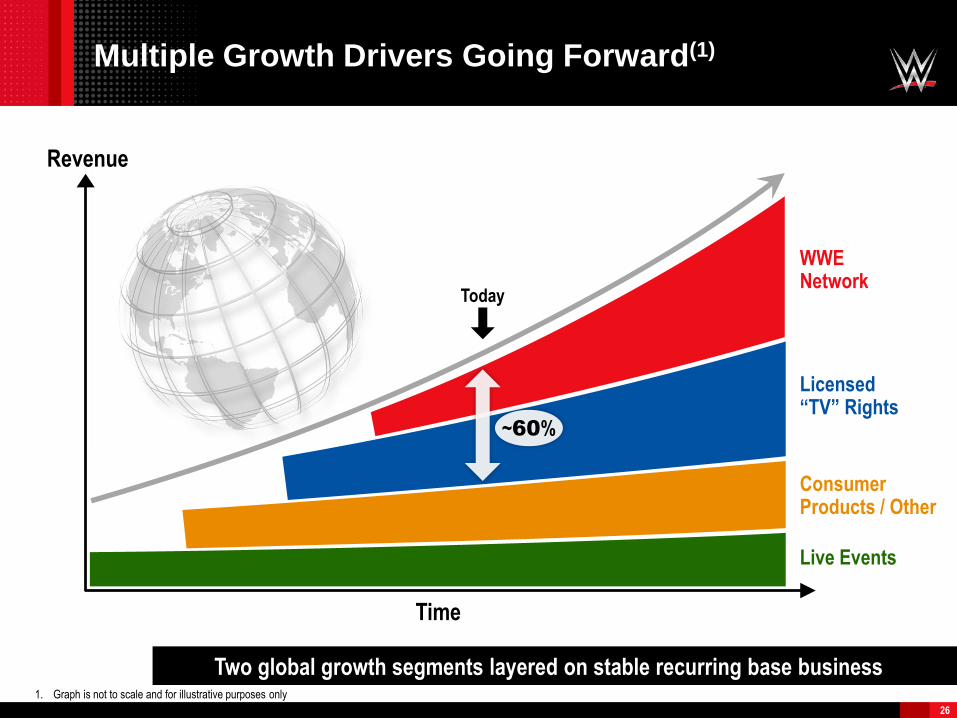
Multiple Growth Drivers Going Forward(1)
WWENetwork
Licensed “TV” Rights
Consumer Products / Other
Live Events
Revenue
Time
Today
~60%
Two global growth segments layered on stable recurring base business
26
1. Graph is not to scale and for illustrative purposes only
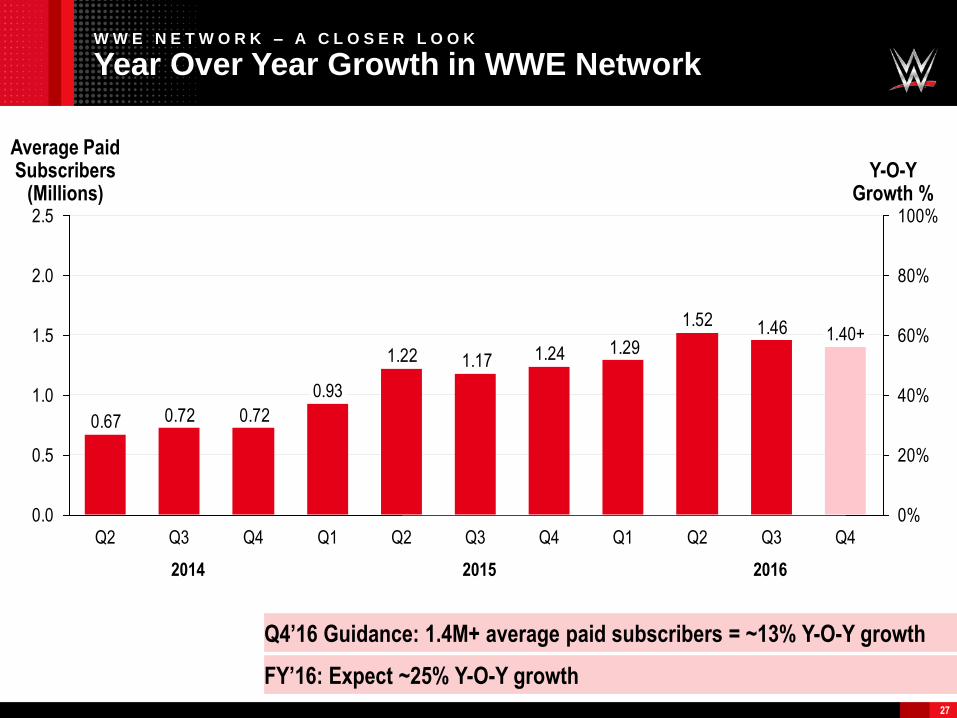
W W E N E T W O R K – A C L O S E R L O O K
Year Over Year Growth in WWE Network
27
Q4’16 Guidance: 1.4M+ average paid subscribers = ~13% Y-O-Y growth
27
Average Paid Subscribers
(Millions)Y-O-Y
Growth %
2014 2015 2016
1.461.52
1.291.241.171.22
0.720.720.67
0.0
0.5
1.0
1.5
2.0
2.5
0%
20%
40%
60%
80%
100%
Q2 Q3Q2Q1Q4Q3Q2Q1
0.93
Q4Q3
1.40+
Q4
FY’16: Expect ~25% Y-O-Y growth
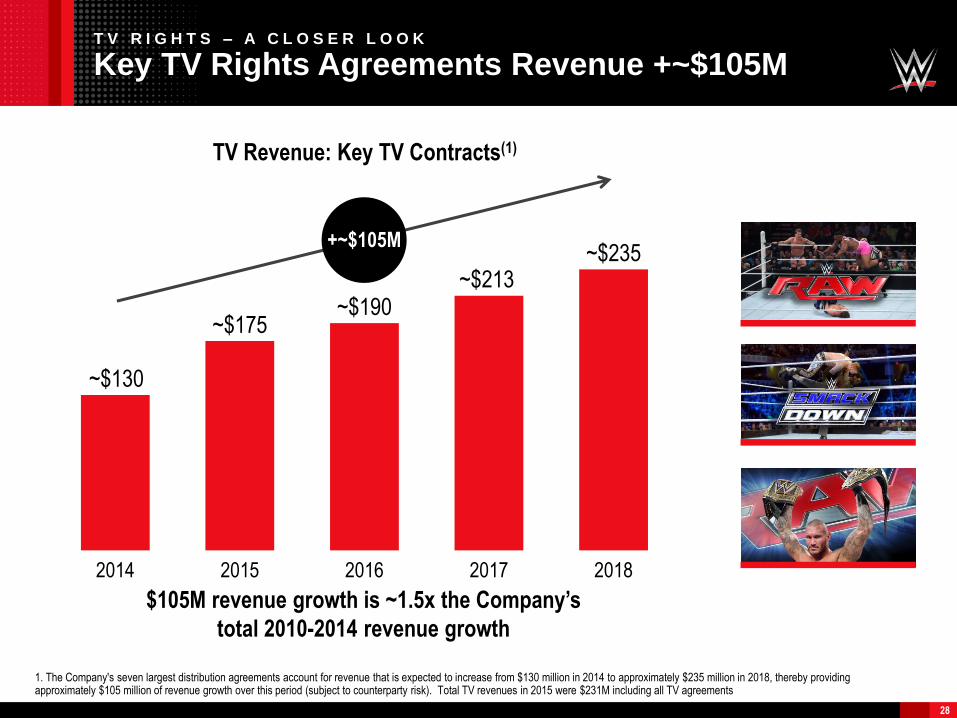
~$130
~$175 ~$190
~$213 ~$235
2014 2015 2016 2017 2018
$105M revenue growth is ~1.5x the Company’s
total 2010-2014 revenue growth
TV Revenue: Key TV Contracts(1)
T V R I G H T S – A C L O S E R L O O K
Key TV Rights Agreements Revenue +~$105M
28
1. The Company's seven largest distribution agreements account for revenue that is expected to increase from $130 million in 2014 to approximately $235 million in 2018, thereby providing approximately $105 million of revenue growth over this period (subject to counterparty risk). Total TV revenues in 2015 were $231M including all TV agreements
+~$105M
FuturePotential
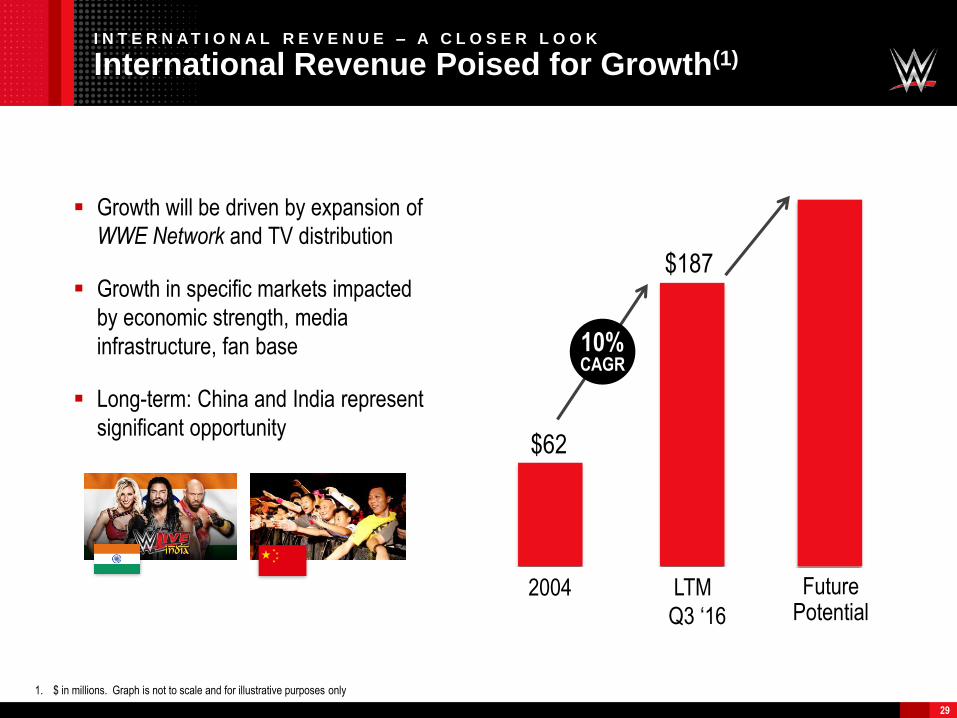
I N T E R N A T I O N A L R E V E N U E – A C L O S E R L O O K
International Revenue Poised for Growth(1)
29
$62
$187
Growth will be driven by expansion of
WWE Network and TV distribution
Growth in specific markets impacted
by economic strength, media
infrastructure, fan base
Long-term: China and India represent
significant opportunity
1. $ in millions. Graph is not to scale and for illustrative purposes only
10%CAGR
2004 LTM
Q3 ‘16
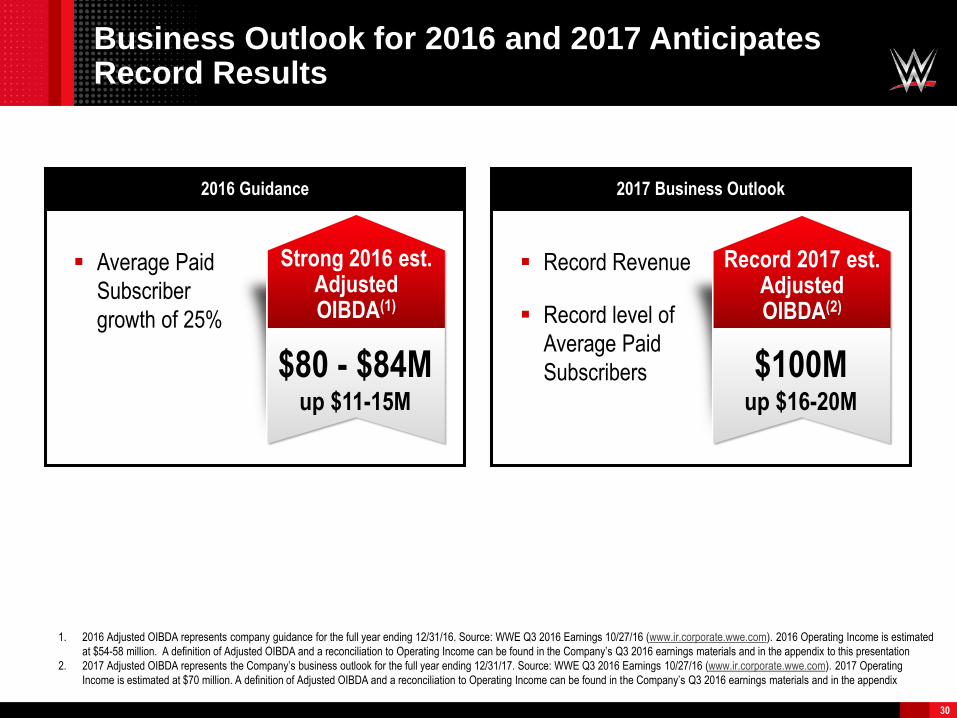
Business Outlook for 2016 and 2017 Anticipates Record Results
30
2016 Guidance
Strong 2016 est. Adjusted OIBDA(1)
$80 - $84Mup $11-15M
2017 Business Outlook
Record 2017 est. Adjusted OIBDA(2)
$100Mup $16-20M
Average Paid
Subscriber
growth of 25%
Record Revenue
Record level of
Average Paid
Subscribers
1. 2016 Adjusted OIBDA represents company guidance for the full year ending 12/31/16. Source: WWE Q3 2016 Earnings 10/27/16 (www.ir.corporate.wwe.com). 2016 Operating Income is estimated
at $54-58 million. A definition of Adjusted OIBDA and a reconciliation to Operating Income can be found in the Company’s Q3 2016 earnings materials and in the appendix to this presentation
2. 2017 Adjusted OIBDA represents the Company’s business outlook for the full year ending 12/31/17. Source: WWE Q3 2016 Earnings 10/27/16 (www.ir.corporate.wwe.com). 2017 Operating
Income is estimated at $70 million. A definition of Adjusted OIBDA and a reconciliation to Operating Income can be found in the Company’s Q3 2016 earnings materials and in the appendix
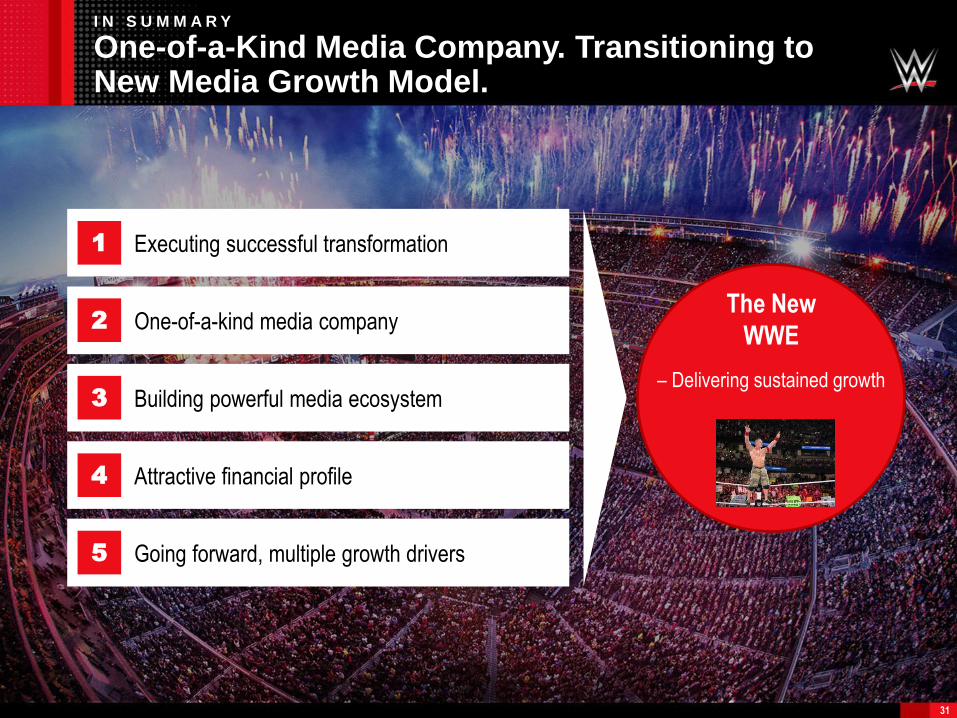
I N S U M M A R Y
One-of-a-Kind Media Company. Transitioning to New Media Growth Model.
31
Executing successful transformation1
One-of-a-kind media company2
Building powerful media ecosystem3
Attractive financial profile4
Going forward, multiple growth drivers5
The New
WWE
– Delivering sustained growth

A P P E N D I X
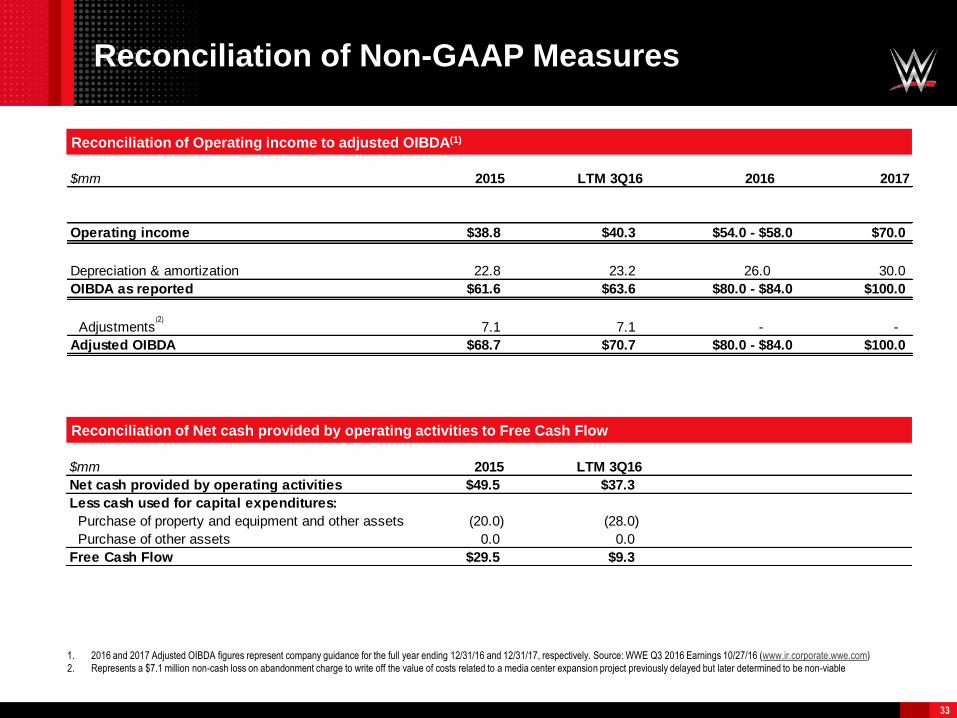
Reconciliation of Non-GAAP Measures
33
Reconciliation of Operating income to adjusted OIBDA(1)
1. 2016 and 2017 Adjusted OIBDA figures represent company guidance for the full year ending 12/31/16 and 12/31/17, respectively. Source: WWE Q3 2016 Earnings 10/27/16 (www.ir.corporate.wwe.com)
2. Represents a $7.1 million non-cash loss on abandonment charge to write off the value of costs related to a media center expansion project previously delayed but later determined to be non-viable
(2)
Reconciliation of Net cash provided by operating activities to Free Cash Flow
$mm 2015 LTM 3Q16
Net cash provided by operating activities $49.5 $37.3
Less cash used for capital expenditures:
Purchase of property and equipment and other assets (20.0) (28.0)
Purchase of other assets 0.0 0.0
Free Cash Flow $29.5 $9.3
$mm 2015 LTM 3Q16 2016 2017
Operating income $38.8 $40.3 $54.0 - $58.0 $70.0
Depreciation & amortization 22.8 23.2 26.0 30.0
OIBDA as reported $61.6 $63.6 $80.0 - $84.0 $100.0
Adjustments 7.1 7.1 - -
Adjusted OIBDA $68.7 $70.7 $80.0 - $84.0 $100.0
Notes: Non-GAAP Measures
The definition of Adjusted OIBDA and the Reconciliation of 2016 and 2017 Operating Income to Adjusted OIBDA can be found
in the Supplemental Information of the Company’s Q3 2016 earnings release dated October 27, 2016.
Beginning January 2016, the Company started allocating certain shared expenses between its Network and Television
segments. Management believes this allocation more accurately reflects the operations of these segments. For the first nine
months 2016, the implementation of this allocation methodology reduced Network segment OIBDA by $11.6 million and
increased Television segment OIBDA by a corresponding $11.6 million. The allocation methodology had no impact on the
Company’s consolidated financial statements.
The Company defines OIBDA as operating income before depreciation and amortization, excluding feature film and television
production amortization and related impairments. OIBDA is a non-GAAP financial measure and may be different than similarly-
titled non-GAAP financial measures used by other companies. A limitation of OIBDA is that it excludes depreciation and
amortization, which represents the periodic charge for certain fixed assets and intangible assets used in generating revenues
for the Company's business. OIBDA should not be regarded as an alternative to operating income or net income as an indicator
of operating performance, or to the statement of cash flows as a measure of liquidity, nor should it be considered in isolation or
as a substitute for financial measures prepared in accordance with GAAP. We believe that operating income is the most directly
comparable GAAP financial measure to OIBDA.
Adjusted OIBDA, Adjusted Operating income, Adjusted Net income and Adjusted Earnings per share exclude certain material
items, which otherwise would impact the comparability of results between periods. These should not be considered as an
alternative to net income, cash flows from operations or any other indicator of WWE's performance or liquidity, determined in
accordance with U.S. GAAP.
The Company defines Free Cash Flow as net cash provided by operating activities less cash used for capital expenditures.
Although it is not a recognized measure of liquidity under U.S. GAAP, Free Cash Flow provides useful information regarding the
amount of cash our continuing business is generating after capital expenditures, available for reinvesting in the business, debt
service, and payment of dividends.
34


