www.infotech.monash.edu FIT 1005 Networks & Data Communications Lecture 2 – Data Transmission Lecture 2 – Data Transmission Reference: Chapter 3 Data and Computer Communications Eighth Edition by William Stallings Lecture slides by Lawrie Brown Lecture slides also available at: http://users.monash.edu.au/~amkhan/fit1005/
Transcript
www.infotech.monash.edu
FIT 1005 Networks & Data Communications
Lecture 2 – Data Transmission Lecture 2 – Data Transmission
Reference: Chapter 3
Data and Computer Communications
Eighth Edition
by William Stallings
Lecture slides by Lawrie Brown
Lecture slides also available at: http://users.monash.edu.au/~amkhan/fit1005/
www.infotech.monash.edu
2
Data Transmission Terminology
• data transmission occurs between a transmitter & receiver via some medium
• guided medium– e.g. twisted pair, coaxial cable, optical
fiber
• unguided / wireless medium– e.g. air, water, vacuum
www.infotech.monash.edu
3
Data Transmission Terminology-2
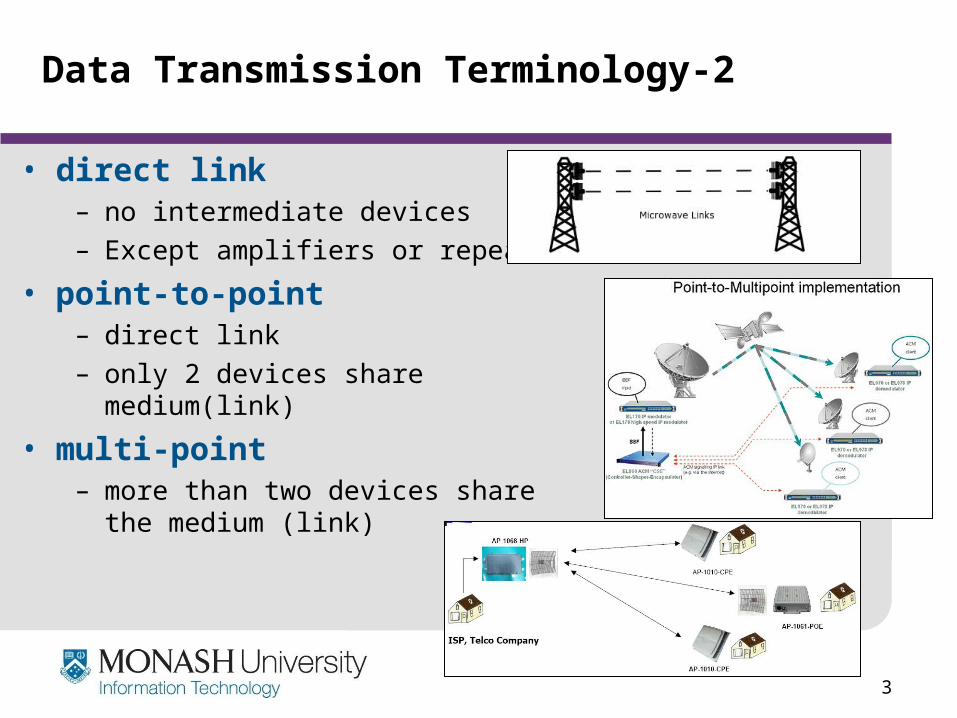
• direct link– no intermediate devices– Except amplifiers or repeaters
• point-to-point– direct link – only 2 devices share medium(link)
• multi-point– more than two devices share the
medium (link)
www.infotech.monash.edu
4
Data Transmission Terminology-3
• simplex– one direction
> e.g. television
• half duplex– either direction, but only one way at a time
> e.g. police radio
• full duplex– both directions at the same time
> e.g. telephone
www.infotech.monash.edu
5
Frequency, Spectrum and Bandwidth
• Time domain concepts: viewed as a function of time– Can be analog or digital– analog signal
> varies in a smooth way over time
– digital signal> maintains a constant level then changes to another constant level
– periodic signal> pattern repeated over time
– aperiodic signal> pattern not repeated over time
www.infotech.monash.edu
6
Analogue & Digital Signals
www.infotech.monash.edu
7
Periodic Signals
www.infotech.monash.edu
8
Sine Wave
• peak amplitude (A)– maximum strength of signal– measured in volts (V)
• frequency (f)– rate of change of signal– Hertz (Hz) or cycles per second– period (T) = time for one repetition – T = 1/f
• phase ()– relative position in time
www.infotech.monash.edu
9
Sine Wave - 2
• A sine wave can be represented as:
s(t) = A sin(2ft + )where:
A – peak amplitude
f – frequency
t – time
- phase angle
t
00 = - phase = Degrees Radians
00 = 0450 = /4900 = /21350 = 3/41800 =
www.infotech.monash.edu
10
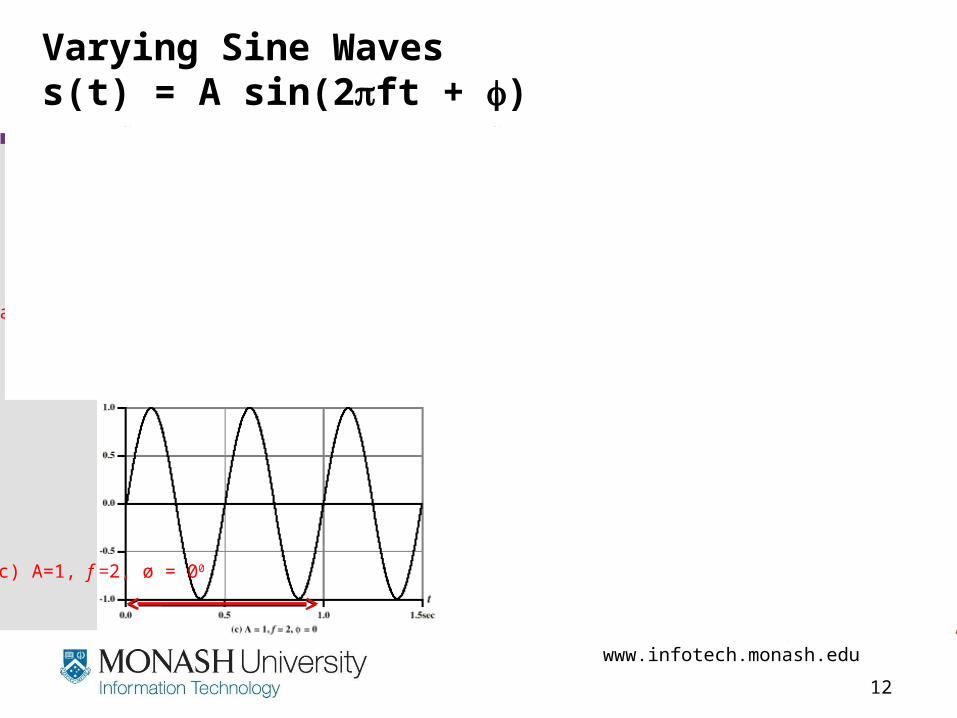
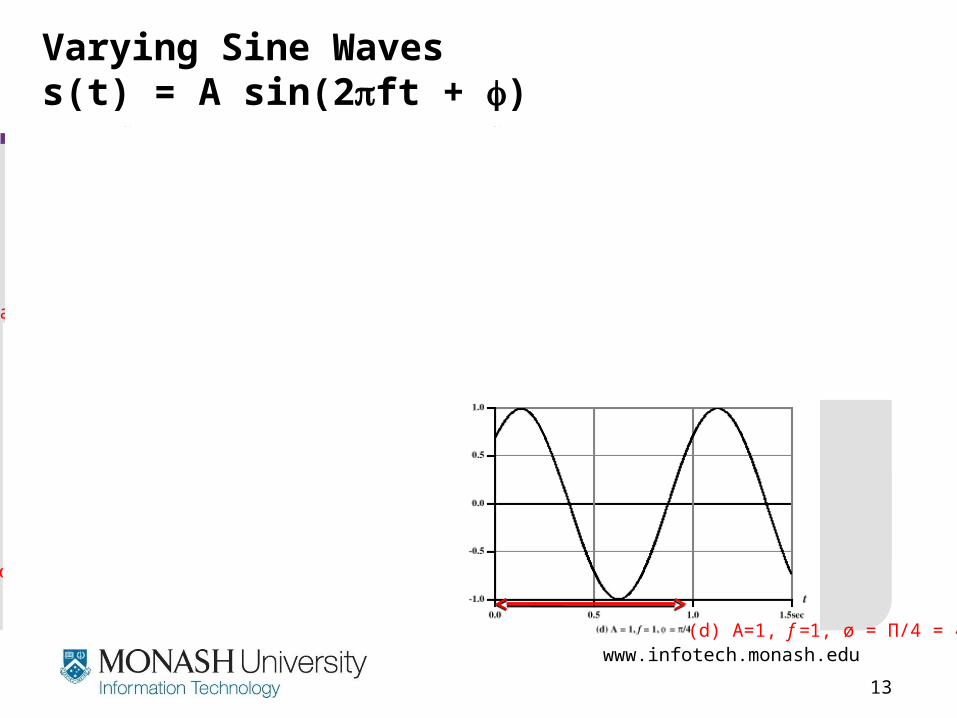
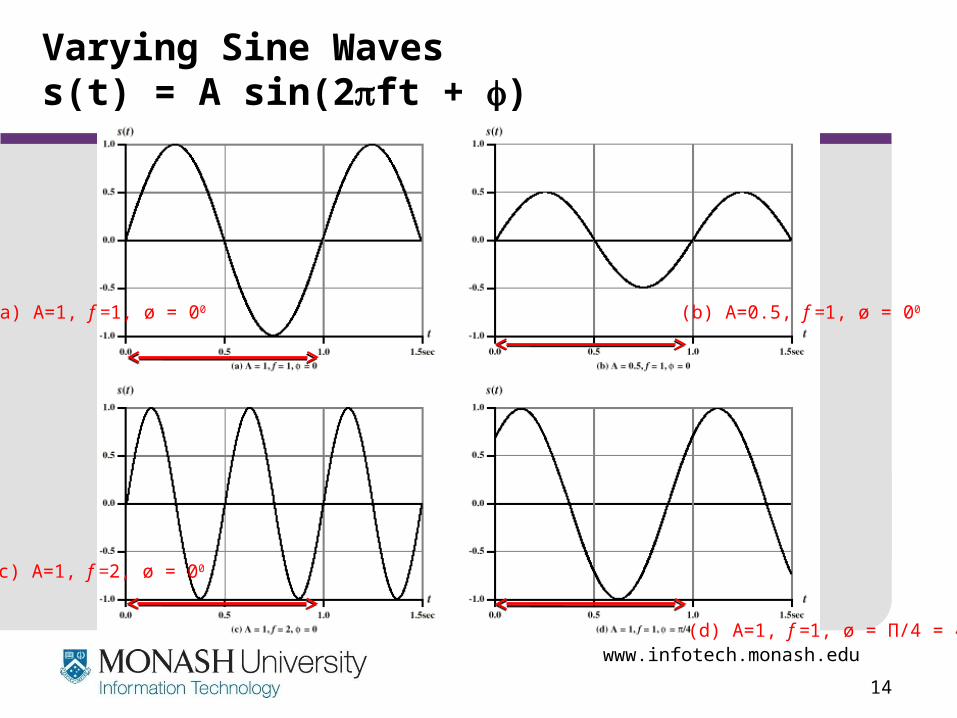
Varying Sine Wavess(t) = A sin(2ft + )
(a) A=1, f =1, ø = 00
(c) A=1, f =2, ø = 00
(d) A=1, f =1, ø = Π/4 = 450
(b) A=0.5, f =1, ø = 00
www.infotech.monash.edu
11
Varying Sine Wavess(t) = A sin(2ft + )
(a) A=1, f =1, ø = 00
(c) A=1, f =2, ø = 00
(d) A=1, f =1, ø = Π/4 = 450
(b) A=0.5, f =1, ø = 00
www.infotech.monash.edu
12
Varying Sine Wavess(t) = A sin(2ft + )
(a) A=1, f =1, ø = 00
(c) A=1, f =2, ø = 00
(d) A=1, f =1, ø = Π/4 = 450
(b) A=0.5, f =1, ø = 00
www.infotech.monash.edu
13
Varying Sine Wavess(t) = A sin(2ft + )
(a) A=1, f =1, ø = 00
(c) A=1, f =2, ø = 00
(d) A=1, f =1, ø = Π/4 = 450
(b) A=0.5, f =1, ø = 00
www.infotech.monash.edu
14
Varying Sine Wavess(t) = A sin(2ft + )
(a) A=1, f =1, ø = 00
(c) A=1, f =2, ø = 00
(d) A=1, f =1, ø = Π/4 = 450
(b) A=0.5, f =1, ø = 00
www.infotech.monash.edu
15
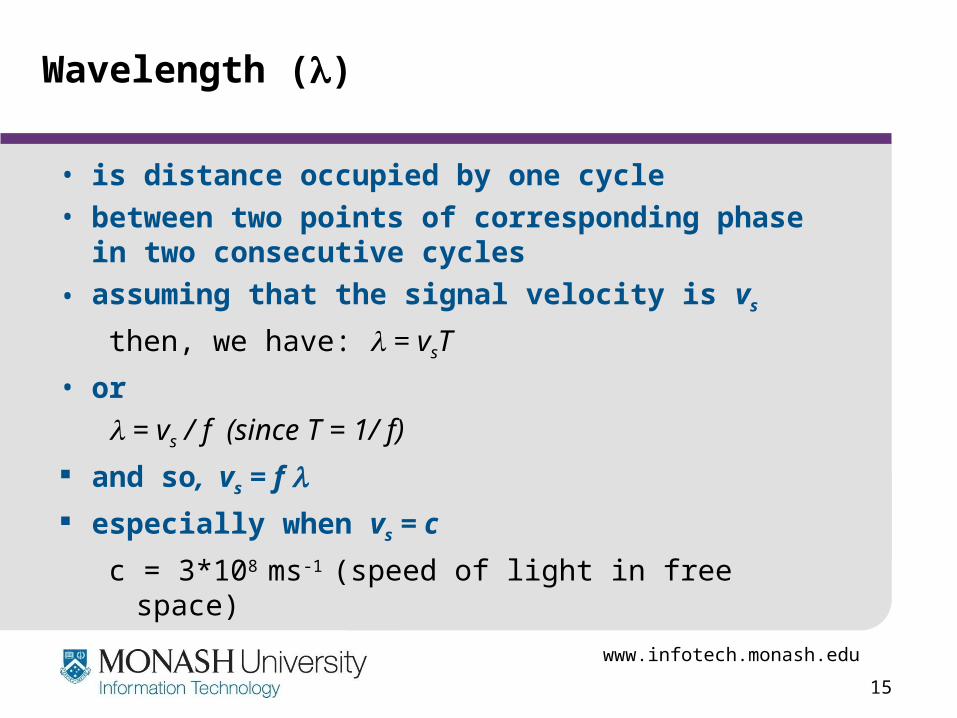
Wavelength ()
• is distance occupied by one cycle• between two points of corresponding phase in
two consecutive cycles
• assuming that the signal velocity is vs
then, we have: = vsT
• or
= vs / f (since T = 1/ f)
and so, vs = f
especially when vs = c
c = 3*108 ms-1 (speed of light in free space)
www.infotech.monash.edu
16
Frequency Domain Concepts
• signal are made up of many frequencies• components are sine waves• Fourier Analysis can shown that any
signal is made up of component sine waves
• can plot frequency domain functions
Fourier Analysis: The complex wave at the top can be decomposed into the sum of the three simple sine waves shown here.
www.infotech.monash.edu
17
Addition of FrequencyComponents (T=1/f)
• graph c is sum of graphs a & b
S(t) = A * sin [ (2) f t ]
• (a) = 1*sin[ (2) f t ]
• (b) = 1/3 * sin[ (2) (3f) t ]
• (c) = (4/) * { 1*sin[ (2) f t ]
+ 1/3 * sin[ (2) (3f) t ] }
• The scaling factor of (4/) is used to produce the cumulative wave whose maximum peak amplitude is close to 1.
www.infotech.monash.edu
18
Frequency DomainRepresentations
• Frequency domain function of Fig 3.4c
S(f)
fS(t)
t
t
t
www.infotech.monash.edu
19
Frequency Domain Representations
• Frequency domain function of single square pulse
- X/2 +X/2 t
1
S(t) S(f)
S(t) = 1 for time period -X/2 to +X/2 = 0 elsewhere
S(f) = 1 X sin( f X) ----------------- f X
Fourier transformFourier transform
Fourier transformFourier transform
reference Page-839 William Stallings
www.infotech.monash.edu
20
Frequency Domain Representations (Java Demo)
• Fourier series representation of any given periodic signals
– Can be represented as a sum of sine and cosine waveforms known as Fourier series.
– reference Page-836 William Stallings
• Fourier Series Applets in Java. – http://www.falstad.com/fourier/index.html– http://www.falstad.com/fourier/
www.infotech.monash.edu
21
Spectrum & Bandwidth
• spectrum– range of all frequencies contained in signal
• absolute bandwidth– width of spectrum
• effective bandwidth– often just bandwidth– narrow band of frequencies containing most energy
• DC Component– component of zero frequency
www.infotech.monash.edu
22
Data Rate and Bandwidth
• any transmission system has a limited band of frequencies
• this limits the data rate that can be carried• square wave have infinite frequency
components and hence bandwidth• but most of its energy in focused in first few
components (harmonics)• limited bandwidth increases distortion• have a direct relationship between data rate &
bandwidth
www.infotech.monash.edu
23
Analog and Digital Data Transmission
• data – entities that convey meaning
• signals & signalling– electric or electromagnetic representations of data,
physically propagates along medium
• transmission– communication of data by propagation and processing of
signals
www.infotech.monash.edu
24
Complete frequency Spectrum
www.infotech.monash.edu
25
Acoustic Spectrum (Analog)
www.infotech.monash.edu
26
Audio Signals
• freq range 20Hz-20kHz (speech 100Hz-7kHz)• easily converted into electromagnetic signals• varying volume converted to varying voltage• can limit frequency range for voice channel to
300-3400Hz
www.infotech.monash.edu
27
Digital Data
• as generated by computers etc.• has two dc components• bandwidth depends on data rate
-5 volts
www.infotech.monash.edu
28
Analog Signals
www.infotech.monash.edu
29
Digital Signals
www.infotech.monash.edu
30
Advantages & Disadvantages of Digital Signals
• cheaper than analog signalling • less susceptible to noise• but greater attenuation• digital now the preferred choice
www.infotech.monash.edu
31
Transmission Impairments
• signal received may differ from signal transmitted causing impairment:
– Analog transmission - degradation of signal quality– digital transmission - bit errors
• most significant impairments are1. attenuation and attenuation distortion
2. delay distortion
3. noise
Lets see these impairments one by one!
www.infotech.monash.edu
32
Transmission Impairments: (1) Attenuation
• where the signal strength falls off with distance• depends on transmission medium• It is a increasing function of frequency• received signal strength must be:
– strong enough to be detected– sufficiently higher than noise so as to receive without error
• so we increase strength using amplifiers/repeaters• so equalize attenuation across band of
frequencies we use– e.g.. loading coils or amplifiers
www.infotech.monash.edu
33
Transmission Impairments: (2) Delay Distortion
• only occurs in guided media• propagation velocity varies with frequency• hence various frequency components arrive at
different times• particularly critical for digital data
– because some of the signal components of one bit position will spill over into other bit positions, hence
– causing inter-symbol interference
www.infotech.monash.edu
34
Transmission Impairments: (3) Noise
• noise is the additional signals that is inserted between transmitter and receiver
• (1) thermal noise– due to thermal agitation of electrons– Present in all electronic devices & transmission media– Function of temperature– uniformly distributed– cannot be eliminated– Also referred as white noise
• (2) intermodulation noise– signals that are the sum and difference of original
frequencies sharing a medium
www.infotech.monash.edu
35
Transmission Impairments: (3) Noise
• crosstalk– a signal from one line is picked up by another
• impulse– irregular pulses or spikes
> eg. external electromagnetic interference
– short duration– high amplitude– a minor annoyance for analog signals– but a major source of error in digital data
> a noise spike could corrupt many bits
www.infotech.monash.edu
36
Channel Capacity
• Channel capacity (C) is the maximum rate at which data can be transmitted over a given communication channel.
• We need to consider:1. Data rate, measured in bits per second (bps), is the rate at
which data can be communicated.
2. The Bandwidth (B) of channel, measured in cycles per second or Hertz.
3. Noise, the average level across the communication channel.
4. Bit Error Rate on the channel resulting from the noise.
www.infotech.monash.edu
37
Channel Capacity and bandwidth
• Communication facilities are expensive• Greater the bandwidth, more expense• Bandwidth limitations are due to physical
properties of transmission mediums• want to make most efficient use of channel
capacity
• Other main constrain being noise
www.infotech.monash.edu
38
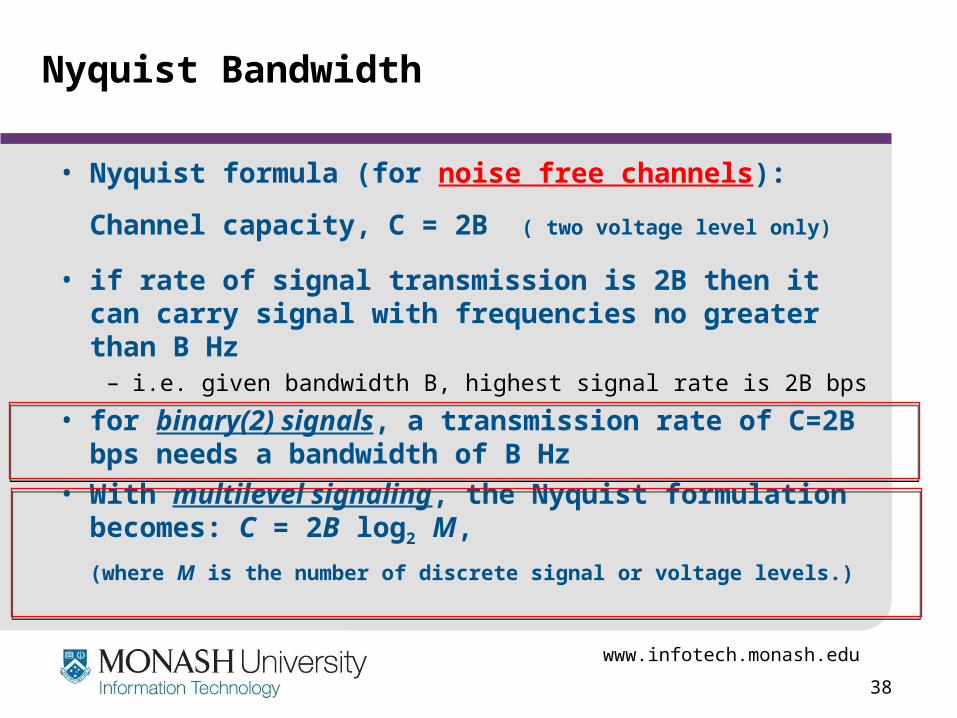
Nyquist Bandwidth
• Nyquist formula (for noise free channels):
Channel capacity, C = 2B ( two voltage level only)
• if rate of signal transmission is 2B then it can carry signal with frequencies no greater than B Hz
– i.e. given bandwidth B, highest signal rate is 2B bps
• for binary(2) signals, a transmission rate of C=2B bps needs a bandwidth of B Hz
• With multilevel signaling, the Nyquist formulation becomes: C = 2B log2 M,
(where M is the number of discrete signal or voltage levels.)
www.infotech.monash.edu
39
Nyquist Bandwidth: Example
• In a noise free channel, the channel capacity, in bps, of the channel is at best twice the bandwidth of the channel. C=2B
• As an example, consider a telephone line (voice channel) used to transmit digital data:
– On a telephone channel with a frequency range from 300Hz to 3400Hz,
– The bandwidth is B = f highest – f lowest
B = 3400 – 300 = 3100Hz
– Hence, the channel capacity is at best: C=2B
C = 2 x 3100 = 6200 bps
– This assumes two level (binary) signalling.
www.infotech.monash.edu
40
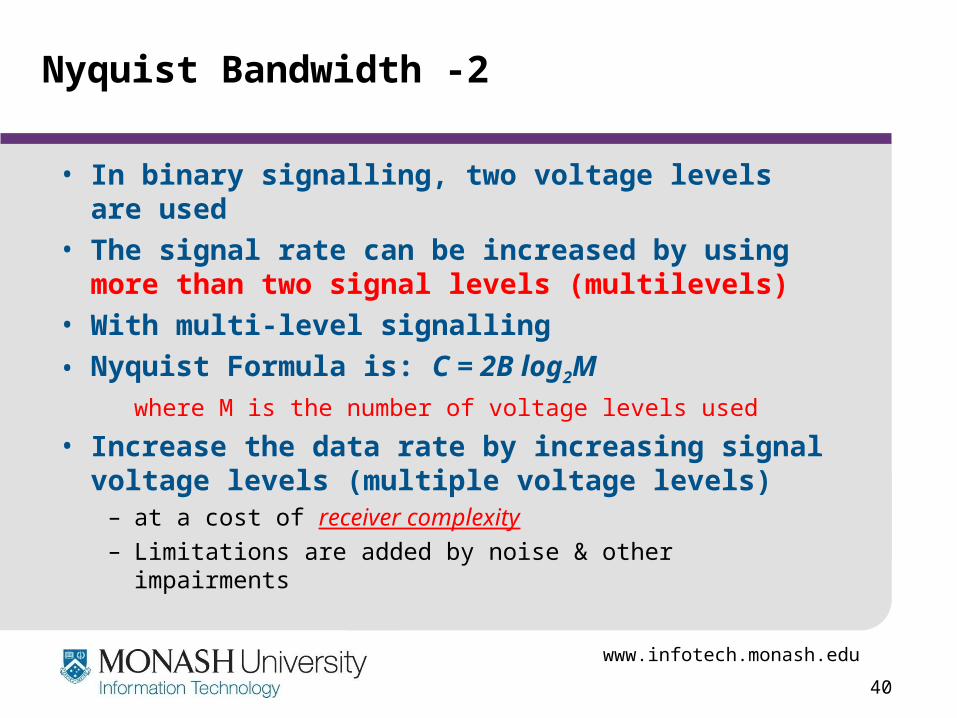
Nyquist Bandwidth -2
• In binary signalling, two voltage levels are used• The signal rate can be increased by using more
than two signal levels (multilevels)• With multi-level signalling
• Nyquist Formula is: C = 2B log2M
where M is the number of voltage levels used
• Increase the data rate by increasing signal voltage levels (multiple voltage levels)
– at a cost of receiver complexity– Limitations are added by noise & other impairments
www.infotech.monash.edu
41
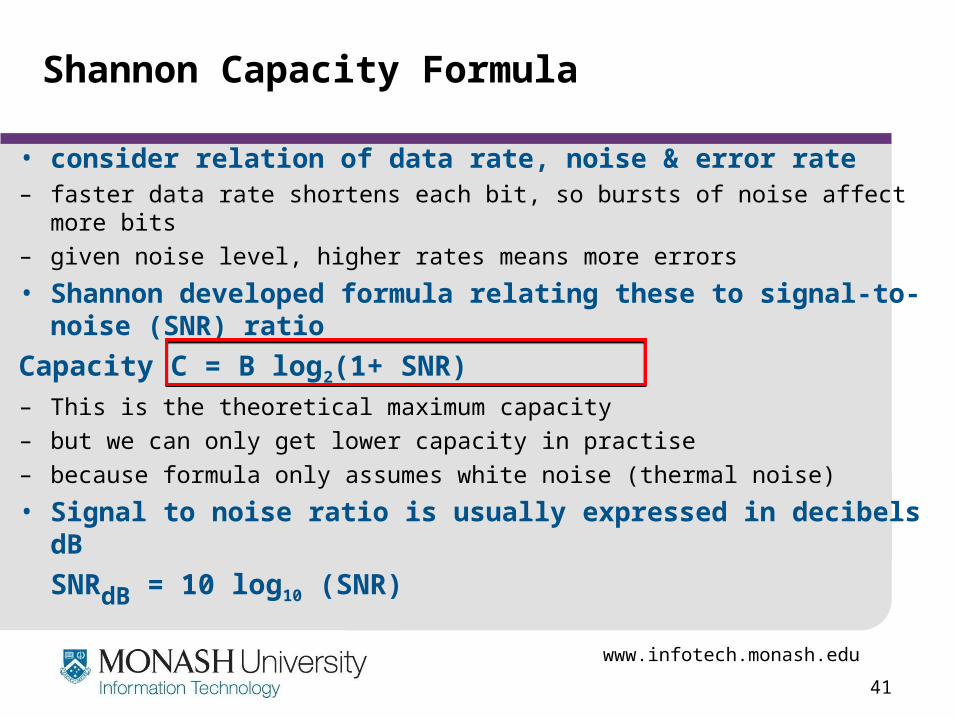
Shannon Capacity Formula
• consider relation of data rate, noise & error rate– faster data rate shortens each bit, so bursts of noise affect more bits– given noise level, higher rates means more errors
• Shannon developed formula relating these to signal-to-noise (SNR) ratio
Capacity C = B log2(1+ SNR)– This is the theoretical maximum capacity– but we can only get lower capacity in practise– because formula only assumes white noise (thermal noise)
• Signal to noise ratio is usually expressed in decibels dB
SNRdB = 10 log10 (SNR)
www.infotech.monash.edu
42
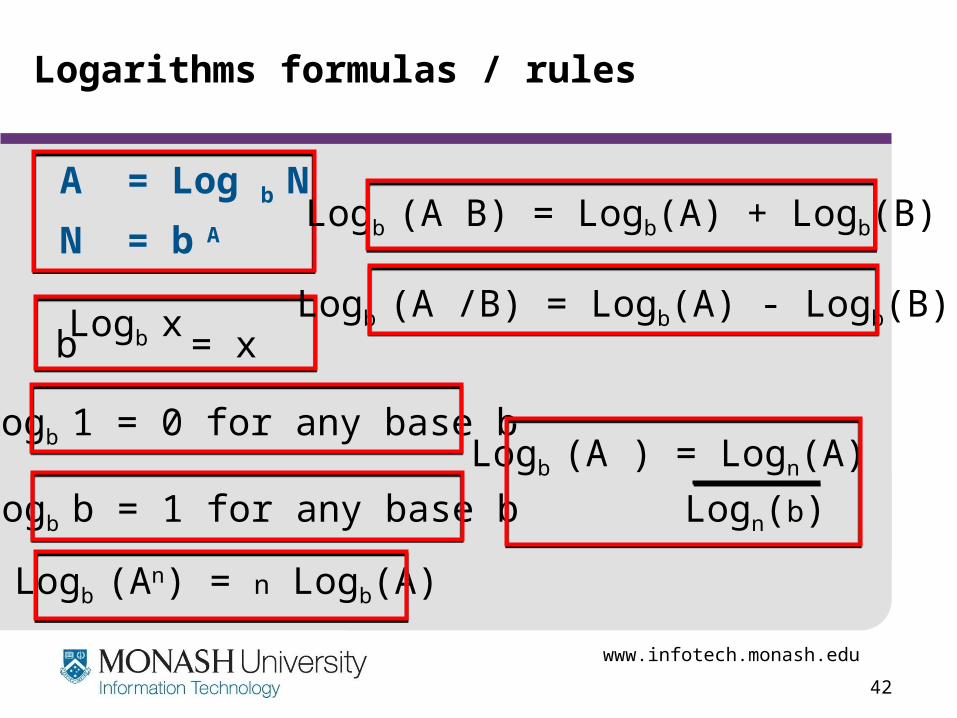
Logarithms formulas / rules
A = Log b N
N = b A
bLogb x = x
Logb 1 = 0 for any base b
Logb b = 1 for any base b
Logb (A B) = Logb(A) + Logb(B)
Logb (A /B) = Logb(A) - Logb(B)
Logb (A ) = Logn(A)
Logn(b)
Logb (An) = n Logb(A)
www.infotech.monash.edu
43
Shannon Capacity Formula: Example
1. The spectrum(BW) of a channel is between 3 MHz to 4 MHz and SNRdB = 24 dB.
Bandwidth (B)= (4 – 3) = 1 MHz
24 dB = 10 log10 (SNR)
SNR = 102.4
SNR = 251
2. What is the capacity of the channel?
Using Shannon’s formula,
C = 106 x log2(1+ 251)
≈ 106 x 8 = 8 Mbps
3. How many signalling levels are required to achieve this capacity of 8 Mbps?
Using Nyquist formula:
C = 2B log2M
8 106 = 2 x 10⁶ x log2M
4 = log2M
M = 24
M = 16
www.infotech.monash.edu
44
Decibels and Signal Strength
Amplifiers and Repeaters:• Signal strength: important parameter in
communication systems• Loss or attenuation of signal strength• Amplifiers: regain signal strength (used in analog
systems)• Repeaters: regenerate signals used in digital
networks
www.infotech.monash.edu
45
Decibels and Signal Strength- 2
Decibel (dB)• Signal strength: gain or loss is expressed in dB
• Decibel is a ratio of two signal levels, say output and input of a communication system
• The ratio could be Power i/p to Power o/p
• Or the ratio of signal power to noise power
• Or signal voltage to noise voltage
• Or signal i/p voltage to o/p voltage
• As long as it the ratio measured in a special way called decibels and expressed as dB
• These ratios can be +ve or –ve also known as Gain or Loss
www.infotech.monash.edu
46
Decibels and Signal Strength- 3
Gain or Loss in dB• Signal Power Gain (or simply Gain) in dB is:
GdB = 10 log10 Pout / Pin
where
Pin = input power level
Pout = output power level
log10 = logarithm to the base 10
• Loss in dB is:
LdB = - 10 log10 (Pout / Pin )
or
= 10 log10 (Pin / Pout )
www.infotech.monash.edu
47
Decibels and Signal Strength- 4
Example: If a signal with power level of 10 mW is inserted at the input of a communication system and a power of 5 mW is extracted at the output, calculate the loss in dB.
LdB = 10 log10 Pin / Pout
= 10 log10 (10 mW) / (5 mW)
= 10 log10 (2)
= 10 log10 2 = 10 x 0.3
= 3 dB.
Pin =10 mW Pout = 5 mW
LdB = -10 log10 Pout / Pin
= -10 log10 (5 mW) / (10 mW)
= -10 log10 (0.5)
= -10 log10 0.5 = 10 x - 0.3
= 3 dB.
OR
www.infotech.monash.edu
48
Decibels and Signal Strength- 5
Decibel can also be used as a ratio of input voltage to output voltage in a communication system:
LdB = 10 log10 Pin / Pout
= 10 log10 [(V2in )/R] / [(V2
out )/R]
= 2 x 10 log10 Vin / Vout
= 20 x log10 Vin / Vout
where P = V2 / R
www.infotech.monash.edu
49
Decibels and Signal Strength- 6
• The decibel-Watt (dBW) is another common measure used in microwave systems:(which is referenced to 1W)
PowerdBW = 10 log (PowerW / 1 W)
• Decibel-milliWatt and decibel-millivolt are also defined: (which is referenced to 1mW or 1mV)
PowerdBm = 10 log (PowermW / 1 mW)
VoltagedBmV = 20 log (VoltagemV / 1 mV)
www.infotech.monash.edu
50
Summary
• looked at data transmission issues• frequency, spectrum & bandwidth• analog vs digital signals• transmission impairments• decibels and signal strengths