39
www.lirneasia. net Teleuse on a Shoestring LIRNEasia Media Workshop Singapore. 28 February 2007
| Date post: | 14-Dec-2015 |
| Category: |
Documents |
| Upload: | noel-nolan-robey |
| View: | 214 times |
| Download: | 1 times |

ww
w.li
rnea
sia.
net
Teleuse on a Shoestring
LIRNEasia Media Workshop Singapore. 28 February 2007

ww
w.li
rnea
sia.
net
Agenda
Research methodology & key findings: Harsha de Silva
The SMS story and others Lorraine Carlos Salazar
The next billion customers Ayesha Zainudeen

ww
w.li
rnea
sia.
net
Agenda
Research methodology & key findings: Harsha de Silva
The SMS story and others Lorraine Carlos Salazar
The next billion customers Ayesha Zainudeen

ww
w.li
rnea
sia.
net
Background
Emerging markets are ‘where the action is’ The next billion...
Want to know what users at the Bottom of the Pyramid want Pilot: Shoestrings 1 New and improved: Shoestrings 2

ww
w.li
rnea
sia.
net
Research objectives
Understand telecom use at the Bottom of the Pyramid (BOP) in Developing Asia
Large sample survey in five countries India, Pakistan, Sri Lanka, Philippines & Thailand
Representative of target population SEC D & E (BOP) between ages 18-60
ww
w.li
rnea
sia.
net
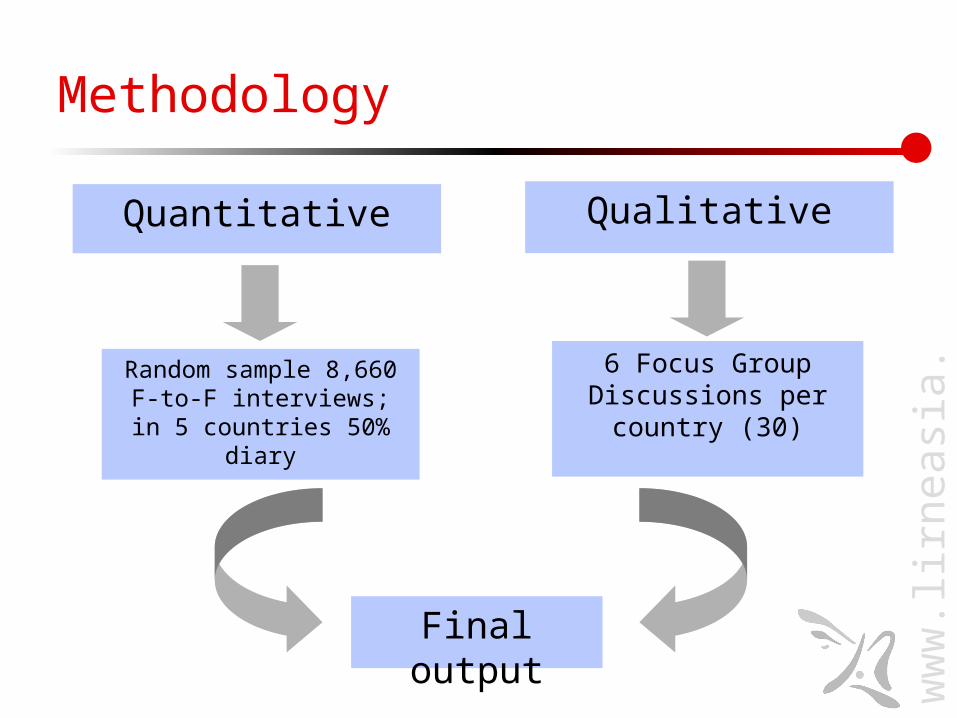
Methodology
6 Focus Group Discussions per
country (30)
Random sample 8,660 F-to-F interviews; in 5 countries 50% diary
Final output
QualitativeQuantitative

ww
w.li
rnea
sia.
net
Country profiles
South Asia South East Asia
Pakistan IndiaSri
LankaPhilippines Thailand
Population165
million 1,095 million
19.6 million
89 million
64 million
GNI per capita (2005), USD (Atlas)
690 720 1,160 1,300 2,750
GNI per capita (2005), USD (PPP)
2350 3460 4,520 5,300 8,440
Population below Poverty Line
32%(est. 2001)
25%(est. 2001)
23%(est. 2005)
40%(est. 2001)
10%(est. 2004)
Fixed teledensity (2006) 4.16(2006 Q4)
4.58(2006 Q1)
9.50(2006 Q4)
4.07(2005 Q4)
10.25(2005 Q4)
Mobile teledensity (2006) 25.22(2006 Q4)
8.82(2006 Q1)
27.1(2006 Q4)
41.30(2005 Q4)
46.45(2005 Q4)
Internet Users7.5
million 50.6
million 0.3
million 7.8
million 8.4
million Notes: India on an April – March reporting period ; Pakistan on a July – June reporting period; Other countries follow Jan – Dec (calendar year) reporting periods. Sources: India-COAI, TRAI; Thailand–Company Reports; Pakistan–PTA; Philippines–NTC; Sri Lanka- TRC; 2000 onwards from company reports; World Bank (2006); CIA Fact Book (2005)

ww
w.li
rnea
sia.
net
*excluding FANA/FATA – Tribal Areas; **excluding N&E Provinces
Bottom of the Pyramid defined
Many definitions of poverty, but this study uses SEC D and E; between ages 18-60
SEC does not take into account income, but it is closely related to income levels
Pakistan IndiaSri
LankaPhilippin
esThailand
Population (million) 165 1,095 20 89 64
Target population of study (million)
77* 260 4** 41 15

ww
w.li
rnea
sia.
net
Quantitative sample
BOP segment is representative of the BOP population Diary respondents also representative of BOP
Small (non-representative sample) taken of SEC groups A, B & C
SAMPLE South Asia South East Asia TOTAL
Pakistan India Sri LankaPhilippine
sThailand
TOP (SEC A, B & C)
685 800 250 120 200 2055
BOP (SEC D & E)
1125 3200 800 980 500 6605
Total 1810 4000 1050 1100 700 8660
ww
w.li
rnea
sia.
net
Access at the BOPEveryone has access, but not ownership

ww
w.li
rnea
sia.
net
Overall access is very high
South Asia South East Asia
Pakistan India Sri Lanka Phils. Thailand
Accessibility(% of those randomly approached (all SEC groups) who have used a phone in the preceding 3 months)
98% 94% 92% 93% 95%
Most have used a phone in the last 3 months

ww
w.li
rnea
sia.
net
Time it takes to reach nearest phone
0%
10%
20%
30%
40%
50%
60%
70%
80%
90%
100%
Pakistan India Sri Lanka Philippines Thailand
% o
f n
on
-ow
ne
rs a
t th
e B
OP
>60 minutes
45-60 minutes
30-45 minutes
15-30 minutes
10-15 minutes
5-10 minutes
3-5 minutes
< 3 minutes
Overall access is very high*
Around 60% at BOP in all countries can get to a phone in less than 5 minutesAround 60% at BOP in all countries can get to a phone in less than 5 minutes

ww
w.li
rnea
sia.
net
Urban-rural differences
Time to nearest phone: urban vs. rural: Sri Lanka
0%
10%
20%
30%
40%
50%
60%
70%
80%
90%
100%
Urban Rural
Sri Lanka
% o
f n
on
ow
ner
s at
BO
P Betw een 45 - 60 minutes
Betw een 30 - 45 minutes
Betw een 15 - 30 minutes
Betw een 10 - 15 minutes
Betw een 5 - 10 minutes
Betw een 3 - 5 minutes
Less than 2 - 3 minutes
0%
10%
20%
30%
40%
50%
60%
70%
80%
90%
100%
Urban Rural
Pakistan
% o
f n
on
ow
ner
s at
BO
P More than an hour
Betw een 45 - 60 minutes
Betw een 30 - 45 minutes
Betw een 15 - 30 minutes
Betw een 10 - 15 minutes
Betw een 5 - 10 minutes
Betw een 3 - 5 minutes
Less than 2 - 3 minutes
Time to nearest phone: urban vs. rural: Philippines
0%
10%
20%
30%
40%
50%
60%
70%
80%
90%
100%
Urban Rural
Philippines
% o
f n
on
ow
ner
s at
BO
P More than an hour
Betw een 45 - 60 minutes
Betw een 30 - 45 minutes
Betw een 15 - 30 minutes
Betw een 10 - 15 minutes
Betw een 5 - 10 minutes
Betw een 3 - 5 minutes
Less than 2 - 3 minutes
0%
10%
20%
30%
40%
50%
60%
70%
80%
90%
100%
Urban Rural
India
% o
f n
on
ow
ner
s at
BO
P More than an hour
Betw een 45 - 60 minutes
Betw een 30 - 45 minutes
Betw een 15 - 30 minutes
Betw een 10 - 15 minutes
Betw een 5 - 10 minutes
Betw een 3 - 5 minutes
Less than 2 - 3 minutes
0%
10%
20%
30%
40%
50%
60%
70%
80%
90%
100%
Urban Rural
Thailand%
of
no
n o
wn
ers
at B
OP
Urban-rural Differences in time to phone in Pakistan & IndiaUrban-rural Differences in time to phone in Pakistan & India
Time to nearest phone

ww
w.li
rnea
sia.
net
Ownership and GDP per capita (USD, PPP)
23%
9%
22%
60%
76%
11%
23%
7%
14%
63.60%
80.70%
59.00%
38.00%
22.70%
18%
0%
10%
20%
30%
40%
50%
60%
70%
80%
90%
Pakistan India Sri Lanka Philippines Thailand
% a
t b
ott
om
of
pyr
amid
0
1,000
2,000
3,000
4,000
5,000
6,000
7,000
8,000
9,000
GD
P p
er c
apit
a, U
SD
(P
PP
)
Own a mobile Own a fixed phone
Own nothing (but use something) Per Capita GDP PPP (US $)
But ownership is low
Pakistan India Sri Lanka Philip-pines Thailand
Total number of phones per 100 population
29.4 13.4 36.6 45.4 56.7
(2006 Q4) (2006 Q1) (2006 Q4) (2005 Q4) (2005 Q4)Notes: India on an April – March reporting period ; Pakistan on a July – June reporting period; Other countries follow Jan – Dec (calendar year) reporting periods. Sources: India-COAI, TRAI; Thailand–Company Reports; Pakistan–PTA; Philippines–NTC; Sri Lanka- TRC; 2000 onwards from company reports; World Bank (2006); CIA Fact Book (2005)

ww
w.li
rnea
sia.
net
Most frequently used mode
0%
10%
20%
30%
40%
50%
60%
70%
80%
90%
100%
% a
t B
OP Public phone
Relative / friend's phone
Neighbours phone
Household fixed phone
Mobile of another householdmember
Own mobile
Public phone 35% 71% 30% 8% 7%
Relative / friend's phone 10% 1% 12% 14% 6%
Neighbours phone 8% 7% 14% 7% 1%
Household fixed phone 14% 9% 21% 4% 8%
Mobile of another householdmember
12% 4% 6% 11% 5%
Own mobile 21% 9% 17% 56% 73%
Pakistan India Sri Lanka Philippines Thailand
So, mainly use public phones*
Many at BOP in South Asia use public phonesMany at BOP in South Asia use public phones

ww
w.li
rnea
sia.
net
Mobiles used more often by males in South Asian BOP
Most frequently used phone: Own mobile
30%
12%
22%
56%
76%
11%
5%
12%
55%
70%
0%
10%
20%
30%
40%
50%
60%
70%
80%
Pakistan India Sri Lanka Philiphines Thailand
% a
t B
OP
Male
Female

ww
w.li
rnea
sia.
net
Females use household fixed phones more often
Most frequently used phone: Household fixed phone
11% 9%
19%
3% 4%
16%
10%
23%
4%
12%
0%
10%
20%
30%
40%
50%
60%
70%
80%
Pakistan India Sri Lanka Philiphines Thailand
% a
t B
OP
Male
Female

ww
w.li
rnea
sia.
net
Females more reliant on other peoples’ phones in South Asian BOP
Most frequently used phone: Someone else's phone (neighbor, friend, family, work)
13%8%
27%
34%
13%
48%
16%
39%33%
12%
0%
10%
20%
30%
40%
50%
60%
70%
80%
Pakistan India Sri Lanka Philiphines Thailand
% a
t B
OP
Male
Female
ww
w.li
rnea
sia.
net
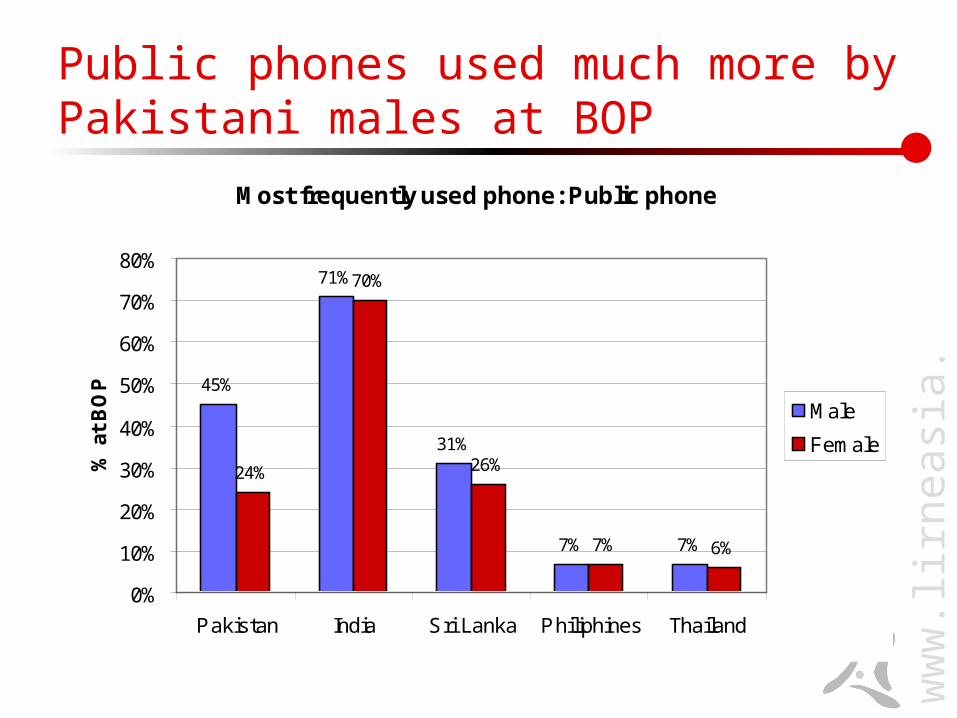
Public phones used much more by Pakistani males at BOP
Most frequently used phone: Public phone
45%
71%
31%
7% 7%
24%
70%
26%
7% 6%
0%
10%
20%
30%
40%
50%
60%
70%
80%
Pakistan India Sri Lanka Philiphines Thailand
% a
t B
OP
Male
Female

ww
w.li
rnea
sia.
net
Usage patternsKeeping in touch…

ww
w.li
rnea
sia.
net
Average number of calls (incoming + outgoing) for a month
20.0 18.3 13.0 10.3
46.514.1 16.8
10.15.3
33.8
0
10
20
30
40
50
60
70
80
90
Pakistan India Sri Lanka Philippines Thailand
me
an
nu
mb
er
of
ca
lls
outgoing
Incoming
Source: Diary
Around 1 call per day in S Asia; less than 1 call per day in SE Asia
Pakistan India Sri Lanka Philippines Thailand
Average # of calls for a month (in+out)
34.2 35.1 23.2 15.6 80.3

ww
w.li
rnea
sia.
net
Mostly local calls at the BOP
Type of call (local, long distance, international)
71%78%
62%
88% 84%
28%22%
34%
6% 16%
1% 0% 4% 6% 1%
0%10%20%30%40%50%60%70%80%90%
100%
Pakistan India Sri Lanka Philipines Thailand
% o
f c
alls International call
Long distance call
Local call
Source: Diary

ww
w.li
rnea
sia.
net
Source: Diary
Calls mostly to ‘keep in touch’
Main purpose of call
82%72% 65% 64% 70%
4%14% 27%
21%
14% 14%8%
15%29%
2%
0%
20%
40%
60%
80%
100%
Pakistan India Sri Lanka Philipines Thailand
% o
f al
l cal
ls
Keeping in touch with family & friends To check something / Deliver message
Business

ww
w.li
rnea
sia.
net
Calls are short
Average call durations
0%
10%
20%
30%
40%
50%
60%
<1 minute 2-3minutes
About 5minutes
About 10minutes
>15minutes
Duration of the call
% o
f c
alls
Pakistan
India
Sri Lanka
Philipines
Thailand
Source: Diary

ww
w.li
rnea
sia.
net
Bottom of the pyramidSome do own phones

ww
w.li
rnea
sia.
net
Primary reason for choosing to own a mobile (SEC D & E)
64%71% 66% 68%
92%
11%6%
9% 5%
7% 4%
20%17%
18% 16%
4%10%
3%7%
1%1%
0%
10%
20%
30%
40%
50%
60%
70%
80%
90%
100%
Pakistan India Sri Lanka Philippines Thailand
% o
f mob
ile o
wne
rs a
t the
BO
P
Convenience: accessibile at any time So I don’t depend on others For privacy It is cheaper Other
Why own a phone?*
Convenience is key among mobile owners; privacy is more of a concern for higher income countriesConvenience is key among mobile owners; privacy is more of a concern for higher income countries

ww
w.li
rnea
sia.
net
Primary reason for choosing to own a fixed phone (SEC D & E)
55%65%
60% 63%
80%
24%
18%
14% 8%
11%10%
7%6%
7%6%
17% 22%
1%
0%
16%
3%
0%
10%
20%
30%
40%
50%
60%
70%
80%
90%
100%
Pakistan India Sri Lanka Philippines Thailand
% o
f fix
ed o
wne
rs a
t the
BO
P
Convenience: accessibile at any time It is cheaper So I don’t depend on others For privacy Other
Similar pattern among fixed ownersSimilar pattern among fixed owners
Why own a phone 2?*

ww
w.li
rnea
sia.
net
More recent mobile connections at BOP in South Asia
0%
20%
40%
60%
80%
100%
before2001
2001 2002 2003 2004 2005 2006(Q1&2)
Year during which mobile connection was obtained
%(c
um
ula
tiv
e)
at
BO
P w
ho
ob
tain
ed
m
ob
ile c
on
ne
cti
on
in y
ea
r X
Pakistan India Sri Lanka Philippines Thailand

ww
w.li
rnea
sia.
net
Older fixed connections
0%
20%
40%
60%
80%
100%
before2001
2001 2002 2003 2004 2005 2006(Q1&2)
Year during which mobile connection was obtained
%(c
um
ula
tiv
e)
at
BO
P w
ho
ob
tain
ed
m
ob
ile c
on
ne
cti
on
in y
ea
r X
Pakistan India Sri Lanka Philippines Thailand

ww
w.li
rnea
sia.
net
Perceived benefits of ownership
Why does ownership matters

ww
w.li
rnea
sia.
net
Economic benefits from direct access Income generation through the sale of
telecom services; Grameen model… Indirect
Use of a phone by an auto-rickshaw driver Obtaining agricultural price info by farmer Cost savings made by making a call as opposed to taking
a bus ride into town

ww
w.li
rnea
sia.
net
Efficiency of daily activities
BOP sees the benefit
Efficiency of daily activities
1 2 3 4 5
India (3.90)
Sri Lanka (3.98)
Pakistan (4.17) Thailand (4.37)
Philippines (4.40)
worsened slightly worsened
no change somewhat improved
improved

ww
w.li
rnea
sia.
net
Efficiency income benefit?
Indian & Filipino BOP perceives economic benefit Large transactions costs avoided?
Ability to earn or save
1 2 3 4 5
Sri Lanka (3.19)
Thailand (3.56)
Pakistan (3.80) India (3.97)
Philippines(4.07)
worsened slightly worsened
no change somewhat improved
improved

ww
w.li
rnea
sia.
net
Seen both in services and agriculture
0%
10%
20%
30%
40%
50%
60%
70%
80%
90%
100%
Agriculture /Farming
Employed inan off ice
Labourer /Industrialw orker
Trader / SelfEmployed
Employed inservicesector
% o
f o
wn
ers
wh
o's
ab
ilit
y t
o e
arn
or
save h
as
imp
roved India
Sri Lanka
Pakistan
Saving travel time and costs, checking price information, sale of minutes?Saving travel time and costs, checking price information, sale of minutes?

ww
w.li
rnea
sia.
net
But, sense of security is main perceived benefitAbility to act in an emergency is key
Ability to act in emergency
1 2 3 4 5
India (4.28)
Pakistan (4.48)
Sri Lanka (4.58)
Philippines (4.63)
Thailand(4.83)
worsened slightly worsened
no change somewhat improved
improved

ww
w.li
rnea
sia.
net
BOP in summary
Almost everyone has access to a phone, but very low ownership
Benefits of ownership (direct access) are known Perceived as improving efficiency and economic benefit
in India

ww
w.li
rnea
sia.
net
To think about…
Telecom operators Leverage benefits of direct access
Security, friends & familyParticularly in India: cost saving + income
enhancing Increase awareness on efficiency economic gain
Convergence; collaborate on meaningful contentSMS based services vs. Bollywood movies
Innovations to enable cheaper calls e.g. any-amount prepaid balance top-ups

ww
w.li
rnea
sia.
net
C K Prahalad, The Fortune at the BOP “…if we stop thinking of the poor as a burden
and start recognizing them as value conscious consumers, a whole new world of opportunity will open up”


