28
Wylie ISD: Where Are We Now 2015-2016 SCHOOL YEAR

Wylie ISD: Where
Are We Now2015-2016 SCHOOL YEAR

2
DISTRICT ENROLLMENT PROJECTIONS (PK-12)
Cumulative Growth – Moderate Scenario
3 Year = +1,356 (3.1% avg. annual growth)
5 Year = +2,119 (2.8% avg. annual growth)
10 Year = +3,773 (2.4% avg. annual growth)

Five new principals, new Assistant
Superintendent for C&I

31 new teaching positions

Convocation 2015

Welcome back!!!

CURRENT ENROLLMENT

Day 9 September 3, 2015
TOTAL
AKIN BIRM COX DODD GROVES HARTM SMITH TIBB WATKINS WHITT DaIS DrIS HIS BJHS CJHS MJHS WEHS WHS ACHIEVE JJAEP TOTAL
Early Enroll Speech / LEAP 11 0 2 0 0 25 0 5 2 45
BAU 0 5 6 2 2 15
Life Skills (Self Contained) 9 13 0 6 0 5 5 6 11 8 63
Transition to Life Program 5 5
PPCD (Early Childhood) 45 45
Pre-Kindergarten 61 88 149
PreK-Bilingual 35 35
Head Start 0 0
Kindergarten 92 89 118 105 124 72 105 126 101 102 1,034
First 101 106 137 111 120 65 93 122 132 107 1,094
Second 88 95 130 109 127 60 140 149 117 105 1,120
Third 86 105 137 123 133 36 132 119 123 139 1,133
Fourth 97 107 124 121 147 58 137 135 120 124 1,170
Fifth 363 461 341 1,165
Sixth 368 415 355 1,138
Seventh 342 408 348 1 1,099
Eighth 357 360 321 2 1,040
Ninth 548 659 16 1,223
Tenth 456 556 33 1,045
Eleventh 425 558 44 1,027
Twelfth 392 469 23 884
Thirteenth 0
Total 545 515 648 575 651 484 607 666 598 585 731 876 713 699 768 669 1,831 2,242 126 0 14,529
Projected 518 529 637 531 632 523 557 592 591 533 740 829 691 687 752 664 1,862 2,243 141 14,252
Difference 27 -14 11 44 19 -39 50 74 7 52 -9 47 22 12 16 5 -31 -1 -15 0

Keeping pace: WHS

Keeping pace: Cooper/Draper

Keeping pace: Shaffer Stadium

Keeping pace: Bush Elementary

Keeping pace: Bush Elementary

Technology

Keeping pace: What’s next?
Work will start soon at Davis and McMillan,
additional classrooms, tennis courts and
orchestra room
Harrison, Burnett and Hartman “refresh”
Wylie East HS IMPAC building
New digital marquees at all campuses
NO NEW CAMPUSES

How we know all this?
Demographics!!!
Key Highlights
20,852
56,74563,958
2000 2010 2015E
OVERALL POPULATION
7,039
18,164
20,322
0 5,000 10,000 15,000 20,000 25,000
TOTAL HOUSEHOLDS
2015E
2010
2000
2.95
3.12 3.14
2.80
2.90
3.00
3.10
3.20
2000 2010 2015E
AVERAGE HOUSEHOLD SIZE
0.0%
5.0%
10.0%
15.0%
20.0%
0 -
4
5 -
9
10
- 1
4
15
- 2
4
25
- 3
4
35
- 4
4
45
- 5
4
55
- 6
4
65
- 7
4
75
- 8
4
85
+
AGE DISTRIBUTION
2010
2015E
0.0% 5.0% 10.0% 15.0% 20.0% 25.0%
<$15K$15K - $24K$25K - $34K$35K - $49K$50K - $74K$75K - $99K
$100K - $149K$150K - $199K
$200K+
HOUSEHOLD INCOME
13,278
14,391
12,500
13,000
13,500
14,000
14,500
2010 2015E
SCHOOL AGE POPULATION (AGE 5-17)
17
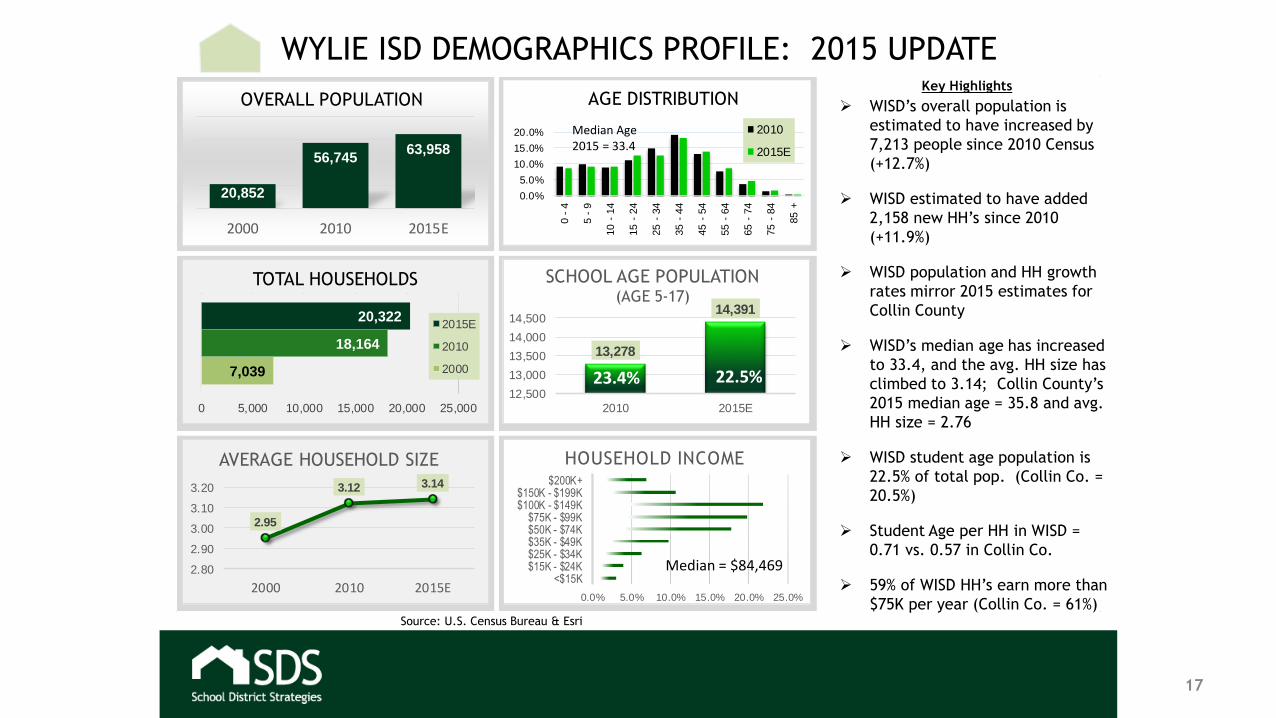
WYLIE ISD DEMOGRAPHICS PROFILE: 2015 UPDATE
Source: U.S. Census Bureau & Esri
WISD’s overall population is
estimated to have increased by
7,213 people since 2010 Census
(+12.7%)
WISD estimated to have added
2,158 new HH’s since 2010
(+11.9%)
WISD population and HH growth
rates mirror 2015 estimates for
Collin County
WISD’s median age has increased
to 33.4, and the avg. HH size has
climbed to 3.14; Collin County’s
2015 median age = 35.8 and avg.
HH size = 2.76
WISD student age population is
22.5% of total pop. (Collin Co. =
20.5%)
Student Age per HH in WISD =
0.71 vs. 0.57 in Collin Co.
59% of WISD HH’s earn more than
$75K per year (Collin Co. = 61%)
Median = $84,469
Median Age 2015 = 33.4
23.4% 22.5%

0
5,000
10,000
15,000
20,000
25,000
30,000
35,000
40,000
45,000
50,000
55,000
60,000
An
nu
al R
ate
Starts
Closings
Lot Deliveries
DFW NEW HOME MARKET: STARTS, CLOSINGS & LOT DELIVERIES
Start = Foundation started Closing = Visibly occupied
18
Year-Over-Year Change
Annual Starts +8.8%
Annual Closings +10.9%
Annual Starts: 25,878
Annual Closings: 22,565

19
WYLIE ISD
ANNUAL NEW HOME CONSTRUCTION
Annual Change
559 Starts: +43.7% (+170 homes)388 Closings: +17.6% (+58 homes)
Annual pace of new home starts is up 43.7% year-over-year to 559 homes
First time the annual pace has been over 500 units since 1Q09
District closings increase 17.6% year-over-year (highest annual total in 4 years)
Developers deliver almost 800 new lots in the district over the past 12 months
*Start = foundation started
Closing = visibly occupied
home

Rank District
Total Starts
3Q14-2Q15
Total Closings
3Q14-2Q15 ESC Region
1 Frisco 2,871 2,603 10
2 Denton 1,790 1,657 11
3 Prosper 1,721 1,421 10
4 Northwest 1,189 1,122 11
5 Keller 1,041 993 11
6 Lewisville 1,210 933 11
7 Eagle Mtn.-Saginaw 965 870 11
8 Rockwall 718 688 10
9 Little Elm 981 613 11
10 Allen 515 591 10
11 McKinney 530 583 10
12 Mansfield 605 491 11
13 Crowley 558 465 11
14 Plano 532 462 10
15 Forney 444 440 10
16 Midlothian 484 431 10
17 Garland 402 427 10
18 H.E.B. 430 408 11
19 Wylie 559 388 10
20 Burleson 434 359 11
20
DFW SCHOOL DISTRICT RANKINGS
BY NEW HOME CLOSINGS 3Q14-2Q15
• Wylie ISD moves up
to 11th in total
annual starts and 19th
in total annual
closings among 82
DFW school districts

1. Woodbridge (Sachse) 96 91 Whitt
2. Wylie Lakes 58 45 Akin
3. Kreymer Estates 47 42 Akin
4. Maxwell Creek North 37 40 Tibbals
5. Gables at North Hill 36 40 Tibbals
6. Parkwood Ranch 42 31 Whitt
7. Bozman Farms 51 28 Watkins
8. Braddock Place 40 23 Watkins
9. Seis Lagos 3 13 Smith
10. Parkside 58 11 Dodd
*Builders at Inspiration start 36 homes as of 6/30/15
21
WYLIE ISD TOP PRODUCING NEW HOME SUBDIVISIONS
Elementary
Zone
Total
Starts
3Q14-2Q15
Total
Closings
3Q14-2Q15

22
WYLIE ISD NEW HOME CONSTRUCTION ACTIVITY BY
ELEMENTARY ATTENDANCE ZONE
Whitt zone sees 31% of new home closings over the past 12 months,
remains the most active attendance zone followed by Akin and Tibbals
23
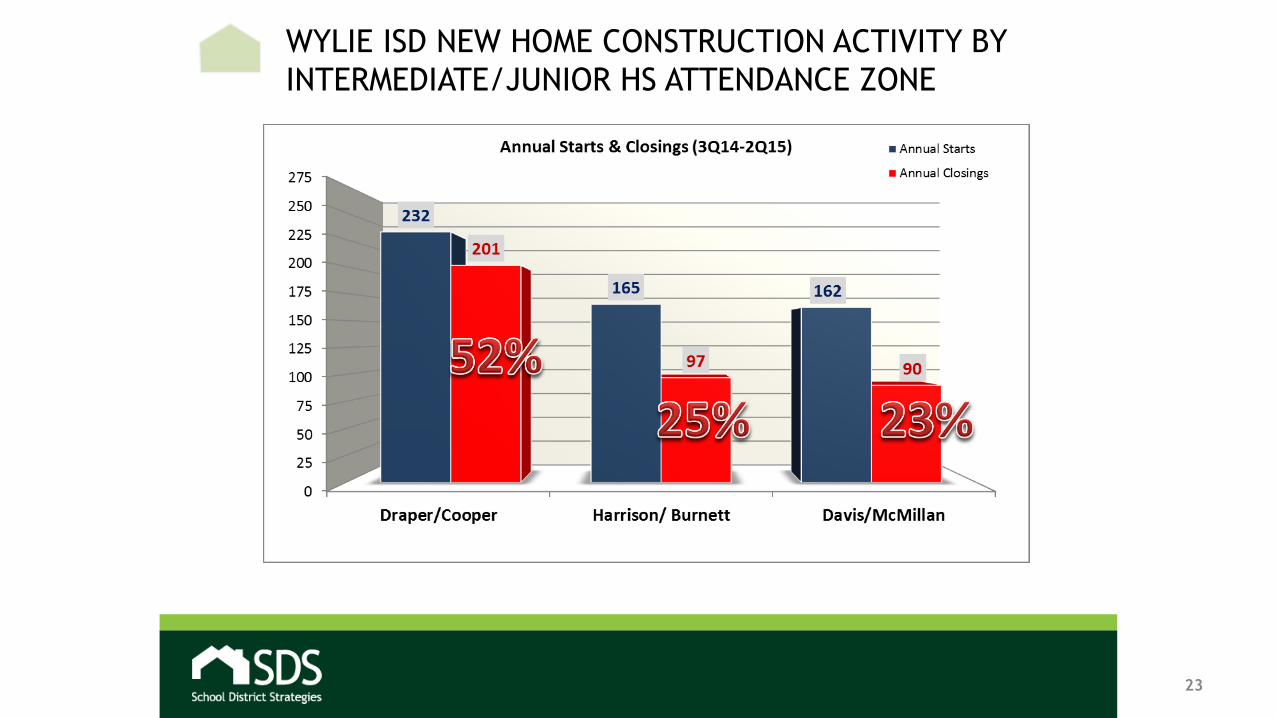
WYLIE ISD NEW HOME CONSTRUCTION ACTIVITY BY
INTERMEDIATE/JUNIOR HS ATTENDANCE ZONE

24
WYLIE ISD NEW HOME CONSTRUCTION ACTIVITY BY
HIGH SCHOOL ATTENDANCE ZONE

High School Enrollment
Campus2015-
16
2016-
17
2017-
18
2018-
19
2019-
20
2020-
21
Wylie HS
Student
Enrollment
2243 2336 2386 2391 2396 2400
Wylie East HS
Student
Enrollment
1838 1884 1956 2036 2123 2298

26
WYLIE ISD NEW HOME ACTIVITY BY PRICE RANGE
2Q15 Median Price = $356,710 15% increase over 2Q14
69% of new homes started
over the past year are located
in subdivisions with average
base pricing between $300K &
$500K
DFW Median New Home Price
= $297,215

27
WYLIE ISD
SF RESIDENTIAL LOT INVENTORY
BY ELEMENTARY ATTENDANCE ZONE
ATTENDANCE
ZONE
ANNUAL
STARTS
3Q14-2Q15
VACANT
DEVELOPED
LOTS
REMAINING
PLANNED
SINGLE
FAMILY
LOTS
PLANNED
MF UNITS
AKIN 105 38 845 0
BIRMINGHAM 2 15 104 158
COX 1 43 53 0
DODD 58 29 0 0
GROVES 21 55 0 0
HARTMAN 0 0 230 0
SMITH 44 203 1,275 252
TIBBALS 73 35 82 0
WATKINS 117 211 1,245 0
WHITT 138 220 248 0
TOTAL 559 849 4,082 410

Wylie ISD is a “Destination District”
as parents move into our
communities we serve to attend
our schools. As they come, we will
be ready to serve them, it’s the
Wylie Way!


