1 WYOMING PLAN TO ENSURE EQUITABLE ACCESS TO EXCELLENT EDUCATORS STATE OF WYOMING DEPARTMENT OF EDUCATION JILLIAN BALOW, STATE SUPERINTENDENT 2300 CAPITOL AVENUE HATHAWAY BUILDING, 2 ND FLOOR CHEYENNE, WY 82002-2060 HTTP://EDU.WYOMING.GOV/ REVISED NOVEMBER 5, 2015
INTRODUCTION In July 2014, U.S. Secretary of Education Arne Duncan announced the Excellent Educators for All initiative, a commitment by the U.S. Department of Education (USDE) to ensure a high quality teacher in every classroom. As part of the initiative and in accordance with section 1111(b)(8)(C) of the Elementary and Secondary Education Act (ESEA) of 1965, each state educational agency (SEA) must submit a state equity plan to the USDE by June 1, 2015. It is required that state equity plans include ways in which SEAs will provide equitable access to high quality educators and ensure that “poor and minority children are not taught at higher rates than other children by inexperienced, unqualified, or out-of-field teachers” (USDE, 2005). The Wyoming Department of Education (WDE) submits this state equity plan to meet these ESEA requirements as outlined in the USDE Frequently Asked Questions guidance (USDE, 2015). This narrative and all annotated materials constitute the full Wyoming state plan for meeting the Excellent Educators for All initiative.
The WDE understands the importance of developing a state equity plan that ensures that Wyoming students are taught by highly qualified educators. The Wyoming Education Code of 1969, Wyo. Stat. § 21-2-102 (2014) signifies the local control nature of Wyoming districts. Specifically, “general supervision of public schools” is entrusted to the state superintendent as prescribed by Wyoming law1. Given this, the WDE is unable to require that a Wyoming district adopt and implement programs, strategies, or policies that do not meet the local context of the district; the district authority lies with the local school boards.
With awareness of the state context that keeps local district control at the forefront, the WDE staff used a four-step process to develop the Wyoming state equity plan. First, education stakeholders from across Wyoming were identified and recruited to be members of the State Equity Planning Committee, which was a critical part of ensuring that the Wyoming equity plan is authentic and feasible for Wyoming public schools and districts. Second, data were gathered and reviewed to determine where equity gaps existed in Wyoming. Third, a root cause analysis process was conducted with the State Equity Planning Committee to identify the source of the equity gaps. Fourth, practical strategies to eliminate the equity gaps based on the causes were selected for implementation, including methods to provide ongoing monitoring and support. The remainder of this plan focuses on the details of each of these four steps.
STAKEHOLDER ENGAGEMENT The WDE recognizes that participation of stakeholdersas part of the State Equity Planning Committee to inform the design, development, and implementation of the Wyoming equity planis essential to ensure
1 The Wyoming Education Code of 1969, Wyo. Stat. § 21-2-102 (2014) states the following responsibilities for the state superintendent: (b) providing a report on the status of all Wyoming public schools to the legislature; (c)(ii) implementing the teacher of the year program; (c)(iii) establishing requirements for the use of seclusion and restraint in schools; (c)(iv) developing protocols to address risks associated with concussions and other head injuries; (c)(v) establishing guidelines for the proper and safe storage and disposal of toxic chemicals; and (c)(vi) identifying professional development needs for Wyoming schools and teachers. Further, Wyo. Stat. § 21-2-102 (c)(i) (2014) indicates that the state superintendent does not have rulemaking power or authority in any area delegated to the state board, the state department of education, or the director.
3
representation of Wyoming education stakeholders. The Committee members were selected to represent all state education stakeholders and have demonstrated expertise, experience in education, and commitment to improving education in the state of Wyoming. Given this, the Committee is broad and authentic and meets the requirements of ESEA sections 1111(a)(1) as outlined in the USDE Frequently Asked Questions guidance under question A-1 (USDE, 2015, p. 7). The Committee comprises 24 stakeholders representing 14 stakeholder groups across Wyoming. Many of the stakeholders serve dual roles. They come from districts across the state and serve in the capacity of educational organization representatives as well as LEA representatives. The stakeholder group includes the following:
• Fremont County School District #21 Board Member – Native American Community Representative • Parent Information Center • Sweetwater County School District #2 – Director of Special Education Programs • University of Wyoming, College of Education • Park County School District #6, Middle School Principal/Wyoming Association of Elementary and
Middle School Principals (WAEMSP) • Crook County School District #1, Superintendent/Wyoming Association of School Administrators
(WASA) • Platte County School District #2/Wyoming Association of Secondary School Principals (WASSP) • Wyoming Community College Commission • Wyoming Department of Education • Wyoming Department of Family Services • Wyoming Education Association (WEA) • Wyoming Professional Teaching Standards Board (PTSB) • Wyoming School Boards Association • Wyoming State Board of Education
STATE EQUITY PLANNING COMMITTEE MEETINGS The State Equity Planning Committee convened four times between April and June 20152. Given the large geography of Wyoming and difficulty bringing stakeholders together in person, the Committee conducted meetings virtually, via online sessions. The North Central Comprehensive Center (NCCC) supported the online sessions through the use of Adobe Connect and meeting facilitation, allowing the WDE staff to fully participate in the planning discussions. Further, the NCCC developed a website to provide stakeholders with information about the Excellent Educators for All initiative, resources, and data. The website also stored meeting agendas, materials, and minutes. (See Appendix A for meeting agendas.)
2 The state superintendent, Jillian Balow, was elected in November 2014, named the WDE leadership team in December 2014, and was sworn into the position in January 2015. Given these leadership changes within the WDE, the equity plan development began in February 2015 with the State Equity Planning Committee formed in March 2015. The WDE staff worked diligently to ensure that ample input and feedback was gathered from Committee members despite the short time frame.
4
The Committee had its first meeting on April 7, 2015. During this meeting, WDE staff provided key background information about the Excellent Educators for All initiative, including the equity plan requirements, the process for developing the Wyoming state plan, key equity definitions used by the WDE, and the role of Committee members in the development of the Wyoming state plan. NCCC presented graphical representations of data to the Committee, which were used to identify equity gaps. Committee members raised questions about the possibility of disaggregating the data to ensure focus on the verified and appropriate equity gaps.
On April 15, 2015, the Committee had a second meeting. During this meeting, the WDE staff provided responses to Committee member questions raised during the first Committee meeting. Next, the NCCC staff presented additional graphs representing the disaggregated data by four district cohorts and used by the special education unit within the WDE. Districts within each of the four cohorts were determined by their size: small, medium small, medium large, and large. After these graphs were reviewed, the NCCC staff facilitated a root cause analysis process to identify the root causes of the top equity gaps. Committee members provided their input on what the root causes were for each of the high priority equity gaps.
On April 27, 2015, the Committee convened for a third meeting. During this meeting, the NCCC staff provided a summary of the top equity gaps and identified root causes. WDE staff then facilitated a discussion to select strategies to address the root causes. Additional stakeholders from the University of Wyoming we attended the meeting by special invitation, and included professional studies professors who had expertise in special education and educational leadership, and the associate dean of Undergraduate Programs. The university representatives provided information on strategies that could be implemented to address the equity gaps related to special education and leadership and described current university initiatives that were relevant to the equity gaps identified by the State Equity Planning Committee. Between the third and fourth meetings, the WDE provided the Committee members with draft sections of the equity plan (Equity Gaps, Strategies for Eliminating Equity Gaps, and Ongoing Monitoring and Support) for their review.
On May 19, 2015, the Committee had its fourth and final meeting. During the final meeting, the NCCC staff reviewed the top equity gaps, identified root causes, and selected improvement strategies. The WDE and NCCC staff facilitated an open discussion of the draft state equity plan. The purpose was to gather the Committee members’ feedback on each section of the Wyoming equity plan.
STATE EQUITY PLANNING COMMITTEE INPUT The WDE recognizes the importance of incorporating input and feedback from the State Equity Planning Committee into the Wyoming equity plan. Throughout development of the state equity plan, the WDE encouraged Committee members to provide honest input and feedback, which was gathered during the four Committee meetings, as noted in the section above. Committee member feedback included adding context about why the Committee started meeting in April instead of earlier; inviting additional stakeholders
5
to the third Committee meeting, given their educator roles in the state; revising the term “poor student” to “low income student”; clarifying the definition of the term “minority student”; providing additional detail on the audiences that received an online survey during the survey administration process (See Data Sources section for more information); adding sample sizes to the graphical representations of the data; and, including additional data regarding highly qualified special education teachers. Committee member feedback was integrated into this plan. The Committee input and feedback was vital in the development of the state equity plan and will continue to be so throughout the implementation of the state equity plan.
CONTINUED STATE EQUITY PLANNING COMMITTEE ENGAGEMENT The WDE will continue to employ numerous methods to engage Committee members. This ensures that the state equity plan will be implemented as intended. WDE will involve various responsible parties (see Strategies for Eliminating Equity Gaps section for more information), most of which are represented by the Committee members, as strategies within the equity plan are implemented. The Committee members will also be included as a responsible part of the future communication planning, which will be developed in March 2016, to disseminate information about the state equity plan across Wyoming. The WDE will provide all districts the opportunity to participate in any of the listed strategies. However, some strategies may be more beneficial to certain districts depending on needs. The WDE is aware that district buy-in is important for the success of the plan. The Committee members will also share the state equity plan with staff within their organizations, as well as with their organizations’ stakeholders.
The WDE will also biannually convene the Committee members to discuss the ongoing status of the equity plan implementation. Monitoring data will be used during these discussions. The outcome of these meetings will be adjustments to strategy implementation based on the monitoring data and Committee member feedback.
EQUITY GAP DETERMINATION In the state of Wyoming, a “teacher” is defined as “any person employed under contract by the board of trustees of a school district as a certified professional employee” (Wyoming Education Code of 1969, Wyo. Stat. § 21-7-102 (a)(vii), 2014).
KEY EQUITY TERMINOLOGY The USDE Frequently Asked Questions guidance under question A-1 (USDE, 2015, p. 7) requires each state equity plan define key equity terminology used within that state. Wyoming defines the key equity terminology in the following manner:
• Inexperienced teacher – Any initial contract teacher who has not been employed by the same school district in the state of Wyoming for a period of three (3) consecutive school years (Wyoming Education Code of 1969, Wyo. Stat. § 21-7-102 (a)(ii)(A), 2014).
6
• Unqualified teacher – A teacher who does not have an educator license3 or an endorsement4; an out-of-field teacher is designated as an unqualified teacher.
• Low income student – Any student qualifying for free and reduced lunch5; “low income student” is used in the state of Wyoming rather than “poor student”.
• Minority student – Any student reported under one or more of the following race/ethnicity categories: Hispanic/Latino Ethnicity, American Indian or Alaska Native, Asian, Black or African American, and Native Hawaiian or Other Pacific Islander6; or, any student reported as non-White.
• Teacher Absence – Total number of FTE teachers who were absent more than 10 days of the regular school year when the teacher would otherwise be expected to be teaching students in an assigned class. Absences include both days taken for sick leave and days taken for personal leave. Personal leave includes voluntary absences for reasons other than sick leave. Absences do not include administratively approved leave for professional development, field trips or other off-campus activities with students
• Teacher Salary – Total school-level personnel expenditures from State and local funds for teachers divided by the total FTE teachers funded by those expenditures. Personnel expenditures for teachers include all types of salary expenditures (i.e., base salaries, incentive pay, bonuses, and supplemental stipends for mentoring or other roles). Personnel expenditures for teachers exclude expenditures for employee benefits. Teacher salary is often dependent on the number of years of experience, education, and other credentials. Average teacher salary data are adjusted, using the Comparable Wage Index (CWI), to account for regional cost of living differences as measured by differences in salaries of other college graduates who are not educators.
• Teacher Turnover – Percentage of total teacher FTE not returning the next school year • Highly Qualified Teacher – holds a bachelor’s degree, holds full state licensure in the area(s)
assigned to teacher AND demonstrates competency in each highly qualified area to which he/she is assigned to teach.
• Cohort – the district cohort size is based on district K-12 enrollment.
Wyoming considers out-of-field teachers as unqualified to teach in a Wyoming school. Thus, data regarding out-of-field teachers are included in the data related to teacher qualifications.
WYOMING BACKGROUND AND DEMOGRAPHICS Wyoming is the 44th state and the 9th largest. At the same time it is the least populated state. The 2010 census records 563,626 residents. Famous for its mountains and wide open spaces, much of Wyoming is so sparsely populated it is categorized as frontier. Over 42% of Wyoming’s land mass is owned by the
3 An educator license is “the document, issued by the Professional Teaching Standards Board, that verifies all certification requirements have been met for a Wyoming Educator License” (PTSB Chapter 1, Section 3(k), n.d.). 4 An endorsement is a “verification that licensure requirements have been met at the grade level(s) and in the specialization area(s) appropriate to the applicant’s preparation, training, and experience” (PTSB Chapter 1, Section 3(l), n.d.). 5 Wyoming districts provide data on low income students to the WDE. 6 Wyoming districts provide data on minority students to the WDE.
7
federal government. Over 91% of land in the state is considered rural. Two Wyoming communities are large enough to be classified as urban by the US Census Bureau. They are Cheyenne with a population in 2013 of 62,448 and Casper with a population of 59,628 for the same year. In addition, there are a few small cities. Most communities are towns and many are isolated or remote. There is one Native American reservation in Wyoming that is the home of two tribes: the Eastern Shoshone and the Northern Arapaho. The major industries in Wyoming are mineral extraction, travel and tourism, and agriculture. The unemployment rate is significantly lower than the national average.
Wyoming K-12 education consists of 48 school districts with a total of 92,218 students reported for the
2013-2014 academic year. The state is fairly homogeneous with the largest subgroup composed of white students totaling 73,245. Hispanic students, numbering 12,080 make up the next largest group followed by Native American at 3,045. All other ethnic groups in the state have less than 2,000 students. Pacific Islander is the smallest with 105 students. The spreadsheet below provides a breakdown of students statewide.
8
DATA SOURCES Numerous data sources were provided by both WDE’s Data and Accountability unit and the Office of Civil Rights (OCR). Reviewing more than one data source allowed for increased confidence in the Committee’s analysis by providing a comprehensive depiction of the educational experience of a Wyoming student. The following data sources were used to determine the equity gaps in Wyoming:
• WDE Highly Qualified Teachers (HQT) report for the 2013–14 academic year (HQT Report);
• WDE K–12 Teacher Turnover Rates by District, 2008–09 to 2012–13 School Years report (Teacher Turnover Report); and,
• OCR Educator Equity Profile for Wyoming based on 2011–12 academic year (Educator Equity Profile) (USDE, 2014).
The HQT Report identifies teachers who are deemed highly qualified according to Wyoming’s rules and regulations, standardizing license and permit provisions of teachers as regulated by the Wyoming Professional Teaching Standards Board (PTSB) in accordance with the Wyoming Administrative Procedure Act (W.S. 16-3-101 through 16-3-115); W.S. 21-2-801 and W.S. 21-2-802 (PTSB, n.d.). The HQT Report provided district-level data teacher experience by poverty and minority quartile, and district-level data on HQT status by poverty and minority quartile:
• The poverty quartiles are determined for both Elementary and Secondary schools based on the grades served and classes per day. The percent of students eligible to receive free/reduced lunch is calculated for each school. Then, separately for Elementary and Secondary schools, the schools are divided into four equal size groups based on free/reduced lunch eligible percentage.
• Minority quartiles are determined by the percent of students reported as non-white (see Key Equity Terminology). Then, separately for Elementary and Secondary schools the schools are divided into four equal size groups based on minority percentage.
The Teacher Turnover Report provided five-year average teacher turnover rates for each district. The Educator Equity Profile provided comparisons of various Wyoming educator characteristics, such as teacher absences and teacher salary.
Perception data, also used to identify equity gaps, were gathered through an online survey, Equity Survey, which was developed and administered by WDE to stakeholders across the state of Wyoming, including district administrators, school administrators, classroom teachers, parents, and community members. The purpose of the survey was to garner feedback from stakeholders on whether or not they believed low-income and minority students were taught at a higher rate than other students by teachers who are inexperienced, unqualified, and out-of-field in Wyoming. The link to the online survey was posted to the WDE website and was provided to leaders within educational agencies across the state of Wyoming who then disseminated the survey link to the constituents of that agency. For example, the link to the online survey was sent out in a weekly WEA newsletter for teachers across Wyoming and distributed to WASA, WASSP, and WAEMSP contacts. Further, during the Wyoming Spring 2015 Continuous Improvement Conference, WDE staff provided the survey link to conference attendees. The online survey link was available for completion during the month of March 2015.
EQUITY GAPS As required in the USDE Frequently Asked Questions guidance under question A-1 (USDE, 2015, p.7–8), equity gaps were revealed as the HQT Report and Teacher Turnover Report data from the WDE, the Educator Equity Profile data from the OCR, and the survey findings were analyzed by the State Equity Planning Committee. Graphical representations of the equity gaps, including teacher experience,
10
teacher qualifications, teacher turnover, teacher absence, and teacher salary are provided. For teacher experience, qualifications, and absence, the WDE considered a percentage difference of more than 5.0% an equity gap. For teacher turnover, the Committee considered a percentage difference of more than 10.0% an equity gap. The Survey Findings of stakeholder perceptions are presented last. The graphs below are broken down by elementary (K-6) and secondary (7-12) full-time equivalent teaching assignments. This provided the State Equity Planning Committee a more specific view of whether gaps were pervasive across K-12 systems, or were specific to either elementary or secondary settings.
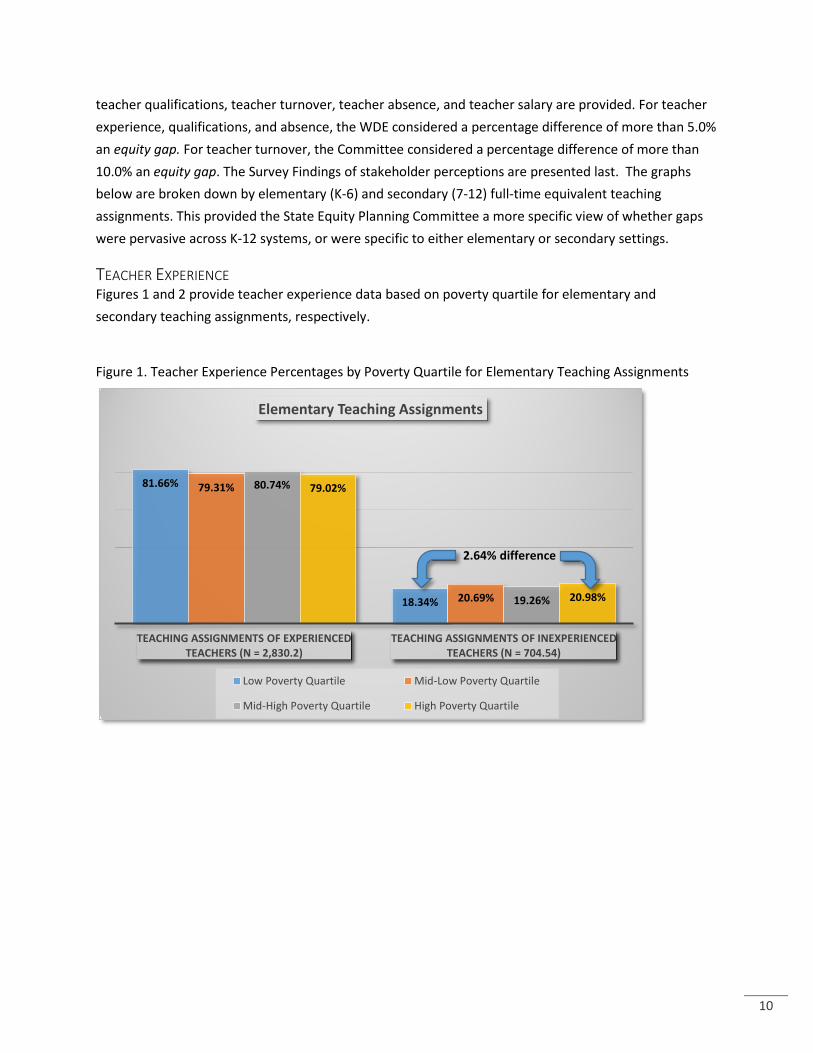
TEACHER EXPERIENCE Figures 1 and 2 provide teacher experience data based on poverty quartile for elementary and secondary teaching assignments, respectively.
Figure 1. Teacher Experience Percentages by Poverty Quartile for Elementary Teaching Assignments
81.66%
18.34%
79.31%
20.69%
80.74%
19.26%
79.02%
20.98%
TEACHING ASSIGNMENTS OF EXPERIENCED TEACHERS (N = 2,830.2)
TEACHING ASSIGNMENTS OF INEXPERIENCED TEACHERS (N = 704.54)
Elementary Teaching Assignments
Low Poverty Quartile Mid-Low Poverty Quartile
Mid-High Poverty Quartile High Poverty Quartile
2.64% difference
11
Figure 2. Teacher Experience Percentages by Poverty Quartile for Secondary Teaching Assignments
Summary of Teacher Experience Data by Student Poverty Status Teacher experience varied slightly in classrooms across Wyoming as related to student poverty status. There is a greater percentage (2.64%) of inexperienced teachers in the high poverty elementary classrooms as compared to low poverty elementary classrooms. Similarly, the percentage of inexperienced teachers in high poverty secondary classrooms was 3.03% greater than in low poverty quartile secondary classrooms. Since these differences were less than 5% at the elementary and secondary levels, the State Equity Planning Committee members did not consider this an equity gap.
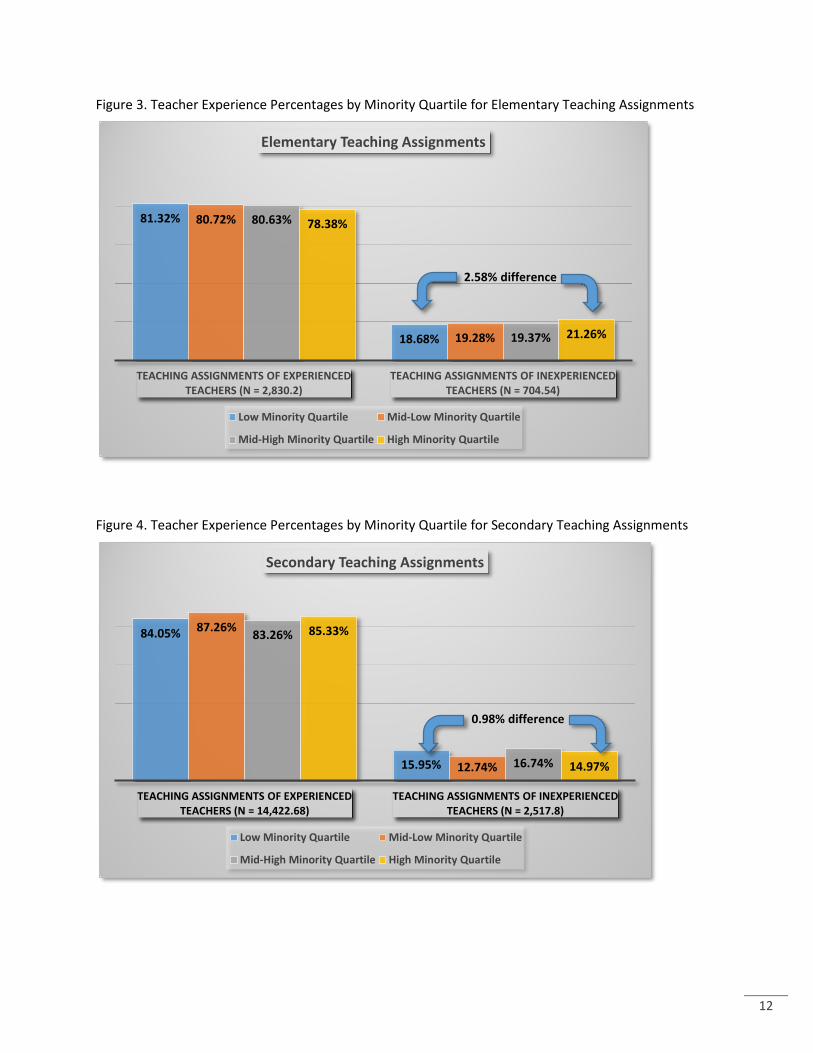
Figures 3 and 4 provide teacher experience data based on minority quartile for elementary and secondary teaching assignments, respectively.
86.93%
13.07%
85.39%
14.61%
83.92%
16.08%
83.90%
16.10%
TEACHING ASSIGNMENTS OF EXPERIENCED TEACHERS (N = 14,422.68)
TEACHING ASSIGNMENTS OF INEXPERIENCED TEACHERS (N = 2,517.8)
Secondary Teaching Assignments
Low Poverty Quartile Mid-Low Poverty Quartile
Mid-High Poverty Quartile High Poverty Quartile
3.03% difference
12
Figure 3. Teacher Experience Percentages by Minority Quartile for Elementary Teaching Assignments
Figure 4. Teacher Experience Percentages by Minority Quartile for Secondary Teaching Assignments
81.32%
18.68%
80.72%
19.28%
80.63%
19.37%
78.38%
21.26%
TEACHING ASSIGNMENTS OF EXPERIENCED TEACHERS (N = 2,830.2)
TEACHING ASSIGNMENTS OF INEXPERIENCED TEACHERS (N = 704.54)
Elementary Teaching Assignments
Low Minority Quartile Mid-Low Minority Quartile
Mid-High Minority Quartile High Minority Quartile
2.58% difference
84.05%
15.95%
87.26%
12.74%
83.26%
16.74%
85.33%
14.97%
TEACHING ASSIGNMENTS OF EXPERIENCED TEACHERS (N = 14,422.68)
TEACHING ASSIGNMENTS OF INEXPERIENCED TEACHERS (N = 2,517.8)
Secondary Teaching Assignments
Low Minority Quartile Mid-Low Minority Quartile
Mid-High Minority Quartile High Minority Quartile
0.98% difference
13
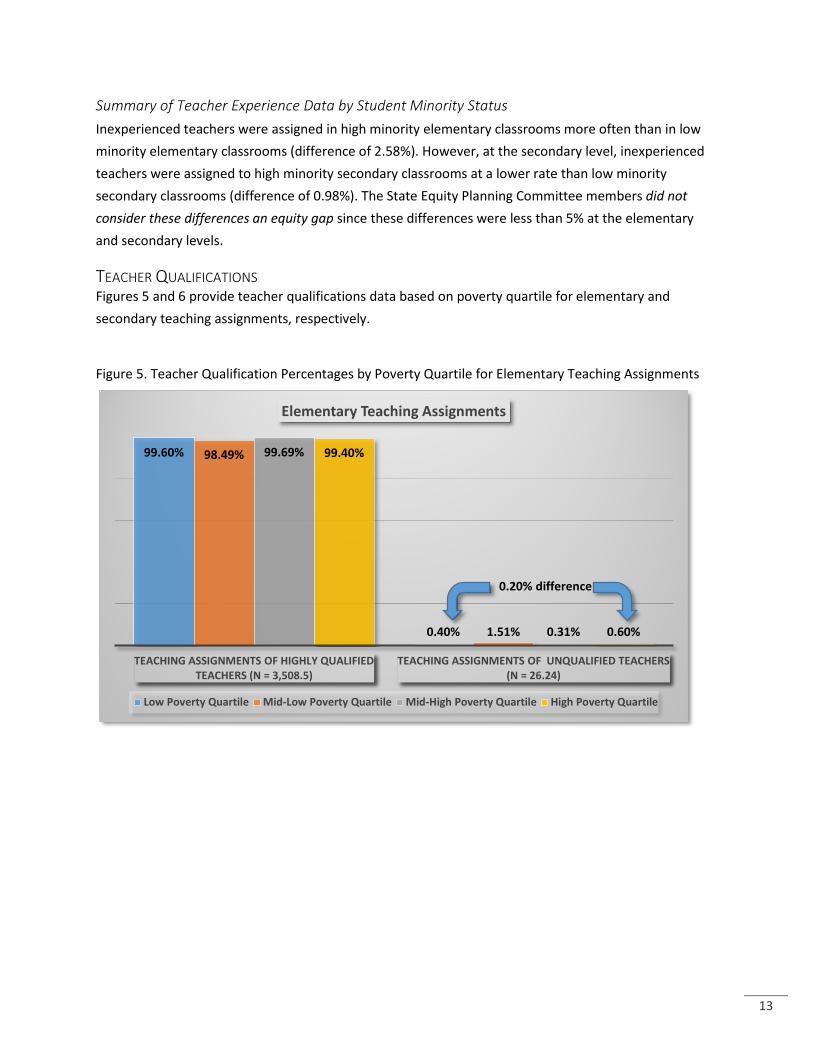
Summary of Teacher Experience Data by Student Minority Status Inexperienced teachers were assigned in high minority elementary classrooms more often than in low minority elementary classrooms (difference of 2.58%). However, at the secondary level, inexperienced teachers were assigned to high minority secondary classrooms at a lower rate than low minority secondary classrooms (difference of 0.98%). The State Equity Planning Committee members did not consider these differences an equity gap since these differences were less than 5% at the elementary and secondary levels.
TEACHER QUALIFICATIONS Figures 5 and 6 provide teacher qualifications data based on poverty quartile for elementary and secondary teaching assignments, respectively.
Figure 5. Teacher Qualification Percentages by Poverty Quartile for Elementary Teaching Assignments
99.60%
0.40%
98.49%
1.51%
99.69%
0.31%
99.40%
0.60%
TEACHING ASSIGNMENTS OF HIGHLY QUALIFIED TEACHERS (N = 3,508.5)
TEACHING ASSIGNMENTS OF UNQUALIFIED TEACHERS (N = 26.24)
Figure 6. Teacher Qualification Percentages by Poverty Quartile for Secondary Teaching Assignments
Summary of Teacher Qualification Data by Student Poverty Status Teacher qualifications varied minimally in classrooms across Wyoming, based on student poverty status. There is a slightly greater percentage (0.20%) of unqualified teachers in the high poverty elementary classrooms as compared to low poverty elementary classrooms. However, at the secondary level, unqualified teachers were assigned to high poverty secondary classrooms at a slightly lower rate than low poverty secondary classrooms (difference of 0.03%). Since these differences were less than 5% at the elementary and secondary levels, the State Equity Planning Committee members did not consider this an equity gap.
Figures 7 and 8 provide teacher qualification data based on minority quartile for elementary and secondary teaching assignments, respectively.
98.81%
1.19%
99.58%
0.42%
99.55%
0.45%
98.84%
1.16%
TEACHING ASSIGNMENTS OF HIGHLY QUALIFIED TEACHERS (N = 16,814.76)
TEACHING ASSIGNMENTS OF UNQUALIFIED TEACHERS (N = 125.72)
Figure 7. Teacher Qualification Percentages by Minority Quartile for Elementary Teaching Assignments
Figure 8. Teacher Qualification Percentages by Minority Quartile for Secondary Teaching Assignments
99.05%
0.95%
99.26%
0.74%
99.47%
0.53%
99.19%
0.81%
TEACHING ASSIGNMENTS OF HIGHLY QUALIFIED TEACHERS (N = 3,508.5)
TEACHING ASSIGNMENTS OF UNQUALIFIED TEACHERS (N = 26.24)
Elementary Teaching Assignments
Low Minority Quartile Mid-Low Minority Quartile
Mid-High Minority Quartile High Minority Quartile
0.14% difference
99.50%
0.50%
99.55%
0.45%
99.10%
0.90%
99.03%
0.97%
TEACHING ASSIGNMENTS OF HIGHLY QUALIFIED TEACHERS (N = 16,814.76)
TEACHING ASSIGNMENTS OF UNQUALIFIED TEACHERS (N = 125.72)
Secondary Teaching Assignments
Low Minority Quartile Mid-Low Minority Quartile
Mid-High Minority Quartile High Minority Quartile
0.47% difference
16
Summary of Teacher Qualification Data by Student Minority Status A comparison of teacher qualification in high minority and low minority classrooms showed minor differences. There is a slightly greater percentage (0.14%) of unqualified teachers in the low minority elementary classrooms as compared to high minority elementary classrooms. At the secondary level, unqualified teachers were assigned to high minority secondary classrooms at a slightly higher rate than low minority secondary classrooms (difference of 0.47%). Since these differences were less than 5% at the elementary and secondary levels, the State Equity Planning Committee members did not consider this an equity gap.
TEACHER TURNOVER Another indicator related to equitable access for all students is teacher turnover. Teacher turnover can have a substantial impact on student learning (Ronfeldt, Loeb, Wyckoff, 2013), particularly, if it occurs within a school year. Figure 9 displays the districts that had an average teacher turnover rate at equal to or higher than 10% for the 2008–09 to 2012–13 school years, or five school years. The statewide five-year average teacher turnover is 8.1% as indicated by the red line.
Figure 9. Districts with Teacher Turnover Rates of ≥10% for 2008-09 to 2012-13 School Years
10.7%10.7%
12.4%12.8%11.5%11.1%
14.0%
16.0%
19.3%
10.6%10.8%10.5%
18.8%
14.8%
12.7%12.8%
10.7%
12.2%
10.7%
17
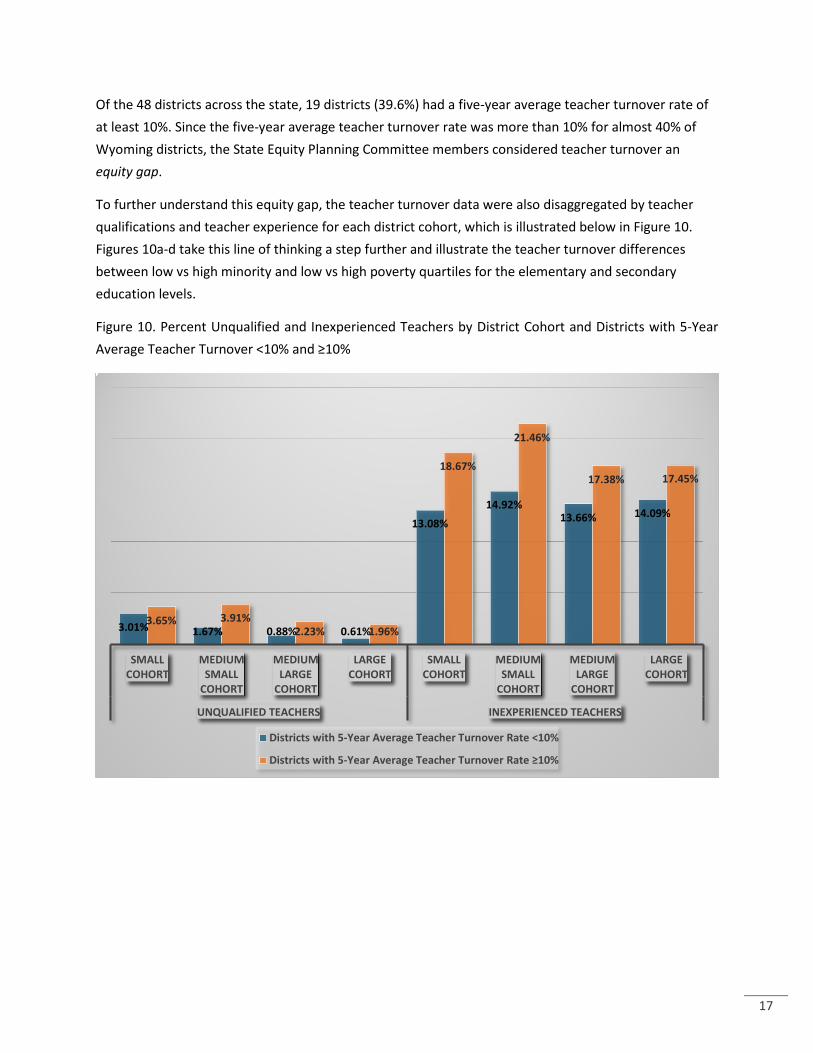
Of the 48 districts across the state, 19 districts (39.6%) had a five-year average teacher turnover rate of at least 10%. Since the five-year average teacher turnover rate was more than 10% for almost 40% of Wyoming districts, the State Equity Planning Committee members considered teacher turnover an equity gap.
To further understand this equity gap, the teacher turnover data were also disaggregated by teacher qualifications and teacher experience for each district cohort, which is illustrated below in Figure 10. Figures 10a-d take this line of thinking a step further and illustrate the teacher turnover differences between low vs high minority and low vs high poverty quartiles for the elementary and secondary education levels.
Figure 10. Percent Unqualified and Inexperienced Teachers by District Cohort and Districts with 5-Year Average Teacher Turnover <10% and ≥10%
3.01% 1.67% 0.88% 0.61%
13.08%
14.92%13.66% 14.09%
3.65% 3.91%2.23% 1.96%
18.67%
21.46%
17.38% 17.45%
SMALL COHORT
MEDIUM SMALL
COHORT
MEDIUM LARGE
COHORT
LARGE COHORT
SMALL COHORT
MEDIUM SMALL
COHORT
MEDIUM LARGE
COHORT
LARGE COHORT
UNQUALIFIED TEACHERS INEXPERIENCED TEACHERS
Districts with 5-Year Average Teacher Turnover Rate <10%
Districts with 5-Year Average Teacher Turnover Rate ≥10%
18
Figure 10a. Percent Unqualified and Inexperienced Elementary Teachers by District Cohort, Districts with 5-Year Average Teacher Turnover <10% and ≥10%, and Low vs High Minority Quartile
Figure 10b. Percent Unqualified and Inexperienced Elementary Teachers by District Cohort, Districts with 5-Year Average Teacher Turnover <10% and ≥10%, and Low vs High Poverty Quartile
Figure 10c. Percent Unqualified and Inexperienced Secondary Teachers by District Cohort, Districts with 5-Year Average Teacher Turnover <10% and ≥10%, and Low vs High Minority Quartile
Figure 10d. Percent Unqualified and Inexperienced Secondary Teachers by District Cohort, Districts with 5-Year Average Teacher Turnover <10% and ≥10%, and Low vs High Poverty Quartile
Summary of Teacher Turnover Data Districts with a five-year teacher turnover rate of 10% or higher had more inexperienced teachers. Regardless of district cohort size, teacher turnover rate was significantly higher among inexperienced teachers. These data also unveiled slightly higher teacher turnover among teachers who were unqualified.
TEACHER ABSENCE Highly qualified status and experience levels are generally not considered when granting substitute teacher licenses; therefore, it was critical to examine the frequency of teacher absences requiring a substitute teacher because it impacts student access to highly qualified and experienced teachers. The Wyoming Educator Equity Profile compiled by the OCR revealed differences in teacher absences between high and low poverty quartile schools (HPQ and LPQ, respectively) and high and low minority quartile schools (HMQ and LMQ, respectively). It is important to note that the OCR defined teachers absent more than 10 days as:
The total number of FTE teachers who were absent more than 10 days of the regular school year when the teacher would otherwise be expected to be teaching students in an assigned class. Absences include both days taken for sick leave and days taken for personal leave. Personal leave includes voluntary absences for reasons other than sick leave. Absences do not include administratively approved leave for professional development, field trips, or other off-campus activities with students (USDE, 2014, p. 4).
This definition indicates that days on which the teacher is either participating in professional development or off-campus activities involving students are not considered teacher absences. Figures 11 and 12 present the percent of teachers absent more than 10 days during the 2011–12 school year.
Figure 11. Teacher Absence Percentages by Poverty Quartile
35.9%
45.5%
LPQ
HPQ
9.6% difference
21
Figure 12. Teacher Absence Percentages by Minority Quartile
Summary of Teacher Absence Data Teacher absences were significantly higher in schools that are defined as high poverty and high minority schools. The rate of teacher absence at high poverty schools was 9.6% higher than in low poverty schools. Similar results were noted in high minority schools with a 15.6% difference in teacher absences as compared to low minority schools. Due to the differences greater than 5%, the State Equity Planning Committee members considered this difference an equity gap.
TEACHER SALARY Another key equity indicator is teacher recruitment and retention efforts for high poverty and high minority schools. Teacher salary is an effective means to incentivize teachers in high needs schools. The Wyoming Educator Equity Profile included data on adjusted average teacher salaries between HPQ and LPQ as well as between HMQ and LMQ. It is important to note that the OCR defined adjusted average teacher salary as:
Total school-level personnel expenditures from State and local funds for teachers divided by the total FTE teachers funded by those expenditures. Personnel expenditures for teachers include all types of salary expenditures (i.e., base salaries, incentive pay, bonuses, and supplemental stipends for mentoring or other roles). Personnel expenditures for teachers exclude expenditures for employee benefits. Teacher salary is often dependent on the number of years of experience, education, and other credentials. Average teacher salary data are adjusted, using the Comparable Wage Index (CWI), to account for regional cost of living differences as measured by differences in salaries of other college graduates who are not educators (U.S. Department of Education, 2014, p. 4).
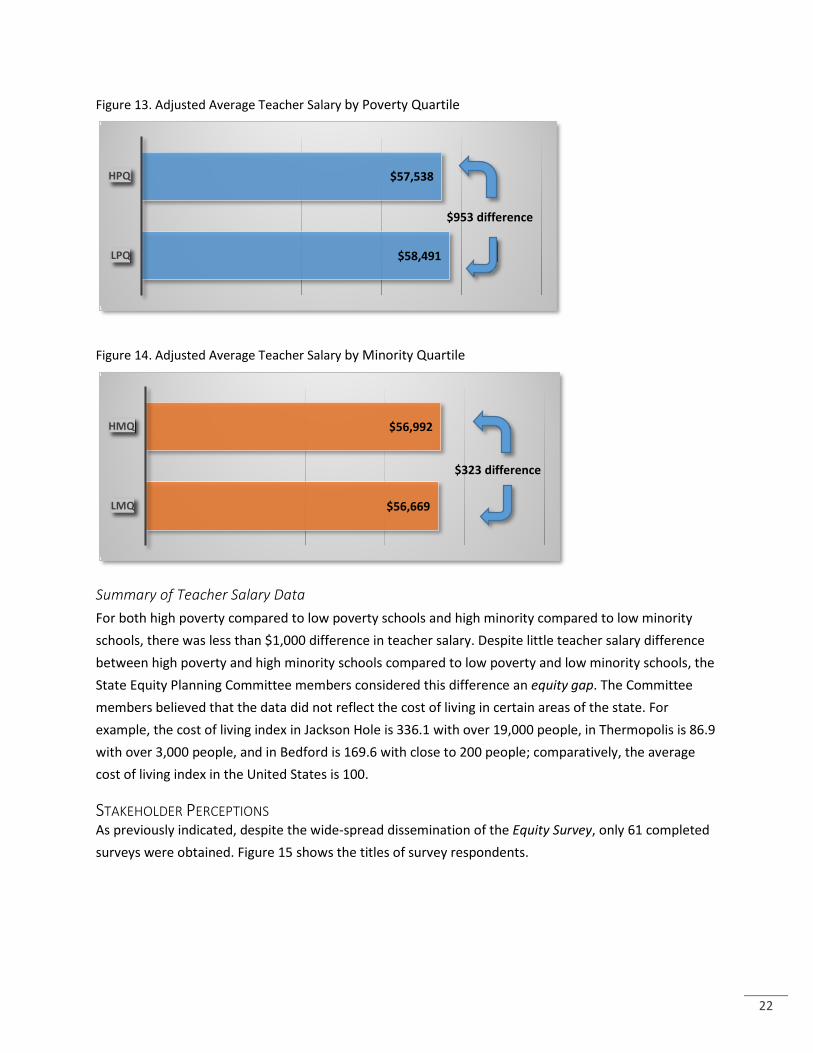
Figures 13 and 14 present the adjusted average teacher salaries in Wyoming for HPQ and LPQ as well as HMQ and LMQ, respectively, during the 2011–12 school year.
31.0%
46.6%
LMQ
HMQ
15.6% difference
22
Figure 13. Adjusted Average Teacher Salary by Poverty Quartile
Figure 14. Adjusted Average Teacher Salary by Minority Quartile
Summary of Teacher Salary Data For both high poverty compared to low poverty schools and high minority compared to low minority schools, there was less than $1,000 difference in teacher salary. Despite little teacher salary difference between high poverty and high minority schools compared to low poverty and low minority schools, the State Equity Planning Committee members considered this difference an equity gap. The Committee members believed that the data did not reflect the cost of living in certain areas of the state. For example, the cost of living index in Jackson Hole is 336.1 with over 19,000 people, in Thermopolis is 86.9 with over 3,000 people, and in Bedford is 169.6 with close to 200 people; comparatively, the average cost of living index in the United States is 100.
STAKEHOLDER PERCEPTIONS As previously indicated, despite the wide-spread dissemination of the Equity Survey, only 61 completed surveys were obtained. Figure 15 shows the titles of survey respondents.
$58,491
$57,538
LPQ
HPQ
$953 difference
$56,669
$56,992
LMQ
HMQ
$323 difference
23
Figure 15. Titles of Survey Respondents
Survey respondents answered two dichotomous, yes/no questions. The first question asked if respondents felt that new or inexperienced teachers are overrepresented in Wyoming schools serving the highest populations of low-income and minority students. The second question asked if respondents felt teachers who are unqualified are overrepresented in Wyoming schools serving the highest populations of low-income and minority students. Figures 16 and 17 present the results for these two survey questions.
Figure 16. Results for Equity Survey Question 1
70.5%
29.5%
Do you feel that new or inexperienced teachers are overrepresented in Wyoming schools that serve the
highest populations of low-income and minority students? (N = 61)
no
yes
24
Figure 17. Results for Equity Survey Question 2
Survey respondents were also asked two open-ended questions. The first question asked respondents if they believed equity gaps exist in education across Wyoming and to explain their response. Sixteen respondents reported they did not believe equity gaps exist, while the remaining 45 respondents reported they believe that an equity gap exists. Respondents offered numerous reasons for potential gaps displayed in Figure 18.
Figure 18. Reasons for Potential Equity Gaps
78.7%
21.3%
Do you feel that teachers who are not highly qualifiedare overrepresented in Wyoming schools that serve the
highest populations of low-income and minority students? (N = 61)
no
yes
10
6
3
3
3
2
2
2
1
1
0 2 4 6 8 10 12
RURAL LOCATION OF SCHOOLS
LOW OR NON-COMPETITIVE SALARY
CHALLENGES IN SCHOOLS ON TRIBAL LANDS
SCHOOL/DISTRICT RESOURCE ALLOCATION
TITLE 1 SCHOOLS ATTRACTING NEW TEACHERS
LACK OF TEACHERS WHO ARE PART OF A MINORITY GROUP (I.E., TEACHERS WHO ARE NATIVE AMERICAN)
LIMITED POOL OF EXPERIENCED APPLICANTS
NEW TEACHERS GETTING EXPERIENCE AND THEN MOVING ON
A SPECIFIC GROUP OF STUDENTS (I.E., ENGLISH LANGUAGE LEARNERS)
LACK OF SCHOOL/DISTRICT LEADERSHIP
25
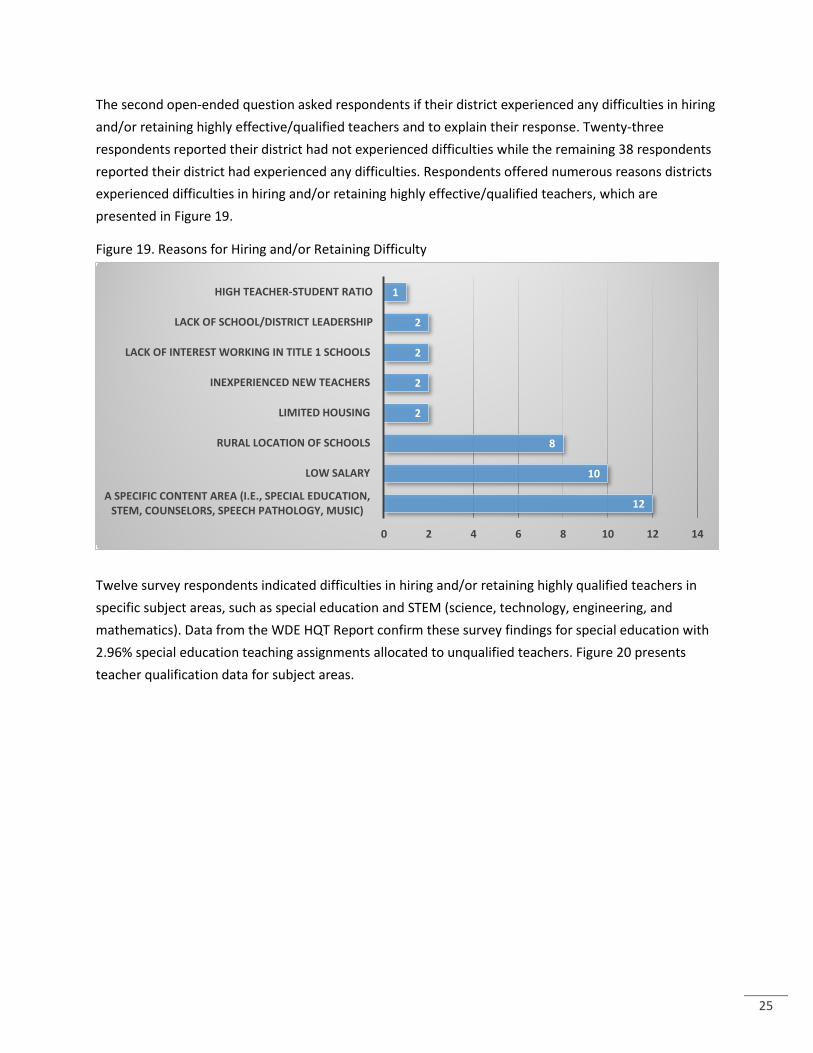
The second open-ended question asked respondents if their district experienced any difficulties in hiring and/or retaining highly effective/qualified teachers and to explain their response. Twenty-three respondents reported their district had not experienced difficulties while the remaining 38 respondents reported their district had experienced any difficulties. Respondents offered numerous reasons districts experienced difficulties in hiring and/or retaining highly effective/qualified teachers, which are presented in Figure 19.
Figure 19. Reasons for Hiring and/or Retaining Difficulty
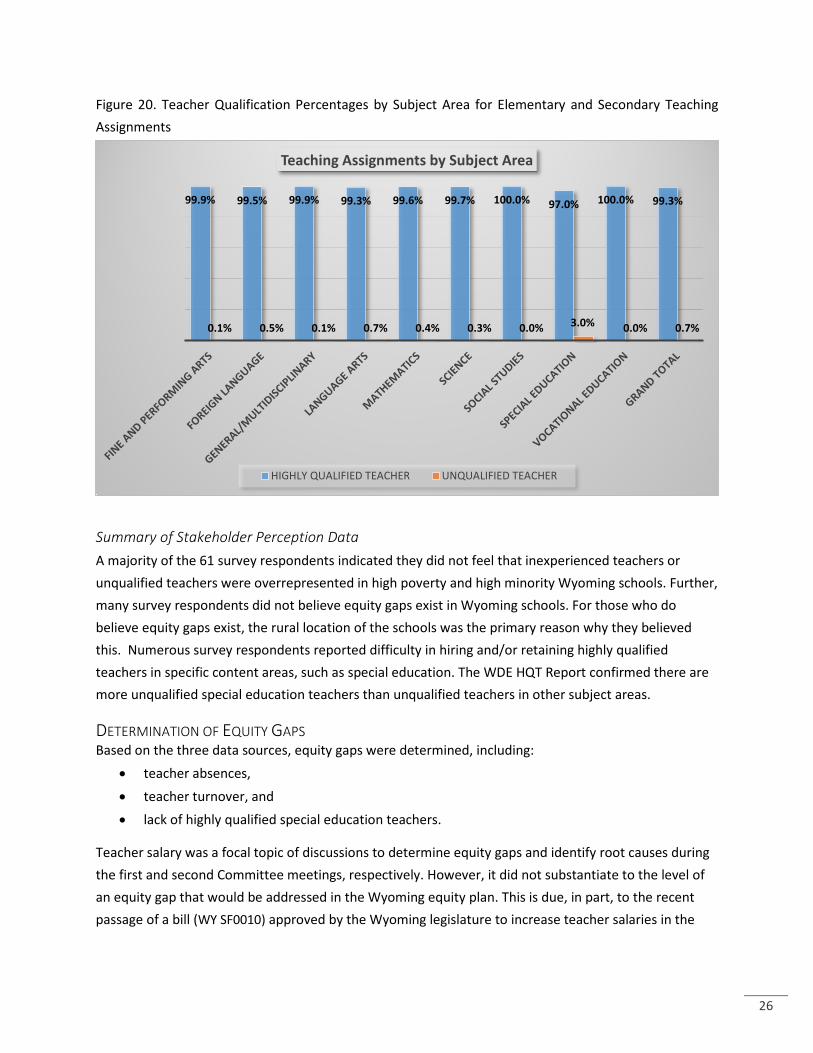
Twelve survey respondents indicated difficulties in hiring and/or retaining highly qualified teachers in specific subject areas, such as special education and STEM (science, technology, engineering, and mathematics). Data from the WDE HQT Report confirm these survey findings for special education with 2.96% special education teaching assignments allocated to unqualified teachers. Figure 20 presents teacher qualification data for subject areas.
12
10
8
2
2
2
2
1
0 2 4 6 8 10 12 14
A SPECIFIC CONTENT AREA (I.E., SPECIAL EDUCATION, STEM, COUNSELORS, SPEECH PATHOLOGY, MUSIC)
LOW SALARY
RURAL LOCATION OF SCHOOLS
LIMITED HOUSING
INEXPERIENCED NEW TEACHERS
LACK OF INTEREST WORKING IN TITLE 1 SCHOOLS
LACK OF SCHOOL/DISTRICT LEADERSHIP
HIGH TEACHER-STUDENT RATIO
26
Figure 20. Teacher Qualification Percentages by Subject Area for Elementary and Secondary Teaching Assignments
Summary of Stakeholder Perception Data A majority of the 61 survey respondents indicated they did not feel that inexperienced teachers or unqualified teachers were overrepresented in high poverty and high minority Wyoming schools. Further, many survey respondents did not believe equity gaps exist in Wyoming schools. For those who do believe equity gaps exist, the rural location of the schools was the primary reason why they believed this. Numerous survey respondents reported difficulty in hiring and/or retaining highly qualified teachers in specific content areas, such as special education. The WDE HQT Report confirmed there are more unqualified special education teachers than unqualified teachers in other subject areas.
DETERMINATION OF EQUITY GAPS Based on the three data sources, equity gaps were determined, including:
• teacher absences, • teacher turnover, and • lack of highly qualified special education teachers.
Teacher salary was a focal topic of discussions to determine equity gaps and identify root causes during the first and second Committee meetings, respectively. However, it did not substantiate to the level of an equity gap that would be addressed in the Wyoming equity plan. This is due, in part, to the recent passage of a bill (WY SF0010) approved by the Wyoming legislature to increase teacher salaries in the
2014–15 school year7. The Wyoming Education Resource Block Grant Model (the “funding model”) provides salaries for each personnel category and adjusts the salaries by individual school district characteristics. Through a series of court cases, the Wyoming Supreme Court required that the State of Wyoming finance formula account for differences in teacher education and experience in determining district funding for salaries. The average compensation amount for each personnel category in the model is computed individually for each district based on education, experience and span of control for administrators in accordance with state statute (W.S. 21-13-309(m)(v)(C)). For each personnel category, the district average salary is calculated up or down depending on the relation to the statewide average. For example, if a district has higher than average experience, the district’s salary will be increased, all else equal. The computed average salary is further adjusted by the district’s RCA to account for cost differences between different regions in the state. As a result, the State’s School Funding Model ensures salaries are equitably distributed across the state, and this was determined not to be an equity gap that needed addressing by the Committee.
STRATEGIES FOR ELIMINATING EQUITY GAPS THEORY OF ACTION
The WDE is committed to ensuring every student in a Wyoming public school is taught by a highly qualified teacher. To accomplish this goal, the WDE will employ systemic strategies to eliminate the equity gaps, based on the following theory of action:
If an approach to prepare, hire, and support teachers, special education teachers in particular, is systematically and systemically implemented and implementation is monitored and modified over time,
Then Wyoming school districts will be better able to recruit, retain, and develop highly qualified teachers, special education teachers in particular, such that all students have equitable access to excellent teaching to help them achieve academically.
IDENTIFICATION OF ROOT CAUSES As required in the USDE Frequently Asked Questions guidance under question A-1 (USDE, 2015, p.8), a root cause analysis was conducted to explain the likely causes of the identified equity gaps. The root cause analysis process employed by the State Equity Planning Committee was supported by NCCC staff through the WHY? Method. This Method includes three steps:
1. Identify plausible contributing factor(s). 2. Ask “Why?” of each equity gap and answer “Because…”
7 WY SF0010 provides $6 million to the WDE to distribute to districts for the sole purpose of salary increases. (See http://legisweb.state.wy.us/2015/Chapter/SF0001.PDF)
3. Stop asking “Why?” when a key contributing factor of the equity gap is revealed.
NCCC staff facilitated this root cause analysis method with the Committee members. Table 1 provides each equity gap as well as the root causes associated with it, based on responses from Committee members.
Table 1. Root Causes by Equity Gap Equity Gap #1: Teacher Absenteeism
WHY Level 1: Why is the percentage of teacher absenteeism higher in the larger cohort schools compared to the smaller cohort schools? Committee response: • After stakeholder discussion, it was determined that this is not an equity gap due to districts’ negotiated
contracts, district leave policies, and specific reasons for teacher absences (i.e., illness or other legitimate reasons). The WDE does not collect teacher absenteeism data. Included in these contracts may be an allotted number of sick/leave days awarded to teachers. The stakeholders agreed that this was not an area they wanted to pursue as district policies are distinctive.
Equity Gap #2: Teacher Turnover WHY Level 1: Why is teacher turnover higher in districts that have more inexperienced teachers? Committee response: • Unstable, poor leadership • Challenging work place • District-level policies • Teacher recruitment is challenging
WHY Level 2: Why is leadership considered ineffective? Committee response: • Lack of school leadership training WHY Level 2: Why is the workplace at these schools challenging for teachers? Committee response: • Negative media/press coverage • External pressure (i.e., federal accountability) • Lack of school leadership training WHY Level 2: Why is teacher recruitment challenging? Committee response:
• Fewer applicants to teacher colleges • There are more vacancies across Wyoming districts than the graduates of the University of
Wyoming (UW) College of Education are able to fill WHY Level 3: Why is there a challenge with graduating more UW students from their education program? Committee response:
o They do not have capacity to handle more students in certain content areas or majors Equity Gap #3: Highly Qualified Special Education Teachers
WHY Level 1: Why is there a higher percentage of unqualified special education teachers in the small cohort, high minority, high poverty districts? Committee response: • Hard to recruit • UW does not have an undergraduate special education program, only a Master’s program • More liability and paperwork
WHY Level 2: Why is it hard to recruit highly qualified special education teachers? Committee response: • Few applicants
29
• Less desirable job • High number of behavioral disorders • Parents may not be as supportive with children with behavioral issues
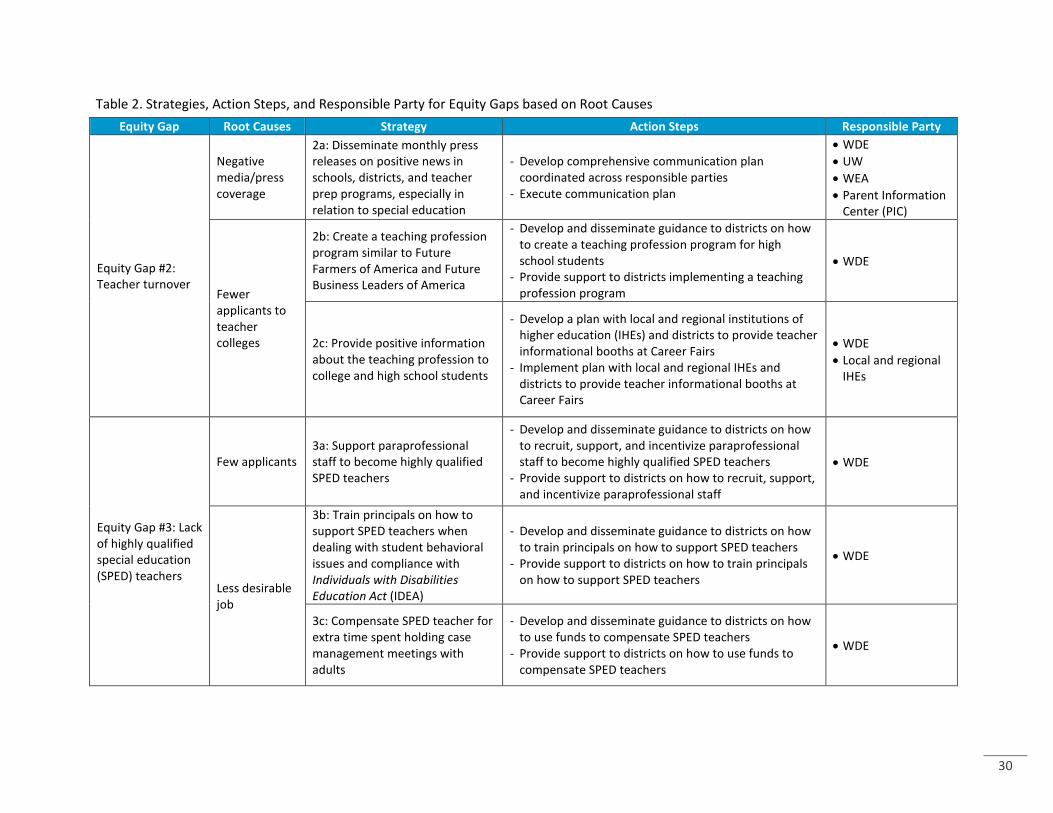
SELECTED STRATEGIES As required in the USDE Frequently Asked Questions guidance under question A-1 (USDE, 2015, p. 8), strategies to eliminate the identified equity gaps were selected during the third meeting of the State Equity Planning Committee. The WDE will assume primary responsibility for initiating the implementation each strategy. Additional responsible parties may include stakeholder organizations that were part of the State Equity Planning Committee. Table 2 aligns the equity gaps with identified root causes, selected strategies, the possible responsible party/parties for each of the selected strategies, and the essential action steps to be taken for each strategy.
30
Table 2. Strategies, Action Steps, and Responsible Party for Equity Gaps based on Root Causes Equity Gap Root Causes Strategy Action Steps Responsible Party
Equity Gap #2: Teacher turnover
Negative media/press coverage
2a: Disseminate monthly press releases on positive news in schools, districts, and teacher prep programs, especially in relation to special education
- Develop comprehensive communication plan coordinated across responsible parties
- Execute communication plan
• WDE • UW • WEA • Parent Information
Center (PIC)
Fewer applicants to teacher colleges
2b: Create a teaching profession program similar to Future Farmers of America and Future Business Leaders of America
- Develop and disseminate guidance to districts on how to create a teaching profession program for high school students
- Provide support to districts implementing a teaching profession program
• WDE
2c: Provide positive information about the teaching profession to college and high school students
- Develop a plan with local and regional institutions of higher education (IHEs) and districts to provide teacher informational booths at Career Fairs
- Implement plan with local and regional IHEs and districts to provide teacher informational booths at Career Fairs
• WDE • Local and regional
IHEs
Equity Gap #3: Lack of highly qualified special education (SPED) teachers
Few applicants 3a: Support paraprofessional staff to become highly qualified SPED teachers
- Develop and disseminate guidance to districts on how to recruit, support, and incentivize paraprofessional staff to become highly qualified SPED teachers
- Provide support to districts on how to recruit, support, and incentivize paraprofessional staff
• WDE
Less desirable job
3b: Train principals on how to support SPED teachers when dealing with student behavioral issues and compliance with Individuals with Disabilities Education Act (IDEA)
- Develop and disseminate guidance to districts on how to train principals on how to support SPED teachers
- Provide support to districts on how to train principals on how to support SPED teachers
• WDE
3c: Compensate SPED teacher for extra time spent holding case management meetings with adults
- Develop and disseminate guidance to districts on how to use funds to compensate SPED teachers
- Provide support to districts on how to use funds to compensate SPED teachers
• WDE
31
Equity Gap Root Causes Strategy Action Steps Responsible Party
Parents may or may not be as supportive
3d: Train principals on how to support SPED teachers when dealing with parents
- Develop and disseminate guidance to districts on how to train principals on how to support SPED teachers
- Provide support to districts on how to train principals on how to support SPED teachers
• WDE • PIC
3e: Provide parents and families with more information on what is going on in their child’s school and classroom and how to get involved
- Develop and disseminate guidance to districts on how to engage parents and families of SPED students
- Provide support to districts on how to train principals on how to engage parents and families of SPED students
• WDE • PIC
32
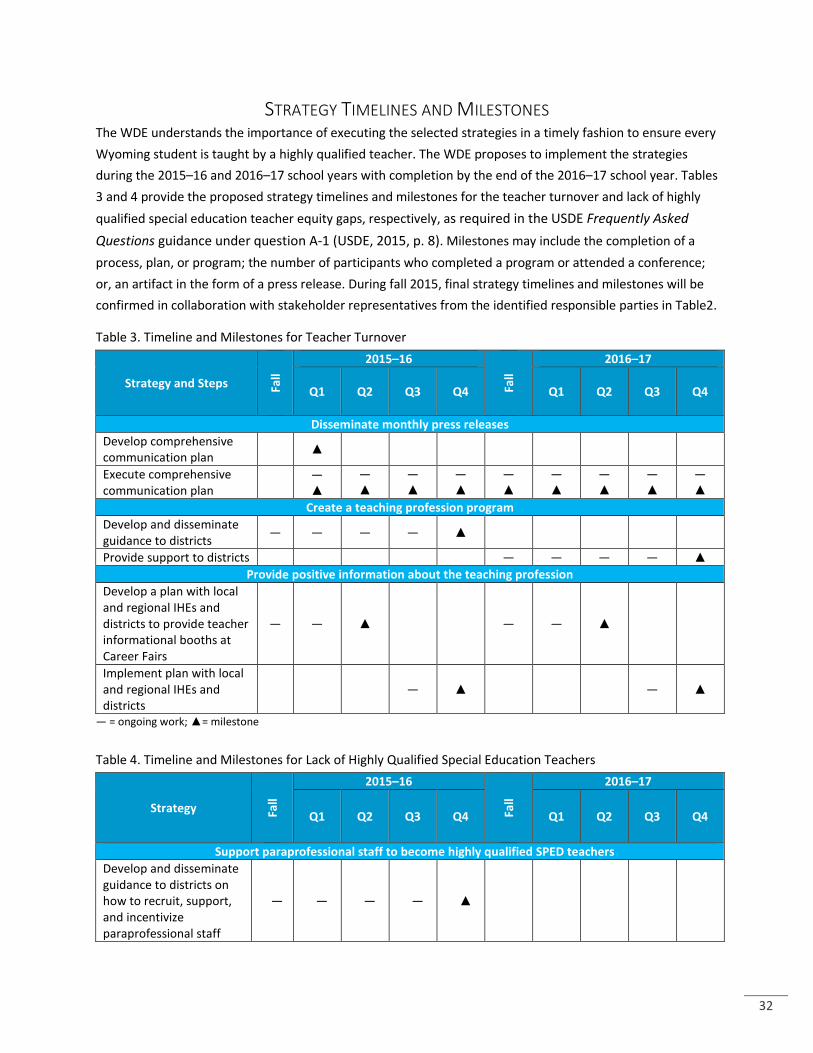
STRATEGY TIMELINES AND MILESTONES The WDE understands the importance of executing the selected strategies in a timely fashion to ensure every Wyoming student is taught by a highly qualified teacher. The WDE proposes to implement the strategies during the 2015–16 and 2016–17 school years with completion by the end of the 2016–17 school year. Tables 3 and 4 provide the proposed strategy timelines and milestones for the teacher turnover and lack of highly qualified special education teacher equity gaps, respectively, as required in the USDE Frequently Asked Questions guidance under question A-1 (USDE, 2015, p. 8). Milestones may include the completion of a process, plan, or program; the number of participants who completed a program or attended a conference; or, an artifact in the form of a press release. During fall 2015, final strategy timelines and milestones will be confirmed in collaboration with stakeholder representatives from the identified responsible parties in Table2.
Table 3. Timeline and Milestones for Teacher Turnover
Strategy and Steps Fall
2015–16
Fall
2016–17
Q1 Q2 Q3 Q4 Q1 Q2 Q3 Q4
Disseminate monthly press releases Develop comprehensive communication plan ▲
Execute comprehensive communication plan —
▲ — ▲
— ▲
— ▲
— ▲
— ▲
— ▲
— ▲
— ▲
Create a teaching profession program Develop and disseminate guidance to districts — — — — ▲
Provide support to districts — — — — ▲ Provide positive information about the teaching profession
Develop a plan with local and regional IHEs and districts to provide teacher informational booths at Career Fairs
— — ▲ — — ▲
Implement plan with local and regional IHEs and districts
— ▲ — ▲
— = ongoing work; ▲= milestone Table 4. Timeline and Milestones for Lack of Highly Qualified Special Education Teachers
Strategy Fall
2015–16
Fall
2016–17
Q1 Q2 Q3 Q4 Q1 Q2 Q3 Q4
Support paraprofessional staff to become highly qualified SPED teachers Develop and disseminate guidance to districts on how to recruit, support, and incentivize paraprofessional staff
— — — — ▲
33
Provide support to districts — — — — ▲
Train principals on how to support SPED teachers when dealing with student behavioral issues and compliance with IDEA
Develop and disseminate guidance to districts on how to train principals on how to support SPED teachers
— — — — ▲
Provide support to districts — — — — ▲
Compensate SPED teacher for extra time spent holding case management meetings with adults Develop and disseminate guidance to districts on how to use funds to compensate SPED teachers
— — — — ▲
Provide support to districts — — — — ▲
Train principals on how to support SPED teachers when dealing with parents Develop and disseminate guidance to districts on how to train principals on how to support SPED teachers
— — — — ▲
Provide support to districts — — — — ▲
Provide parents and families with more information on what is going on in their child’s school and classroom and how to get involved
Develop and disseminate guidance to districts on how to engage parents and families of SPED students
— — — — ▲
Provide support to districts — — — — ▲
— = ongoing work; ▲= milestone
CAPITAL TO SUPPORT STRATEGY IMPLEMENTATION In order to address the root causes of the equity gaps, the WDE has financial capital, human capital, and social capital to ensure the strategies delineated are implemented as intended. Financial capital to assist with the implementation of the selected strategies will be provided through corresponding Federally Funded Programs. Therefore, responsible parties of the selected strategies can draw from the various title programs required to ensure compliance with equity provisions such as Title I, Title II Part A, Title II State Discretionary, and Title III.
The WDE also has the human capital necessary to lead and support the implementation of the strategies. Several key WDE staff are part of the State Equity Planning Committee and will also be integrally involved in strategy implementation. These WDE Committee members represent numerous units across WDE: Federal
34
Programs, Special Programs, Standards and Accountability, and Communication. They will operate under the direction of the WDE Chief Academic Officer for the purposes of the state equity plan implementation.
The WDE can use their social capital as the strategies are implemented. The State Equity Planning Committee members and the organizations that they represent provide social capital through the abundance of resources, expertise, and human capital that can be leveraged throughout the implementation of the selected strategies. Further, the WDE will receive continued support from the NCCC staff to build the WDE staff capacity to systemically and systematically implement the strategies.
ADDITIONAL WYOMING INITIATIVES Specific root causes that were identified will be addressed through other initiatives occurring across Wyoming. Examples include school leadership training at the annual WASA conference, and principal training and mentorship through the Wyoming Center for Educational Leadership. These initiatives will assist school and district leaders to support teachers and, thus, help to address the high rate of teacher turnover. Further, UW College of Education staff are investigating a possible minor in special education for pre-service teachers. This effort will help to address the lack of highly qualified special education teachers.
WDE recognizes that strong partnerships with WASA and UW are essential to supporting these ongoing initiatives. Commitment to these partnerships is a high priority of the newly-appointed WDE leadership and will be fostered through greater collaboration on strategies related to Wyoming’s Equity Plan.
ONGOING MONITORING AND SUPPORT Given the local control nature of Wyoming education, the WDE is committed to supporting districts choosing to participate in and/or implement the strategies outlined in this equity plan (Table 2). Monitoring will occur through data collection conducted by the WDE and/or identified responsible parties. Data will be collected for three purposes: 1) ongoing monitoring of equity gaps; 2) monitoring of milestone completion identified in Tables 3 and 4) informing the support provided to districts as they participate in and/or implement the strategies. The metrics to be utilized for reporting are described in detail in the subsequent sections below. Annual public reporting on the WDE website will be posted of progress made on closing each of the mentioned equity gaps. These elements are outlined in the USDE Frequently Asked Questions guidance under question A-1 (USDE, 2015, p. 8).
ONGOING MONITORING OF EQUITY GAPS The WDE Data Collection and Reporting unit will continue to collect data to generate the HQT report and the K–12 Teacher Turnover Rates by District report. These reports, which were used to identify equity gaps, provided baseline data to monitor the extent to which poor and minority students are being taught by unqualified, inexperienced, or out-of-field teachers. The HQT report and the K-12 Teacher Turnover Rates report will be used to monitor WDE’s progress in closing the equity gaps identified.
35
Monitoring differences between schools in the high and low poverty quartiles, as well as schools in the high and low minority quartiles, will provide evidence of progress made through the state equity plan or identify a need for modification of the state equity plan. In addition to teacher turnover data, WDE intends to collect school leader and superintendent turnover data in 2015–16 and 2016–17. These additional data will help to inform the next iteration of the equity plan. All data will be reviewed annually by the WDE and the State Equity Planning Committee members to determine what additional strategies may need to be implemented, and will be publicly provided on an annual basis on the WDE website.
MONITORING OF MILESTONE COMPLETION As indicated previously, the WDE will assume primary responsibility for the strategies and completion of milestones for each strategy. Milestones can include the completion of a process, plan, or program; the number of participants who completed a program or attended a conference; or, an artifact in the form of a press release. The WDE will collaborate with the identified responsible parties to ensure data collection, detailed in Table 5, and milestones are completed in accordance with the finalized strategy timelines. These data will be reviewed on a bi-annual basis by the WDE and the identified responsible parties to assess strategy implementation, modification, and completion. The information will be made available to appropriate education stakeholders across Wyoming.
SUPPORT PROVIDED TO DISTRICTS As mentioned above, districts within Wyoming have a choice in using the guidance provided by the WDE as part of local control, and the WDE is dedicated to supporting those districts. To ensure the support is meeting district needs, data will be collected by surveying districts as they employ the guidance documents. The surveys will include questions about the quality, relevancy, and utility of the WDE guidance. There will also be questions on how the district has used the guidance; what the challenges and successes have been; and, the kinds of support that were needed from the WDE. Table 5 identifies the data that will be collected to assess district utilization of WDE guidance to inform the any additional WDE support needed by districts.
These data will be reviewed on a regular basis by the WDE to ensure that the support provided by WDE is timely. WDE-provided support may include helping districts identify and allocate funds within the district’s budget to compensate SPED teachers, developing a communication plan on methods to engage parents and families of SPED students, and determining an appropriate content and structure of a teaching profession program. If a district requires support from a WDE partner, the WDE will utilize its social capital and collaborate with its partners to ensure district needs are met.
36
Table 5. Data to Collect for Each Strategy and Step Strategy Steps Data to Collect
2a: Disseminate monthly press releases on positive news in schools, districts, and teacher prep programs, especially in relation to special education
- Develop comprehensive communication plan coordinated across responsible parties
- Execute communication plan
• Document detailing the comprehensive communication plan
• Number of press releases disseminated • Artifacts
2b: Create a teaching profession program similar to Future Farmers of America and Future Business Leaders of America
- Develop and disseminate guidance to districts on how to create a teaching profession program for high school students
- Provide support to districts implementing a teaching profession program
• Document detailing how to create a teaching profession program
• Number of districts that received the guidance • Number of districts that indicate that they will use the
guidance • Survey of districts using the guidance
2c: Provide positive information about the teaching profession to college and high school students
- Develop a plan with local and regional institutions of higher education (IHEs) and districts to provide teacher informational booths at Career Fairs
- Implement plan with local and regional IHEs and districts to provide teacher informational booths at Career Fairs
• Document detailing teacher informational booths at Career Fairs
• Number of Career Fairs with teacher informational booths, including the participating local and regional IHEs and districts
• Number of people who received information from the teacher informational booths
3a: Support paraprofessional staff to become highly qualified SPED teachers
- Develop and disseminate guidance to districts on how to recruit, support, and incentivize paraprofessional staff to become highly qualified SPED teachers
- Provide support to districts on how to recruit, support, and incentivize paraprofessional staff
• Document detailing how to recruit, support, and incentivize paraprofessional staff to become highly qualified SPED teachers
• Number of districts that received the guidance • Number of districts that indicate that they will use the
guidance • Survey of districts using the guidance
3b: Train principals on how to support SPED teachers when dealing with student behavioral issues and compliance with Individuals with Disabilities Education Act (IDEA)
- Develop and disseminate guidance to districts on how to train principals on how to support SPED teachers
- Provide support to districts on how to train principals on how to support SPED teachers
• Document detailing how to train principals on how to support SPED teachers
• Number of districts that received the guidance • Number of districts that indicate that they will use the
guidance • Survey of districts using the guidance
37
Strategy Steps Data to Collect
3c: Compensate SPED teacher for extra time having case management meetings with adults
- Develop and disseminate guidance to districts on how to use funds to compensate SPED teachers
- Provide support to districts on how to use funds to compensate SPED teachers
• Document detailing how to train principals on how to use funds to compensate SPED teachers
• Number of districts that received the guidance • Number of districts that indicate that they will use the
guidance • Survey of districts using the guidance
3d: Train principals on how to support SPED teachers when dealing with parents
- Develop and disseminate guidance to districts on how to train principals on how to support SPED teachers
- Provide support to districts on how to train principals on how to support SPED teachers
• Document detailing how to train principals on how to support SPED teachers
• Number of districts that received the guidance • Number of districts that indicate that they will use the
guidance • Survey of districts using the guidance
3e: Provide parents and families with more information on what is going on in their child’s school and classroom and how to get involved
- Develop and disseminate guidance to districts on how to engage parents and families of SPED students
- Provide support to districts on how to train principals on how to engage parents and families of SPED students
• Document detailing how to train principals on how to engage parents and families of SPED students
• Number of districts that received the guidance • Number of districts that indicate that they will use the
guidance • Survey of districts using the guidance
38
CONCLUSION In consonance with the Excellent Educators for All initiative and section 1111(b)(8)(C) of the Elementary and Secondary Education Act (ESEA) of 1965, the WDE submits this equity plan to assure that poor and minority students are not taught at higher rates than their counterparts by unqualified, inexperienced, or out-of-field teachers. The Wyoming equity plan followed the guidelines outlined in the USDE Frequently Asked Questions (2015). The process used to create the Wyoming equity plan began with the formation of the State Equity Planning Committee. Committee members were deliberately selected to ensure broad representation from all education stakeholder groups across Wyoming. Further, the Committee members were knowledgeable of and experienced with the strong local-control nature of education in Wyoming.
During the review of the data, it was clear that Wyoming has minimal equity gaps statewide among schools, with regard to the extent that low income students are taught by inexperienced, unqualified, or out-of-field teachers. Based on the data review, equity gaps were determined by the State Equity Planning Committee members, including:
• teacher absences, • teacher shortage, and • lack of highly qualified special education teachers.
However, during the root cause analysis process, it was concluded that the rate of teacher absences could not be classified as an equity gap, due to the lack of information on districts’ negotiated contracts, district leave policies, and specific reasons for teacher absences (i.e., illness or other legitimate reasons).
Next, the Committee members went through a root cause analysis process for teacher shortage and lack of highly qualified special education teachers. Root causes identified for teacher shortage included the lack of school leadership training, negative media/press coverage, and fewer applicants to teacher colleges. Root causes for the lack of highly qualified special education teachers consisted of too few applicants, its undesirability as a profession, and working with parents who may not be supportive.
Strategies to address each root cause and decrease the equity gaps were selected, and include disseminating monthly press releases; creating a teaching profession program; supporting paraprofessional staff to become highly qualified; training principals on how to support special education teachers; and providing parents and families of special education students with more information. The WDE will lead the collective effort to implement each strategy along with any additional responsible parties. The WDE will leverage its financial, human, and social capital resources to accomplish the milestones established for each strategy effectively and efficiently.
Additionally, methods to continuously monitor and provide support to districts that choose to implement the strategies are included. Monitoring methods include the collection of data appropriate for the strategy, such as surveys. These data will be reviewed on a regular basis by the WDE to inform
39
the support needed by districts. The WDE will provide individualized support to districts in a timely manner and may include plan development, technical assistance, or program development. If needed, the WDE will coordinate with partners to meet district needs.
The WDE is committed to ensuring every student in a Wyoming public school is taught by a highly qualified teacher, and recognizes the significant impact that inequity can have on student achievement, especially among low income and minority students as compared to their counterparts. Further, the WDE
understands the impact that teacher turnover can have on student achievement. Consequently, the WDE is confident that this equity plan will ensure every Wyoming student is taught by an experienced, highly qualified teacher.
40
REFERENCES Professional Teaching Standards Board. (n.d.). General Regulations. Retrieved from http://ptsb.state.wy.us/LinkClick.aspx?fileticket=tnl4cCT2dqg%3d&tabid=253
Ronfeldt, M., Loeb, S., Wyckoff, J. (2013). How teacher turnover harms student achievement. American Educational Research Journal, 50(1), 4-36.
U.S. Department of Education. (2005). Part A – Improving Basic Programs Operated by Local Educational Agencies, Subpart 1 – Basic Program Requirements. Retrieved from http://www2.ed.gov/policy/elsec/leg/esea02/pg2.html
U.S. Department of Education. (2014). Educator Equity Profile – Wyoming. Retrieved from http://www2.ed.gov/programs/titleiparta/equitable/wyeep.pdf
U.S. Department of Education. (2015). State Plans to Ensure Equitable Access to Excellent Educators: Frequently Asked Questions. Retrieved from http://www2.ed.gov/programs/titleiparta/equitable/eafaq2015.pdf
Wyoming Education Code of 1969, Wyo. Stat. § 21-2-102 (2014). Retrieved from http://legisweb.state.wy.us/statutes/statutes.aspx?file=titles/Title21/Title21.htm
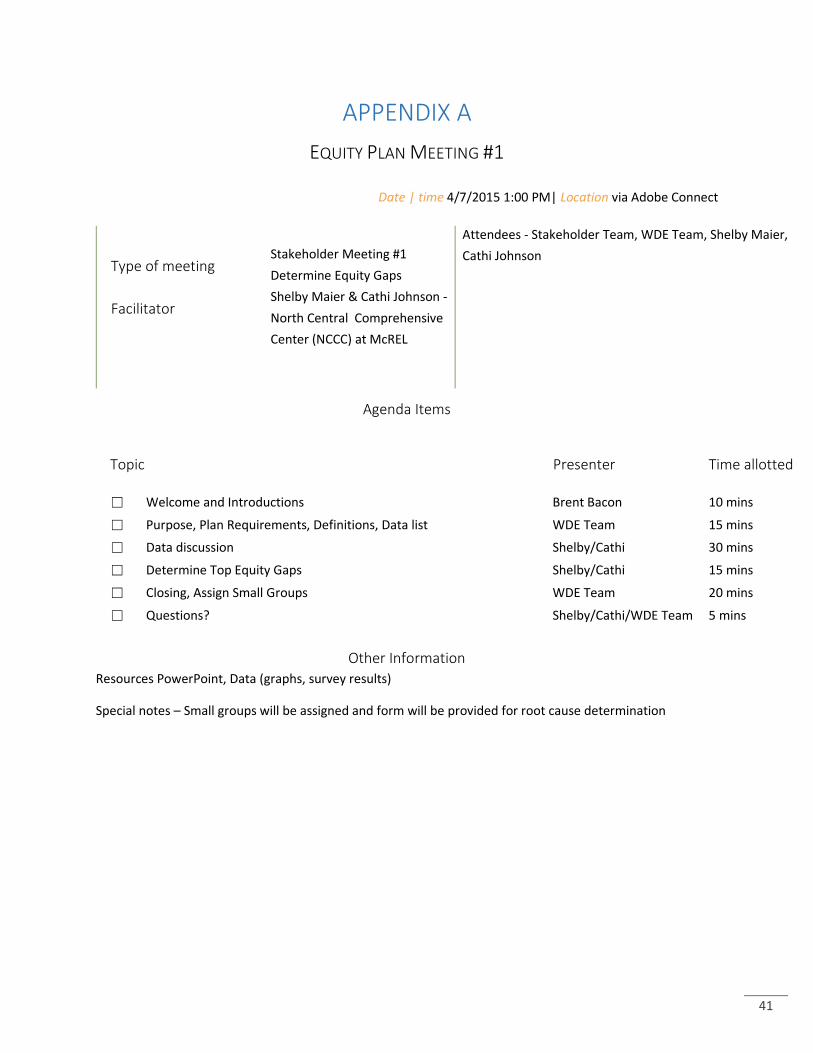
Date | time 4/7/2015 1:00 PM| Location via Adobe Connect
Type of meeting Stakeholder Meeting #1 Determine Equity Gaps
Facilitator Shelby Maier & Cathi Johnson - North Central Comprehensive Center (NCCC) at McREL
Attendees - Stakeholder Team, WDE Team, Shelby Maier, Cathi Johnson
Agenda Items
Topic Presenter Time allotted
☐ Welcome and Introductions Brent Bacon 10 mins
☐ Purpose, Plan Requirements, Definitions, Data list WDE Team 15 mins
☐ Data discussion Shelby/Cathi 30 mins
☐ Determine Top Equity Gaps Shelby/Cathi 15 mins
☐ Closing, Assign Small Groups WDE Team 20 mins
☐ Questions? Shelby/Cathi/WDE Team 5 mins
Other Information Resources PowerPoint, Data (graphs, survey results)
Special notes – Small groups will be assigned and form will be provided for root cause determination
42
EQUITY PLAN MEETING #2
Date | time 4/15/2015 1:00 PM| Location via Adobe Connect
Type of meeting Stakeholder Meeting #2 Identify Root Causes
Facilitator Jona Fletcher & Scott Bullock - Wyoming Department of Education Shelby Maier & Cathi Johnson - North Central Comprehensive Center (NCCC) at McREL
Attendees - Stakeholder Team, WDE Team, NCCC Team
Agenda Items
Topic Presenter Time allotted
☐ Welcome and WDE Updates Jona and Scott 15 mins
☐ Review Additional Data Shelby 10 mins
☐ Overview of Root Cause Analysis Cathi 15 mins
☐ Root Cause Analyses for Equity Gaps Shelby 75 mins
☐ Next Steps and Questions Jona/Scott/Shelby/Cathi 5 mins
Other Information Resources: PowerPoint, Data (graphs)
43
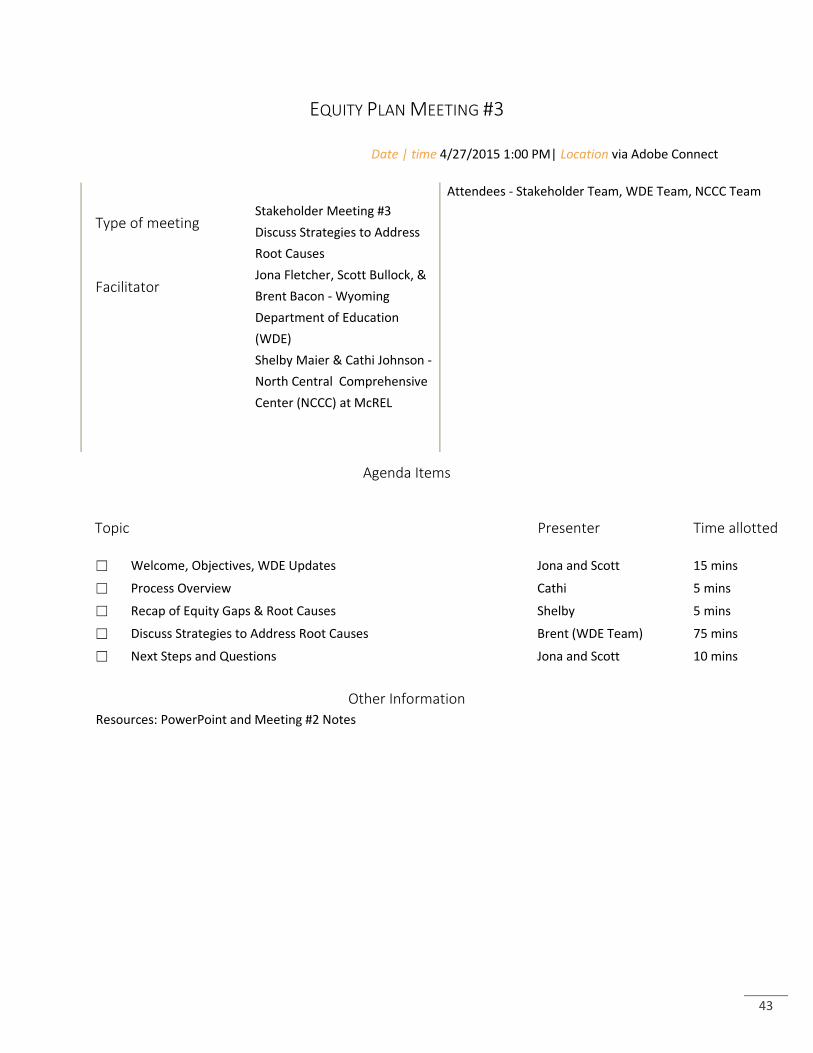
EQUITY PLAN MEETING #3
Date | time 4/27/2015 1:00 PM| Location via Adobe Connect
Type of meeting Stakeholder Meeting #3 Discuss Strategies to Address Root Causes
Facilitator Jona Fletcher, Scott Bullock, & Brent Bacon - Wyoming Department of Education (WDE) Shelby Maier & Cathi Johnson - North Central Comprehensive Center (NCCC) at McREL
Attendees - Stakeholder Team, WDE Team, NCCC Team
Agenda Items
Topic Presenter Time allotted
☐ Welcome, Objectives, WDE Updates Jona and Scott 15 mins
☐ Process Overview Cathi 5 mins
☐ Recap of Equity Gaps & Root Causes Shelby 5 mins
☐ Discuss Strategies to Address Root Causes Brent (WDE Team) 75 mins
☐ Next Steps and Questions Jona and Scott 10 mins
Other Information Resources: PowerPoint and Meeting #2 Notes
44
EQUITY PLAN MEETING #4
Date | time 5/19/2015 2:00 PM| Location via Adobe Connect
Type of meeting Stakeholder Meeting #4 Gather Equity Plan Feedback
Facilitator Jona Fletcher- Wyoming Department of Education (WDE) Shelby Maier - North Central Comprehensive Center (NCCC) at McREL
Attendees - Stakeholder Team, WDE Team, NCCC Team
Agenda Items
Topic Presenter Time allotted
☐ Welcome & Objectives Jona 5 mins
☐ Review of Equity Gaps, Root Causes, & Strategies Shelby 10 mins
☐ Gather Feedback on Wyoming Equity Plan Jona/Shelby 40 mins
☐ Next Steps and Appreciation Jona 5 mins
Other Information Resources: Drafted Sections of Wyoming Equity Plan, PowerPoint slides