2016-17-1 Wyoming School Library Survey 2016-17 Summary: K-12 public school libraries September 2017 Annually, the Wyoming State Library conducts a voluntary survey of school libraries to collect basic information on staffing, budgets, student use of the library and other measures. The response rate for this year’s survey was lower than in 2015-16. Part of the decline may be because of budget and staffing cuts that have left many school libraries without certified librarians. In staffing, this year the report includes those FTEs designated as Computer/Network -- Library-Media Technician (CNT) by the Wyoming Department of Education, as those FTEs are reported as library FTEs in the Common Core of Data. Staffing data is obtained from the WDE rather than reported by schools for consistency. Collecting instructional time continues to be a challenge, as the data provided is often inconsistent with the amount of library media specialist staffing reported by the Wyoming Department of Education. This year, the question on planning time was dropped and the question on instructional time was clarified to define it as formal teaching time. A large body of research has shown that a strong school library program – with sufficient staffing, collections and budget – is associated with higher student test scores. Much of that research, conducted in more than 20 states, has been compiled by Library Research Service on their website at https://www.lrs.org/data-tools/school-libraries/impact- studies/. Research shows that higher test scores correlate with: 1. The size of the school library staff 2. Full-time/certified school librarians 3. The frequency of library-centered instruction and collaborative instruction between school librarians and teachers 4. Size or currency of library collections 5. Licensed databases through a school library network 6. Flexible scheduling 7. School library spending (Lance, et al., 2001; Baxter & Smalley, 2003). This report gives summary data by grade level. Individual school details and prior years’ surveys are located on the Wyoming State Library’s statistics page at http://library.wyo.gov/services/ldo/stats/. Questions about this survey may be directed to: Wyoming State Library Paige Bredenkamp, School Library Consultant [email protected]307-777-6331 or 1-800-264-1281
Transcript
2016-17-1
Wyoming School Library Survey 2016-17 Summary: K-12 public school libraries September 2017
Annually, the Wyoming State Library conducts a voluntary survey of school libraries to collect basic information on staffing, budgets, student use of the library and other measures. The response rate for this year’s survey was lower than in 2015-16. Part of the decline may be because of budget and staffing cuts that have left many school libraries without certified librarians. In staffing, this year the report includes those FTEs designated as Computer/Network -- Library-Media Technician (CNT) by the Wyoming Department of Education, as those FTEs are reported as library FTEs in the Common Core of Data. Staffing data is obtained from the WDE rather than reported by schools for consistency. Collecting instructional time continues to be a challenge, as the data provided is often inconsistent with the amount of library media specialist staffing reported by the Wyoming Department of Education. This year, the question on planning time was dropped and the question on instructional time was clarified to define it as formal teaching time. A large body of research has shown that a strong school library program – with sufficient staffing, collections and budget – is associated with higher student test scores. Much of that research, conducted in more than 20 states, has been
compiled by Library Research Service on their website at https://www.lrs.org/data-tools/school-libraries/impact-studies/. Research shows that higher test scores correlate with:
1. The size of the school library staff 2. Full-time/certified school librarians 3. The frequency of library-centered instruction and
collaborative instruction between school librarians and teachers
4. Size or currency of library collections 5. Licensed databases through a school library network 6. Flexible scheduling 7. School library spending (Lance, et al., 2001; Baxter &
Smalley, 2003). This report gives summary data by grade level. Individual school details and prior years’ surveys are located on the Wyoming State Library’s statistics page at http://library.wyo.gov/services/ldo/stats/. Questions about this survey may be directed to:
Wyoming State Library Paige Bredenkamp, School Library Consultant
WDE K-12 schools with LIM and/or LMA staffing, by State School ID
Schools with LIM/LMA staffing 284
LIM/LMA schools reporting data 100
Response rate 35.2%
WDE K-12 schools with LIM staffing, by State School ID
Schools with LIM staffing 109
LIM schools reporting data 76
Response rate 69.7%
LIM: Library Media Specialist
LMA: Library Media Aide
WDE K-12 schools by building
School buildings reporting data 115
Response rate by building cannot be calculated, as it is not known how many non-responding schools are actually combined schools.
The Wyoming Department of Education assigns each school a separate State School ID. In 2016-17, the WDE listed 359 public K-12 schools. In some cases, a single school building houses multiple schools. For example, a K-12 school may have three separate School
2016-17-3
ID numbers for the elementary, middle and high schools, yet still be one unified school. This complicates calculating a response rate, as it is not known how many non-responding schools are co-located. For this reason, response rates are calculated by ID number. Going by State School ID, 124 schools with libraries responded in part or in full to this year’s survey. Adjusting for co-located schools, these 124 schools have 115 libraries. Out of 359 schools, 284 (79.1%) have designated LIM or LMA FTEs. Schools with Library Media Specialist (LIM) FTEs declined from 159 last year to 109 this year. Less than half of all schools (30.4%) are assigned LIM FTEs. This is by WDE ID number, and not by building, so students in co-located schools or in districts with LIM staffing assigned at the district level may still have access to a Library Media Specialist. However, it should also be noted that in many schools, the LIM hours assigned are minimal. One of the challenges of this survey is that the respondents can vary from year to year. Although there is some discussion of trends in this report, please note that changes may simply be due to using a different survey sample.
Participating school libraries
Enrollment
Type of school Total Average Median
Senior high (9-12) [22 resp.] 12,223 556 317
Junior/senior high (6-12) [5 resp.] 627 125 114
K-12 [7 resp.] 1,235 176 140
Junior high/middle (5-9) [21 resp.] 8,843 421 395
K-8 & K-9 [3 resp.] 1,329 443 443
Elementary (K-6) [57 resp.] 16,125 283 289
Total [115 resp.] 40,382 334 303
The 115 school libraries that responded serve 40,382 students – 43% of the state’s entire Oct. 1, 2016 K-12 enrollment of 93,261.
2016-17-4
Staffing
Main contact holds library/media endorsement Total Library Staff Library Media Specialists
FTE data obtained from the Wyoming Dept. of Education. LIM = Library Media Specialist, LMA = Library Media Aide
Among respondents, 76 (66.1%) report that the main contact holds a library media endorsement, slightly up from last year’s 64.4%, although that could be due to the fact this is a different group of respondents. According to the WDE data, in 51 of the 115 responding libraries (44%), there is library media aide staffing, but no assigned library media specialist FTEs, although some of those schools have access to LIM staffing at the district level. As noted above, in some schools where there is LIM staffing assigned, it is minimal. WDE data are used here because they are the most comprehensive and consistent data. Individual schools have staffing arrangements for their libraries that are not accurately reflected in these numbers.
Out of 115 respondents, 100 provided total collection expenditure data, and 96 provided data specifically on print purchases. On average, schools spent $15.72 per student on print materials, up slightly from last year’s $14.29. Total collection spending was $21.34 per student, up from last year’s $17.94. This could be attributed to a different response pool, as well as more spending on electronic resources. It is not certain whether budgetary pressures are affecting collection quality and currency or whether other factors are involved. Since the schools responding are not consistent year to year in this survey, it may simply be a different sample. If schools are moving to more electronic resources, it is possible that those are purchased at the district level and do not show up in school-level collection budgets. More than half of libraries reported that their collections are completely funded by their school or district and that they do not rely on outside fundraising. Of the respondents, 30% report that they supplement their budgets, while 5.5% reported that they are heavily dependent on grants or other fundraising to maintain their collections, all at the elementary level.
Total [115 resp.] 1,197,654 14,071 35.1 220 15 2000 16
Reporting schools held 1.2 million print items during the 2016-17 school year. The median for all schools was 35 items per student. Libraries were asked for the average copyright date for items in the Dewey 600s (Technology & Applied Science) range. This range was chosen because the science and technology fields change rapidly. The median date was 2000, or 16 years old at the time of the survey. A 2000 science book would miss many recent developments. Currency of materials is one factor that has been associated with higher test scores, but it is also difficult to assess in an increasingly electronic environment. Anecdotal information indicates that nonfiction research is moving from print to electronic sources, particularly in the upper grades. In addition, it doesn’t account for items with older copyright dates that are still valuable and should be retained.
2016-17-7
Library computers
Student computers in library Schools where
each student issued laptop or
tablet Type of school Number
Average computers per library
Average students per
computer
Senior high (9-12) [22 resp.] 460 22.0 32.6 36.4%
Junior/senior high (6-12) [5 resp.] 78 16.0 11.7 60.0%
Survey respondents reported a total of 1,623 student computer workstations in their libraries. This is an average of 19.3 computers per library and 30.6 students per computer. For the second year, schools were asked whether each student was issued a laptop or tablet. Last year 24% reported yes; this year 31.4% (33 schools) did. This is a data element to watch now that Wyoming is a Future Ready State.
Total [115 resp.] 35.5% 95.3% 63.8% 49.5% 70.4% 50.0% 54.8%
NUMBER OF SCHOOLS 38 101 67 49 69 47 40
Nearly every school has a website: 95% of libraries reported their school has one, and two-thirds report having a library-specific web page. More libraries link to the GoWYLD resources (70%) than to WYLDCAT (49%). Every student in Wyoming has access both at school and remotely to the GoWYLD databases. Half of respondents said electronic resources are also purchased locally through the school or district budget: 55% of those schools with locally-purchased databases have remote access to those resources for students. Slightly more than one-third of schools reported loaning laptops, which is consistent with last year. About 36% of schools reported loaning laptops, an increase from last year’s 34%.
2016-17-9
Scheduling and instruction
How are classes in the school library scheduled? Average typical weekly
instructional hours Type of school
All flexibly scheduled
Mixed flex/fixed
All at fixed times
Senior high (9-12) [22 resp.] 90.5% 9.5% 0.0% 6.65
Junior/senior high (6-12) [5 resp.] 50% 50% 0.0% 3.50
One of the items noted as having a positive correlation on test scores is flexible scheduling. None of the responding senior high schools or junior/senior high school had all their classes scheduled at fixed time. Fixed scheduling is more often used at the lower grades with 88.2% of K-6 schools having all their classes at fixed times, a slight decrease from last year (89.3%). Student learning is greatly enhanced by instruction from a qualified teacher-librarian. “Average weekly instructional hours” is a data element that attempts to discern how much staff time is spent teaching formal instruction. This is a difficult data element to collect, as it is often misinterpreted. However, it is an important enough measure that it has been retained for the survey.
2016-17-10
Professional environment
Training outside the district is supported
On what committees do library staff participate? Library advisory committees
Three-quarters of libraries (75%) reported they have support for staff to attend training opportunities outside their district, up from last year’s 69%. School librarians continue to play a role on technology committees with just over half of library staff reporting participation. Few schools reported having library advisory committees: 18.7% have faculty/administration advisory committees, but 11% have student advisory committees. The percentage with faculty committees is consistent with last year’s survey, but the student advisory committees show an increase with this year’s respondents.
2016-17-11
Policies
% of schools that have % of libraries that have policies for
Total [115 resp.] 81.2% 57.7% 96.2% 87.0% 91.0% 80.8% 80.2%
NUMBER OF SCHOOLS 82 56 100 87 91 80 81
Policies and procedures allow the library media center to operate effectively and to help library staff deal with different situations that may arise. More than three-fourths of libraries surveyed indicated they have a library policies and procedures manual, and more than half of respondents have regularly scheduled policy review and revision. This proportion is up from last year. More schools reported having an Internet/network acceptable use policy than last year: 96%. Of the respondents 91% reported having policies for challenges to holdings, 87% have collection development policies, 81% have copyright policies and 80% have policies for resource sharing and interlibrary loan. All of these percentages have increased since the 2015-16 survey, but it is difficult to determine whether more schools are instituting formal policies or whether this is because the respondents varied from last year.
Total [115 resp.] 4,934 14.8 16.3 255.3 156.9 405.1 1.4
TOTAL USE 545,308 1,702 28,952 17,609 46,798
Full-year circulation can only be estimated for any survey that ends before the school year does, so the Wyoming School Library Survey uses 1st semester circulation instead. The median for all schools was 14.8. Not surprisingly, circulation figures were generally higher where schools served lower grade levels. Anecdotally, there seems to be a preference for electronic materials at the higher grade levels. Library media centers see an average of 16.3 classroom sessions a week. More than half of total student visits are in classroom sessions, rather than students working independently. Total visits reported were 46,798 with a median of 1.4 visits per student per week.
2016-17-13
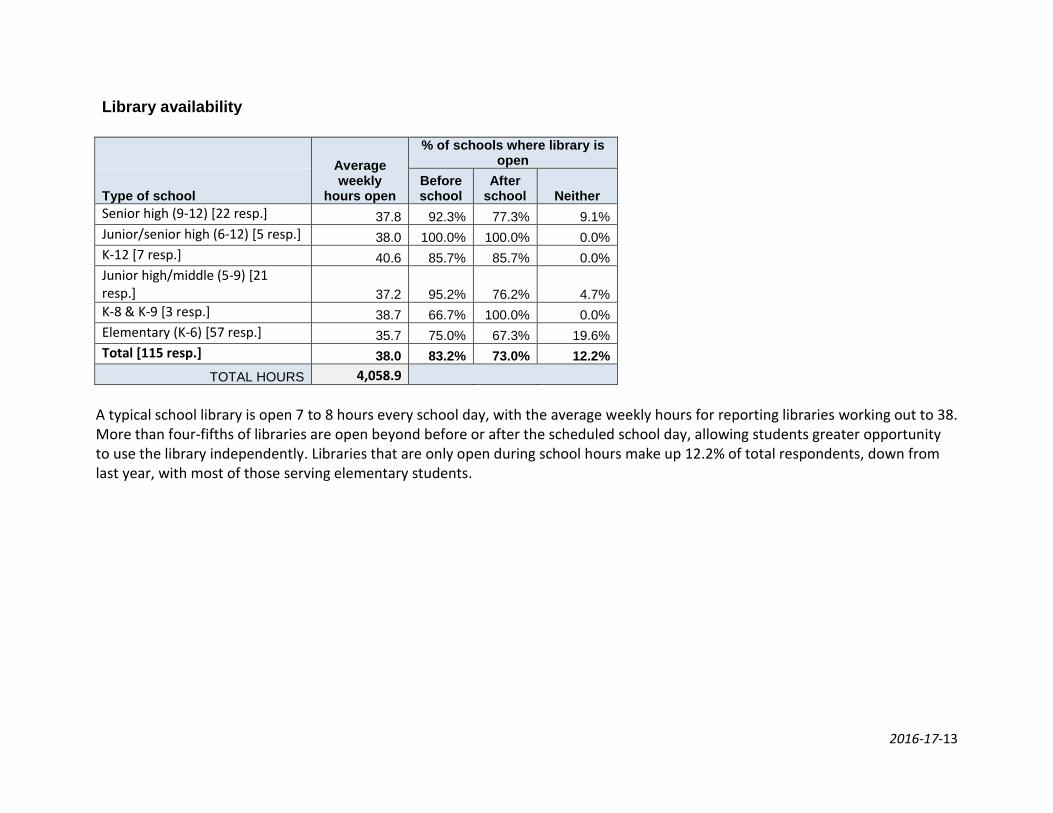
Library availability
Average weekly
hours open
% of schools where library is open
Type of school Before school
After school Neither
Senior high (9-12) [22 resp.] 37.8 92.3% 77.3% 9.1%
Junior/senior high (6-12) [5 resp.] 38.0 100.0% 100.0% 0.0%
A typical school library is open 7 to 8 hours every school day, with the average weekly hours for reporting libraries working out to 38. More than four-fifths of libraries are open beyond before or after the scheduled school day, allowing students greater opportunity to use the library independently. Libraries that are only open during school hours make up 12.2% of total respondents, down from last year, with most of those serving elementary students.
2016-17-14
Notes on the data Additional data sources Enrollment and staffing numbers are obtained from the Wyoming Dept. of Education (WDE). Although schools can indicate that they serve Pre-K students, only students in K-12 are counted in the enrollment figures. Circulation data for schools participating in the WYLD system is available to the Wyoming State Library. Where WYLD-participating schools responded to the survey but did not provide circulation numbers, those were pulled from the automated system. Imputations In some cases it is necessary to impute data – to estimate a number when the real number is uncertain or unknown. Data that has been imputed is shaded in the spreadsheet. Where possible, schools were contacted to confirm information. Non-responses have been indicated as No Answer. Actual numbers of schools reporting for each data element are indicated at the beginning of the tables. Among the rules were used to impute data are these:
Where a range of numbers was given (e.g. 18-20), the midpoint is used as that data element.
Dollar amounts are rounded to nearest dollar.
Where line items were provided, but not the total, the line items were summed for the total.
Where an estimated amount was given, that number is used.
Where print budget and total budget matched, and non-print budget was not reported, non-print was imputed to zero (0).
Where symbols such as >, <, + were used with a number (e.g. 40+ hours), the symbol has been deleted and the number used.
Calculated fields Where some libraries did not respond to a specific question, averages, percentages and totals were based only on responding libraries.


![David Anton University of Wyoming. Definitions High School to UW High School [students with AP Calculus credit] to UW Wyoming Community Colleges.](https://static.documents.pub/doc/80x56/56649c525503460f948fb5ec/david-anton-university-of-wyoming-definitions-high-school-to-uw.jpg)