Page 1
64
X
Financial Market
1. An Overview
In August 2007, the reverberations of the US sub-prime mortgage and credit crisis
have been felt across the global equity markets as market participants turned risk averse and
there has been flight to safety leading to huge volatility. FIIs have been net sellers on the
domestic stock exchanges on most of the trading sessions of the month leading to bearish
sentiments, but due to the net purchase positions of domestic financial institutions, the market
has remained positive. Yet, the market has been expecting a correction, as the rally in the
stock markets in July had been rather rapid defying the emerging weaknesses in the export
and manufacturing sectors. Moreover, though the domestic inflation rate remained subdued,
international crude oil prices continued to surge cautioning the market sentiments. Following
the RBI imposing restriction on the ECB borrowings, the rupee depreciated much to the relief
of exporters. Also, the surprise US FED rate cut has turned the markets buoyant, as a measure
to avert the emerging liquidity crisis in US. The political uncertainty arising out of the
proposed nuclear deal with the USA did have some bearish effects on the market but rather
for a short period. With the quarterly GDP figures exhibiting sustained growth momentum,
the markets again surged ahead.
In the short-term money market, call rates have reverted to rule within the informal
corridor set by reverse repo and repo rates. Despite the hike in CRR rates, the consequent
surge in interest rates has been contained as the Finance Minister urged the banks to hold the
rates steady. In the commodities market, the turnover continued to surge but lower than that
in the pervious year. In the forex market, the rupee rate vis-à-vis the US dollar depreciated in
response to the RBI placing limits on ECB borrowings and deepening US sub-prime
mortgages crisis evoking risk averse behaviour among international investors towards
emerging markets.
Page 2
65
2. Trends in the Equity Market
i) Primary Issues
The volatility in the
stock market appears to have
affected public issue mop-ups
in August. The companies have
mobilised only about Rs 1,877
crore from IPOs and follow-on
public offerings (FPOs) during
August, a drop of almost 82
per cent from the July level,
but above the year’s low seen in May. There have been five IPOs during the month— Take
Solutions, KPR Mill, Motilal Oswal Financial Services, Indowind Energy and Magnum
Ventures were issued through book building process — while the month’s sole FPO by
Dagger Forst Tools raised Rs 16.23 crore from the market.
Real Estate Company, Puravankara Projects, has extended its initial public offering
subscription period from August 3 to August 8 and reduced its price band from Rs 500- 525
to Rs 400-450 a share. The offer opened on July 31. The director of the company said that the
decision was taken in view of the volatility of the global and Indian markets and, with due
respect to investor sentiment, who expressed a deep desire to invest in their company but also
pointed out the market condition. Apparently, poor response has forced the company to
extend the IPO. Total bids received were 76,26,010 and those at cut-off price were 30,33,200.
However, this is not the first time that IPOs had to cut price and extend the offer period.
When the market was witnessing adverse conditions in May-June 2006, issues such as Air
Deccan, Abhishek Mills, Bluplast and Vigneshwara Exports were also forced to resort to
similar measures.
On August 31, lack of interest from retail investors had forced IT People (India), a
provider of manpower to IT and BPO industry, to withdraw its ongoing FPO, resulted in its
stocks plunging by 9.88 per cent to Rs 31 on the BSE. The company said that while the FPO
had received favourable response from Qualified Institutional Buyers (QIBs) and High
Networth Individuals (HNIs), the absence of adequate interest from retail investors (in spite
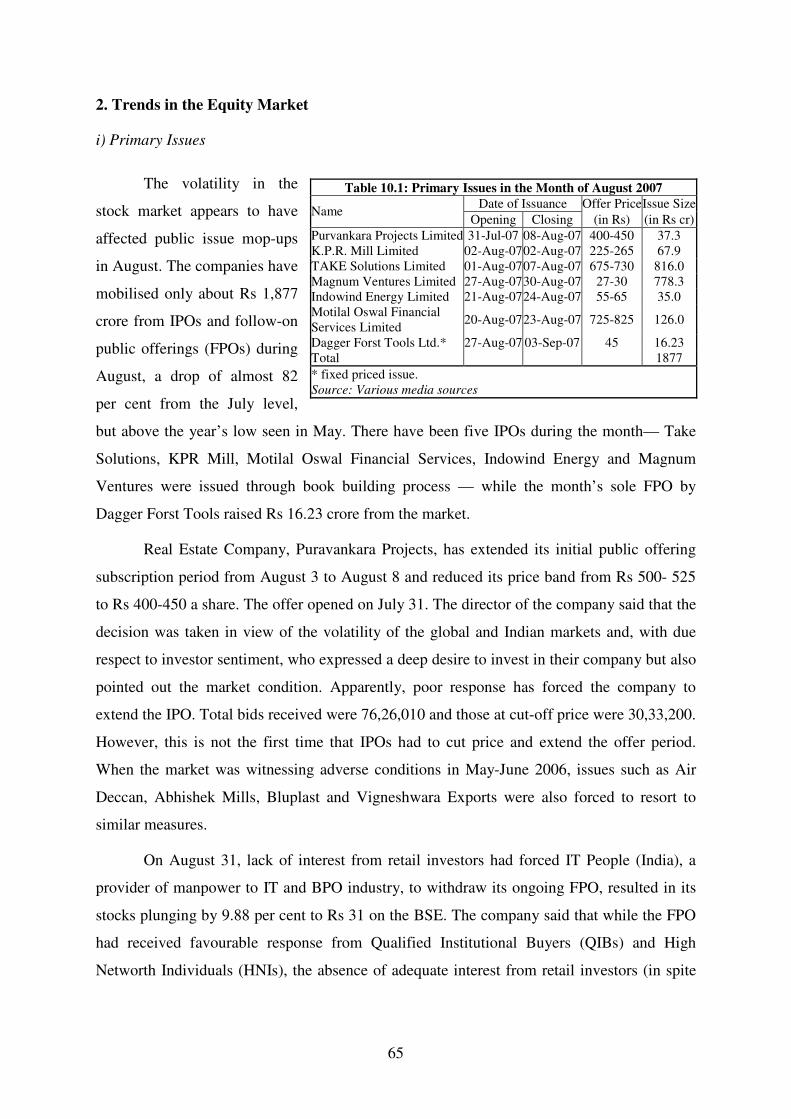
Table 10.1: Primary Issues in the Month of August 2007
Date of Issuance Offer Price Issue Size Name
Opening Closing (in Rs) (in Rs cr)
Purvankara Projects Limited 31-Jul-07 08-Aug-07 400-450 37.3 K.P.R. Mill Limited 02-Aug-07 02-Aug-07 225-265 67.9 TAKE Solutions Limited 01-Aug-07 07-Aug-07 675-730 816.0 Magnum Ventures Limited 27-Aug-07 30-Aug-07 27-30 778.3 Indowind Energy Limited 21-Aug-07 24-Aug-07 55-65 35.0 Motilal Oswal Financial Services Limited
20-Aug-07 23-Aug-07 725-825 126.0
Dagger Forst Tools Ltd.* 27-Aug-07 03-Sep-07 45 16.23 Total 1877
* fixed priced issue. Source: Various media sources
Page 3
66
of the issue being completely underwritten by the Book Running Lead Managers) led the
company to withdraw its issue.
There has been a rise of 140 per cent in the
resource mobilisation during April-July 2007 over the
corresponding period in the previous financial year.
During April-July 2007, the largest resource mobilisation
has been by cement and construction sector (Rs 13,466
crore) and banks/financial institutions (Rs 10,879 crore).
New share listings in August have borne the brunt
of the market turmoil with five of the 14 companies debuting at a discount to the issue price.
Market experts say that perception about the pricing and the subscription garnered are two
important factors that influence the performance of an issue on listing day and thereafter.
Most issues including IVR Prime Urban, Alpa Laboratories, KPR Mills and Puravankara
Projects that listed at a discount are trading in red territory. Only SEL Manufacturing
Company has managed to lift itself up after a weak opening.
The Securities and Exchange Board of India (Sebi) has put equity float by large-cap
companies on the fast track. A new scheme called the ‘fast track share issuance programme’
says companies with a three-year listing track record on the National Stock Exchange and the
Bombay Stock Exchange, and with free-float market capitalisation of at least Rs 10,000
crore, can raise funds through rights and follow-on issues, without having to wait for the
regulator’s clearance. There are only 35 companies listed on the BSE and NSE having a free
float market cap of Rs 10,000 crore or above. The list includes Reliance Industries, ICICI
Bank, Infosys Technologies, Larsen & Toubro, Bharti Airtel, HDFC, ITC, Reliance Capital,
among others.
ii) Secondary Market
The secondary market has witnessed huge volatility as a number of factors such as the
international factors: weaknesses in US sub-prime mortgages spreading across different parts
of the world, FIIs turning aggressive net sellers as they turned risk averse and surging
international crude oil prices and domestic factors: emerging threat to political stability over
the nuclear deal issue. Besides, the market remained concerned about the possible margin
calls in the wake of volatile movements in prices. However, the subdued inflation, good
Table 10.2: Resources Raised through Public and Rights Issues
April-July
2007 April-July
2006
No Amount
(Rs crore)No
Amount (Rs crore)
Public Issues 35 27225 15 11261 IPOs 33 16636 11 10553 FPOs 2 10589 4 708 Rights Issues 3 342 12 219 Total 38 27567 27 11480
Source: Sebi Bulletin, August 2007
Page 4
67
prospects of corporate earnings, depreciation of the rupee domestic financial institutions
remaining net buyers and good first quarter GDP results contributed to the positive
sentiments.
After the government curtailed overseas borrowings by companies, Finance Minister
Shri P Chidambaram, said there were no plans to regulate participatory notes. One of the
purposes is to moderate the inflow of capital and the claim that the curbs will hurt
investments is exaggerated, he said. The notes, which are typically derivatives that change in
value depending on the performance of the underlying securities, allow hedge funds to invest
in the country without having to register with the stock market regulator.
The total turnover on BSE declined sharply to Rs 1,06,042 crore from Rs 1,25,041
crore in July for all securities, yet the total market capitalisation increased to Rs 45,38,006
crore from Rs 45,29,772 crore due to increase in market capitalisation of S group, T group
and Z group shares. Similarly, the total equity turnover on NSE has dipped to Rs 2,31,241
crore from Rs 2,67,227 crore in July.
As per Sebi bulletin, in July 2007, the daily average volatility was the highest for the
BSE metal index (1.94 per cent), followed by capital goods index (1.92 per cent), CNX IT
index (1.36 per cent) and BSE Oil and Gas (1.31 per cent). The highest volatility in current
financial year so far until July was recorded for Bank Nifty index (1.66 per cent), BSE Metal
index (1.64 per cent), BSE Bankex index (1.52 per cent) and BSE capital goods index (1.49
per cent). Among the international indices, highest daily volatility has been was recorded for
South Korea Kospi (1.55 per cent), Thailand SET index and germany Dax index. On an
annualised basis, volatility has been the hightest for S&P CNX nifty (11.9 per cent) & BSE
sensex (10.3 per cent)
The Securities and Exchange Board of India chairman, M Damodaran, has stated that
subprime crisis was not the only reason for the market volatility and also ruled out any
separate regulation for hedge funds. Damodaran has stated that there exists no single category
as hedge funds and Sebi would prefer them to enter the Indian markets directly rather than
through some offshore derivatives. Further, he stated that registration of hedge funds with the
Sebi, as in the case of foreign institutional investors, was enough. He pointed out that the
Sebi was not worried about the large number of players coming into India because their entry
presupposes the constant returns being offered by the Indian markets besides a sound market
regulatory mechanism. He also mentioned the Sebi would soon issue guidelines for setting up
Page 5
68
a self-regulatory organisation (SRO) for investment advisers comprising representatives of all
sections including brokers and print and electronic media.
Despite rising interest rates and appreciating rupee, capital investments by Indian
companies in the current fiscal could exceed last year’s level, according to a study by the
Reserve Bank of India. Indian corporates expect to spend Rs 1,48,207 crore in capital
expenditure in the current fiscal in projects already appraised and sanctioned by banks and
financial institutions. This is against the total investments of Rs 2,06,460 crore in 2006-07.
Transmission of Securities
A SEBI-appointed group studying the issues relating to difficulties faced by investors,
while dealing with transmissions of securities in physical and dematerialised mode, has
recommended a threshold limit up to which the listed companies would require only an
Affidavit, Deed of Indemnity and No Objection Certificate from other legal heirs. Standard
format of these documents have also been recommended. The threshold limit should be fixed
at holding of 200 shares or Rs 1 lakh in value, whichever is higher. Also, the prescribed
threshold limit shall be the basic minimum limit to be adhered to by all the listed companies.
The companies having higher threshold shall continue to do so, and also can set liberal
threshold.
CBDT Clarifications
The Central Board of Direct Taxes (CBDT) has clarified that lending and borrowing
of shares for short selling in equities will not attract capital gains tax. With this clarification
one of the important hurdles in the way of permitting short selling on the stock exchanges has
been cleared. According to the sources, the short selling of securities will also not attract
securities transaction tax (STT) as is prevalent in case of physical sale and purchase of equity
shares. This is because securities offered under lending and borrowing does not amount to
transfer of shares and hence it is exempt from capital gains tax. Short selling is backed by a
scheme of lending and borrowing of shares which will help in settlement of transactions
through physical delivery. This is otherwise known as covered short sale.
Observations from RBI Annual Report
The RBI Annual Report, stated that further deterioration in sub-prime delinquencies
could lead to reassessment of risk by investors across products and markets and retrenchment
of capital from the emerging market economies (EMEs), given the contagion and herd
mentality. As a growing number of hedge funds invest in the country, the capital inflow can
Page 6
69
be volatile, given the nature of the funds. Private equity funds, another major source of
capital for EMEs, are sensitive to interest changes. Therefore, any monetary tightening in the
major economies could lead to a slowdown of investment from private equity funds, the RBI
pointed out. Further, the report stated that while its monetary policy stance would continue to
be that of maintaining price stability and anchoring inflation expectations, in this context,
financial stability would assume greater importance in the months to come.
Trading at HSE
Trading at Hyderabad Stock Exchange (HSE) came to a halt for the second
consecutive day on August 30 as it is now de-recognised as per the Securities Contracts
Regulations 2006 notified by Sebi. The 64-year-old HSE was required to complete the
demutualisation scheme on or before August 28 and it failed to do so because of lack of
response from investors to its offloading of 51 per cent of outstanding share capital.
According to HSE officials the exchange had not received any formal communication from
Sebi on its status. But as per the Act, HSE was automatically deregistered from August 29
and Sebi is not required to communicate the same immediately.
IIISS 2007 Findings
Invest India Income and Savings Survey 2007 produced by IIMS Dataworks suggests
that just around 15 per cent of the country’s equity investors are speculators, entering and
exiting the market several times during a year. Almost 75 per cent of them have been there
since 2003, that is, they have ridden out many ups and downs in the past. And around a sixth
of the investment made by individuals directly in the country’s stock markets is made by
individuals who earn under Rs 20,000 a month- a twentieth is invested by those earning less
than Rs 8,000 a month.
Apart from giving valuable insights into the investment habits of investors, the
findings are especially relevant in the context of the plethora of stories that talk of the small
investor losing thousands of crore each time the market crashes. According to the survey,
there are at present a little over 7.2 million individuals in India with equity market positions.
Over half of them have only mutual fund investments’ in either balanced or mainly equity
funds. Nearly two million have equity positions only, and the rest have investments in mutual
funds as well as directly in the market. At the time of the survey, around four months ago, the
aggregate financial savings and investment portfolio of these 7.2 million investors stood at
roughly Rs 400,000 crore while their aggregate equity portfolio value stood at Rs120,000
Page 7
70
crore (29.7 per cent of their total portfolios). In other words, around 2 per cent to 3 per cent of
the total market capitalisation is held by small investors, while promoters hold around 50 per
cent to 60 per cent of outstanding shares, FIIs hold another 15 per cent to 20 per cent,
banks/mutual funds/insurance firms hold the rest. . IIMS Dataworks’ survey asked questions
about why investors entered the market and those classified as speculators answered in the
affirmative to questions such as ‘I don’t want to miss out on a boom, ‘I like to speculate’, and
so on. Collectively, the equity portfolio of the speculator group is around Rs 26,000 crore,
according to the survey.
NSDL to act as CRA
The Sebi has put several eligibility conditions for National Securities Depository Ltd
(NSDL) to act as the Central Recordkeeping Agency (CRA) for pension funds, under the new
pension scheme for central and state government employees. According to the decision,
NSDL could act as the CRA only through a separate strategic business unit (SBU). Further,
the depository will have to hive off other activities within three years to a separate entity
without any financial and legal links with NSDL. Another eligibility condition is that
NSDL’s other activity should not erode the net worth required for carrying out the NSDL’s
activity in securities. NSDL is required to get the approvals from its board and sponsor for
carrying on other activities. Sebi stipulations also require NSDL to get additional insurance
cover for risks, if any, of other activities. The depository will also have to meet other
financial conditions, if required, in the interest of beneficial owners, said sources. Earlier,
Sebi had expressed its reservations on NSDL acting as a recordkeeper for pension funds. The
regulator had stated that the new responsibility will be outside the assigned role as a
depository, and that the Depository Act prohibited such activities.
Mandatory Quarterly Investment Reports
The Securities and Exchange Board of India (Sebi) will soon make it mandatory for
international and domestic private equity (PE) and venture capital (VC) funds to submit
quarterly investment reports to the regulator. Currently, foreign and domestic venture capital
funds registered with Sebi have been voluntarily submitting quarterly investment reports to
the regulator. Market sources said foreign and domestic venture capital funds, generally, are
secretive about their investments, making it difficult for the regulator to keep a tab on their
investments in India. At present, there are about 80 foreign venture capital investors and 90
domestic venture capital funds registered with the Sebi. The reason cited for the new rules is
Page 8
71
that as a regulatory body there was a need for the maintaining reliable data on PE/VC
investments. Globally, private equities are neither regulated nor are their investments kept
track of by the regulators.
The Sebi set a cap of 10 per cent on overseas investments by venture capital funds in
India. This is part of the guidelines for venture capital funds, would be allowed only into
those foreign unlisted companies that have an Indian connection, such as companies which
have back office operations in India. Sebi said in a circular that the allocation of investment
limits would be done on a first come, first served basis, depending on the availability of the
overall limit of $500 million (Rs 2,000 crore). The VCFs can invest in equity and equity-
linked undertakings, within an overall limit of $500 million, for which they have to take Sebi
approval.
Margin Accounts of Brokers
The Securities Exchange Board of India (Sebi) has expressed reservations over the
transparency in transactions in the margin accounts of brokers. In its investigation, the Sebi
has observed that the securities maintained in these accounts are misused by brokers for
leveraging and pushing up trading volumes in particular shares. The securities under the
margin account are not earmarked client-wise and belong to brokers at any given point of
time. To curb market manipulation, the market regulator has directed the depositories to flag
off such margin accounts by asking brokers to identify accounts as their own (proprietary)
and that of the clients. Further, brokers will have to work out the volume of transactions and
furnish the data to the Sebi periodically.
Sectoral Indices
India Index Services & Products (IISL), a joint venture between NSE and CRISIL, ,
launched on August 7, 2007 a new sectoral index based on the infrastructure sector. The 25-
stock CNX Infrastructure Index includes companies belonging to the telecom, power, port,
air, roads, railways, shipping and other utility services providers. CNX Infrastructure Index
constituents represent about 21.01 per cent of the total market capitalisation as on 31 July
2007. The index is a market-capitalisation-weighted index with base date of 1 January 2004,
indexed to a base value of 1000.
BSE has revised free-float adjustment factor of four constituents of BSE Sensex. Free
float adjustment factor is used for calculating a scrip’s weightage in Sensex. The free float of
Page 9
72
a listed security is the proportion of shares available for purchase in the market by investors.
In principle, it is the part of shares not held by strategic shareholders or promoters. BSE has
raised the free-float adjustment factor of Maruti Udyog to 0.45 from 0.4. It has cut free-float
adjustment factor of Bajaj Auto to 0.65 from 0.7 and that of Hindalco to 0.7 per cent from
0.75 per cent. It has cut free float adjustment factor of Ambuja Cements to 0.65 per cent from
0.7 per cent. The revised free float factors would come into effect from 13 August 2007. In
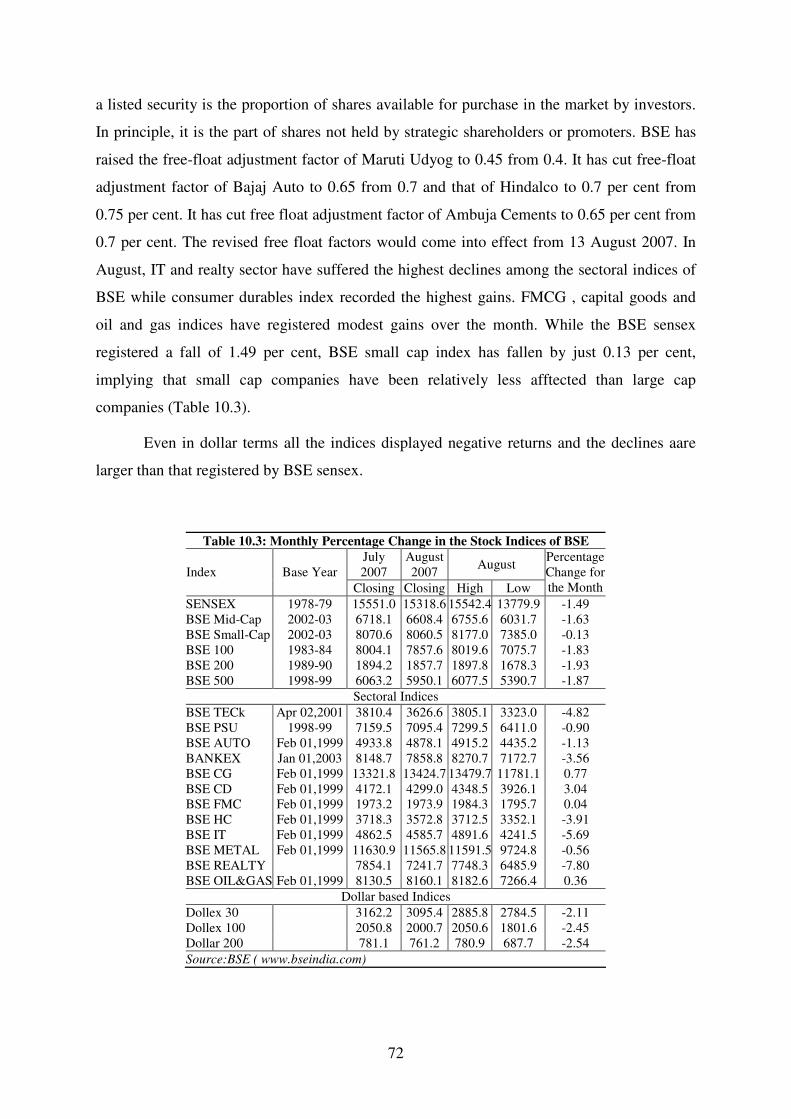
August, IT and realty sector have suffered the highest declines among the sectoral indices of
BSE while consumer durables index recorded the highest gains. FMCG , capital goods and
oil and gas indices have registered modest gains over the month. While the BSE sensex
registered a fall of 1.49 per cent, BSE small cap index has fallen by just 0.13 per cent,
implying that small cap companies have been relatively less afftected than large cap
companies (Table 10.3).
Even in dollar terms all the indices displayed negative returns and the declines aare
larger than that registered by BSE sensex.
Table 10.3: Monthly Percentage Change in the Stock Indices of BSE
July 2007
August 2007
August Index Base Year
Closing Closing High Low
Percentage Change for the Month
SENSEX 1978-79 15551.0 15318.6 15542.4 13779.9 -1.49 BSE Mid-Cap 2002-03 6718.1 6608.4 6755.6 6031.7 -1.63 BSE Small-Cap 2002-03 8070.6 8060.5 8177.0 7385.0 -0.13 BSE 100 1983-84 8004.1 7857.6 8019.6 7075.7 -1.83 BSE 200 1989-90 1894.2 1857.7 1897.8 1678.3 -1.93 BSE 500 1998-99 6063.2 5950.1 6077.5 5390.7 -1.87
Sectoral Indices
BSE TECk Apr 02,2001 3810.4 3626.6 3805.1 3323.0 -4.82 BSE PSU 1998-99 7159.5 7095.4 7299.5 6411.0 -0.90 BSE AUTO Feb 01,1999 4933.8 4878.1 4915.2 4435.2 -1.13 BANKEX Jan 01,2003 8148.7 7858.8 8270.7 7172.7 -3.56 BSE CG Feb 01,1999 13321.8 13424.7 13479.7 11781.1 0.77 BSE CD Feb 01,1999 4172.1 4299.0 4348.5 3926.1 3.04 BSE FMC Feb 01,1999 1973.2 1973.9 1984.3 1795.7 0.04 BSE HC Feb 01,1999 3718.3 3572.8 3712.5 3352.1 -3.91 BSE IT Feb 01,1999 4862.5 4585.7 4891.6 4241.5 -5.69 BSE METAL Feb 01,1999 11630.9 11565.8 11591.5 9724.8 -0.56 BSE REALTY 7854.1 7241.7 7748.3 6485.9 -7.80 BSE OIL&GAS Feb 01,1999 8130.5 8160.1 8182.6 7266.4 0.36
Dollar based Indices
Dollex 30 3162.2 3095.4 2885.8 2784.5 -2.11 Dollex 100 2050.8 2000.7 2050.6 1801.6 -2.45 Dollar 200 781.1 761.2 780.9 687.7 -2.54
Source:BSE ( www.bseindia.com)
Page 10
73
Similarly, the S & P CNX Nifty has also fallen of 1.4 per cent as against a gain of 6.1
per cent in July. Among the sectoral indices, CNX IT registered the highest fall of 5.4 per
cent and Bank nifty declined by 3.7 per cent (Table10.3)
Table 10.4: Monthly Percentage Change in the Stock Indices of NSE
July 2007
August 2007
August Index Base Year
Closing Closing High Low
Percentage change for the month
S&P CNX Nifty 1995 4528.9 4464.0 4532.9 4002.2 -1.43 CNX Midcap 2003 6177.7 6043.8 6183.3 5576.6 -2.17 CNX Nifty Junior 1996 8849.6 8632.8 8966.3 7700.2 -2.45 S&P CNX Defty 1995 3885.2 3776.2 3900.8 3331.7 -2.81 S&P CNX 500 1994 3783.9 3711.6 3793.9 3362.8 -1.91 CNX 100 4436.2 4366.1 4444.4 3920.6 -1.58 CNX IT 1996* 5086.7 4813.2 5093.4 4439.2 -5.38 BANK Nifty 2000 6928.5 6675.9 7110.6 6058.4 -3.65
Note:*the base value has been changed from 1000 to 100 with effect from May 24, 2004 Source: NSE ( www.nseindia.com)
Foreign Institutional Investors (FIIs) and Mutual Funds
In response to the reverberations in US sub-prime and credit markets, FIIs have been
net sellers to the extent of Rs 7,771 crore as against a net purchase position of Rs 22,609
crore the highest ever inflow in July. Also, the cumulative net FII investments slipped to US
$ 57,373 million from a peak of Rs 60,798 million in July (Chart 10A).
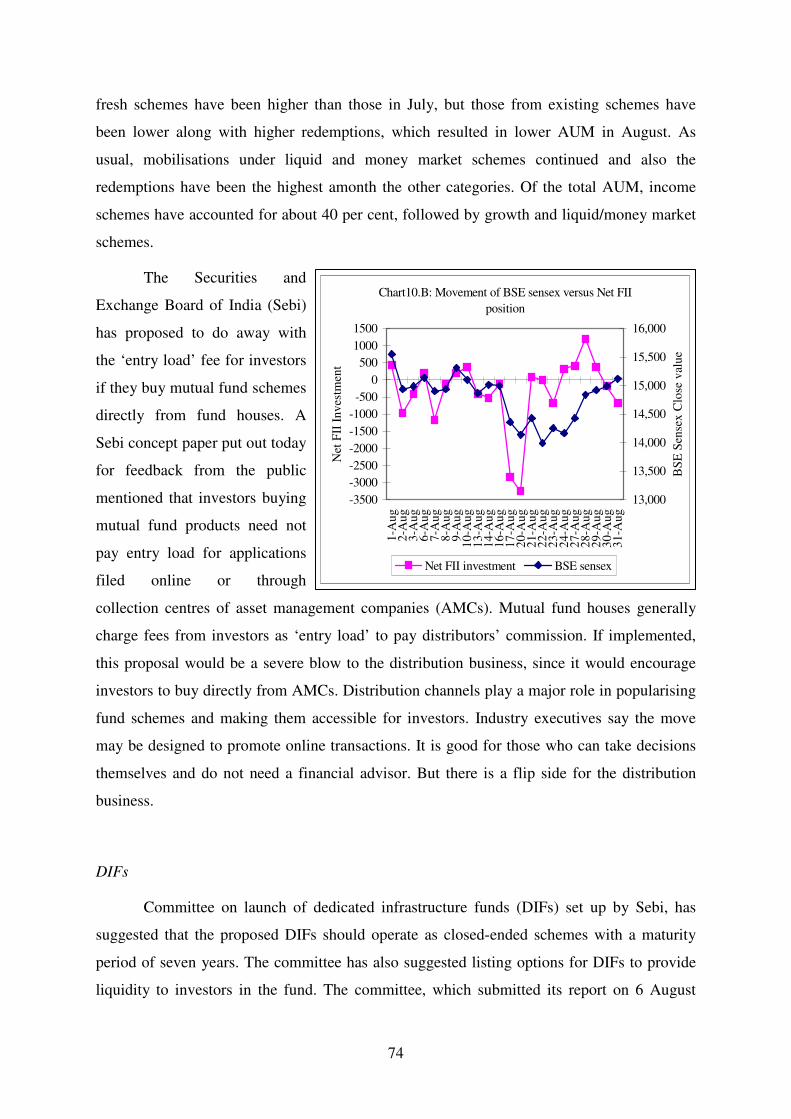
In August, barring a few
days, mutual funds have been net
buyers of equities supporting market
sentiments affected by the massive
FII outflows (Chart 10 B). Their net
purchases have been worth Rs 4,094
crore with Rs 16,676 crore and sales
of Rs 12,582 crore.
The Asset under management
(AUM) has declined in August to Rs
467,623 crore from Rs 486,646 crore
in July; though the inflows from
Chart10.A : Daily Investment of FIIs and Mutual
Funds (August 2007)
-3500
-3000
-2500
-2000
-1500
-1000
-500
0
500
1000
1500
1-A
ug
8-A
ug
15
-Au
g
22
-Au
g
29
-Au
g
Net
FII
In
ves
tmen
t (R
s cr
ore
)
-400
-200
0
200
400
600
800
1000
Net
Mu
tual
Fu
nd
s In
ves
tmen
t (R
s
cro
re)
Net FII investment Net Mutual Funds Investment
Page 11
74
fresh schemes have been higher than those in July, but those from existing schemes have
been lower along with higher redemptions, which resulted in lower AUM in August. As
usual, mobilisations under liquid and money market schemes continued and also the
redemptions have been the highest amonth the other categories. Of the total AUM, income
schemes have accounted for about 40 per cent, followed by growth and liquid/money market
schemes.
The Securities and
Exchange Board of India (Sebi)
has proposed to do away with
the ‘entry load’ fee for investors
if they buy mutual fund schemes
directly from fund houses. A
Sebi concept paper put out today
for feedback from the public
mentioned that investors buying
mutual fund products need not
pay entry load for applications
filed online or through
collection centres of asset management companies (AMCs). Mutual fund houses generally
charge fees from investors as ‘entry load’ to pay distributors’ commission. If implemented,
this proposal would be a severe blow to the distribution business, since it would encourage
investors to buy directly from AMCs. Distribution channels play a major role in popularising
fund schemes and making them accessible for investors. Industry executives say the move
may be designed to promote online transactions. It is good for those who can take decisions
themselves and do not need a financial advisor. But there is a flip side for the distribution
business.
DIFs
Committee on launch of dedicated infrastructure funds (DIFs) set up by Sebi, has
suggested that the proposed DIFs should operate as closed-ended schemes with a maturity
period of seven years. The committee has also suggested listing options for DIFs to provide
liquidity to investors in the fund. The committee, which submitted its report on 6 August
Chart10.B: Movement of BSE sensex versus Net FII
position
-3500
-3000
-2500
-2000
-1500
-1000
-500
0
500
1000
1500
1-A
ug
2-A
ug
3-A
ug
6-A
ug
7-A
ug
8-A
ug
9-A
ug
10
-Au
g1
3-A
ug
14
-Au
g1
6-A
ug
17
-Au
g2
0-A
ug
21
-Au
g2
2-A
ug
23
-Au
g2
4-A
ug
27
-Au
g2
8-A
ug
29
-Au
g3
0-A
ug
31
-Au
g
Net
FII
In
ves
tmen
t
13,000
13,500
14,000
14,500
15,000
15,500
16,000
BS
E S
ense
x C
lose
val
ue
Net FII investment BSE sensex
Page 12
75
2007, also suggested that retail investors investing in DIFs be given tax incentives. The
committee has, however, added that such tax benefits should be available only to the original
investors.
iii) Derivatives
Given the volatility in the cash market, the derivatives market witnessed surge in its
aggregate turnover to Rs 10,56,731 crore from Rs 10,15,077 crore in July. Also, the end of
day daily averages of has been at Rs 82,726 crore, yet the percentage of open interest to daily
average traded value has been lower at 172 per cent as against 176 per cent in July (Table
10.5).
The productwise turnover shows
that the share of stock futures has
declined from 64 per cent in July to 49
per cent in August and that of index
futures has increased from 24 per cent to
34 per cent. The turnover of index options
has increased from 9 per cent to 13 per
cent while that of stock options has
remained steady (Chart 10.D).
As per the data published by NSE, the share of retail investors has been declining in
the recent past while that of institutional investors has increased. The retail investors
accounted for 65 per cent of the total turnover in March 2007 has fallen to 60 per cent, while
that of institutional investors has risen from 11 per cent to 14 per cent over the same period.
Chart D: Productwise contribution to total
derivatives turnover
0
100000
200000
300000
400000
500000
600000
700000
Index
Futures
Stock
Futures
Index
Options
Stock
Options
Turn
over
(R
s cr
ore
)
July-07 August-07
Page 13
76
Table 10.5: Business Growth of F & O Segment of NSE.
Index Futures Stock Futures Index Options Stock Options Grand Total Month/
Year No. of contracts
Turnover (Rs. cr.)
No. of contracts
Turnover (Rs. cr.)
Total Futures Trading
No. of contracts
Turnover (Rs. cr.)
No. of contracts
Turnover (Rs. cr.)
Total Options Trading
No. of contracts
Turnover (Rs. cr.)
Average Daily
Turnover (Rs. cr.)
2002-03
2126763 43951 10676843 286532 330483 442241 9247 3523062 100134 109381 16768909 439864 1752
(10.0) (65.1) (75.1) (2.1) (22.8) (24.9)
2003-04
17191668 554462 32368842 1305949 1860411 1732414 52823 5583071 217212 270035 56886776 2130446 8388
(26.0) (61.3) (87.3) (2.5) (10.2) (12.7)
2004-05
21635449 772174 47043066 1484067 2256241 3293558 121954 5045112 168858 290812 77016465 2547053 10107
(30.3) (58.3) (88.6) (4.8) (6.6) (11.4)
2005-06
58537886 1513791 80905493 2791721 4305512 12935117 338469 5240776 180270 518739 157619271 4824251 19220
(31.4) (57.9) (89.2) (7.0) (3.7) (10.8)
2006-07
81487424 2539574 104955401 3830967 6370541 25157438 791906 5283310 193795 985701 216883573 7356242 29543
(34.5) (52.1) (86.6) (10.8) (2.6) (13.4)
April 07
10,383282 205,458 10647866 296,629 502087 4874462 97,150 635357 17,050 114200 26540967 616287 30814
(33.3) (48.1) (81.5) (15.8) (2.8) (18.5)
May 07
10383282 214,523 13350667 400,096 614,619 4055682 85,465 758306 23,358 108,823 28383804 723443 34450
(29.7) (55.3) (85.0) (11.8) (3.2) (15.0)
Jun 07 11407865 240797 14287983 451314.3 692,111 4340991 92503 694589 21928 114,431 30731428 806542 38407
(29.9) (56.0) (85.8) (11.5) (2.7) (14.2)
Jul 07 10605483 238577 18888008 647356 885933 4221585 94561 1022158 34582 129143 34737234 1015077 46140
(24) (64) (88) (12)
Note: Figures in bracket are per cent to total.
Source: www.nseindia.com
3. Corporate Debt Market
A major development, which may propel the corporates to mobilise more funds
through bonds in the domestic market, concerns the imposition of restrictions by RBI on
external commercial borrowings (ECBs). ECBs up to USD 20 million per borrowing
company per financial year have been permitted for foreign currency expenditures for
permissible end-uses under the Automatic Route; also these funds are to be parked overseas
and not to be remitted to India. Borrowers proposing to avail of ECB up to USD 20 million
for Rupee expenditure for permissible end-uses would require prior approval of the Reserve
Bank under the Approval Route. However, such funds have to be parked overseas until actual
requirement arise in India. Also, foreign currency convertible bonds (FCCBs) have been
losing investor interest due to rising interest rate costs, declining premia, lower conversion
into equity and volatility in stock and currency markets.
Page 14
77
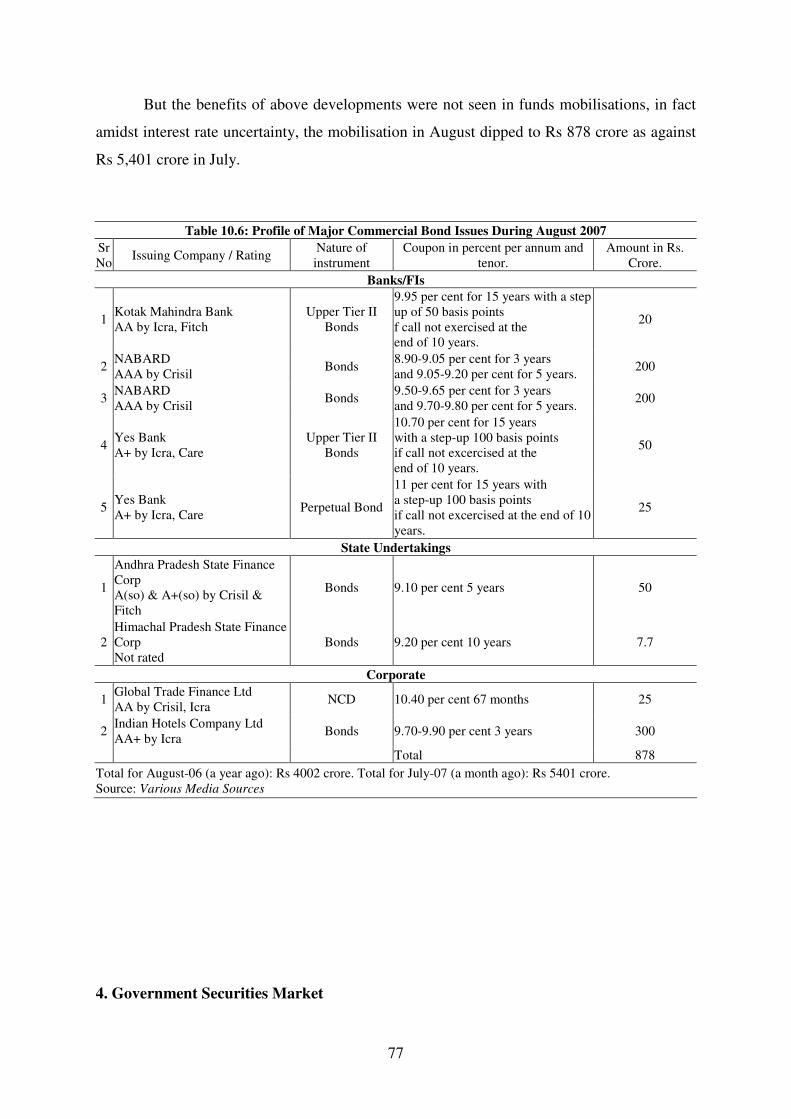
But the benefits of above developments were not seen in funds mobilisations, in fact
amidst interest rate uncertainty, the mobilisation in August dipped to Rs 878 crore as against
Rs 5,401 crore in July.
Table 10.6: Profile of Major Commercial Bond Issues During August 2007
Sr No
Issuing Company / Rating Nature of instrument
Coupon in percent per annum and tenor.
Amount in Rs. Crore.
Banks/FIs
1 Kotak Mahindra Bank AA by Icra, Fitch
Upper Tier II Bonds
9.95 per cent for 15 years with a step up of 50 basis points f call not exercised at the end of 10 years.
20
2 NABARD AAA by Crisil
Bonds 8.90-9.05 per cent for 3 years and 9.05-9.20 per cent for 5 years.
200
3 NABARD AAA by Crisil
Bonds 9.50-9.65 per cent for 3 years and 9.70-9.80 per cent for 5 years.
200
4 Yes Bank A+ by Icra, Care
Upper Tier II Bonds
10.70 per cent for 15 years with a step-up 100 basis points if call not excercised at the end of 10 years.
50
5 Yes Bank A+ by Icra, Care
Perpetual Bond
11 per cent for 15 years with a step-up 100 basis points if call not excercised at the end of 10 years.
25
State Undertakings
1
Andhra Pradesh State Finance Corp A(so) & A+(so) by Crisil & Fitch
Bonds 9.10 per cent 5 years 50
2 Himachal Pradesh State Finance Corp Not rated
Bonds 9.20 per cent 10 years 7.7
Corporate
1 Global Trade Finance Ltd AA by Crisil, Icra
NCD 10.40 per cent 67 months 25
2 Indian Hotels Company Ltd AA+ by Icra
Bonds 9.70-9.90 per cent 3 years 300
Total 878
Total for August-06 (a year ago): Rs 4002 crore. Total for July-07 (a month ago): Rs 5401 crore. Source: Various Media Sources
4. Government Securities Market
Page 15
78
i) Primary Market
Dated Securities
The government in August has mobilised Rs 17,000 crore through two instalments by
issuing two securities each. In the first instance on August 3, the government has re-issued
7.99 per cent 2017 and 7.95 per cent 2032 securities for notified amounts of Rs 6,000 crore
and Rs 4,000 crore, respectively. The cut-off yield for the 10-year paper has been set lower at
7.93 per cent against 7.99 per cent set in July, while the yield on 25-year security has been set
higher at 8.45 per cent against 8.34 per cent (Table 6).
On August 24, the government has re-issued 7.27 per cent 2013 and the 10-year
security auctioned earlier in the month for notified amounts of Rs 5,000 crore and Rs 2,000
crore, respectively. The yield on 6-year paper has been set at 7.87 per cent while for the 10-
year security the yield has been set at 7.91 per cent lower than that set earlier during the
month.
Eight state governments have tapped the market to mobilise Rs 3,484 crore by issuing
10-year state development loans (SDL) through a yield-based auction using multiple price
auction method on August 16. In the case of Madhya Pradesh, the green shoe option has
exercised and bids worth Rs 750 crore have been accepted instead of Rs 600 crore. The cut-
off yields have been set at the lowest for Tamil Nadu at 8.30 per cent and the highest for 8.90
per cent for Jammu and Kashmir (J&K) ; in the previous month, J&K offered on SDL 8.25
per cent for the same maturity.
Under MSS issuances, the RBI has issued 5.48 per cent 2009 for an aggregate amount
of Rs 17,000 crore through three weekly auctions wherein the yields offered have declined
from 7.74 per cent on August 1 to 7.72 per cent on August 8 and then jumped to 7.99 per cent
on August 16, thus exceeding the yield offered on the 10-year security auctioned during the
month. However, in the last auction of the month on August 22, it dipped to 7.92 per cent.
The government issued new marketable securities 8.08 per cent 2022 for an aggregate
amount of Rs. 2,969 crore, 8.26 per cent 2027 for Rs.1,427 crore and 8.32 per cent 2032 for
Rs. 2,434 crore to 11 nationalised banks on August 2, 2007 against their holdings
recapitalisation bonds.
Page 16
79
Table10.7: Details of Central Government Market Borrowing (Amount in Rs Crore)
Competitive Bids Received
Competitive Bids Accepted Date of
Auction Nomenclature
of Loan Type of Auction
Notified Amount
Number Amount Number Amount
Indicative YTM at cut-off price
Devolvement on Primary
Dealers
6-Jul-07 7.99 per cent
2017 Normal 6000 308 18088 101 5979
7.99 per cent
NA
6-Jul-07 8.33 per cent
2036 Normal 4000 215 8271 134 3985
8.45 per cent (Rs. 98.72)
NA
20-Jul-07 7.27 per cent
2013 Normal 6000 227 13973 114 5984
7.59 per cent (Rs. 98.47)
NA
20-Jul-07 7.95 cent
2032 Normal 3000 235 11285 40 2991
8.34 per cent (Rs. 95.82)
NA
18-Jul-07 6.65 per cent
2009 MSS 5000 204 20934 24 4995
7.08 per cent (Rs. 99.30)
NA
25-Jul-07 7.55 per cent
2010 MSS 2000 108 5505 26 1999
7.04 per cent (Rs 101.27)
NA
Source: RBI Press Releases
Treasury Bills
Table 10.8: Auctions of Treasury Bills
(Rs crore)
Bids Received Bids Accepted
Total Face Value No. Total Face Value Date of Auction
Date of Issue
Notified Amt
No. Competitive
Non-competitive
Competitive Non-
competitive
Weighted avg. price
Implicit yield
91-Day Treasury Bills
1-Aug 3-Aug 2000 97 4932 200 56 2000 200 98.43 6.48 8-Aug 10-Aug 2000 86 4295 2500 29 2000 2500 98.41 6.56
14-Aug 17-Aug 2000 94 3450 303 61 2000 303 98.37 6.73 22-Aug 24-Aug 2000 82 3991 2050 14 2000 2050 98.34 6.81 29-Aug 31-Aug 3500 104 7553 550 26 3500 550 98.28 7.10
182-Day Treasury Bills
8-Aug 10-Aug 1500 52 1985 500 47 1500 500 96.61 7.27 22-Aug 24-Aug 1500 69 2235 1500 54 1500 1500 96.45 7.47
364-Day Treasury Bills
1-Aug 3-Aug 2000 84 4675 - 43 2000 - 93.31 7.25 14-Aug 17-Aug 2000 104 4685 - 33 2000 - 93.1 7.49 29-Aug 31-Aug 2000 115 5415 33 39 2000 33 93.06 7.52
Source: Weekly Statistical Supplement, RBI
The pressure on liquidity arising from increased government borrowings has reflected
in the unusual firming up of treasury bill rates. The yield on 91-day TB has surged from 4.46
per cent on July 25 to 6.48 per cent on August 1, to 6.56 per cent on August 8 and then to
Page 17
80
6.73 per cent and to 6.81 per cent on August 22; finally it has breached the 7 per cent mark by
touching 7.10 per cent on August 29 (Table 10.8).
ii) Secondary Market
Given the pressure on liquidity and uncertainty, the secondary market turnover for
gilt-edged securities has declined and the weekly average turnover ranged between Rs 14,629
crore and Rs 35,912 crore as against a range of Rs 38,961 crore and Rs 55,324 crore in the
previous month. Following the announcement of the first review of credit policy, the market
sentiments have turned cautious and prices fell. However, as the RBI enhanced the MSS
limit, the sentiments again have remained cautious except for a brief spell. Further, though
the domestic inflation remained subdued, international crude oil prices continued to surge
causing firmness in yields. In the RBI’s annual report, concerns have been expressed about
inflation remaining a threat, and hence the sentiments remained cautious despite RBI
refraining from undertaking MSS issuances.
Table 10.9: Inter-Category Wise NDS Reported Outright Trade of Central Govt
(Buy side) August 2007
Sellers
Buyer Category Foreign Banks
Primary Dealers
Public Sector Banks
Private Sector Banks
Mutual Funds
Coop Banks
FIs Others Ins.Cos Total
Per cent of total market share
Foreign Banks 52.40 22.56 11.08 6.40 3.14 3.06 0.00 0.00 1.34 100 28.62 Primary Dealers 33.59 6.51 12.49 37.17 4.76 4.50 0.00 0.00 0.98 100 15.76 Public Sector Banks 51.79 14.60 6.85 11.01 12.67 1.37 0.00 0.00 1.71 100 18.55 Private Sector Banks 43.60 25.63 5.01 16.98 4.31 2.12 0.00 1.07 1.28 100 20.94 Mutual Funds 22.57 40.52 3.73 11.20 6.22 15.76 0.00 0.00 0.00 100 3.73 Coop Banks 28.08 23.45 10.74 8.63 22.57 5.97 0.00 0.00 0.55 100 2.88 FIs 0.00 0.00 0.00 100.00 0.00 0.00 0.00 0.00 0.00 100 0.04 Others 10.16 21.25 0.00 16.94 39.47 11.17 0.00 0.00 1.02 100 0.02 Ins.Cos 3.95 8.96 0.59 83.35 2.57 0.20 0.00 10.79 0.39 100 9.45
Source: CCIL Rakshitra - September 2007
As per the inter-category
data published by CCIL for NDS
reported trades, foreign banks have
been the dominant players in dated
securities reported on the NDS
platform of the RBI, followed by
private sector banks (Table 10.9).
Table10.10: Category-Wise Market Share
for the Month of August 2007
Category Outright Treasury Bills Reverse RepoRepo
Buy Sell Buy Sell
Primary Dealers 10.6519.72 7.90 24.50 0.39 21.22Public Sector Banks 12.93 8.20 24.50 17.06 0.84 1.11 Private Sector Banks 14.4020.85 11.52 14.81 2.76 33.82Foreign Banks 41.1740.92 28.33 25.01 11.07 43.69Mutual Funds 5.34 5.67 24.35 18.10 84.38 0.00 Co-op Banks 4.02 3.35 1.69 0.31 0.00 0.11 FIs 0.06 0.00 0.07 0.00 0.01 0.05 Ins.Cos 11.22 1.13 1.63 0.20 0.53 0.00 Others 0.22 0.15 0.00 0.00 0.01 0.00
Source: CCIL Rakshitra- September 2007
Page 18
81
Mutual funds have been the major lenders while foreign banks have been the major
borrowers of funds. Also mutual funds have been major buyers of treasury bills given the
huge cash surplus mobilised by them through the new offerings. In the outright market,
foreign banks have been dominating buy as well as sell side of trades by accounting for about
40 per cent of the total trades (Table 10.10).
5. Money Market
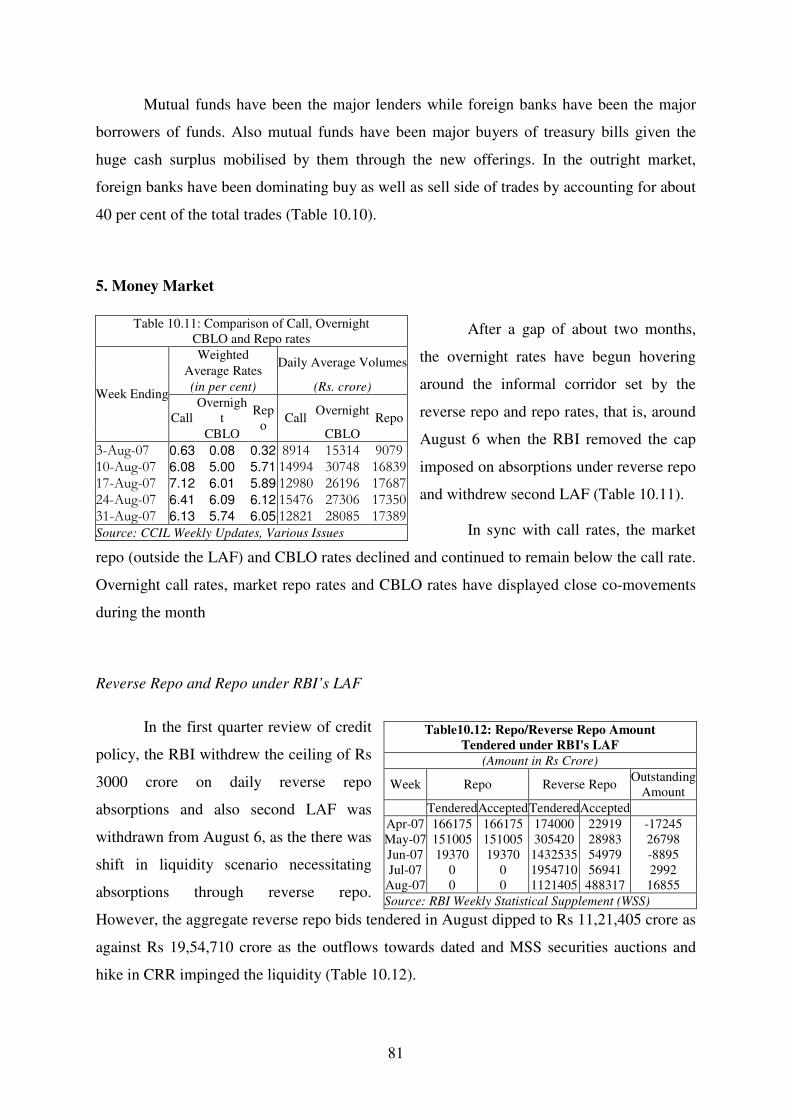
After a gap of about two months,
the overnight rates have begun hovering
around the informal corridor set by the
reverse repo and repo rates, that is, around
August 6 when the RBI removed the cap
imposed on absorptions under reverse repo
and withdrew second LAF (Table 10.11).
In sync with call rates, the market
repo (outside the LAF) and CBLO rates declined and continued to remain below the call rate.
Overnight call rates, market repo rates and CBLO rates have displayed close co-movements
during the month
Reverse Repo and Repo under RBI’s LAF
In the first quarter review of credit
policy, the RBI withdrew the ceiling of Rs
3000 crore on daily reverse repo
absorptions and also second LAF was
withdrawn from August 6, as the there was
shift in liquidity scenario necessitating
absorptions through reverse repo.
However, the aggregate reverse repo bids tendered in August dipped to Rs 11,21,405 crore as
against Rs 19,54,710 crore as the outflows towards dated and MSS securities auctions and
hike in CRR impinged the liquidity (Table 10.12).
Table 10.11: Comparison of Call, Overnight CBLO and Repo rates
Weighted
Average Rates Daily Average Volumes
(in per cent) (Rs. crore)
Overnight
Overnight
Week Ending
Call
CBLO
Repo
Call
CBLO
Repo
3-Aug-07 0.63 0.08 0.32 8914 15314 9079 10-Aug-07 6.08 5.00 5.71 14994 30748 16839 17-Aug-07 7.12 6.01 5.89 12980 26196 17687 24-Aug-07 6.41 6.09 6.12 15476 27306 17350 31-Aug-07 6.13 5.74 6.05 12821 28085 17389 Source: CCIL Weekly Updates, Various Issues
Table10.12: Repo/Reverse Repo Amount
Tendered under RBI's LAF
(Amount in Rs Crore)
Week Repo Reverse Repo Outstanding
Amount
TenderedAccepted TenderedAccepted
Apr-07 166175 166175 174000 22919 -17245 May-07 151005 151005 305420 28983 26798 Jun-07 19370 19370 1432535 54979 -8895 Jul-07 0 0 1954710 56941 2992
Aug-07 0 0 1121405 488317 16855
Source: RBI Weekly Statistical Supplement (WSS)
Page 19
82
6. Foreign Exchange Market
The month of August
saw huge volatility across
global stock markets as well as
currency markets amidst the US
subprime crisis, turmoil in
global credit markets and high
crude oil prices. But the rupee
has been resilient amidst all
these skirmishes. In correcting
the earlier appreciation, it
depreciated not only against the
US dollar and Chinese Yuan,
but also against some of the
south East Asian currencies such as Hong kong dollar and Singaporean dollar, along with
marginal appreciations against South Korean won, Malaysian Ringgit and Indonesian
Ruphiah. Interestingly, this has happened when the US dollar itself was depreciating against
most of the currencies in the wake of deepening sub-prime mortgage crisis and spreading
contagion effect. Also, there were unwinding of yen carry trades as a part of global risk
aversion. There were FII outflows from the domestic equities market to the extent of Rs
7,771 crore during August as it implied that the investors’ penchant for emerging markets
appeared to have waned albeit temporarily and the rupee-dollar exchange rate depreciated
below the Rs 41-mark. After the US fed unexpectedly effected a cut in its benchmark rate and
as the domestic stock markets recovered, the rupee firmed up. However, again in the wake of
political uncertainty over nuclear deals along with firm international crude oil prices, the
rupee reverted to below the Rs 41-mark. The market sentiments for the rupee were influenced
by the Chinese central bank raising its lending and deposit rates and internally, the RBI
imposing constraints on ECB borrowings.
RBI has notified that the reporting platform developed by CCIL for capturing the
transactions in OTC interest rate derivatives (Interest Rate Swaps and Forward Rate
Agreements (IRS/FRA)), would be operationalised by August 30, 2007. All banks and
primary dealers are required to report all their IRS/FRA trades on the reporting platform
within 30 minutes from the deal time.
Chart 10.C:Daily Net FII Inflows and Rupee-Dollar
Exchange Rate (Aug 2007)
-3500
-3000
-2500
-2000
-1500
-1000
-500
0
500
1000
1500
1-A
ug
3-A
ug
7-A
ug
9-A
ug
13-A
ug
16-A
ug
20-A
ug
22-A
ug
24-A
ug
28-A
ug
30-A
ug
Net
FII
Infl
ow
s (R
s cr
ore
)
40
40.1
40.2
40.3
40.4
40.5
40.6
40.7
Rupee
-doll
ar E
xch
ange
Rat
e
Net FII investment Rupee-Dollar Exchange Rate
Page 20
83
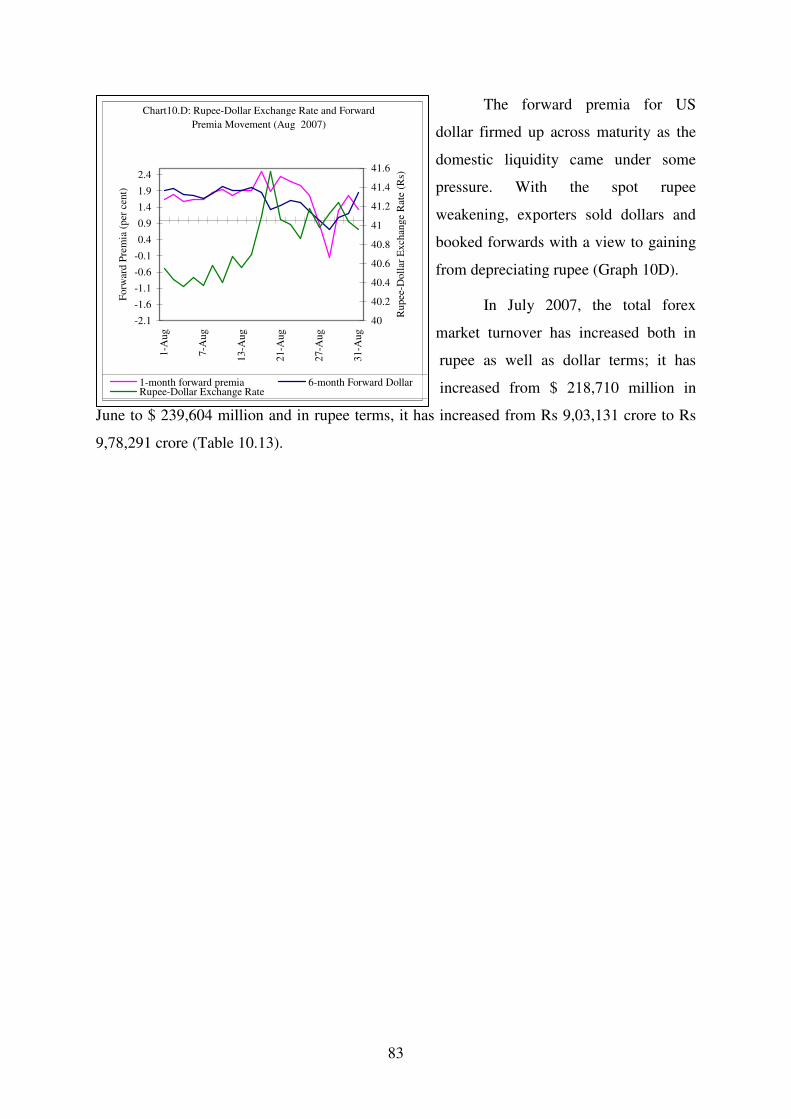
The forward premia for US
dollar firmed up across maturity as the
domestic liquidity came under some
pressure. With the spot rupee
weakening, exporters sold dollars and
booked forwards with a view to gaining
from depreciating rupee (Graph 10D).
In July 2007, the total forex
market turnover has increased both in
rupee as well as dollar terms; it has
increased from $ 218,710 million in
June to $ 239,604 million and in rupee terms, it has increased from Rs 9,03,131 crore to Rs
9,78,291 crore (Table 10.13).
Chart10.D: Rupee-Dollar Exchange Rate and Forward
Premia Movement (Aug 2007)
-2.1
-1.6
-1.1
-0.6
-0.1
0.4
0.9
1.4
1.9
2.41-A
ug
7-A
ug
13-A
ug
21-A
ug
27-A
ug
31-A
ug
Forw
ard P
rem
ia (
per
cen
t)
40
40.2
40.4
40.6
40.8
41
41.2
41.4
41.6
Rupee
-Doll
ar E
xch
ange
Rat
e (R
s)
1-month forward premia 6-month Forward DollarRupee-Dollar Exchange Rate
Page 21
84
Table 10.13: Category-Wise Settlement Volume in Forex Market for the Month of August 2007
Cash Tom Spot Forward Total Average Settlement period
(N) (A) (B) (N) (A) (B) (N) (A) (B) (N) (A) (B) (N) (A) (B) (N) (A) (B)
2002-03 - - - - - - 74423 96483 462370 25809 39619 195665 100232 136102 658035 1101 1496 7231
2003-04 1036 5951 26861 1555 9150 41335 251258 354541 1627644 76668 131700 622691 330517 501342 2318531 1425 2161 9994
2004-05 8747 69882 312311 16178 112750 504325 356382 533015 2389936 85020 184133 835863 466327 899782 4042435 1976 3813 17129
2005-06 12946 154626 6861604 21307 199621 8855851 371059 585089 25942395 84337 240352 10736886 489649 1179688 5239674 2084 5020 22297
2006-07 14292 233010 1050413 25708 316585 1427018 481702 884740 3993765 85106 342646 762957 606808 1776981 8023078 2550 7466 33710
Apr-07 1503 25993 109763 2596 37177 157760 55509 131841 557876 8065 46902 208121 67673 241913 1033519 3562 12732 54396
May-07 1213 21579 88118 1997 27416 112115 52868 123237 503448 7163 37633 163896 63241 209865 867578 3162 10493 43379
Jun-07 1244 23761 96909 2078 32973 134494 50598 116061 473537 7872 45915 198193 61792 21871 903131 2942 10415 43006
Jul-07 1222 24387 98578 1952 27648 111750 50105 133051 538466 7743 54519 229497 61201 239604 978291 3051 11980 48915
Aug-07 1119 23805 97105 2367 37802 154054 55995 132831 542257 7994 55897 235261 67475 250335 1028677 3213 11921 48985
Note: N-No of Trades; A-Volume in USD Million; B-Volume in Rs Crore
Source: CCIL Rakshitra, CCIL Market Update, various issues
Page 22
85
7. Commodities Futures Market
During April- August 2007, the total commodities turnover has been Rs 14,83,273
crore as against Rs 15,63,096 crore in the corresponding period last year. MCX has continued
to account for more than 70 per cent of the total turnover while the share NCDEX has
declined from 22 per cent in July to 11 per cent in August. Also, the share of agricultural
commodities in total turnover has declined while that of non-agricultural commodities has
increased sharply (Table 10.14).
Table 10.14: Monthly Turnover Of Commodity Exchanges
(Amount in Rs. crore)
Commodity Exchange April-Aug 07
turnover June-07
Turnover July-07
Turnover Aug-07
Turnover 1 1060455 208998 206111 225339
Multi Commodity Exchange of India Limited, Mumbai (71.5) (74.0) (73.0) (74.2)
2 9334 1329 1373 1391
National Multi-Commodity Exchange of India Limited, Ahmedabad
(0.6) (0.5) (0.5) (0.5)
3 221373 34173 64754 32854
National Commodity & Derivatives Exchange Ltd. Mumbai (14.9) (12.1) (22.9) (10.8)
4 7752 1770 1439 1186
Chamber of Commerce, Hapur
(0.5) (0.6) (0.5) (0.4)
5 34096 6752 6369 6615
National Board of Trade, Indore
(2.3) (2.4) (2.3) (2.2)
Total * 1483575 282550 282251 303508
Note: * Total includes the monthly turnover of the remaining 18 commodity exchanges. Figures in brackets denotes percentage share in the total turnover.
Source: FMC (www.fmc.gov.in)
Commodity-wise Turnover
Table10.15: Commodity-wise turnover
Jun-07 Jul-07 Aug-07
Commodity Trading on
all exchanges (Rs. Cr)
Percentage
to total turnover
Trading on all
exchanges (Rs. Cr)
Percentage
to total turnover
Trading on all
exchanges (Rs. Cr)
Percentage
to total t urnover
Metal
Gold 52998 18.76 56975 20.2 49346 16.3 Silver 42275 14.96 37345 13.2 44795 14.8 Copper 49032 17.35 39069 13.8 44577 14.7 Zinc 23622 8.36 22404 7.9 21756 7.2 Nickel 12325 4.36 10724 3.8 8910 2.9 Agricultural Product
Pepper 8958 3.17 8283 2.9 7808 2.6 Jeera 11191 3.96 5032 1.8 5246 1.7 Soy oil 13553 4.8 13750 4.9 11351 3.7 Gaur seed 8341 2.95 12878 4.6 17477 5.8 Chana 5942 2.1 7118 2.5 7225 2.4
Source: FMC (www.fmc.gov.in)
Page 23
86
In August, the share of gold has declined while that of silver and copper has
increased. Among the agricultural commodities, the trading in guar seed has increased while
that of pepper, chana, Jeera and Soya oil has declined (Table 10.15).
Entry of Corporates
Trading volumes on domestic commodity exchanges are rising with the entry of giant
corporates from across all sectors, especially in global commodities such as base metals,
precious metals, steel and energy. An increase in corporate volumes would stabilise prices
and help in anchoring the physical markets to the futures market. For effective price
discovery, it was important for speculators, hedgers and arbitrageurs to be present in the
market.
Anjani Sinha, director, MCX, has said that MCX cloaks the maximum market share in
metal futures in India, and traders would like to hedge on this platform where the cost is
lower because of higher liquidity. And hence, he said, the entry of corporates, especially for
metals on the MCX, would help them in better price discovery said. Although, the volume of
corporate hedgers has not reached a significant level, sources believe that within a short span
of time it would overtake the volume of small hedgers. In base metals, players like Binani
Zinc (BZL) has been keen, hedging approximately 2000 tonnes of zinc on the MCX.
Reportedly, Binani Zinc, the second-largest zinc producer in the country after Hindustan
Zinc, has traded to the value of Rs 1,500 crore and booked a profit of Rs 150 crore since it
started hedging on the MCX last year. Other players that are currently hedging on the
domestic exchanges include Essar and Polycab Wire, while metal and energy majors,
including Hindustan Copper (HCL), Indian Oil Corporation (IOC), Bharat Petroleum
Corporation (BPCL), and Hindustan Petroleum Corporation (HPCL), are in various stages of
negotiations to begin hedging in the near future. Many corporates hedge on global
commodity exchanges, with metal majors trading primarily on the London Metal Exchange
(LME) and the New York Mercantile Exchange (Nymex), and energy majors on the
Intercontinental Exchange (ICE), among others.
New Contracts
National Commodity and Derivatives Exchange is launching futures trading in
robusta coffee cherry AB variety on September 10, an official with the exchange said.
Page 24
87
NCDEX is launching five contracts expiring in January, March, May, July and September
2008. It has already secured approval from the market regulator Forward Markets
Commission to launch futures trading in robusta Cherry AB.
The recently introduced futures trading in raw jute on the Multi Commodity Exchange
(MCX) has come in for sharp criticism from the jute industry, with the latter urging the
Centre for an immediate ban on the futures. The industry’s appeal is currently being looked
into by the textile ministry. The ministry is already in discussion with the Ministry of
Consumer Affairs, Food and Public Distribution Department (FPD) and the Forward Markets
Commission (FMC).
National Commodity and Derivatives Exchange has launched a deliverable futures
contract in light sweet crude oil. Contracts for delivery in September, October and November
have begun trading. The Jawaharlal Nehru Port Trust has been designated as the delivery
centre. The trading unit will be 100 barrels, while the delivery unit is 50,000 barrels. The
exchange said that the buyer shall be responsible for the freight cost, insurance, import duty
and all other taxes and levies on actual basis. Traders have to give delivery intention during
the last three days of trading in the contract. The daily price fluctuation limit will be 6 per
cent, and if it reached intraday it would be extended by 3 per cent after 15 minutes. The
position limit for members has been set at 1.2 million barrels and that for a client will be
4,00,000 barrels.
Issues in Commodity Futures Market
Forward Markets Commission Chairman B C Khatua, stated that commodity futures
trading in the country is heading toward’s saturation levels due to bottlenecks in
infrastructure and operational constraints, lack of quality warehousing facilities as well as
uniform standards for benchmarking each commodity. Setting a uniform standard for a
commodity as far as possible will help in increasing the volume of trade as well as ensuring
better participation, he added. Turnover in commodity exchanges dropped 6-7 per cent in
April-July, 2007 compared with same period a year ago due to these problems, the Chairman
said. The Central government banning forward trading in high volume commodities, like
wheat a few months ago has also contributed to the fall in turnover, he said. Limits imposed
on open positions that could be held by individuals for near-month contract in commodities
like pepper and jeera has also affected the market, the chairman said. Rejecting suggestions
for a ban on futures trade, he said the market will achieve further growth by bringing more
Page 25
88
commodities under forward trading. Commodity futures trading in its present form is
relatively new in India and the depth of the market is limited at present, he said. But we could
resolve all these issues in consultations with various stakeholders in the market, Khatua said.
The chairman also stated his support for participation of banks and mutual funds in
commodity futures trading.
Issues in Jute Trading
According to the industry, futures trade in raw jute is a clear /fatka and dabba trade
perpetrated by unscrupulous brokers and market operators, who are mostly interested in
maximising gains. Such an action, the industry feels, can never be allowed to grow especially
on jute, which is an essential commodity and is governed by Jute and Jute Textile Control
Order (J&JTCO). The industry representatives mentioned that the recent raw jute speculation
on MCX showed compulsory deliveries despite the contract. The market speculators and
operators escape the practice through delivery/purchase by paying 5 per cent penalty as
mentioned in the penal provisions, they alleged. The penal margins being very low, the
speculators are deriving benefits out of these contracts, thereby marring prospects for the
industry. Moreover, the industry argued, with the Centre making packaging of sugar and food
grain compulsory in jute bags, the jute prices remaining stable is all the more necessary. The
Centre has recently made the order under the Compulsory Jute Packaging Act of 1987.
If prices of raw jute doesn’t remain within limits, the cost of production of bags would
shoot up, adversely affecting the operations of the food ministry, FCI and other state
agencies, who will then be forced to pack the materials well above the market regulated
prices and distribute through PDS,’said an industry representative. It has been pointed out to
the government that due to ‘speculative trade’ on the National Multi Commodity Exchange
(NMCE), Ahmedabad, in jute year 2005-06, the prices of raw jute rose exorbitantly and
hoarding became a common practice. At that point, jute was not available in the market,
forcing the industry to go in for ‘block closure’ of mills resulting in unemployment of almost
2.5 lakh workers and daily wage earners across the country.
The industry had then filed an FIR with the state police to investigate the whole
activities of the NMCE and its brokers/sub-brokers and agents. Following this, the Centre
took a series of steps such as fixing fresh prices of raw jute, registration of all dealers, traders
or agencies holding raw jute and launching of de-hoarding operations.