Page 1
REVIEW
X-ray absorption spectroscopy
Junko Yano Æ Vittal K. Yachandra
Received: 20 February 2009 / Accepted: 9 July 2009 / Published online: 4 August 2009
� The Author(s) 2009. This article is published with open access at Springerlink.com
Abstract This review gives a brief description of the
theory and application of X-ray absorption spectroscopy,
both X-ray absorption near-edge structure (XANES) and
extended X-ray absorption fine structure (EXAFS), espe-
cially, pertaining to photosynthesis. The advantages and
limitations of the methods are discussed. Recent advances
in extended EXAFS and polarized EXAFS using oriented
membranes and single crystals are explained. Develop-
ments in theory in understanding the XANES spectra are
described. The application of X-ray absorption spectros-
copy to the study of the Mn4Ca cluster in Photosystem II is
presented.
Keywords Photosystem II � Water oxidation �Oxygen evolution � Manganese cluster �X-ray spectroscopy � EXAFS � XANES � X-ray dichroism
Abbreviations
PS II Photosystem II
XAS X-ray absorption spectroscopy
EXAFS X-ray absorption fine structure
EPR Electron paramagnetic resonance
XANES X-ray absorption near-edge structure
Introduction
During the past 30 years, X-ray absorption spectroscopy
(XAS) has made major contributions to a wide variety of
biochemical research topics. It has been raising important
questions of correlation between structure and function of
the metal sites in metallo-proteins, including the photo-
synthetic oxygen-evolving complex (OEC; Yano and
Yachandra 2008). The history of the development of the
experimental method of XAS (Sayers et al. 1971; Eisen-
berger and Kincaid 1978) overlaps the history of the
structural research on the OEC in photosystem II (PS II).
The historical background of the XAS study on PS II,
especially the early work, has been reviewed in some detail
(Yachandra et al. 1996; Penner-Hahn 1998; Yachandra
2005; Yano and Yachandra 2007; Sauer et al. 2008).
In X-ray spectroscopy, transitions are involved in
absorption (XAS, X-ray absorption spectroscopy) or
emission (XES, X-ray emission spectroscopy) of X-rays,
where the former probes the ground state to the excited
state transitions, while the latter probes the decay process
from the excited state. Both methods characterize the
chemical nature and environment of atoms in molecules,
and synchrotron sources provide a range of X-ray energies
that are applicable to most elements in the periodic table, in
particular, those present in redox-active metallo-enzymes.
The choice of the energy of the X-rays used, in most cases,
determines the specific element being probed. This is quite
a contrast with other methods, such as optical or UV
absorption, fluorescence, magnetic susceptibility, electro-
chemistry etc., which have been applied to study biological
redox systems. The results from infrared and Raman
spectroscopy can be related to specific elements through
isotopic substitution, but the analysis of such spectra for
metal clusters is complicated when the structure is not
J. Yano � V. K. Yachandra (&)
Physical Biosciences Division, Lawrence Berkeley National
Laboratory, University of California, Berkeley, CA 94720, USA
e-mail: [email protected]
J. Yano
e-mail: [email protected]
123
Photosynth Res (2009) 102:241–254
DOI 10.1007/s11120-009-9473-8
Page 2
known. In this article, we focus on XAS methods which
have been used in the field of photosynthesis. The XES
methods are discussed in the paper by Bergmann and
Glatzel (this issue).
X-ray absorption spectroscopy (XAS) is the measure-
ment of transitions from core electronic states of the metal
to the excited electronic states (LUMO) and the continuum;
the former is known as X-ray absorption near-edge struc-
ture (XANES), and the latter as extended X-ray absorption
fine structure (EXAFS) which studies the fine structure in
the absorption at energies greater than the threshold for
electron release. These two methods give complementary
structural information, the XANES spectra reporting elec-
tronic structure and symmetry of the metal site, and the
EXAFS reporting numbers, types, and distances to ligands
and neighboring atoms from the absorbing element (Kon-
ingsberger and Prins 1988).
X-ray absorption spectroscopy (XAS) allows us to study
the local structure of the element of interest without
interference from absorption by the protein matrix, water or
air. Yet, X-ray spectroscopy of metallo-enzymes has been a
challenge due to the small relative concentration of the
element of interest in the sample. In the PS II, for example,
Mn may be at the level of 10 parts per million or less. In
such a case, the use of X-ray fluorescence for the detection
of the absorption spectra, instead of using the transmission
detection mode, has been the standard approach. The
development of intense third generation synchrotron radi-
ation X-ray sources has also permitted the study of dilute
samples.
Metal complexes, as models with known structures,
have been essential in order to understand the XAS of
metallo-proteins. These complexes provide a basis for
evaluating the influence of the coordination environment
(coordination charge) on the absorption edge energy
(Cinco et al. 1999; Pizarro et al. 2004). Study of structur-
ally well-characterized model complexes also provides a
benchmark for understanding the EXAFS from metal sys-
tems of unknown structure.
The significant advantage of XAS over the X-ray crys-
tallography is that the local structural information around
the element of interest can be obtained even from disor-
dered samples, such as powders and solution. However,
ordered samples, such as membranes and single crystals,
often increases the information obtained from XAS. For
oriented single crystals or ordered membranes, the inter-
atomic vector orientations can be deduced from dichroism
measurements. These techniques are especially useful for
determining the structures of multi-nuclear metal clusters,
such as the Mn4Ca cluster associated with water oxidation
in the photosynthetic oxygen-evolving complex (OEC).
Moreover, quite small changes in geometry/structure
associated with transitions between the intermediate states,
known as the S-states, in the cycle of the water-oxidation
reaction can be readily detected using XAS. Another useful
approach has been to collect complementary EXAFS
measurements, for example, at both the Mn and Ca K-
edges for the OEC cluster (Cinco et al. 2002), or following
a Sr ? Ca replacement measuring data at the Mn and Sr
K-edges (Latimer et al. 1995; Cinco et al. 1998; Pushkar
et al. 2008). Such measurements greatly improve the
information that can be obtained for multi-nuclear metal
clusters, such as the Mn4Ca cluster in PS II, as the preci-
sion of the fits can be improved by such complementary
data.
X-ray absorption spectroscopy (XAS) theory has been
developed to an extent that it can be applied to complicated
molecules of known structure (Teo 1986; Rehr and Albers
2000). Although it is less straightforward to apply it to the
OEC, where its molecular environment is not yet precisely
defined, the basic XAS equation allows us to interpret
EXAFS spectra to considerable advantage. X-ray spectral
properties to be expected from specified cluster geometries
can be calculated and compared with experimental mea-
surements. Density-functional theory (DFT) can be applied
to issues like the stability of a proposed cluster arrange-
ment or the likelihood of postulated reaction paths.
Moreover, the time-dependent DFT calculations provide an
important insight into the electronic structure of the metal
site combined with the analysis of the XANES pre-edge
region.
In the current review, we summarize the basics of XAS,
and also discuss some techniques which have been applied
to study the OEC of PS II.
Theory of XAS
X-ray absorption spectra of any material be it atomic or
molecular in nature are characterized by sharp increases in
absorption at specific X-ray photon energies, which are
characteristic of the absorbing element. These sudden
increases in absorption are called absorption edges, and
correspond to the energy required to eject a core electron
into the LUMO or to the continuum thus producing a
photoelectron. The absorption discontinuity is known as
the K-edge, when the photoelectron originates from a 1s
core level, and an L-edge when the ionization is from a 2s
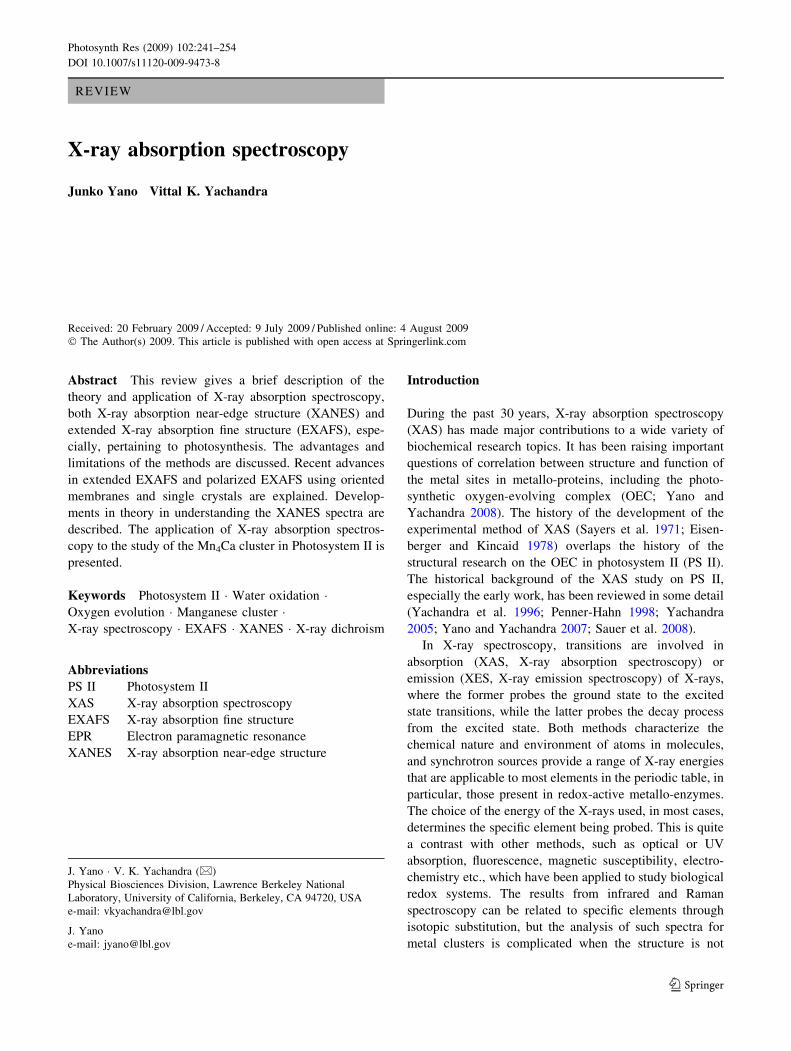
or 2p electron. Figure 1 shows a typical energy level dia-
gram. L-edge spectroscopy is, in general, more sensitive to
the electronic, structural, and the spin state changes of the
metal cluster compared to the K-edge spectroscopy, how-
ever, there are experimental difficulties in applying this
technique to biological samples. We will focus on K-edge
spectroscopy in the current review.
242 Photosynth Res (2009) 102:241–254
123
Page 3
XANES
X-ray absorption near-edge structure (XANES) spectra
provide detailed information about the oxidation state and
coordination environment of the metal atoms (Fig. 2). The
K-edge absorption edge energy increases with increasing
oxidation state. In general, the rising edge position shifts
when the effective number of positive charges (in a sim-
plified view, oxidation state) changes resulting from 1s
core hole shielding effects (Shulman et al. 1976). In an
atom with one electron, for example, the electron experi-
ences the full charge of the positive nucleus. However, in
an atom with many electrons, the outer electrons are
simultaneously attracted to the positive nucleus and
repelled by the negatively charged electrons. The higher
the oxidation state of the metal, the more positive the
overall charge of the atom, and therefore more energy is
required to excite an electron from an orbital. Conversely,
the XANES spectrum shifts to a lower energy when there is
more negative charge on the metal.
The dominant contribution to the K-edge spectrum
comes from 1s ? np transitions, where np represents the
lowest unoccupied p orbital of the absorbing atom. This
transition, with Dl = 1 (l is the orbital momentum quantum
number), is quantum mechanically allowed and is typically
intense. For transition metals with partially occupied d
orbitals, additional insights can be gained by examination
of pre-edge features that result from 1s to (n - 1)d tran-
sitions. These are relatively weak in intensity (Dl = 2;
hence, formally forbidden or dipole-forbidden), but they
can be detected as they occur at energies slightly less than
that of the main absorption edge. The pre-edge peak
intensity increases when the ligand environment is per-
turbed from octahedral symmetry (see ‘‘Mn K-edge pre-
edge spectra and DFT calculations’’).
EXAFS
At energies somewhat greater than the LUMO level, the
absorption of an X-ray provides sufficient energy to cause
the absorbing atom to release the electron (ionize). Any
excess energy is carried off as translational kinetic energy,
which is alternatively reflected in the wavelength associated
with the electron treated as a wave phenomenon. The EX-
AFS modulations, shown in Fig. 2, are a direct consequence
of the wave nature of the photoelectron with the velocity mimparted to the photoelectron by the energy of the absorbed
X-ray photon, which is in excess of the binding or threshold
energy for the electron. The kinetic energy of the photo-
electron is given by the following relation:
E � E0ð Þ ¼ 1
2mev2; ð1Þ
where E is the X-ray photon energy, E0 is the ionization or
threshold energy for the electron, and me is the electron mass.
The EXAFS modulations are better expressed as a function
of the photoelectron wave vector k (k = 2p/k, where k is the
wavelength given by the de Broglie relation, k = h/mev, h is
Planck’s constant), which is expressed as follows:
k ¼ 2ph
2meðE � E0Þ½ �1=2¼ 0:512ðE � E0Þ1=2; ð2Þ
where E and E0 are expressed in electron volts (eV) and k
has the units of inverse angstroms (A-1).
The wave nature of the departing electron results in
interference owing to scattering off nearby atoms. Thus,
the EXAFS oscillations result from the interference
between the outgoing photoelectron wave and components
of backscattered wave from neighboring atoms in the
molecule, which start immediately past an absorption edge
and extending to about 1 keV above the edge. The general
definition for the EXAFS phenomenon v(k), which is the
oscillatory portion of the absorption coefficient, is the
difference between the observed absorption coefficient l(k)
and the free-atom absorption coefficient l0(k), normalized
by the free-atom contribution:
v kð Þ ¼ l kð Þ � l0 kð Þl0 kð Þ : ð3Þ
One can envision the EXAFS phenomena by the help of a
schematic of the outgoing and backscattered waves as
shown in Fig. 2b. As the energy of the photoelectron
changes, so does the wavelength of the photoelectron. At a
Fig. 1 The energy level diagram for L-edge (LI, LII, and LIII)
transitions (2s and 2p to 3d) and K-edge transitions (1s to 3d and 4p)
for Mn(II). The energy levels are not drawn to scale. For example, the
K-edge is at 6,539 eV and the L edges are at 769, 650, and 639 eV,
respectively
Photosynth Res (2009) 102:241–254 243
123
Page 4
particular energy E1, the outgoing and the backscattered
waves are in phase and constructively interfere, thus
increasing the probability of X-ray absorption or, in other
words, increase the absorption coefficient. At a different
energy E2, the outgoing and backscattered waves are out-
of-phase and destructively interfere, decreasing the
absorption coefficient. This modulation of the absorption
coefficient by the backscattered wave from neighboring
atoms is essentially the basic phenomenon of EXAFS. And,
Fourier transform (FT) of the modulation provides distance
information describing the vector(s) between the absorbing
atom and atoms to which it is bound—typically within a
range limit of 4–5 A.
A quantitative EXAFS modulation v(k) can be expres-
sed as follows:
vðkÞ ¼X
j
Nj fjðp; k;RajÞ�� ��
kR2aj
sin½2kRaj þ aajðkÞ�; ð4Þ
where Nj is the number of equivalent backscattering atoms
j at a distance Raj from the absorbing atom, fj(p, k) is the
backscattering amplitude which is a function of the atomic
number of the backscattering element j, and aaj(k) includes
the phase shift from the central atom absorber as well as the
backscattering element j. The phase shift occurs due to the
presence of atomic potentials that the photoelectron expe-
riences as it traverses the potential of the absorber atom,
the potential of the backscattering atom, and then back
through the potential of the absorber atom.
In real systems, there is an inherent static disorder due to
a distribution of distances Raj, and dynamic disorder due to
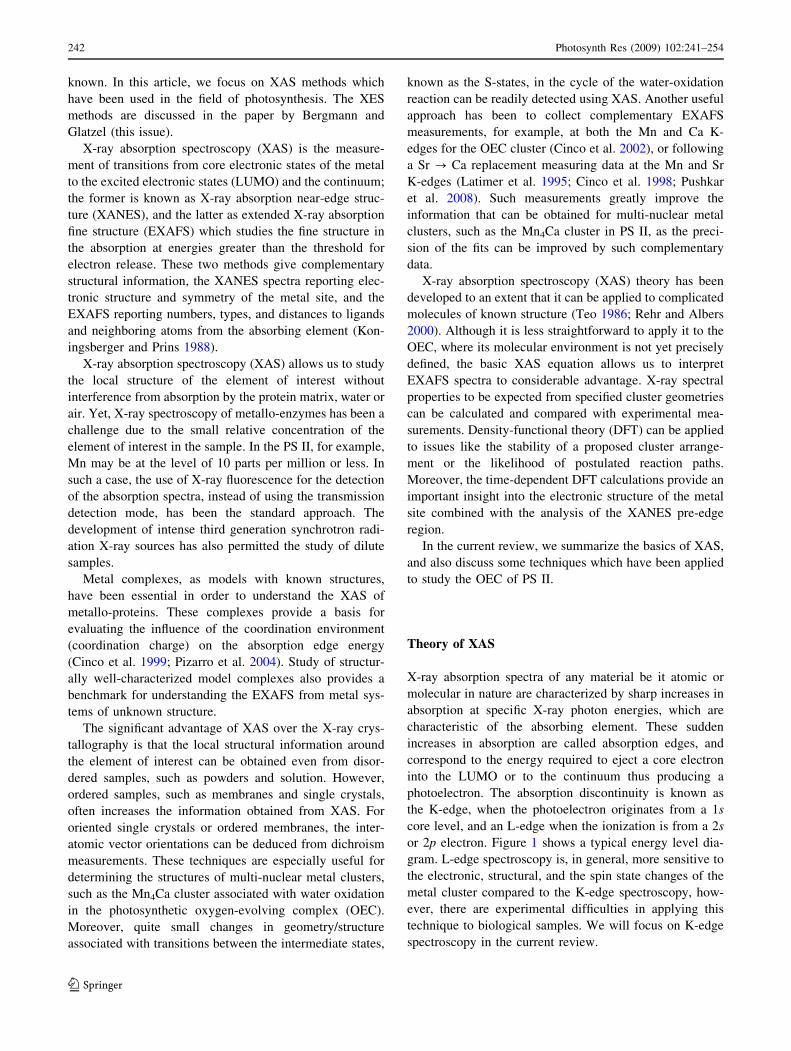
Fig. 2 a The Mn K-edge
XANES and EXAFS spectra.
Top left: the X-ray absorption
spectrum from a PS II sample
showing the XANES and
EXAFS regions of the spectrum.
The energy levels are indicated
on top of the panel. The
enlargements show the Mn K-
edge XANES and the k-space
EXAFS spectrum. The Fourier
transform of the k-space
EXAFS data is shown on the
right. b A schematic of the
outgoing and backscattered
photoelectron wave, which
illustrates the concept of
interference in EXAFS. Left:E1 is the energy of the incident
X-ray photon. The central atom
(blue) is the absorbing atom and
the photoelectron is
backscattered from the
surrounding atoms (red). The
backscattered wave from the
surrounding atoms (dashed bluecircular lines) is in phase with
the outgoing wave (solid bluecircular lines). This leads to an
increase in the absorption
coefficient at E1. Right:similarly, at energy E2 [ E1
(notice that the wavelength of
the photo-electron is shorter at
E2 compared to E1), the
backscattered wave can
destructively interfere with the
outgoing wave, which leads to a
decrease in the cross section.
The attenuation in the cross
section in the absorption
coefficient, called EXAFS, is a
consequence of this
phenomenon
244 Photosynth Res (2009) 102:241–254
123
Page 5
thermal vibrations of the absorbing and scattering atoms.
Equation 4 is modified to include this disorder term or the
Debye–Waller factor e�2r2aj
k2
; where raj is the root-mean-
square deviation to give the following equation:
vðkÞ ¼X
j
Nj fjðp; k;RajÞ�� ��
kR2aj
e�2r2aj
k2
sin½2kRaj þ aajðkÞ�: ð5Þ
The loss of photoelectrons to inelastic scattering
processes can be accounted for by including a term,
e�2Raj=kjðkÞ; which reflects losses due to inelastic
scattering, where kj(k) is the electron mean free path.
Thus, the EXAFS contribution from each backscattering
atom j is a damped sine wave in k-space, with an
amplitude, and a phase, which are both dependent on k.
Additionally, S02 is introduced as an amplitude reduction
factor due to shake-up/shake-off processes at the central
atom(s). This factor can be set for fits, on the basis of fits
to model compounds. Thus, the following EXAFS
equation is used to fit the experimental Fourier isolates
using N, R, and r2 as variable parameters,
vðkÞ ¼ S20
X
j
Nj fjðp; kÞ�� ��kR2
aj
e�2r2aj
k2
e�2Raj=kjðkÞ
� sinð2kRaj þ aajðkÞÞ: ð6Þ
From the phase of each sine wave [2kRaj ? aaj(k)], the
absorber–backscatterer distance Raj can be determined if
the phase shift aaj(k) is known. The phase shift is obtained
either from theoretical calculations or empirically from
compounds characterized by crystallography with the
specific absorber–backscatterer pair of atoms. The phase
shift aaj(k) depends on both the absorber and the scatterer
atoms. As one knows the absorbing atom in an EXAFS
experiment, an estimation of the phase shift can be used in
identifying the scattering atom.
The amplitude function contains the Debye–Waller
factor and Nj, the number of backscatterers at Raj. These
two parameters are highly correlated, which makes the
determination of Nj difficult. The backscattering ampli-
tude function fj(p, k) depends on the atomic number of
the scattering atom, and scattering intensity increases
with the electron density (i.e., atomic number) of the
scattering atom. In principle, this can be used to identify
the scattering atoms. In practice, however, the phase shift
and backscattering amplitude function, both of which are
dependent on the identity of the backscattering atom, can
be used only to identify scattering atoms that are well
separated by atomic number (Rehr and Albers 2000).
The EXAFS fit-quality is evaluated using two different
parameters U and e2.
U ¼XNT
1
1
si
� �2
½vexptðkiÞ � vcalcðkiÞ�2; ð7Þ
where NT is the total number of data points collected,
vexptðkiÞ is the experimental EXAFS amplitude at ki, and
vcalcðkiÞ is the theoretical EXAFS amplitude at ki. The
normalization factor si is given by
1
si
¼ k3iPNT
j k3j vexptðkjÞ�� ��: ð8Þ
The e2 error takes into account the number of variable
parameters p in the fit and the number of independent data
points Nind is given by
e2 ¼ Nind
Nind � p
� �N�1
T U; ð9Þ
which is estimated from the Nyquist sampling theorem,
Nind ¼2DkDr
p; ð10Þ
where Dk is the k-range of the data and Dr is the width of
the Fourier-filtered peak in A. e2 provides a gauge of
whether the addition of another shell to the fit is justified. A
detailed description of error analysis is presented by Lytle
et al. (1989).
The importance of the EXAFS technique to the bio-
chemist or structural biologist depends directly on the fact
that the EXAFS modulations contain information about the
distance between the absorbing and backscattering atoms
within a distance of about 5 A, as well as the identity and
number of the backscattering atoms. Essentially, EXAFS
analysis is used to determine the radial distribution of
atoms around a particular absorbing atom, thus providing a
probe for the local structure in the vicinity of the absorbing
atom; for example, the metal in the active site of an
enzyme. These vector lengths (distances) can be deter-
mined to a precision of 0.02 A and much more precisely
than by conventional X-ray crystallography.
Advantages and limitations of XAS
We summarized the advantages and the limitations
(Eisenberger and Brown 1979) of the XAS method as follows.
Advantages
(1) X-ray absorption spectroscopy (XAS) is element
specific, so one can focus on one element without
interference from other elements present in the sam-
ple. In a protein, which has more than one metal like
cytochrome oxidase (Cu and Fe), or nitrogenase (Fe
Photosynth Res (2009) 102:241–254 245
123
Page 6
and Mo), it is possible to study the structural envi-
ronment of each metal atom selectively. The element
specificity and the fact that it is always possible to
obtain an X-ray spectrum of an element also means
that one ‘sees’ all of the metal of interest, which is
present in the sample. This makes it imperative that
one is sure of the biochemical homogeneity of the
sample and, if there is more than one site for the same
metal, to resolve the structural parameters of the
different sites.
(2) Another important advantage of XAS is that the metal
of interest is never ‘silent’ with respect to X-ray
absorption spectra. The system could be ‘silent’ with
respect to EPR, optical, or other spectroscopic
methods, but one can always probe the metal site
structure by XAS.
(3) X-ray absorption spectroscopy (XAS) is not limited
by the state of the sample, because it is sensitive only
to the local metal site structure. The sample can be
prepared as a powder, a solution or, as is done most
often, as a frozen solution for biological samples. It is
not necessary to obtain single crystals of the material
to examine the local structure of the metal. However,
having oriented crystals such as membranes and
single crystals significantly increases the structural
information obtained from the XAS method. This will
be discussed in a latter section.
The more important aspect is that one can either trap
intermediates in the enzymatic cycle or modify the
site by the addition of inhibitors or substrate or
generate other chemical modifications. Such samples
can be made as frozen solutions, avoiding the
problems of trying to obtain single crystals. The
study by this technique of trapped intermediates and
treated samples has yielded insights into the mech-
anism of the reaction involved, in several biological
systems.
(4) Damage to biological samples by X-rays is cause for
serious concern for X-ray crystallography and XAS
experiments. However, with the right precautions one
can successfully perform these experiments leaving
the materials largely intact. The most serious damage
is produced by the reaction with free radicals and
hydrated electrons that are produced in biological
samples by X-rays. The diffusion of the free radicals
and hydrated electrons can be minimized by the use
of low temperatures. The use of a liquid He flow
cryostat or liquid He cryostream, where the samples
are at atmospheric pressure in a He gas atmosphere,
has greatly reduced the risk of sample damage by
X-rays. XAS experiments require a lower X-ray dose
than X-ray crystallography, and radiation damage can
be precisely monitored and controlled, thus allowing
for data collection from an intact metal cluster (Yano
et al. 2005b; Corbett et al. 2007).
Limitations
(1) It is also important to realize the intrinsic limitations
of EXAFS, beyond those of a purely experimental
nature. A frequent problem is the inability to distin-
guish between scattering atoms with little difference
in atomic number (C, N, O or S, Cl, or Mn, Fe). Care
must also be exercised when deciding between atoms
that are apart in Z, as frequently, it is possible to
obtain equally good fits using backscattering atoms
which are very different in Z (e.g., Mn or Cl), but
which are at different distances from the absorbing
atom. This is more acute when dealing with Fourier
peaks at greater distances. In bridged multinuclear
centers, it is not always possible to unequivocally
assign the Fourier peaks at[3 A (Scott and Eidsness
1988).
(2) Distances are usually the most reliably determined
structural parameters from EXAFS. But the range of
data that can be collected, often-times due to practical
reasons like the presence of the K-edge of another
metal, limits the resolution of distance determinations
to between 0.1 and 0.2 A. Also it is difficult to
determine whether a Fourier peak should be fit to one
distance with a relatively large disorder parameter or
to two distances, each having a small disorder
parameter. Careful statistical analysis, taking into
consideration the degrees of freedom in the fits,
should precede any such analysis. The resolution in
the distance Dr can be estimated from the relation that
DrDk * 1 (see ‘‘Range-extended XAS’’).
(3) Determination of coordination numbers or number of
backscatterers is fraught with difficulties. The Debye–
Waller factor is strongly correlated with the coordi-
nation number and one must have recourse to other
information to narrow the range that is possible from
curve-fitting analysis alone. It is useful to compare the
spectra from the unknown complex to some known
model complexes (assuming that there is evidence
that the structure resembles that of the model
complex) and then use Debye–Waller parameters
obtained from the model complexes in the fits. This
method works reasonably well, when the structure of
the system being studied is well-modeled by inor-
ganic complexes.
246 Photosynth Res (2009) 102:241–254
123
Page 7
X-ray absorption spectroscopy studies
of photosystem II
One of the advantages of XAS is that one can potentially
study the chemical events from each element which is
involved in the reaction. In the OEC, Mn, Ca, and possibly
Cl are the key elements we can focus on, in order to obtain
the mechanistic information during the catalytic cycle. The
XAS results, with emphasis on results from our laboratory,
will be used to highlight the utility of the technique for the
study of the Mn4Ca cluster in PS II.
Mn XAS
The geometric and electronic structural changes of the OEC
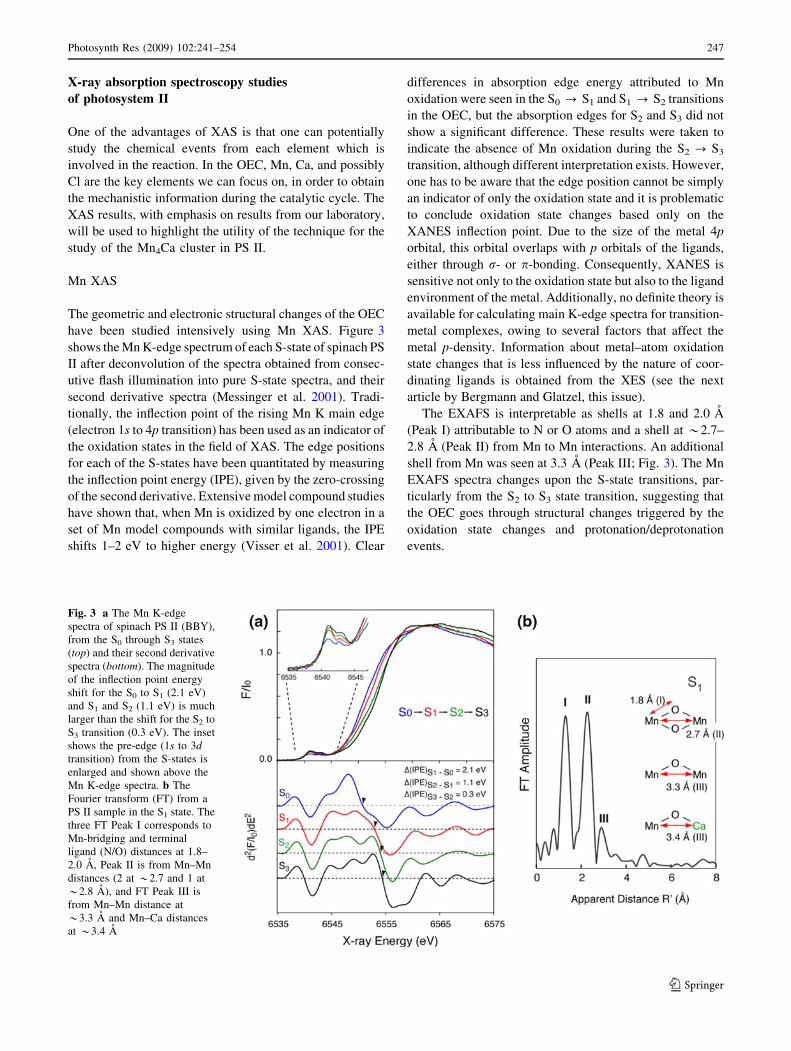
have been studied intensively using Mn XAS. Figure 3
shows the Mn K-edge spectrum of each S-state of spinach PS
II after deconvolution of the spectra obtained from consec-
utive flash illumination into pure S-state spectra, and their
second derivative spectra (Messinger et al. 2001). Tradi-
tionally, the inflection point of the rising Mn K main edge
(electron 1s to 4p transition) has been used as an indicator of
the oxidation states in the field of XAS. The edge positions
for each of the S-states have been quantitated by measuring
the inflection point energy (IPE), given by the zero-crossing
of the second derivative. Extensive model compound studies
have shown that, when Mn is oxidized by one electron in a
set of Mn model compounds with similar ligands, the IPE
shifts 1–2 eV to higher energy (Visser et al. 2001). Clear
differences in absorption edge energy attributed to Mn
oxidation were seen in the S0 ? S1 and S1 ? S2 transitions
in the OEC, but the absorption edges for S2 and S3 did not
show a significant difference. These results were taken to
indicate the absence of Mn oxidation during the S2 ? S3
transition, although different interpretation exists. However,
one has to be aware that the edge position cannot be simply
an indicator of only the oxidation state and it is problematic
to conclude oxidation state changes based only on the
XANES inflection point. Due to the size of the metal 4p
orbital, this orbital overlaps with p orbitals of the ligands,
either through r- or p-bonding. Consequently, XANES is
sensitive not only to the oxidation state but also to the ligand
environment of the metal. Additionally, no definite theory is
available for calculating main K-edge spectra for transition-
metal complexes, owing to several factors that affect the
metal p-density. Information about metal–atom oxidation
state changes that is less influenced by the nature of coor-
dinating ligands is obtained from the XES (see the next
article by Bergmann and Glatzel, this issue).
The EXAFS is interpretable as shells at 1.8 and 2.0 A
(Peak I) attributable to N or O atoms and a shell at *2.7–
2.8 A (Peak II) from Mn to Mn interactions. An additional
shell from Mn was seen at 3.3 A (Peak III; Fig. 3). The Mn
EXAFS spectra changes upon the S-state transitions, par-
ticularly from the S2 to S3 state transition, suggesting that
the OEC goes through structural changes triggered by the
oxidation state changes and protonation/deprotonation
events.
Fig. 3 a The Mn K-edge
spectra of spinach PS II (BBY),
from the S0 through S3 states
(top) and their second derivative
spectra (bottom). The magnitude
of the inflection point energy
shift for the S0 to S1 (2.1 eV)
and S1 and S2 (1.1 eV) is much
larger than the shift for the S2 to
S3 transition (0.3 eV). The inset
shows the pre-edge (1s to 3dtransition) from the S-states is
enlarged and shown above the
Mn K-edge spectra. b The
Fourier transform (FT) from a
PS II sample in the S1 state. The
three FT Peak I corresponds to
Mn-bridging and terminal
ligand (N/O) distances at 1.8–
2.0 A, Peak II is from Mn–Mn
distances (2 at *2.7 and 1 at
*2.8 A), and FT Peak III is
from Mn–Mn distance at
*3.3 A and Mn–Ca distances
at *3.4 A
Photosynth Res (2009) 102:241–254 247
123
Page 8
Co-factor XAS
The S-state catalytic cycle can be studied also by co-factor
XAS studies (Cinco et al. 2002). One Ca is known to be a
part of the OEC, and this has been proven by Ca XAS
studies and from X-ray crystallography using the anoma-
lous diffraction technique. Regarding Cl, there is no
spectroscopic evidence at least in the S1 state that the Cl is
a direct ligand to the OEC, although several biochemical
studies suggest a critical role for one tightly bound Cl in
maintaining oxygen-evolving activity.
In general, the requirements of X-ray spectroscopy place
some restrictions with respect to sample preparation and
experimental conditions. Ca and Cl in some sense fall into
this category. The investigation of light elements can
present difficulties due to the presence of an aqueous
medium and the pervasive occurrence of C, N, and O in
biological materials. In X-ray energy regions, where
atmospheric gases absorb, samples must be placed in an
atmosphere of helium or in vacuum. For elements like Ca
and Cl, which can occur in a wide variety of environments
in biological materials, it is particularly challenging to
remove sources of background signals that greatly com-
plicate interpreting the results.
Another strategy to study the role of such light element
co-factor(s) is to replace it with heavier element(s). Ca can
be replaced chemically or biosynthetically with Sr without
losing its enzymatic activity. Similarly, Cl can be substi-
tuted with Br. XAS measurements at the Sr K-edge
(16,200 eV; Cinco et al. 1998; Pushkar et al. 2008) or Br
K-edge (13,600 eV; Haumann et al. 2006) compared to
those at lower-energy Ca K-edge (*4,050 eV) or Cl K-
edge (*2,850 eV) are less prone to X-ray damage, if we
compare the X-ray damage by the total number of X-ray
photons per area at each energy. It is also preferred for
experimental reasons as X-rays at higher energies are
attenuated less by the air path, the buffer solution in which
the sample is made, and the cryostat windows.
Range-extended XAS
In general, EXAFS spectra of systems which contain adja-
cent elements in the periodic table have a limited EXAFS
range due to the presence of the rising edge of the next
element, thus limiting the EXAFS distance resolution. For
the Mn K-edge EXAFS studies of PS II, the absorption edge
of Fe in PS II limits the EXAFS energy range (Fig. 4).
Traditional EXAFS spectra of PS II samples are collected as
an excitation spectrum by electronically windowing the Kafluorescence (2p to 1s, at 5,899 eV) from the Mn atom. The
solid-state detectors that have been used over the past
decade have a resolution of about 150–200 eV (FWHM) at
the Mn K-edge, making it impossible to discriminate Mn
fluorescence from that of Fe Ka fluorescence (at 6,404 eV).
The presence of the obligatory 2–3Fe/PS II (Fe edge at
7,120 eV) limits, the data to a k-range of *11.5 A-1
(k = 0.51 DE1/2, the Mn edge is at 6,540 eV and
Fig. 4 a Left (top): X-ray fluorescence of Mn and Fe. The multi-
crystal monochromator with 1 eV resolution is tuned to the Mn Ka1
peak (red spectrum). Left (below): fluorescence peaks of Mn and Fe as
detected using Ge-detector. The fluorescence peaks are convoluted
with the electronic window resolution of 150–200 eV of the Ge-
detector (black and green spectra for Mn and Fe fluorescence). Note
different energy scales for the schemes shown above and below. Iron
is an obligatory element in functional PS II complexes. Right:Comparison of the traditional Mn K-edge EXAFS spectrum (blue)
from the S1 state PS II sample obtained with a traditional 30-element
energy-discriminating Ge-detector with a spectrum collected using
the high-resolution crystal monochromator (note the absence of Fe
contribution). The dashed line at k = 11.5 A-1 denotes the spectral
limit of a conventional EXAFS experiment owing to the iron edge.
Use of the high-resolution detector eliminates the interference of Fe
and removes the limit of the energy range for Mn EXAFS data
collection. b The comparison of the k-space Mn EXAFS collected
with a crystal monochromator and a Ge-detector. The range of data,
as indicated by kmax, is inversely proportional to the resolution of the
data
248 Photosynth Res (2009) 102:241–254
123
Page 9
DE = 580 eV). The Mn–Mn and Mn–ligand distances that
can be resolved in a typical EXAFS experiment are given by
DR ¼ p=2kmax; ð11Þ
where kmax is the maximum energy of the photoelectron of
Mn.
The use of a high-resolution crystal monochromator (see
the article by Bergmann and Glatzel, this issue) allows us
to selectively separate the Mn K fluorescence from that of
Fe (Fig. 4), resulting in the collection of data to higher
photoelectron energies and leading to increased distance
resolution of 0.1 A. The new detection scheme produces
distinct advantages: (1) improvement in the distance reso-
lution, and (2) more precise determination in the numbers
of metal–metal vectors.
These data resolve a distance heterogeneity in the short
Mn–Mn distances of the S1 and S2 state and thereby pro-
vide firm evidence for three Mn–Mn distances between
*2.7 and *2.8 A (Yano et al. 2005a; Pushkar et al. 2007).
This result gives clear criteria for selecting and refining
possible structures from the repertoire of proposed models
based on spectroscopic and diffraction data.
Polarized XAS
Polarized XAS studies on oriented membranes
Membrane proteins like PS II can be oriented on a substrate
such that the lipid membrane planes are roughly parallel to
the substrate surface. This imparts a one-dimensional order
to these samples, while the z-axis for each membrane
(collinear with the membrane normal) is roughly parallel to
the substrate normal, the x and y axes remain disordered.
Exploiting the plane-polarized nature of synchrotron radi-
ation, spectra can be collected at different angles between
the substrate normal and the X-ray E vector. The dichro-
ism, which is the dependence of the intensity of the
absorber–backscatterer pairs present in the oriented sam-
ples as a function of the polarization of the X-rays, is
reflected in, and can be extracted from, the resulting X-ray
absorption spectra (George et al. 1989, 1993). The EXAFS
of the oriented PS II samples exhibits distinct dichroism,
from which we have deduced the relative orientations of
several interatomic vector directions relative to the mem-
brane normal and derived a topological representation of
the metal sites in the OEC (Mukerji et al. 1994; Dau et al.
1995; Cinco et al. 2004; Pushkar et al. 2007).
To a first order approximation, the angle dependence of
the EXAFS is proportional to cos2(hER), with hER being the
angle between the X-ray electric field vector (E) and the
absorber–backscatter vector (R) (Fig. 5a). In turn, hER is
Fig. 5 a Scheme for the vectors and angles involved in X-ray
absorption linear dichroism of one-dimensionally oriented (PS II)
membrane fragments on a flat surface. For the polarized EXAFS
experiment, spectra are measured for several values of h (angle
between the X-ray electric field vector E and the substrate normal
S); hER is the angle between, E and the absorber–scatterer vector,
R. hER is composed of the detection angle h and the angle /between R and M, the absorber–backscatterer vector and the
membrane normal. Because of the rotational symmetry of
the layered membranes, the angle / defines a cone around the
membrane normal, M. When membranes are layered on a flat
substrate, the preferential orientation of M is parallel to the
underlying substrate normal, S. For an ensemble of R vectors, the
magnitude of the EXAFS is related to the Pa-weighted integration
over all possible orientations of M (a- and b-integration) and along
the cone of possible directions of R (c-integration). b Mn K-edge
EXAFS spectra (k3-weighted) from oriented PS II membrane
samples in the S1 state obtained with a high-resolution spectrom-
eter (range-extended EXAFS) at orientations of 15� (green solidline) and 75� (red dashed line) of the sample normal with respect
to the X-ray E-vector. The orientation of the X-ray E-vector with
respect to the membrane normal is shown as an inset. c The
structural information from the dichroism of FT peak III is
illustrated showing the orientation of the average Mn–Ca vector in
relation to the Mn–Mn vector. The cones represent a range for the
average Mn–Ca vector(s) along the membrane normal, and the
Mn–Mn vector toward the membrane plane, respectively
Photosynth Res (2009) 102:241–254 249
123
Page 10
composed of the detection angle h and the angle / between
R and M, the membrane normal. Due to the rotational
symmetry of the layered membranes, the angle / defines a
cone around the membrane normal M. When membranes
are layered on a flat substrate, the preferential orientation
of M is parallel to the underling substrate normal (S). For
those imperfectly stacked sheets, the probability (Pa) of
finding an angle a between M and S is the product of sinaand the order function Pord(a), which is maximal at a = 0�.
Pord(a) is approximated by a Gaussian distribution whose
half-width is the mosaic spread (X) or the disorder angle.
Here, the mosaic spread is assumed to account for the
disorder between the membrane normal and substrate
normal, while the spread of R relative to M is negligible.
For an ensemble of A–B vectors (R), the magnitude of the
EXAFS is related to the Pa-weighted integration over all
possible orientations of M (a- and b-integration) and along
the cone of the possible directions of R (c-integration).
The Napp found from EXAFS curve-fitting on oriented
samples at particular h is related to the coordination
number of an isotropic sample Niso by the following
equation:
NappðhÞ ¼ Niso þ1
2Nisoð3 cos2 h� 1Þ � ð3 cos2 /� 1Þ � Iord;
ð12Þ
where Iord is the order integral:
Iord ¼1
2
Rp=2
0
sin a 3 cos2 a� 1ð Þ exp �a2 ln 2X2
� �da
Rp=2
0
sin a exp �a2 ln 2X2
� �da
: ð13Þ
By fitting the h-dependence of Napp by nonlinear
regression analysis, the average relative orientation / and
Napp can be obtained.
Figure 5b shows the orientation of the membranes with
respect to the X-ray E-vector and an example of the
polarized spectrum from PS II.
However, as the samples are ordered in only one
dimension, the dichroism information is available only in
the form of an angle with respect to the membrane normal.
For EXAFS measurements, this means that the absorber–
backscatterer vectors can lie anywhere on a cone defined
by the angle the vector forms with the membrane normal as
shown in Fig. 5c.
Polarized XAS studies using single crystals of PS II
Further refinement can be performed if samples with three-
dimensional order, i.e., single crystals, are examined
instead of oriented membranes. Single-crystal X-ray
spectroscopy has been performed on model complexes
(Pickering and George 1995) and metallo-proteins (Scott
et al. 1982; Flank et al. 1986; George et al. 1999). These
studies have been able to significantly expand the X-ray
absorption spectroscopic information available for these
systems over what is gleaned from studies of isotropic
samples. An example of polarized XANES and EXAFS
spectra from a Mn(V) complex is shown in Fig. 6a and b.
This type of analysis can also be useful for systems,
where a high-resolution X-ray crystal structure is not
available, such as PS II. Examination of the orientation
dependence of the EXAFS of single crystals will provide
structural information about the Mn sites at resolution
higher than will be practically obtainable from single-
crystal X-ray diffraction. Performing single-crystal EXAFS
experiments can help to refine the low-resolution structure
of the OEC by revealing information such as the angle(s)
between the di-l-oxo-bridged Mn–Mn vectors (*2.7 A),
as well as the relative orientation between the mono-l-oxo
Mn–Mn vector (*3.3 A) and the di-l-oxo-bridged Mn–
Mn vectors. The directions of the Mn–Mn vectors in con-
junction with the electron density derived from X-ray
crystallography promises to refine the structure of the Mn
complex to a resolution that neither method has presently
achieved.
Fig. 6 Polarized Mn XAS
spectra of Mn(V)-oxo
compound (inset). a Polarized
XANES spectra. The pre-edge
peak is most intense when the
X-ray E-vector is parallel to the
Mn-oxo bond. b Polarized
EXAFS spectra in the two
extreme orientations. The
distinct dichroism in the
XANES and EXAFS spectra
show the utility of the polarized
XAS methodology
250 Photosynth Res (2009) 102:241–254
123
Page 11
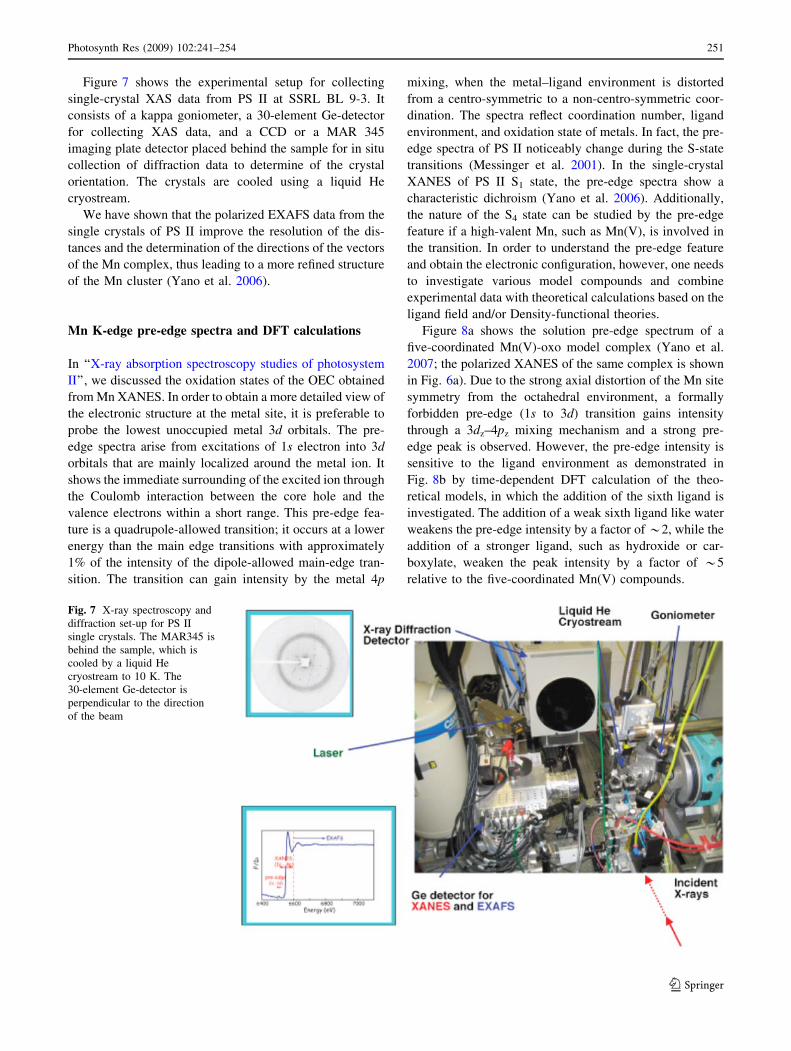
Figure 7 shows the experimental setup for collecting
single-crystal XAS data from PS II at SSRL BL 9-3. It
consists of a kappa goniometer, a 30-element Ge-detector
for collecting XAS data, and a CCD or a MAR 345
imaging plate detector placed behind the sample for in situ
collection of diffraction data to determine of the crystal
orientation. The crystals are cooled using a liquid He
cryostream.
We have shown that the polarized EXAFS data from the
single crystals of PS II improve the resolution of the dis-
tances and the determination of the directions of the vectors
of the Mn complex, thus leading to a more refined structure
of the Mn cluster (Yano et al. 2006).
Mn K-edge pre-edge spectra and DFT calculations
In ‘‘X-ray absorption spectroscopy studies of photosystem
II’’, we discussed the oxidation states of the OEC obtained
from Mn XANES. In order to obtain a more detailed view of
the electronic structure at the metal site, it is preferable to
probe the lowest unoccupied metal 3d orbitals. The pre-
edge spectra arise from excitations of 1s electron into 3d
orbitals that are mainly localized around the metal ion. It
shows the immediate surrounding of the excited ion through
the Coulomb interaction between the core hole and the
valence electrons within a short range. This pre-edge fea-
ture is a quadrupole-allowed transition; it occurs at a lower
energy than the main edge transitions with approximately
1% of the intensity of the dipole-allowed main-edge tran-
sition. The transition can gain intensity by the metal 4p
mixing, when the metal–ligand environment is distorted
from a centro-symmetric to a non-centro-symmetric coor-
dination. The spectra reflect coordination number, ligand
environment, and oxidation state of metals. In fact, the pre-
edge spectra of PS II noticeably change during the S-state
transitions (Messinger et al. 2001). In the single-crystal
XANES of PS II S1 state, the pre-edge spectra show a
characteristic dichroism (Yano et al. 2006). Additionally,
the nature of the S4 state can be studied by the pre-edge
feature if a high-valent Mn, such as Mn(V), is involved in
the transition. In order to understand the pre-edge feature
and obtain the electronic configuration, however, one needs
to investigate various model compounds and combine
experimental data with theoretical calculations based on the
ligand field and/or Density-functional theories.
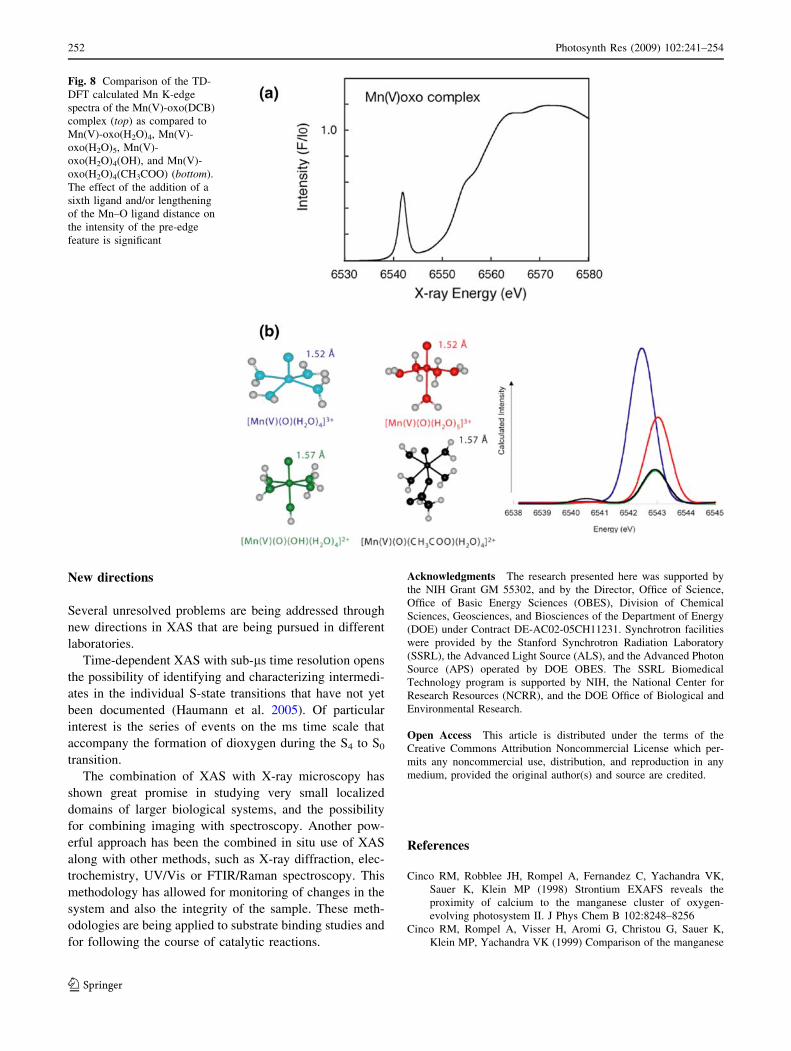
Figure 8a shows the solution pre-edge spectrum of a
five-coordinated Mn(V)-oxo model complex (Yano et al.
2007; the polarized XANES of the same complex is shown
in Fig. 6a). Due to the strong axial distortion of the Mn site
symmetry from the octahedral environment, a formally
forbidden pre-edge (1s to 3d) transition gains intensity
through a 3dz–4pz mixing mechanism and a strong pre-
edge peak is observed. However, the pre-edge intensity is
sensitive to the ligand environment as demonstrated in
Fig. 8b by time-dependent DFT calculation of the theo-
retical models, in which the addition of the sixth ligand is
investigated. The addition of a weak sixth ligand like water
weakens the pre-edge intensity by a factor of *2, while the
addition of a stronger ligand, such as hydroxide or car-
boxylate, weaken the peak intensity by a factor of *5
relative to the five-coordinated Mn(V) compounds.
Fig. 7 X-ray spectroscopy and
diffraction set-up for PS II
single crystals. The MAR345 is
behind the sample, which is
cooled by a liquid He
cryostream to 10 K. The
30-element Ge-detector is
perpendicular to the direction
of the beam
Photosynth Res (2009) 102:241–254 251
123
Page 12
New directions
Several unresolved problems are being addressed through
new directions in XAS that are being pursued in different
laboratories.
Time-dependent XAS with sub-ls time resolution opens
the possibility of identifying and characterizing intermedi-
ates in the individual S-state transitions that have not yet
been documented (Haumann et al. 2005). Of particular
interest is the series of events on the ms time scale that
accompany the formation of dioxygen during the S4 to S0
transition.
The combination of XAS with X-ray microscopy has
shown great promise in studying very small localized
domains of larger biological systems, and the possibility
for combining imaging with spectroscopy. Another pow-
erful approach has been the combined in situ use of XAS
along with other methods, such as X-ray diffraction, elec-
trochemistry, UV/Vis or FTIR/Raman spectroscopy. This
methodology has allowed for monitoring of changes in the
system and also the integrity of the sample. These meth-
odologies are being applied to substrate binding studies and
for following the course of catalytic reactions.
Acknowledgments The research presented here was supported by
the NIH Grant GM 55302, and by the Director, Office of Science,
Office of Basic Energy Sciences (OBES), Division of Chemical
Sciences, Geosciences, and Biosciences of the Department of Energy
(DOE) under Contract DE-AC02-05CH11231. Synchrotron facilities
were provided by the Stanford Synchrotron Radiation Laboratory
(SSRL), the Advanced Light Source (ALS), and the Advanced Photon
Source (APS) operated by DOE OBES. The SSRL Biomedical
Technology program is supported by NIH, the National Center for
Research Resources (NCRR), and the DOE Office of Biological and
Environmental Research.
Open Access This article is distributed under the terms of the
Creative Commons Attribution Noncommercial License which per-
mits any noncommercial use, distribution, and reproduction in any
medium, provided the original author(s) and source are credited.
References
Cinco RM, Robblee JH, Rompel A, Fernandez C, Yachandra VK,
Sauer K, Klein MP (1998) Strontium EXAFS reveals the
proximity of calcium to the manganese cluster of oxygen-
evolving photosystem II. J Phys Chem B 102:8248–8256
Cinco RM, Rompel A, Visser H, Aromi G, Christou G, Sauer K,
Klein MP, Yachandra VK (1999) Comparison of the manganese
Fig. 8 Comparison of the TD-
DFT calculated Mn K-edge
spectra of the Mn(V)-oxo(DCB)
complex (top) as compared to
Mn(V)-oxo(H2O)4, Mn(V)-
oxo(H2O)5, Mn(V)-
oxo(H2O)4(OH), and Mn(V)-
oxo(H2O)4(CH3COO) (bottom).
The effect of the addition of a
sixth ligand and/or lengthening
of the Mn–O ligand distance on
the intensity of the pre-edge
feature is significant
252 Photosynth Res (2009) 102:241–254
123
Page 13
cluster in oxygen-evolving photosystem II with distorted cubane
manganese compounds through X-ray absorption spectroscopy.
Inorg Chem 38:5988–5998
Cinco RM, Holman KLM, Robblee JH, Yano J, Pizarro SA,
Bellacchio E, Sauer K, Yachandra VK (2002) Calcium EXAFS
establishes the Mn-Ca cluster in the oxygen-evolving complex of
photosystem II. Biochemistry 41:12928–12933
Cinco RM, Robblee JH, Messinger J, Fernandez C, Holman KLM,
Sauer K, Yachandra VK (2004) Orientation of calcium in the
Mn4Ca cluster of the oxygen-evolving complex determined
using polarized strontium EXAFS of photosystem II membranes.
Biochemistry 43:13271–13282
Corbett MC, Latimer MJ, Poulos TL, Sevrioukova IF, Hodgson KO,
Hedman B (2007) Photoreduction of the active site of the
metalloprotein putidaredoxin by synchrotron radiation. Acta
Crystallogr Sect D 63:951–960
Dau H, Andrews JC, Roelofs TA, Latimer MJ, Liang W, Yachandra VK,
Sauer K, Klein MP (1995) Structural consequences of ammonia
binding to the manganese cluster of the photosynthetic oxygen-
evolving complex: an X-ray absorption study of isotropic and
oriented photosystem II particles. Biochemistry 34:5274–5287
Eisenberger P, Brown GS (1979) Study of disordered systems by
EXAFS: limitations. Solid State Commun 29:481–484
Eisenberger P, Kincaid BM (1978) EXAFS: new horizons in structure
determinations. Science 200:1441–1447
Flank AM, Weininger M, Mortenson LE, Cramer SP (1986) Single-
crystal EXAFS of nitrogenase. J Am Chem Soc 108:1049
George GN, Prince RC, Cramer SP (1989) The manganese site of the
photosynthetic water-splitting enzyme. Science 243:789–791
George GN, Cramer SP, Frey TG, Prince RC (1993) X-ray absorption
spectroscopy of oriented cytochrome oxidase. Biochim Biophys
Acta 1142:240–252
George GN, Pickering IJ, Kisker C (1999) X-ray absorption
spectroscopy of chicken sulfite oxidase crystals. Inorg Chem
38:2539
Haumann M, Liebisch P, Muller C, Barra M, Grabolle M, Dau H
(2005) Photosynthetic O2 formation tracked by time-resolved
X-ray experiments. Science 310:1019–1021
Haumann M, Barra M, Loja P, Loscher S, Krivanek R, Grundmeier A,
Andreasson LE, Dau H (2006) Bromide does not bind to the
Mn4Ca complex in its S1 state in Cl--depleted and Br--
reconstituted oxygen-evolving photosystem II: evidence from
X-ray absorption spectroscopy at the Br K-edge. Biochemistry
45:13101–13107
Koningsberger DC, Prins R (eds) (1988) X-ray absorption: principles,
applications, techniques of EXAFS, SEXAFS and XANES.
Wiley, New York
Latimer MJ, DeRose VJ, Mukerji I, Yachandra VK, Sauer K, Klein
MP (1995) Evidence for the proximity of calcium to the
manganese cluster of photosystem II: determination by X-ray
absorption spectroscopy. Biochemistry 34:10898–10909
Lytle FW, Sayers DE, Stern EA (1989) Report of the international
workshop on standards and criteria in X-ray absorption-spec-
troscopy (1988), Brookhaven National Laboratory. Physica B
158:701–722
Messinger J, Robblee JH, Bergmann U, Fernandez C, Glatzel P,
Visser H, Cinco RM, McFarlane KL, Bellacchio E, Pizarro SA,
Cramer SP, Sauer K, Klein MP, Yachandra VK (2001) Absence
of Mn-centered oxidation in the S2 ? S3 transition: implications
for the mechanism of photosynthetic water oxidation. J Am
Chem Soc 123:7804–7820
Mukerji I, Andrews JC, Derose VJ, Latimer MJ, Yachandra VK,
Sauer K, Klein MP (1994) Orientation of the oxygen-evolving
manganese complex in a photosystem-II membrane preparation:
an X-ray-absorption spectroscopy study. Biochemistry 33:9712–
9721
Penner-Hahn JE (1998) Structural characterization of the Mn site in
the photosynthetic oxygen-evolving complex. Struct Bond 90:1–
36
Pickering IJ, George GN (1995) Polarized X-ray-absorption spec-
troscopy of cupric chloride dihydrate. Inorg Chem 34:3142–3152
Pizarro SA, Glatzel P, Visser H, Robblee JH, Christou G, Bergmann
U, Yachandra VK (2004) Mn oxidation states in tri- and tetra-
nuclear Mn compounds structurally relevant to photosystem II:
Mn K-edge X-ray absorption and Kb X-ray emission spectros-
copy studies. Phys Chem Chem Phys 6:4864–4870
Pushkar Y, Yano J, Glatzel P, Messinger J, Lewis A, Sauer K,
Bergmann U, Yachandra V (2007) Structure and orientation of
the Mn4Ca cluster in plant photosystem II membranes studied by
polarized range-extended X-ray absorption spectroscopy. J Biol
Chem 282:7198–7208
Pushkar Y, Yano J, Sauer K, Boussac A, Yachandra VK (2008)
Structural changes in the Mn4Ca cluster and the mechanism of
photosynthetic water splitting. Proc Natl Acad Sci USA
105:1879–1884
Rehr JJ, Albers RC (2000) Theoretical approaches to X-ray absorp-
tion fine structure. Rev Mod Phys 72:621–654
Sauer K, Yano J, Yachandra VK (2008) X-ray spectroscopy of the
photosynthetic oxygen-evolving complex. Coord Chem Rev
252:318–335
Sayers DE, Stern EA, Lytle F (1971) New technique for investigating
noncrystalline structures: Fourier analysis of the extended X-ray-
absorption fine structure. Phys Rev Lett 27:1204–1207
Scott RA, Eidsness MK (1988) The use of X-ray absorption
spectroscopy for detection of metal-metal interactions. Applica-
tion to copper-containing enzymes. Comments Inorg Chem
7:235–267
Scott RA, Hahn JE, Doniach S, Freeman HC, Hodgson KO (1982)
Polarized X-ray absorption spectra of oriented plastocyanin
single crystals. Investigation of methionine-copper coordination.
J Am Chem Soc 104:5364–5369
Shulman RG, Yafet Y, Eisenberger P, Blumberg WE (1976)
Observation and interpretation of X-ray absorption edges in iron
compounds and proteins. Proc Natl Acad Sci USA 73:1384–
1388
Teo BK (1986) EXAFS: basic principles and data analysis. Springer,
Berlin
Visser H, Anxolabehere-Mallart E, Bergmann U, Glatzel P, Robblee
JH, Cramer SP, Girerd JJ, Sauer K, Klein MP, Yachandra VK
(2001) Mn K-edge XANES and Kb XES studies of two Mn-oxo
binuclear complexes: investigation of three different oxidation
states relevant to the oxygen-evolving complex of photosystem
II. J Am Chem Soc 123:7031–7039
Yachandra VK (2005) The catalytic manganese-cluster: organization
of the metal ions. In: Wydrzynski T, Satoh S (eds) Photosystem
II: the light-driven water: plastoquinone oxidoreductase.
Springer, Dordrecht, pp 235–260
Yachandra VK, Sauer K, Klein MP (1996) Manganese cluster in
photosynthesis: where plants oxidize water to dioxygen. Chem
Rev 96:2927–2950
Yano J, Yachandra VK (2007) Oxidation state changes of the Mn4Ca
cluster in photosystem II. Photosynth Res 92:289–303
Yano J, Yachandra VK (2008) Where water is oxidized to dioxygen:
Structure of the photosynthetic Mn4Ca cluster from X-ray
spectroscopy. Inorg Chem 47:1711–1726
Yano J, Pushkar Y, Glatzel P, Lewis A, Sauer K, Messinger J,
Bergmann U, Yachandra VK (2005a) High-resolution Mn
EXAFS of the oxygen-evolving complex in photosystem II:
structural implications for the Mn4Ca cluster. J Am Chem Soc
127:14974–14975
Yano J, Kern J, Irrgang K-D, Latimer MJ, Bergmann U, Glatzel P,
Pushkar Y, Biesiadka J, Loll B, Sauer K, Messinger J, Zouni A,
Photosynth Res (2009) 102:241–254 253
123
Page 14
Yachandra VK (2005b) X-ray damage to the Mn4Ca complex in
photosystem II crystals: a case study for metallo-protein X-ray
crystallography. Proc Natl Acad Sci USA 102:12047–12052
Yano J, Kern J, Sauer K, Latimer M, Pushkar Y, Biesiadka J, Loll B,
Saenger W, Messinger J, Zouni A, Yachandra VK (2006) Where
water is oxidized to dioxygen: structure of the photosynthetic
Mn4Ca cluster. Science 314:821–825
Yano J, Robblee J, Pushkar Y, Marcus MA, Bendix J, Workman JM,
Collins TJ, Solomon EI, George SD, Yachandra VK (2007)
Polarized X-ray absorption spectroscopy of single-crystal Mn(V)
complexes relevant to the oxygen-evolving complex of photo-
system II. J Am Chem Soc 129:12989–13000
254 Photosynth Res (2009) 102:241–254
123