1 X-ray Computed Tomography and Nondestructive Evaluation of Clogging in Porous Concrete Field Samples Kalehiwot Nega Manahiloh 1 , Dr. Balasingam Muhunthan (Corresponding author) 2 , Dr. Masoud Kayhanian 3 , and Dr. Seyoum Yami Gebremariam 4 Abstract The aim of this study was to investigate and quantify clogging in pervious concrete samples from parking lots. Observation, analysis and processing of X-ray computed tomography images enabled to qualitatively relate porosity characteristics with clogging. Seven representative core samples were obtained from four different parking lots with permeability ranging from very low to very high. Porosity profiles from CT scanning were used to assess the nature and extent of clogging. Significantly lower porosity values were computed for older cores compared to newer ones. Also observed was, samples manifested clogged behavior because of high cement paste (mortar) content. Porosities of samples were recalculated, for comparison, using the gravimetric method and the clogged fraction in the cores was determined by recalculating porosities of specimens scanned after vacuum-cleaning. The clogged fraction varied from 1.48% in sample PL 12-1 to 11.15% in sample PL QP 45-3. CE Database subject headings: X-ray computed tomography, Porosity, Clogging, Pervious concrete, Image filtering, Image centering, Image segmentation, vacuum cleaning, Voxel. Citation information: Please cite this article as follows Manahiloh K.N., B. Muhunthan, M. Kayhanian, and S.Y. Gebremariam, X-Ray Computed Tomography and Nondestructive Evaluation of Clogging in Porous Concrete Field Samples. Journal of Materials in Civil Engineering, 2012. 24(8): p. 1103-1109. 1 Department of Civil and Environmental Engineering, Washington State University, Pullman, WA 99164-2910, Phone (509) 335-2576, [email protected]2 Department of Civil and Environmental Engineering, Washington State University, Pullman, WA 99164-2910, Phone (509) 335-3921, Fax (509) 335-7632, [email protected]3 Department of Civil and Environmental Engineering, University of California, Davis, CA 95616, Phone (530) 752-8957, Fax (530) 752-7872, [email protected]4 Department of Civil and Environmental Engineering, Washington State University, Pullman, WA 99164-2910, Phone (509) 335-2576, [email protected]
Transcript
1
X-ray Computed Tomography and Nondestructive Evaluation of Clogging in Porous
Concrete Field Samples
Kalehiwot Nega Manahiloh1, Dr. Balasingam Muhunthan (Corresponding author)2, Dr. Masoud Kayhanian3, and Dr. Seyoum Yami Gebremariam4
Abstract
The aim of this study was to investigate and quantify clogging in pervious concrete samples from parking lots. Observation, analysis and processing of X-ray computed tomography images enabled to qualitatively relate porosity characteristics with clogging. Seven representative core samples were obtained from four different parking lots with permeability ranging from very low to very high. Porosity profiles from CT scanning were used to assess the nature and extent of clogging. Significantly lower porosity values were computed for older cores compared to newer ones. Also observed was, samples manifested clogged behavior because of high cement paste (mortar) content. Porosities of samples were recalculated, for comparison, using the gravimetric method and the clogged fraction in the cores was determined by recalculating porosities of specimens scanned after vacuum-cleaning. The clogged fraction varied from 1.48% in sample PL 12-1 to 11.15% in sample PL QP 45-3.
Citation information: Please cite this article as follows Manahiloh K.N., B. Muhunthan, M. Kayhanian, and S.Y. Gebremariam, X-Ray Computed Tomography and Nondestructive Evaluation of Clogging in Porous Concrete Field Samples. Journal of Materials in Civil Engineering, 2012. 24(8): p. 1103-1109.
1Department of Civil and Environmental Engineering, Washington State University, Pullman, WA 99164-2910, Phone (509) 335-2576, [email protected] 2Department of Civil and Environmental Engineering, Washington State University, Pullman, WA 99164-2910, Phone (509) 335-3921, Fax (509) 335-7632, [email protected] 3Department of Civil and Environmental Engineering, University of California, Davis, CA 95616, Phone (530) 752-8957, Fax (530) 752-7872, [email protected] 4Department of Civil and Environmental Engineering, Washington State University, Pullman, WA 99164-2910, Phone (509) 335-2576, [email protected]
Pervious concrete has been in use for more than 50 years in a variety of applications (Dan Brown 2003). In recent decades it has gained increasing acceptance due to its physical ability to drain water from road ways and parking lots. Governmental legislations promoting water quality favor the use of pervious concrete because of its perceived benefit in preventing water pooling on surfaces. While there are various hydromodification methods in pavement construction, the use of permeable pavements is gaining popularity to reduce storm water flow volume and pollutant discharge loading (Dierkes et al. 2002; Ferguson 2005; USEPA 1999). Also while pervious concrete has a wide range of applications including slope stabilization, well linings, alleys (Tennis et al. 2004), light traffic roads (Ghafoori and Dutta 1995; Schaefer et al. 2006), storm water pollution prevention (EPA, 2000) its use for parking lot is well noted (Dan Brown 2003; Tennis et al. 2004).
The engineering properties of a pervious concrete are generally studied in its two phases: fresh and hardened. Fresh pervious concrete is relatively stiffer than structural concrete and exhibits a slump of around 20 - 50mm. In the hardened phase, density of 1600 - 2000 kg/m3, porosity of about 15-30%, permeability of 0.2 - 1.2 cm/s, compressive strength of 3.5 – 28 MPa are the most common engineering specifications (Tennis et al. 2004). Good resistance against abrasion, sulfate, and freezing and thawing are also desired pervious concrete engineering properties. For a parking lot pervious concrete, sustainably draining storm water is a major design requirement.
The efficiency of parking lot pervious concrete to drain storm water is dependent on clogging rate with time. Clogging often comes from runoff suspended particles (Nielsen 2007; Siriwardene et al. 2007; Yong et al. 2008), organic and inorganic particles from traffic activities, localized vegetation or dust blown onto the roadway (Siriwardene et al. 2007). While designing parking lot pervious concretes resilient to clogging is greatly desired, innovative engineering developments are yet to be realized because clogging mechanisms in aged concretes are poorly understood.
Studies examining clogging in parking lot concrete are generally limited because nondestructive experimental methods for characterizing clogging in field samples were not available. Most studies (e.g. Haselbach et al. 2006; Ongel et al. 2008) in the past have used laboratory permeability measurements or destructive methods to identify and characterize clogging in the field . However, Recent advances in X-ray computed tomography (CT) have provided a means to nondestructively evaluate clogging along the entire depth of pervious concrete pavement (Danish Road Institute 2007). This study makes use of X-ray CT to study the porosity distribution and clogging on fresh as well old pervious concrete pavements from various parking lot sites in the state of California. Vacuum cleaning was used to remove clogging and CT scans were done before and after to quantify the porosity distribution and the extent of clogging.
3
Materials and Methods
Pervious Concrete Coring
Prior to selecting parking lots for coring, the permeability of 17 pervious concrete parking lots was measured from selected parking lots in California (Kayhanian et al. 2011) . Four parking lots were selected based on their relative permeability ranging from low to high. Two representative core samples (except parking lot 4) were obtained from each of the selected parking lots. Sample cores were obtained using a portable air-cooled coring machine, which drilled 4 inch (100 mm) inner-diameter cores. The typical depth of the cores varied between 4 to 6 inches (100 to 150 mm). The method for coring these samples was modified to preserve the void pathways while minimizing the removal and introduction of clogging materials. The standard coring method uses water as a coolant to prevent the drill bit from wearing out quickly. However, using water as coolant will create slurry that may change the inherent clogging nature of the cores. To prevent this and to avoid the obvious effects of coring techniques on the void pathways, air was used instead of water. The typical pavement coring process within a parking lot is shown in Figure 1. As shown, to reduce undesired effects on the void pathways, a non permeable paper patch was glued to the pavement surface over the cored area so that the air used to cool the drill bit would not pass through the cored sample, but around the core. After collection the cores were wrapped with plastic bubble wraps and shipped to the Washington State High-Resolution X-ray Computed Tomography (WAX-CT) Laboratory, where they were kept in a dust-free environment until scanned, to assess the nature of clogging.
Figure 1. Typical coring process
Specimen Characterization
The relevant details of nine cores collected for X-ray CT scanning are presented in Table 1. The first two core samples (QP 45-3 or “old” and RW 475-3 or “new”) were obtained from the University of California Pavement Research Center (UCPRC) Richmond field station laboratory. QP 45-3 is a 24mm overlay open graded asphalt concrete on top of 91 mm conventional asphalt concrete pavement. This core was obtained as part of the noise study site located on west bound of highway 80 near Davis, California. The open graded overlay pavement
4
was built in November 2005 and the core was collected in August, 2006. Therefore, the age of this core sample was 10 months. The second core sample (RW 475-3) is a 60 mm core taken from a big slab compacted by the rolling wheel compactor that was produced in the lab. The aggregate used in slab was Syar Rock (basalt) and the binder was PG64-16. This core sample was not used in the field and therefore it is considered as new. The remaining seven core samples were obtained from four different parking lots.
Table 1. Description of core samples.
Core sample
No.
Diameter (mm)
Height (mm) Sample Description Sample ID
1 100 120 Open graded AC overlay on top of conventional AC pavement QP 45-3
2 100 60 Laboratory produced open graded pavement with modified binder RW 475-3
3 100 163 First field core sample from parking Lot 2 PL 2-1
4 100 151 Second field core sample from parking Lot 2 PL 2-2
5 100 147 First field core sample from parking Lot 4 PL 4-1
6 100 100 First field core sample from parking Lot 6 PL 6-2
7 100 105 Second field core sample from parking Lot 6 PL 6-3
8 100 189 First field core sample from parking Lot 12 PL 12-1
9 100 126 Second field core sample from parking Lot 12 PL 12-3
It is noted that the samples had a rough bottom face that resulted from sample coring. This caused some loss of accuracy in determining the average height and hence total volume of samples both in the gravimetric and X-ray CT techniques of porosity determination. To overcome such problems, it has been assumed the average of the heights measured at three positions (left edge, middle and right edge) will sufficiently represent sample height. Moreover in digital image processing, to obtain uniform section, X-ray image slices obtained near rough surfaces were excluded during digital image processing.
X-ray CT scanning and Image Processing
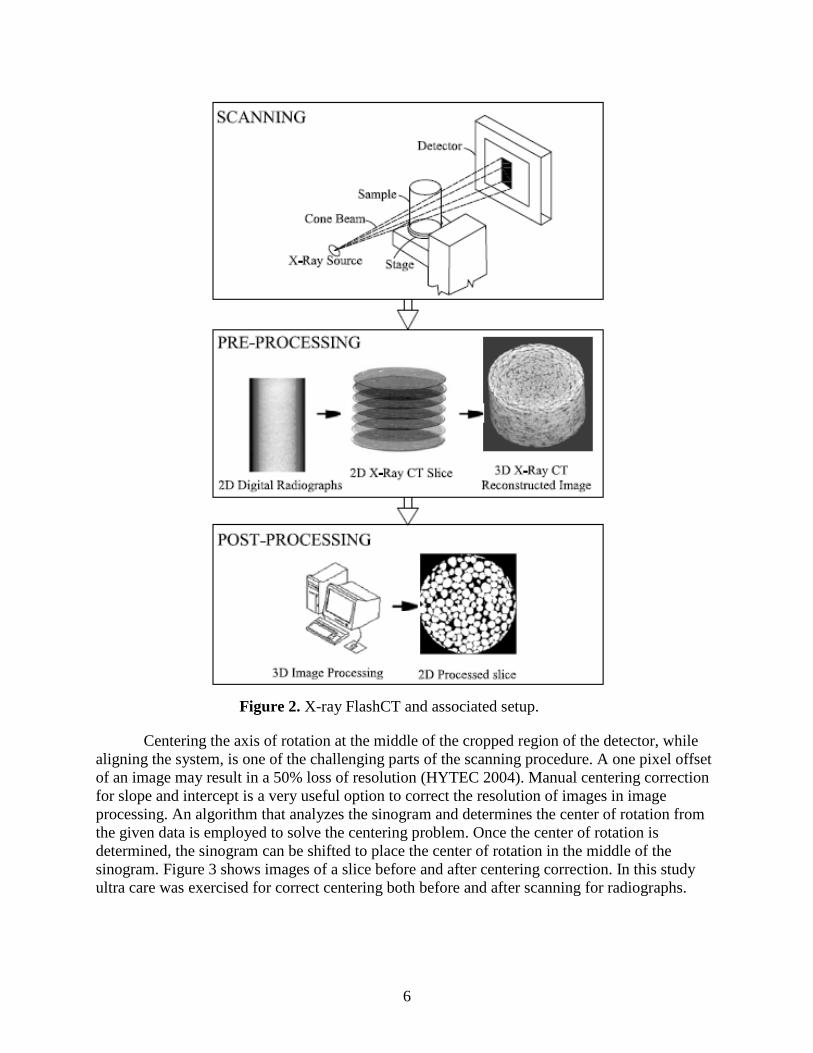
The nondestructive X-ray FlashCT (Flat panel Amorphous Silicon High-resolution Computed Tomography) test set up process is shown in Figure 2. The Washington State University X-ray FlashCT system used in this study is an industrial X-ray system generating a 420 keV and 225 keV (HYTEC 2004). The 420 keV source is preferably used for relatively bigger samples where adequate detail of sample constituent structures can be visualized with a relatively lower resolution. Pervious concrete specimens involved in this study are deemed to be big and hence scanned with the 420 keV source. The X-ray sources are networked to a central
5
work station, a processing platform that consists of four parallel computing processors each equipped with double core Central Processing Units (CPUs) and set of softwares that control the scanning process and subsequent image analyses.
Scanning of samples was initiated with specifically devised acquisition system, FlashCT Data Acquisition (DAQ). This program controls the hardware operation, calibration and scanning processes (HYTEC 2004) . Scanning of samples QP 45-3 (old) and RW 475-3 (new) was carried out with 420 keV energy and 1.7 mA flux. All other samples were scanned with 350 keV energy and 1.6 mA flux. The X-ray source emitted a cone type beam that was pre-filtered with 4 bronze plates to avoid beam hardening. Other scan parameters specific to each sample and related to geometrical and frame settings are presented in Table 2. The detector used with the scanning system was Varian PaxScan 2520, oriented horizontally (0 degrees), with Cesium Iodide Scintillator and pixel spacing of 0.254.
Once the scan parameters have been entered, the rotary sample pedestal will rotate the object and radiographic images at the desired angles will be collected. The datasets are saved as unified directory structure (UDS) file, text file containing data fields separated by linefeeds, for later processing and reconstruction by the Data Processing System software (FlashCT DPS). The UDS header files are processed with FlashCT DPS to obtain reconstructed images of the scanned slices. Calibration files are used to correct for pixel to pixel differences in the detector i.e. bad pixel correction. They are radiographs taken with the object removed from the field of view and they range from completely dark images, where an image is taken with no radiation exposure, to light fields where an image is taken with full exposure (HYTEC 2004).
6
Figure 2. X-ray FlashCT and associated setup.
Centering the axis of rotation at the middle of the cropped region of the detector, while aligning the system, is one of the challenging parts of the scanning procedure. A one pixel offset of an image may result in a 50% loss of resolution (HYTEC 2004). Manual centering correction for slope and intercept is a very useful option to correct the resolution of images in image processing. An algorithm that analyzes the sinogram and determines the center of rotation from the given data is employed to solve the centering problem. Once the center of rotation is determined, the sinogram can be shifted to place the center of rotation in the middle of the sinogram. Figure 3 shows images of a slice before and after centering correction. In this study ultra care was exercised for correct centering both before and after scanning for radiographs.
7
(a) Before Centering correction (b) After centering correction
Figure 3. Images of a slice from Sample RW 475-3.
Reconstructed images of the 2-Dimensional slices are converted into a 3-Dimensional image with software referred to as FlashCT Visualizing system software (VIZ). Finally, the processed image is analyzed with a file format converting software, Matlab File Converter (MFC) in this specific study, to retrieve TIF formats of the XY, XZ and YZ projections images so that they can be post processed with other image processing softwares. In this specific study, the softwares used for image post processing are MATLAB (MathWorks 2004) and Image-Pro-Plus (Media Cybernetics 2004). The overall processes involved with X-ray CT scanning are shown, diagrammatically in Figure 2. The details of the basic steps are presented as a flow chart in Figure 4.
START
Scan(FlashCT DAQ)
DIGITALRADIOGRAPHS
Reconstruction
FlashCT DPS+
FlashCT VIZ+
MFC
RECONSTRUCTEDIMAGE, 16-bit
Convert Image to 8-bitGray Scale Image
+Calculate Porosity
+Plot
Porosity Vs. Depth
END
POROSITY vs.DEPTH PLOT
Sample
Spatial ResolutionBinning
Centering- Slope
- IntereptEqualization- Brightness- Contrast
EqualizationCroppingThreshold
Pixel Counting
Figure 4. Flowchart for the Porosity Determination Process using X-ray CT.
8
Images, obtained from X-ray CT scanning, are post processed to compute desired physical properties. This image post processing involves a very important step termed Image Segmentation. Of the many available segmentation methods, adapted here is Otsu’s method (Otsu 1979). In this method, image histogram normalized for brightness is divided into two regions namely the foreground and background. The foreground and background are composed of pixel values greater and less than the threshold value respectively. The concept behind this method is to find a threshold value which minimizes the within-class variances of background and foreground voxel classes, which is equivalent to maximizing the variance between the means of the two clustered classes (Gebrenegus 2009; Sund and Eilertsen 2003; Wirjadi 2007). In Otsu’s thresholding technique, for an image taking on discrete voxel values k, the optimal threshold, θ, is given by equation 1 (Wirjadi 2007):
2 20 1arg max ( )( ) ( )( )Otsu
k kp k p kθ
θ θ
θ µ µ µ µ< ≥
= − + −
∑ ∑ (1)
Where p =Normalized histogram
{ }( )Mean f xµ =
{ }1 ( ) | ( )Mean f x f xµ θ= ≥
{ }0 ( ) | ( )Mean f x f xµ θ= <
Figures 5 a and b show original scanned (gray colored) and segmented (black and white) images. In the shown images, black and white pixels represent void spaces and solid particles of the specimens, respectively.
(a) Original (b) Segmented
Figure 5. Slices from PL 2-1.
Gravimetric methods for porosity estimation
The gravimetric method has been used to calculate the porosity of pervious concrete specimens (Candaele et al. 2008; Montes et al. 2005). In this study, the gravimetric procedure proposed by Montes et al. (2005) was adopted to quantify the average porosity. The set up included equipments bulk density tank-scale measuring system filled up with water, thermometer, stop watch, ruler and caliper. This procedure, based on buoyancy and Archimedes principles, allowed measurement of the mass of the porous specimens both dry and submerged in
(a)
9
water, while the volume of the specimens was calculated from measured dimensions. Finally, the average porosity was calculated using soil mechanics weight-volume relationships (Montes et al. 2005). The measured values used in the weight-volume relationships are summarized in Table 3.
Quantification of clogged fraction
Once clogging was deemed present from image analysis results, specimens were taken to a CoreLok machine. This machine, operated at 120 or 220-volt power, automatically seals samples in a specially designed puncture resistant polymer bag inside a vacuum chamber driven with 1.25 hp pump. Air inside the bag is vented out in a controlled manner such that the sample is subject to 99% of full vacuum. An integrated pressure gauge monitors the vacuum level and displays the vacuum setting within the chamber.
The chamber door automatically opens up, as soon as the chamber pressure reaches atmospheric, and the sample can be removed for further testing and evaluation. The vacuumed sample-plastic bag system is submerged and the plastic bag is cut to let water in. The vacuum developed in the pores sucks water at a very high pressure and the clog is washed out.
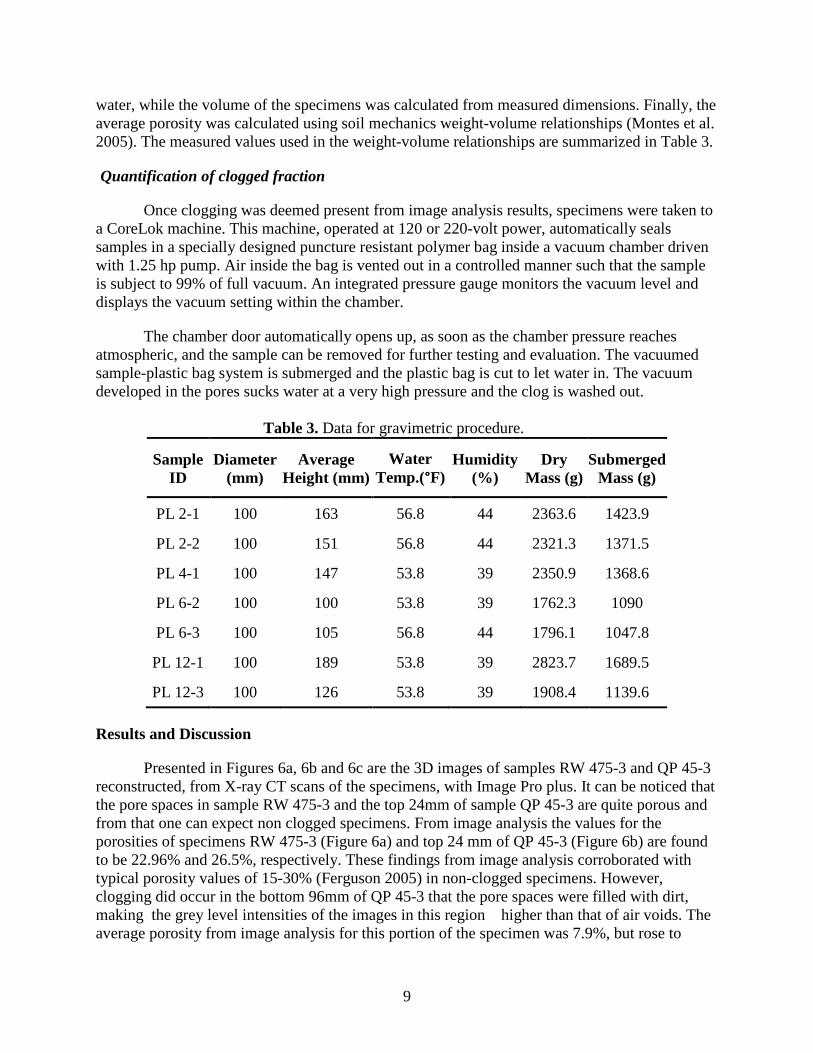
Table 3. Data for gravimetric procedure.
Sample ID
Diameter (mm)
Average Height (mm)
Water Temp.(°F)
Humidity (%)
Dry Mass (g)
Submerged Mass (g)
PL 2-1 100 163 56.8 44 2363.6 1423.9
PL 2-2 100 151 56.8 44 2321.3 1371.5
PL 4-1 100 147 53.8 39 2350.9 1368.6
PL 6-2 100 100 53.8 39 1762.3 1090
PL 6-3 100 105 56.8 44 1796.1 1047.8
PL 12-1 100 189 53.8 39 2823.7 1689.5
PL 12-3 100 126 53.8 39 1908.4 1139.6
Results and Discussion
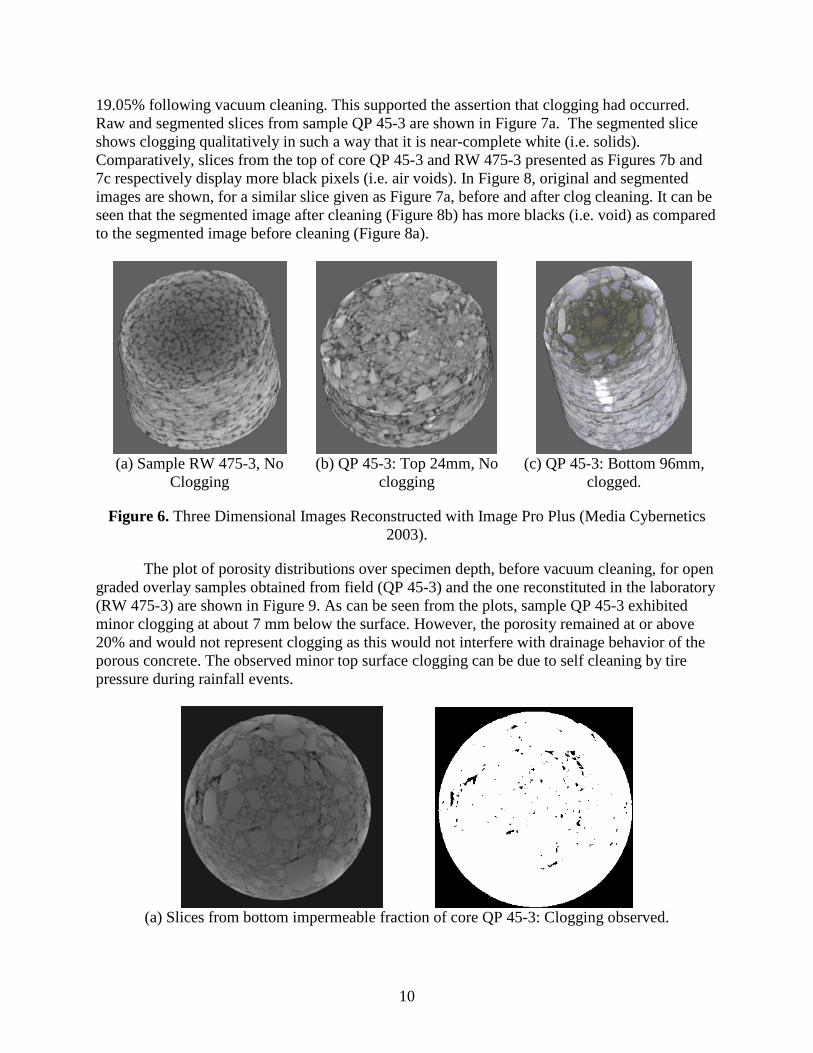
Presented in Figures 6a, 6b and 6c are the 3D images of samples RW 475-3 and QP 45-3 reconstructed, from X-ray CT scans of the specimens, with Image Pro plus. It can be noticed that the pore spaces in sample RW 475-3 and the top 24mm of sample QP 45-3 are quite porous and from that one can expect non clogged specimens. From image analysis the values for the porosities of specimens RW 475-3 (Figure 6a) and top 24 mm of QP 45-3 (Figure 6b) are found to be 22.96% and 26.5%, respectively. These findings from image analysis corroborated with typical porosity values of 15-30% (Ferguson 2005) in non-clogged specimens. However, clogging did occur in the bottom 96mm of QP 45-3 that the pore spaces were filled with dirt, making the grey level intensities of the images in this region higher than that of air voids. The average porosity from image analysis for this portion of the specimen was 7.9%, but rose to
10
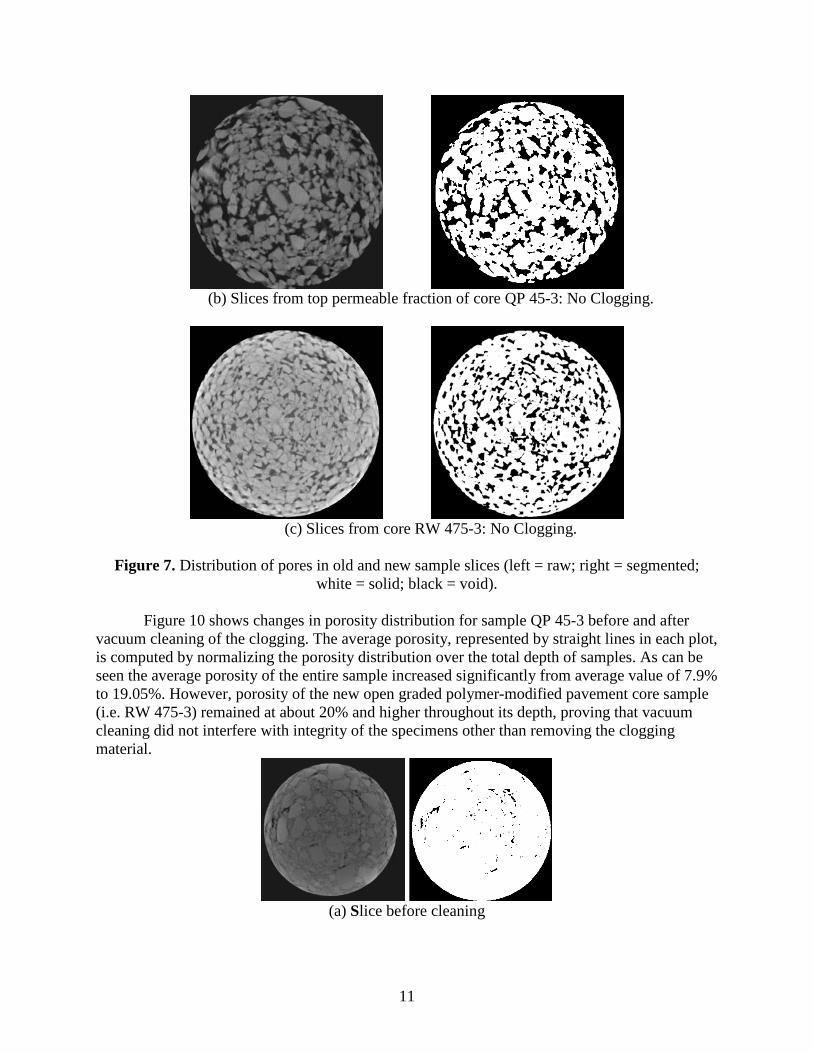
19.05% following vacuum cleaning. This supported the assertion that clogging had occurred. Raw and segmented slices from sample QP 45-3 are shown in Figure 7a. The segmented slice shows clogging qualitatively in such a way that it is near-complete white (i.e. solids). Comparatively, slices from the top of core QP 45-3 and RW 475-3 presented as Figures 7b and 7c respectively display more black pixels (i.e. air voids). In Figure 8, original and segmented images are shown, for a similar slice given as Figure 7a, before and after clog cleaning. It can be seen that the segmented image after cleaning (Figure 8b) has more blacks (i.e. void) as compared to the segmented image before cleaning (Figure 8a).
(a) Sample RW 475-3, No
Clogging (b) QP 45-3: Top 24mm, No
clogging (c) QP 45-3: Bottom 96mm,
clogged.
Figure 6. Three Dimensional Images Reconstructed with Image Pro Plus (Media Cybernetics 2003).
The plot of porosity distributions over specimen depth, before vacuum cleaning, for open graded overlay samples obtained from field (QP 45-3) and the one reconstituted in the laboratory (RW 475-3) are shown in Figure 9. As can be seen from the plots, sample QP 45-3 exhibited minor clogging at about 7 mm below the surface. However, the porosity remained at or above 20% and would not represent clogging as this would not interfere with drainage behavior of the porous concrete. The observed minor top surface clogging can be due to self cleaning by tire pressure during rainfall events.
(a) Slices from bottom impermeable fraction of core QP 45-3: Clogging observed.
11
(b) Slices from top permeable fraction of core QP 45-3: No Clogging.
(c) Slices from core RW 475-3: No Clogging.
Figure 7. Distribution of pores in old and new sample slices (left = raw; right = segmented;
white = solid; black = void).
Figure 10 shows changes in porosity distribution for sample QP 45-3 before and after vacuum cleaning of the clogging. The average porosity, represented by straight lines in each plot, is computed by normalizing the porosity distribution over the total depth of samples. As can be seen the average porosity of the entire sample increased significantly from average value of 7.9% to 19.05%. However, porosity of the new open graded polymer-modified pavement core sample (i.e. RW 475-3) remained at about 20% and higher throughout its depth, proving that vacuum cleaning did not interfere with integrity of the specimens other than removing the clogging material.
(a) Slice before cleaning
12
(b) Slice after cleaning
Figure 8. An image before and after clog cleaning (left = raw; right = segmented; white = solid; black = void).
Figure 9. Porosity distribution for old (QP 45-3) and new (RW 475-3) porous friction course samples
Average Porosity = 7.9%
13
(a) Before cleaning (b) After cleanin
Figure 10. Porosity distribution for old (QP 45-3) sample.
14
The average porosity obtained by scanning was verified by measuring the overall porosity of the samples in the laboratory using a gravimetric method. Table 4 summarizes the calculated porosities from gravimetric and scanning methods. The porosities of specimens before and after clog cleaning are also tabulated for comparison. Referring to the results shown in Table 4, generally comparable results were obtained by both methods. In a few samples, the porosity obtained by the gravimetric method is less than the average value computed over the depth from X-ray CT scanning. This is attributed to the inability of water to get into voids that are displayed as isolated spaces in X-ray CT images. Therefore, the porosity obtained in the gravimetric testing procedure can be referred to as “effective porosity” of the samples. The gravimetric method is useful for ensuring whether results from X-ray CT are within the reasonable range. However, the X-ray CT scanning technique is more precise and hence superior to the gravimetric method in that it allows accurate void space calculations and clogging determinations.
Table 4. Average porosity based on scanning and gravimetric methods.
Taking the common porosity value of 15-30% (Ferguson 2005) as a reference for pervious concrete and comparing calculated values from scanned image analysis, samples were classified as clogged and not clogged. Fraction of clogging varied from 1.48% in sample PL 12-1
15
to 11.15% in sample QP 45-3. Accordingly samples PL 6-2 and PL 6-3 have lower porosities as compared to PL 2-1, PL 2-2, PL 4-1, PL 12-1 and PL 12-3 and were classified as clogged. In general, clog cleaning by vacuum brought about an increase in porosity although samples PL 6-2, PL 6-3 and PL 12-1 did not show significant improvements in their porosities. This could be related to “clogging from material” i.e. clogging from cement paste. Similar assertion was made by (Chopra and Wanielista 2007a).
Additional plots of the porosity versus depth and average porosity distributions of individual samples before and after clog cleaning were not presented here for brevity, but are available elsewhere (Manahiloh et al. 2010) and can be readily accessed from the website of WAXCT (http://www.waxct.wsu.edu).
Conclusions
This study illustrated the use of X-ray CT towards the nondestructive characterization of porous concrete specimen. One of the unique features of the X-ray CT characterization is its ability to quantify the porosity distribution with depth. This facilitates the identification of the presence of clogging in porous concrete specimens. Special image processing software has been developed in house to identify the relevant microstructural features of porous concrete specimens. The X-ray CT also enabled the virtual reconstruction of porous concrete specimens based on the scanned images of slices. This is an additional feature to identify the extent of clogging as well as other microstructural features of scanned specimens. The study here was restricted to porosity as a quantifying parameter; however, the images and their characterization are useful for identifying the shape, size and distribution of particles and pores for future studies. The study confirmed that clogging was present in some of the samples and its extent has been quantified extent by comparing porosity profiles of samples before and after vacuum cleaning.
Notations
k = discrete voxel value; θ = optimal threshold; θOtsu = optimal threshold by Otsu's method; p = normalized histogram; µ = mean of the set of grey values;
1µ = mean of the set of grey values greater than the threshold value; and
0µ = mean of the set of grey values less than the threshold value. H = height of specimen; D = diameter of specimen
Acknowledgments
Partial financial support was provided by California Department of Transportation, Division of Environmental Analysis through UCDAVIS. The views expressed by the authors are their own and the California Department of Transportation does not endorse the viewpoint of a publication. The authors are thankful: to the staff of the University of California Pavement Research Center for their assistance on sample coring and to the staff of Washington State University WAX-CT Laboratory who assisted in CT scanning and image analysis.
16
References
Candaele, R., Barrett, M., and Charbeneau, R. (2008). "Porous friction course: a laboratory evaluation of hydraulic properties." Center for Research in water resources online report 08-06, University of Texas Austin.
Chopra, M., and Wanielista, M. (2007a). "Performance Assessment of Portland Cement Pervious Pavement: Compressive Strength of Pervious Concrete Pavements." Stormwater Management Academy, University of Central Florida.
Dan Brown, P. E. (2003). "Pervious Concrete Pavement: A Win-Win System." Portland Cement Association, 9 pages.
Danish Road Institute (2007). "Microstructure of porous pavements-experimental procedures." DRI, technical note 47.
Dierkes, C., Kuhlmann, L., Kandasamy, J., and Angelis, G. "Pollution retention capability and maintenance of permeable pavements." Proc., 9th International Conference on Urban Drainage.
Envronmental Protection Agency (2000). "Stormwater Phase II, Final Rule." Revised December 2005.
Ferguson, B. K. (2005). Porous Pavements-porous pavement hydrology, Taylor and Francis, Boca Raton, Florida.
Gebrenegus, T. (2009). "Application of X-ray Computed Tomography to Study Initiation and Evolution of Surface Cracks in Sand-Bentonite Mixtures." PhD, University of Idaho, Moscow.
Ghafoori, N., and Dutta, S. (1995). "Laboratory Investigation of Compacted No-Fines Concrete for Paving Materials." J. Mater. Civ. Eng., 7(3), 183-191.
Haselbach, L. M., Valavia, S., and Montes, F. (2006). "Permeability Predictions for Sand-Clogged Portland Cement Pervious Concrete Pavement Systems." J. Environ. Manage., 81(1), 42-49.
HYTEC (2004). FlashCT Software User Manual, HYTEC INC., Los Alamos, NM. Kayhanian, M., Joshi, B., Anderson, D., Harvey, J. T., Jones, D., and Muhunthan, B. (2011).
"Permiability measurement as a parameter to assess clogging of pervious concrete pavements in parking lots." J. Environ. Manage.
Manahiloh, K., Muhunthan, B., and Gebremariam, S. (2010). "X-ray Scanning of Previous concrete specimens - Final report to UCDAVIS ", Washington State Univesity, Pullman, WAXCT-01-2010.
MathWorks (2004). "Image Processing Toolbox User's Guide: Version 5." The MathWorks Inc., Natick, MA.
Media Cybernetics (2003). "3D Constructor Version 5.0 for Windows: User Guide, MAN 78-63N50000 20030530." Media Cybernetics, Silver Spring, MD.
Media Cybernetics (2004). "Image-Pro Plus Version 5.0 for Windows: Reference Guide, MAN 7846N000 20040220." Media Cybernetics, Inc., Silver Spring, MD.
17
Montes, F., Valavala, S., and Haselbach, L. M. (2005). "A New Test Method for Porosity Measurement of Portland Cement Pervious Concre." Journal of ASTM International, 2(1), 1-13.
Nielsen, C. B. (2007). "Clogging of porous pavements – The cleaning experiment." Road Directorate, Danish Road Institute.
Ongel, A., Harvey, J., and Partl M.N. (2008). "Assessment of clogging in open graded asphalt mixes in California." International Society for Asphalt Pavements (ISAP) Sysmposium on Asphalt Pavements and the Environment, August 18-20, Zurich, Switzerland.
Otsu, N. (1979). "Threshold Selection Method from Gray-Level Histograms." IEEE Trans. Syst., Man Cybernetics, SMC-9(1), 62-66.
Schaefer, V., Wang, K., Suleimman, M., and Kevern, J. (2006). "Mix Design Development for Pervious Concrete in Cold Weather Climates." Final Report, Civil Engineering, Iowa State University.
Siriwardene, N. R., Deletic, A., and Fletcher, T. D. (2007). "Clogging of stormwater gravel infiltration systems and filters: Insights from a laboratory study." Water Res., 41(7), 1433-1440.
Sund, R., and Eilertsen, K. (2003). "An algorithm for fast adaptive image binarization with applications in radiotherapy imaging " ITMI, 22, 22-28.
Tennis, P. D., Leming, M. L., and Akers, D. J. (2004). "Pervious Concrete Pavements." Special Publication by the Portland Cement Association and the National Ready Mixed Concrete Association.
USEPA (1999). "Stormwater technology factsheet on porous pavement." Office of Water. Wirjadi, O. (2007). "Survey of 3D Image Segmentation Methods." Fraunhofer ITWM,
Kaiserslautern, Germany. Yong, C., Deletic, A., Fletcher, T., and Grace, M. (2008). "The clogging behavior and treatment
efficiency of a range of porous pavements." 11th International Conference on Urban Drainage, Edinburgh, Scotland, UK.