X-ray Fluorescence Microscopy: A Tool for Biology, Life Science and Nanomedicine Stefan Vogt Group Leader Microscopy X-ray Science Division Advanced Photon Source Adj. Assoc. Professor Feinberg School of Medicine Northwestern University
Transcript
X-ray Fluorescence Microscopy:
A Tool for Biology, Life Science and Nanomedicine
Stefan Vogt
Group Leader Microscopy
X-ray Science Division
Advanced Photon Source
Adj. Assoc. Professor Feinberg School of Medicine
Northwestern University
Acknowledgements
Financial support: • Department of Energy (Basic Energy Science) • National Institutes of Health (NIBIB, NIGMS) • Australian Research Council
2
Jesse Ward, Lydia Finney, Sophie Charlotte Gleber, Chris Roehrig, Barry Lai, Dan Legnini, Evan Maxey, Joerg Maser, and the rest of the Microscopy group, Argonne
Chris Jacobsen, Argonne / Northwestern University
Gayle Woloschak, Tanja Paunesku, Northwestern University
Peter Lay, University of Sydney
Hugh Harris, University of Adelaide
Ben Twining, Bigelow Laboratory for Ocean Sciences
Christian Holzner, Stony Brook Univ./Xradia
Minna Krejci, Derk Joester, Northwestern University
Martin de Jonge, Australian Synchrotron
Outline
X-ray fluorescence Microscopy
– Basics
– Instrumentation
– Phase contrast to visualize structure
Biological Applications
– Trace metals in algae and plankton • XRF tomography
– A role for Zn in signaling
– Hyperaccumulating plants
– Nanocomposites for Nanomedicine
– Chromium carcinogenesis • Micro-XANES
Summary & Outlook
3
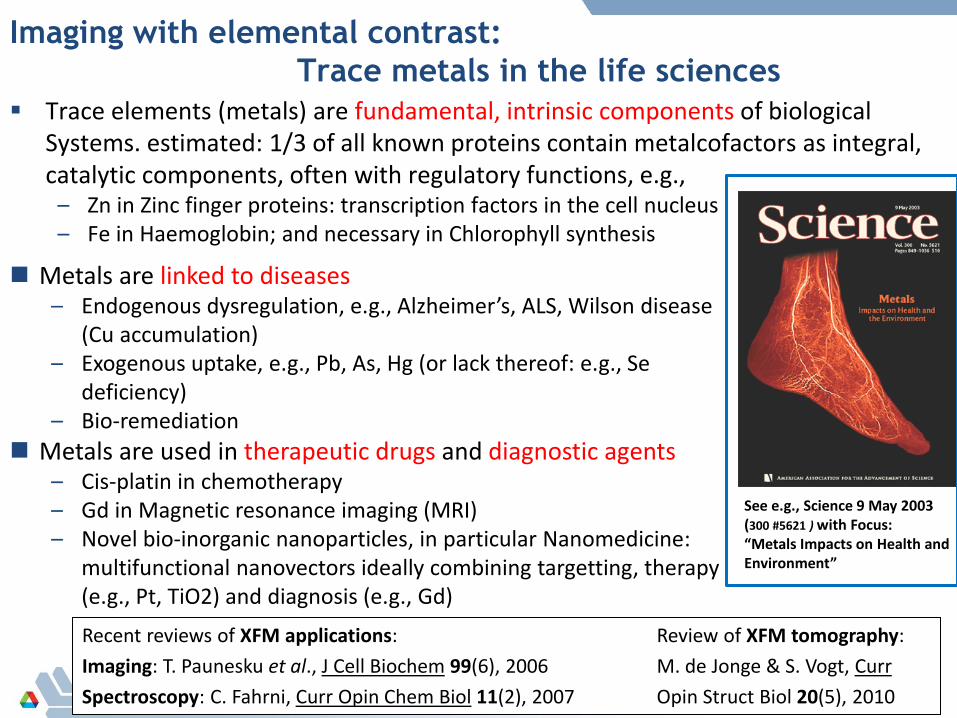
Imaging with elemental contrast:
Trace metals in the life sciences
Trace elements (metals) are fundamental, intrinsic components of biological Systems. estimated: 1/3 of all known proteins contain metalcofactors as integral, catalytic components, often with regulatory functions, e.g.,
– Zn in Zinc finger proteins: transcription factors in the cell nucleus – Fe in Haemoglobin; and necessary in Chlorophyll synthesis
Metals are linked to diseases – Endogenous dysregulation, e.g., Alzheimer’s, ALS, Wilson disease
(Cu accumulation) – Exogenous uptake, e.g., Pb, As, Hg (or lack thereof: e.g., Se
deficiency) – Bio-remediation
Metals are used in therapeutic drugs and diagnostic agents – Cis-platin in chemotherapy – Gd in Magnetic resonance imaging (MRI) – Novel bio-inorganic nanoparticles, in particular Nanomedicine:
X-ray induced X-ray fluorescence – a brief reminder photo-electric absorption of incident hard X-ray emission of photo-electron
Emission of Auger e- - dominating low Z
X-ray fluoresence - dominating high Z
• Energy of X-ray fluorescence photons is characteristic for each element • XRF is quantitative, i.e., number of XRF photons is directly related to quantity of element • Photo-electric absorption crossection straightforward to calculate (monochomatic incident beam)
Detect XRF using energy dispersive detector
Energy
Inte
nsi
ty
Periodic table highlighting X-ray fluorescence K-line Fluorescence typically used L-line Fluorescence typically used
Toxic / carcinogenic elements ‚Natural‘ Trace elements
Used in Imaging, Diagnosis, Therapy, ...
6
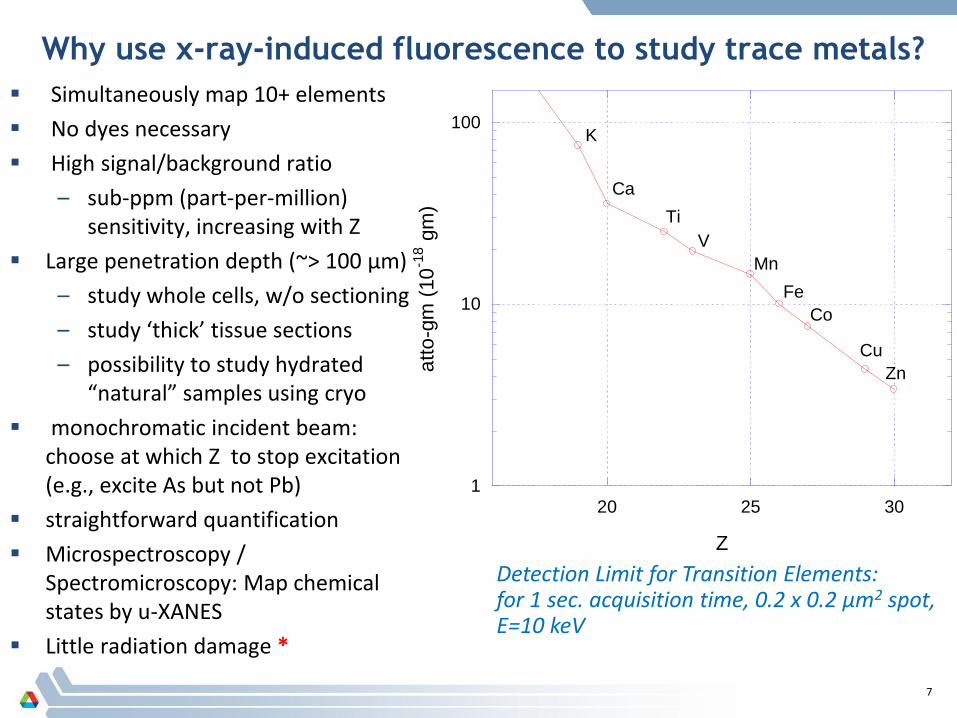
Why use x-ray-induced fluorescence to study trace metals?
Simultaneously map 10+ elements
No dyes necessary
High signal/background ratio
– sub-ppm (part-per-million) sensitivity, increasing with Z
Large penetration depth (~> 100 μm)
– study whole cells, w/o sectioning
– study ‘thick’ tissue sections
– possibility to study hydrated “natural” samples using cryo
monochromatic incident beam: choose at which Z to stop excitation (e.g., excite As but not Pb)
straightforward quantification
Microspectroscopy / Spectromicroscopy: Map chemical states by u-XANES
Little radiation damage *
1
10
100
20 25 30
atto
-gm
(10
-18 g
m)
Z
Zn
Cu
Co
Fe
Mn
V
Ti
Ca
K
Detection Limit for Transition Elements: for 1 sec. acquisition time, 0.2 x 0.2 µm2 spot, E=10 keV
7
Schematic of a Hard X-Ray Microprobe
Data acquisition: Epics
visualization: IDL / MAPS
scan (step or fly) sample through focused X-ray beam
record full XRF spectrum at each scan point, using an energy dispersive detector, at 90°
He environment to minimise background, air absorption
Fit data at every pixel or use PCA
5 – 30 keV
= 150-500 nm
5 * 109 ph/s
schematic NOT to scale !!
* B. Hornberger et al, J Synchr. Radiat 15(Pt 4), 2008 * de Jonge et al, Phys Rev Lett 100(16), 2008 * Holzner et al, Nat Phys 2011
*
8
9
20x obj.
kinematic specimen mount
condenser
specimen
2-ID-E Hard X-ray Microprobe Epi-Fluorescence Microscope
Sample in sample chamber, purge with He
10
Elemental content of an HMVEC cell
Overview Image of a full HMVEC cell (plunge frozen in liquid ethane, freeze dried), 2 hours after initiating angiogenesis. Cu is localised strongly to areas outside of the cell, comparison to other timepoints suggests the Cu is transported out of the cell, and after a few hours back into the cell.
See also: L. Finney et al, PNAS 104(7): 2247-52. (2007)
11
from http://www.cartoonstock.com/
Great tool, but is it the right tool for the job ?
Comparison of some techniques for trace element mapping: Spatial
Resol.
object
thick.
Res.
Limit. Advantages/Disadvantages
Light-
microsc. 200 nm 30 µm
Wave-
length
+ changes in living cells can be monitored, but competition w.
proteins
+/- only see ions (in solution), and not total content
- need dyes - quantification difficult
Hard
X-ray-
micropr.
200
nm-
20nm
10 µm
Curren-
tly
Optics
+ no dyes, visualize total elemental content
+ very high sensitivity, low background, selective excitation
+ simultaneously detect >10 elements
+ µ-XANES for chemical state mapping / - slow
Analytical
Electron-
micropr.
20 nm 0.1 µm object
thickn.
+ high spatial resolution
+ simultanously detect >10 elements
- thick samples very difficult, sectioning necessary
- slow - radiation damage
EELS/
EFTEM 2 nm
0.005
- 0.05
µm
Rad.
Damage
+ very high spatial resolution
- require ultrathin sections
- only some elements readily accessible (e.g., P, Fe)
-co-registration can be difficult (EFTEM), slow (EELS)
Proton
Micropr.
(PIXE)
~1um ~50um
Rad.
damage
Flux limit
+ simultanously detect >20 elements
+ high sensitivity
- slow - radiation damage
B. Twining et al, J Eukaryot. Microbiol. 55(3), 2008 12
analytical electron microscope hard X-ray microscope
Elemental images of the same air-dried cells from several Sb-treated Leishmania
amastigotes. Sb is much clearer visible in the x-ray microscope due to its greater sensitivity.
Scan width: 10µm.
Collaboration with Ann LeFurgey and Peter Ingram, VA & Duke University
13
DPC image of cardiac myocyte: shows striations caused by the regular arrangement of myofilaments.
Phase Contrast to
visualize soft materials
to visualize cell structure in hard X-ray microscopy, use phase contrast instead of absorption, e.g., for scanning probe: differential phase contrast
B. Hornberger et al, J Synchrotron Radiat 15(Pt 4), 2008 M. de Jonge et al, Phys Rev Lett 100(16): 163902, 2008 14
Zn fluorescence Visible light micrograph
C. Holzner et al., Nature Physics, 2010
Zernike Phase Contrast in Scanning X-ray Microscopy:
- high sensitivity to low-Z material. E.g., flagellae: ~ 100 nm thick - contextualize elemental content - experimentally: better sensitivity than DPC (
Applications
16
17
Trace metals in plankton and global carbon balance
CO2 sequestration in the ocean seems to be limited by the availability of Fe (necessary for Chlorophyll production).
Possibility of increasing CO2 sequestration by Fe seeding
Standard approach to study Fe uptake: bulk analysis, BUT cannot distinguish between different organisms, or solid Fe particles not bio-available
X-ray microscopy: separate and study individual organism
light epi Si
Ca Mn Fe
P
Ni
S K
Cu Zn
•Light, epifluorescence and XRF images of diatom •Si maps onto diatom frustule •Fe is concentrated in/near the chloroplasts (epi)
B. Twining, et al.,
Analytical Chemistry 75, 3806-3816 (2003).
CO2 Fe in dust
10 m
Need tomography to visualise 3D structure 3D resolution: δ=D D specimen size, tilt angle interval (Crowther et al 1970)
– For 10um thick sample, 20 nm desired resolution, need 1600 projections
-> need automation, must use dose fractionation
Use diff. phase contrast for alignement, or fiducials
18
Current tomography setup at 2-ID-E Sophie-Charlotte Gleber, Ryan Tappero, et al
Imaging trace elements in 3D
3D rendering of trace elements in a freshwater diatom (Cyclotella sp.)
M. de Jonge, et al, PNAS, 2010 19
3 µm
Ba and Sr selectivity in desmid green algae • Desmid green algae precipitate (Ba,Sr)SO4
• Show selectivity for Ba, Sr vs. Ca
• Potential impact in 90Sr remediation
XRF mapping at APS beamline 2-ID-E is used to localize and quantify Ba, Sr, Ca, S to elucidate mechanism of selectivity
Tomographic reconstruction of XRF tilt series
Fe Sr Fe
Sr
Krejci et al, (2011) ChemSusChem. 4(4): p. 470-3. Krejci et al, (2011) J Struct Biol. 176(2): p. 192-202
2D and 3D maps reveal localization of Sr between lobes of the Chloroplast (Fe). Sr and Ca are taken up, transported, and exported similarly – no apparent cross-membrane selectivity. S is concentrated in the terminal vacuoles: => Suggests selective precipitation due to low solubility of (Ba,Sr)SO4 – “sulfate trap” mechanism
Signaling Cardiac Muscle Injury with Zn ? Iron (Fe)
MLP
P max: 10.2 μg/cm2
K max: 6.6 μg/cm2
Ca max: 0.08 μg/cm2
Fe max: 0.09 μg/cm2
Cu max: 0.02 μg/cm2
Zn max: 0.06 μg/cm2
Zn striations occur at ~1.6 μm intervals, which corresponds to one complete sarcomere. Zn seems to co-localise to I-band – is Muscle LIM Protein (MLP) responsible ? MLP is also implicated as stress sensor. MLP released by injury is thought to activate GATA-4 and gene expression. Is Zn enhancing response (‘loading’ Zn-finger proteins) ?
10 μm
Zn
B. Palmer, et al. J Struct Biol (2006), 155(1): 12-21.
What makes a good egg and healthy embryo? Zinc plays an unexpected role in oocyte maturation: Zn content is an order of magnitude
higher in eggs than Fe and Cu.
Zn level increases by 50% during maturation. Zn depletion arrests the maturation process.
One of the first studies to implicate zinc as a possible signaling molecule in a biological system, not just a protein cofactor
Bulk analysis cannot be applied to rare cells such as mammalian oocytes
In the XFM image a mature (MII) eggs retains Zn while polar body is Zn low. This asymmetry is required for correct oocyte maturation. Scale bar 20 um.
Kim AM, Vogt S, O'Halloran TV, Woodruff TK. Nat Chem Biol. 2010 6(9):674-81. Kim, AM, ML Bernhardt, BY Kong, R.W Ahn, S Vogt, TK Woodruff, TV O'Halloran. ACS Chemical Biology 2011
Nanocomposites for Nanomedicine / Theranostics
Numerous developments to create functional nanocomposites that combine properties for – medical imaging (e.g. Gd as a contrast agent for MRI) – therapy (e.g., kill cancer cells) – targeting (e.g., bind only to DNA of cancer cells)
• For example: • nanocomposites that target specific oncogenes in cancer cells • can destroy the gene or the cell • be visualised by MRI (in vivo!)
But: before being able to test on subject, need to confirm in vitro: – Do the nanocomposites enter the cells ? – Do they ‘find’ the right target ? – Do they ONLY interact with the right target (e.g., toxicity) ? – Do different components remain joined ?
23
Tatjana Paunesku, Gayle Woloschak, et al
Ti nanocomposites as intracellular probes and tools
attach TiO2 nanoparticle (4.5 nm diameter) to DNA
– May include Gd or Fe3O4 core for MRI
combine DNA biochemistry with semiconductor properties of TiO2
carrier-particle that can bind to a specific chromosomal region w/ ability to cleave it upon illumination
See also, T. Paunesku et al, "Biology of TiO2 –oligonucleotide nanocomposites", Nature Materials 2, 343-346 (01. May 2003)
24
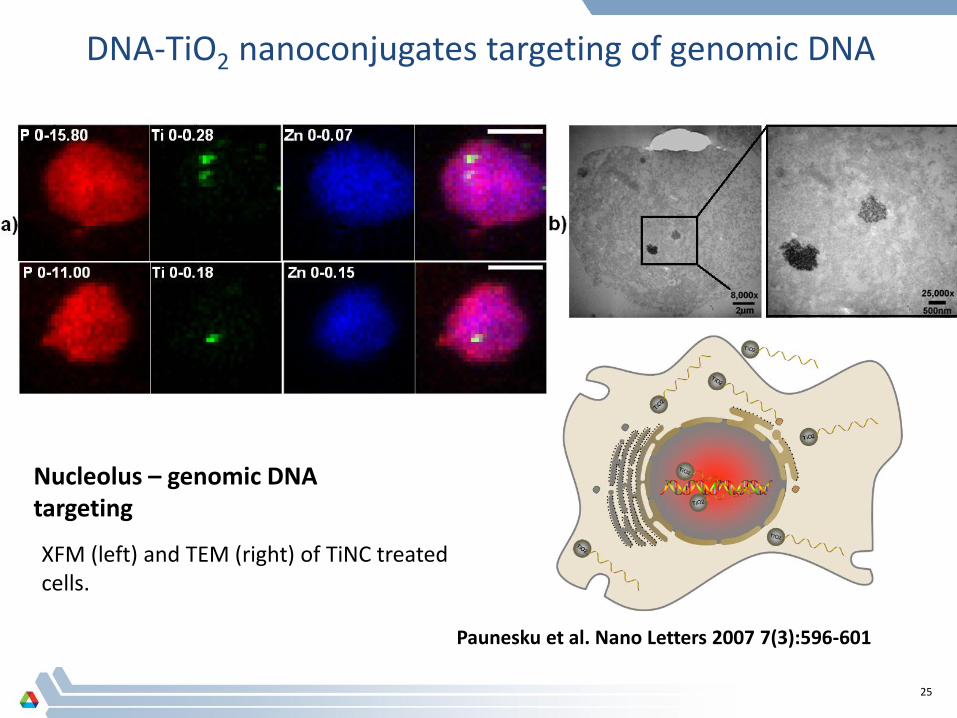
DNA-TiO2 nanoconjugates targeting of genomic DNA
Paunesku et al. Nano Letters 2007 7(3):596-601
Nucleolus – genomic DNA targeting
XFM (left) and TEM (right) of TiNC treated cells.
25
DNA-TiO2 nanoconjugates targeting of mitochondrial DNA in
MCF7 cells
Mitochondria – mitochondrial DNA targeting: using DNA oligonucleotide as a targeting moiety
NOTE that natural presence of Mn indicates mitochondria
Paunesku, et al. Nano Letters 2007
Endres et al. JACS 129(51): 15760-1. 2007
Imaging TiNC by X-ray fluorescence—TiO2 conjugated to
mitochondrial targeting oligonucleotide and Gd contrast agent
Diagnostic labeling molecules can be bound to TiO2 surface as a scaffold to make nanoconjugates visible to diagnostic equipment.
MRI (left) and XFM (right) of treated (top) and control (bottom) cells.
27
Summary
Current ‘routine’ high spatial resolution: 200 nm,
– Best at APS for biol systems: 50-70 nm, worldwide: 30 nm (heroic)
X-ray induced x-ray fluorescence, high trace element sensitivity (Zn: 10-18g in 1 s), quantitative
Chemical state mapping & micro-XANES to distinguish speciation
Phase contrast to correlate elemental maps with biological structure, normalise by specimen mass (latter not yet routine)
X-ray fluorescence tomography: 3D distribution of elemental content
28
Exciting optics, detector, instrumentation developments: 20-30 nm spatial resolution seems achievable, with sensitivity down to <10 Zn atoms for THIN specimens (Limiting factor: radiation damage)
Routine XRF-tomography
mitochondrion: 0.5x2 µm
w/ substructure !
Outlook & Future:
future experiments, that, e.g. detect and map
single nanovectors in tissues, cells and organelles, to understand their properties, or
environmental contaminants as they interact with cells and organelles (e.g., across membranes)
Ti
High speed data acquisition
Cryogenic Specimen Environment
Correlative experiments with other techniques (IR, visible light, EM, ..)
Exciting optics developments: <10 nm spatial resolution seems achieveable, but what about radiation damage ?
From soft X-ray microscopy, Limit is ~ 1010 Gy, corresponding to: focused photon density of 1013 ph/μm2 at 10keV (current have flux density 1011 ph/s/μm2)
APS Today (100 mA, 3.0 nm,UA, L=2.4 m), 6% of 4πSR detected, at 10 keV incident beam energy, for a biological sample in water (frozen hydrated) => minimum detectable Zn [#atoms], in 1s or