X Simposio Internacional de Nutrición Acuícola Monterrey, Nuevo Leon, Mexico November 9, 2010 – Session 3 Meeting the Challenge of no Fishmeal in Practical Diets for Litopenaeus vannamei : Case Studies from LABOMAR, Brazil Alberto J.P. Nunes Associate Professor
Transcript
X Simposio Internacional de Nutrición AcuícolaMonterrey, Nuevo Leon, MexicoNovember 9, 2010 – Session 3
Meeting the Challenge of no Fishmeal in Practical Diets for Litopenaeus vannamei: Case Studies from LABOMAR, Brazil
Alberto J.P. NunesAssociate Professor
Aquaculture: largest consumer of fishmeal In 2006, aquafeeds used 3.7 million MT of fishmeal, 68.2% of the
estimated global production
23,851
60,014
15,072
45,557
2006 2020E
Production of finfish and crustaceans*Total fed production
*MT x 1,000. Excludes filter-feeding fish
¶ Source: Tacon and Metian, 2008
In 10 years, fed-raised finfish and crustaceans will account for ¾ of world production
(63%)
(76%)
MT x 1,000
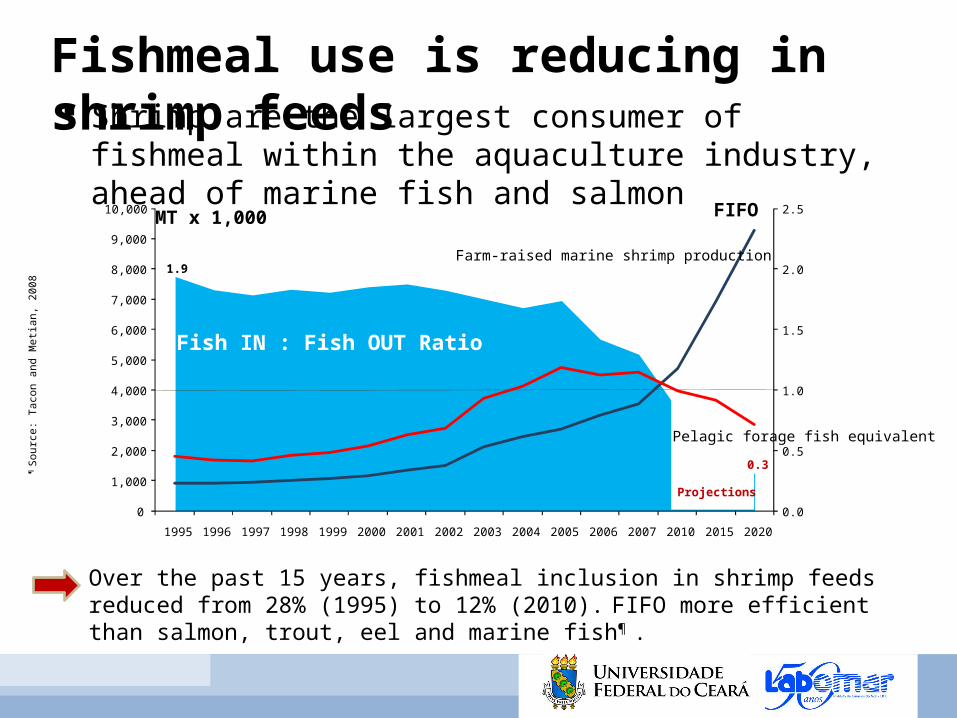
Fishmeal use is reducing in shrimp feeds Shrimp are the largest consumer of fishmeal within the
aquaculture industry, ahead of marine fish and salmon
Over the past 15 years, fishmeal inclusion in shrimp feeds reduced from 28% (1995) to 12% (2010). FIFO more efficient than salmon, trout, eel and marine fish¶ .
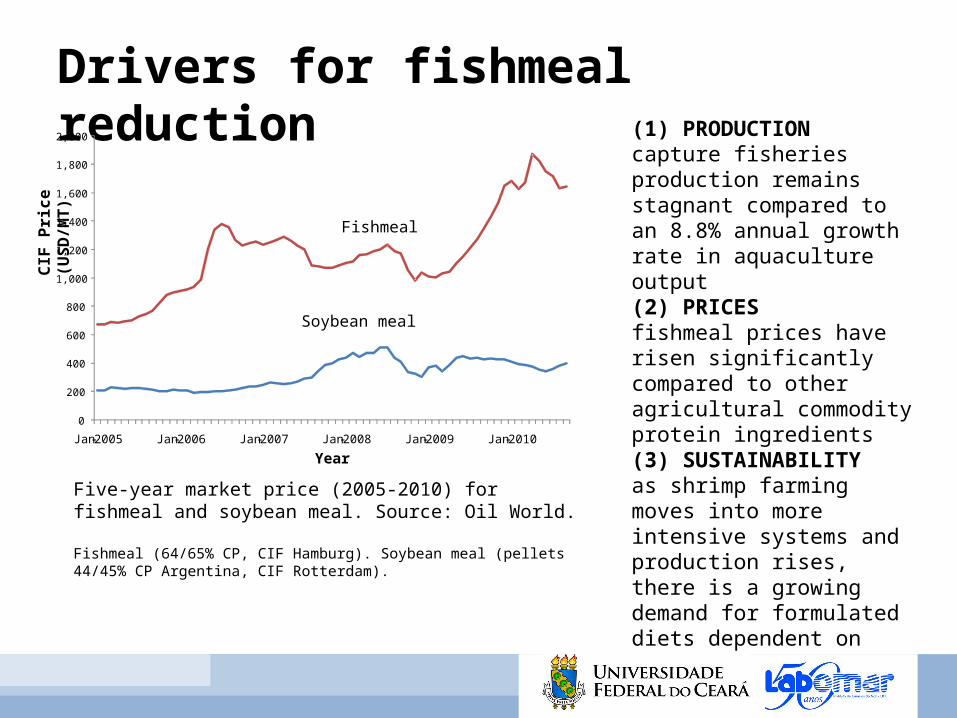
(1) PRODUCTIONcapture fisheries production remains stagnant compared to an 8.8% annual growth rate in aquaculture output(2) PRICESfishmeal prices have risen significantly compared to other agricultural commodity protein ingredients(3) SUSTAINABILITYas shrimp farming moves into more intensive systems and production rises, there is a growing demand for formulated diets dependent on static supplies of fish meal
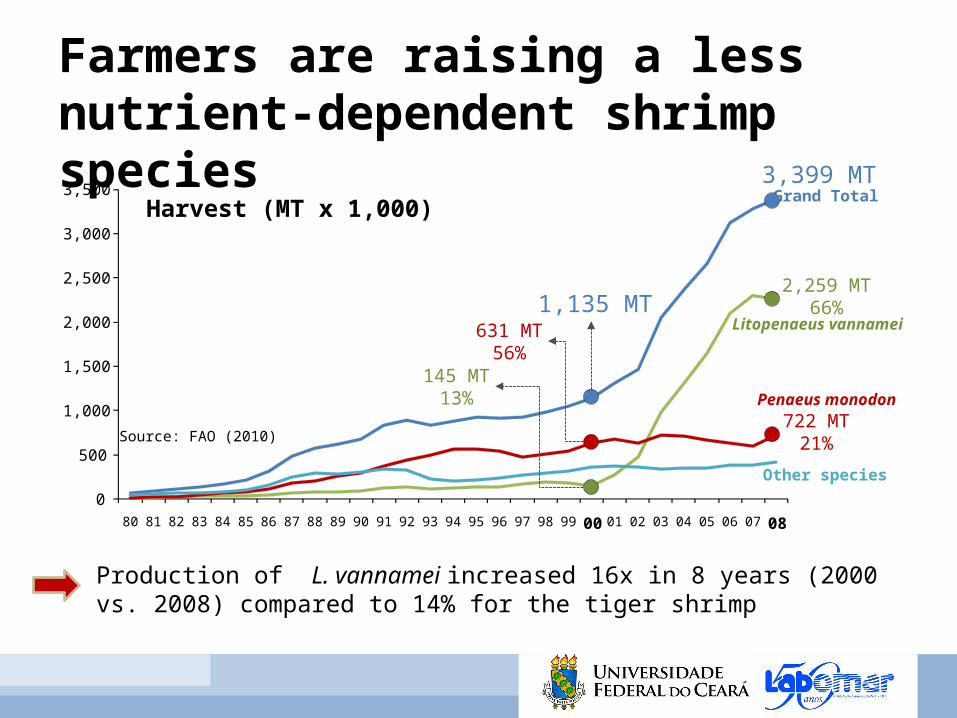
Farmers are raising a less nutrient-dependent shrimp species
Production of L. vannamei increased 16x in 8 years (2000 vs. 2008) compared to 14% for the tiger shrimp
Performance of L. vannamei in clear water after 56 days of rearing fed commercial diets. Temp. 29.5 C; sal. 33.4 ‰; stocking density. 114 ind./m2; initial weight 3.28 (± 0.31). Source: Lemos and Nunes (2008). Aquaculture Nutrition 2008 14; 181–191.
T5
0.91b (0.04)
349.1ab (58.7)
2.26 (0.44)
444.1b (81.3)
977.9d (31.6)
0.98b (0.14)
0.78b (0.14)
90.8a (3.32)
T8
2.05 (0.27)
439.2b (64.8)
887.9c (23.7)
0.97b (0.13)
0.77b (0.11)
91.2a (2.31)
T7Parameters
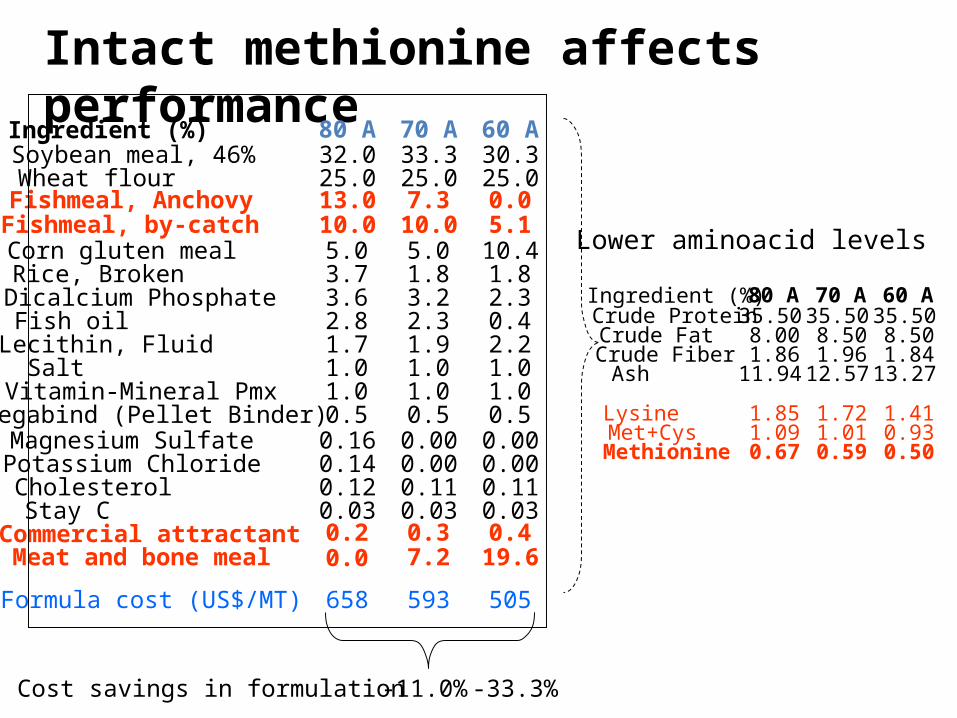
371 (1.2)1.38
0.51%
Crude ProteinMet. (g/100 CP)Met (%, dw)
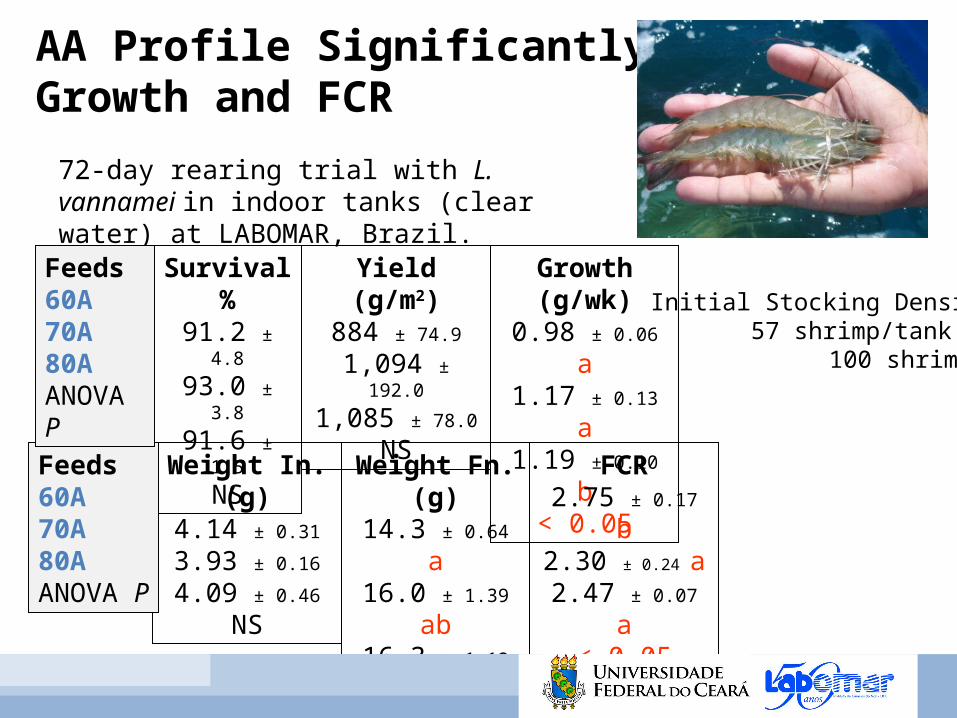
• High correlation between shrimp growth rate and methionine levels (R2 = 0.73)• Higher growth achieved when feed showed:
1. Lower number of EAA below recommended levels2. Methionine: 1.70 -1.75 g/100 g of crude protein3. Lysine: > 6.0 g/100 g of crude protein4. Methionine+cystine: > 2.68 g/100 g of crude protein
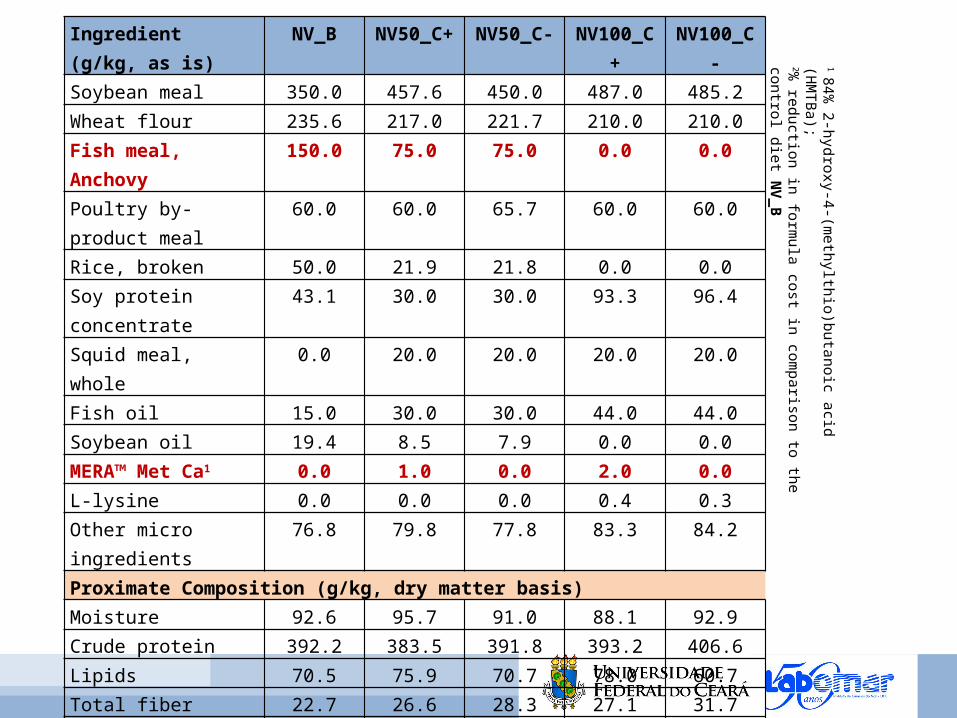
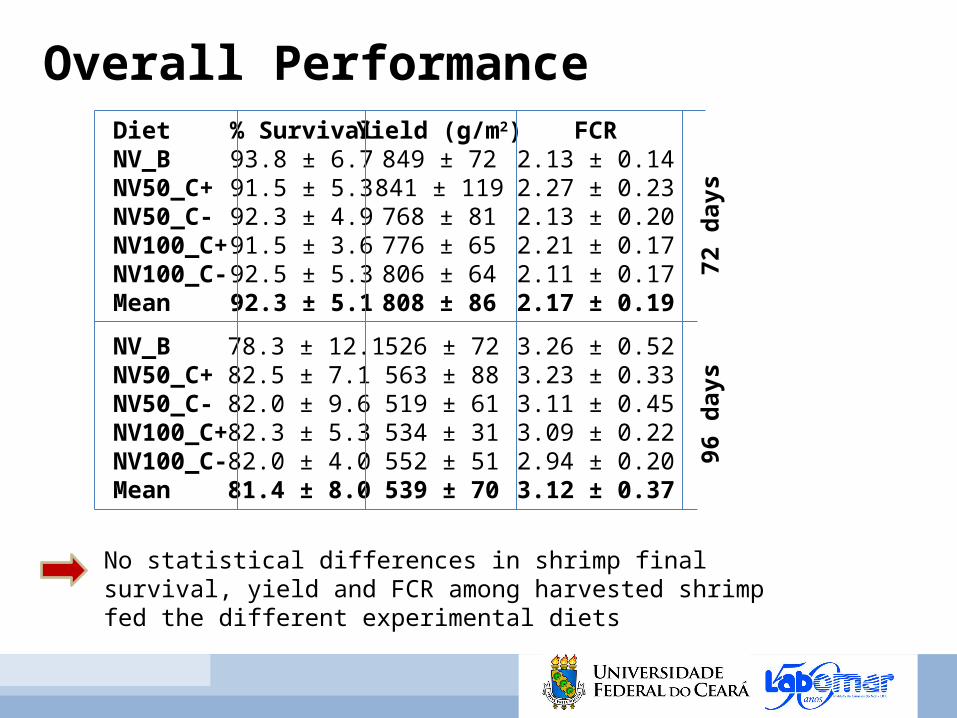
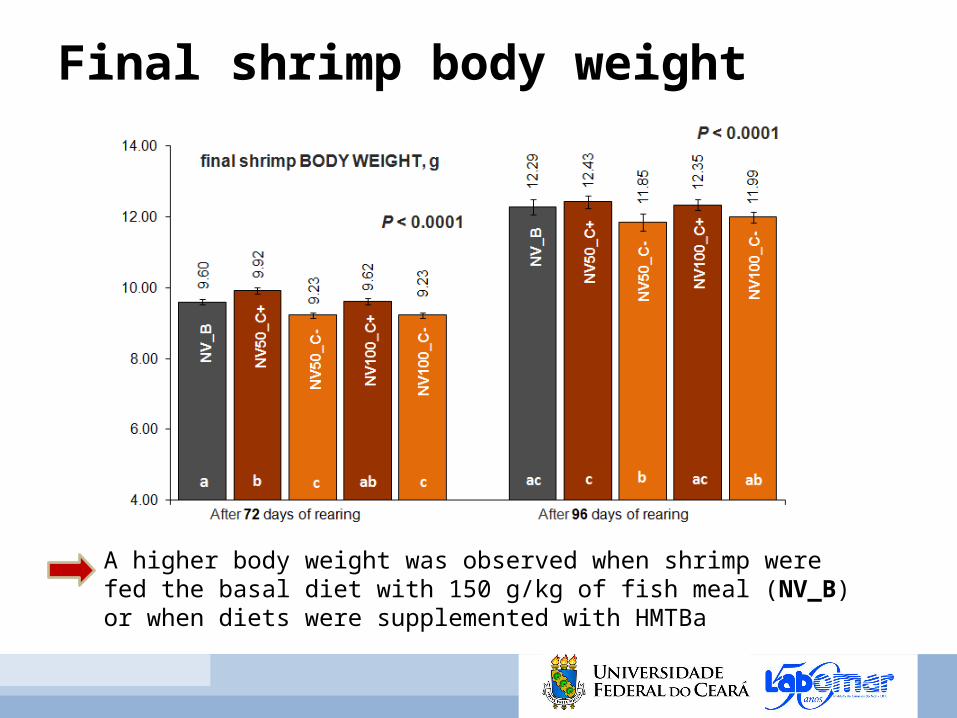
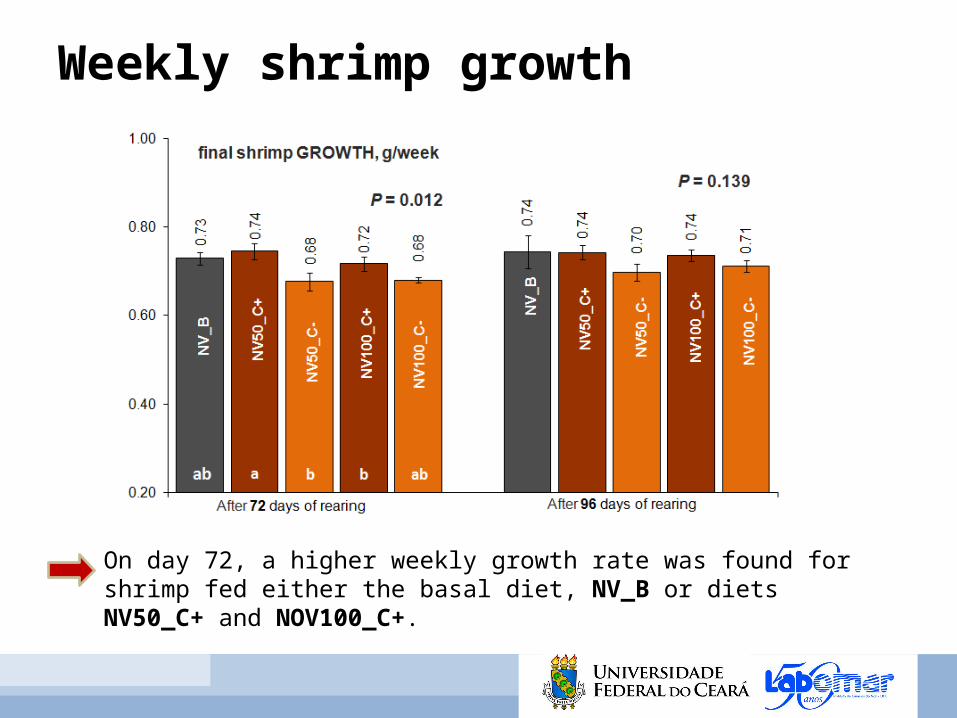
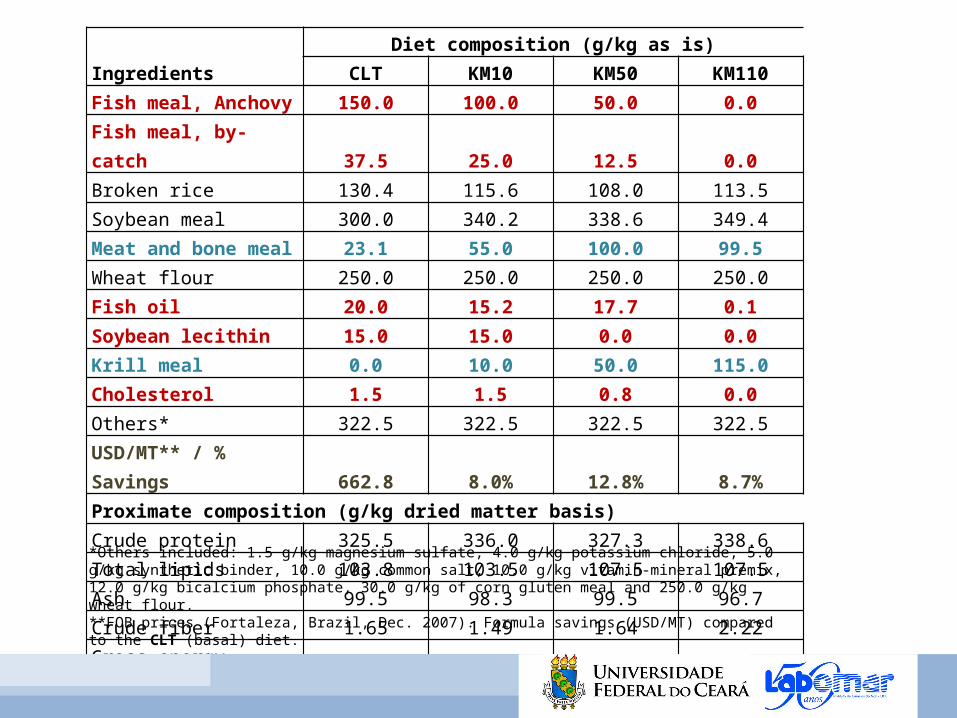
NV_B: basal diet with 150 g/kg of Anchovy fishmeal (FML)NV50_C+: positive control diet with 50 g/kg of FML + 1g/kg MERA™ Met CaNV50_C-: negative control diet with 50 g/kg of FML and no MERA™ Met CaNV100_C+: positive control diet without FML + 2 g/kg MERA™ Met CaNV100_C-: negative control diet without FML and no MERA™ Met Ca
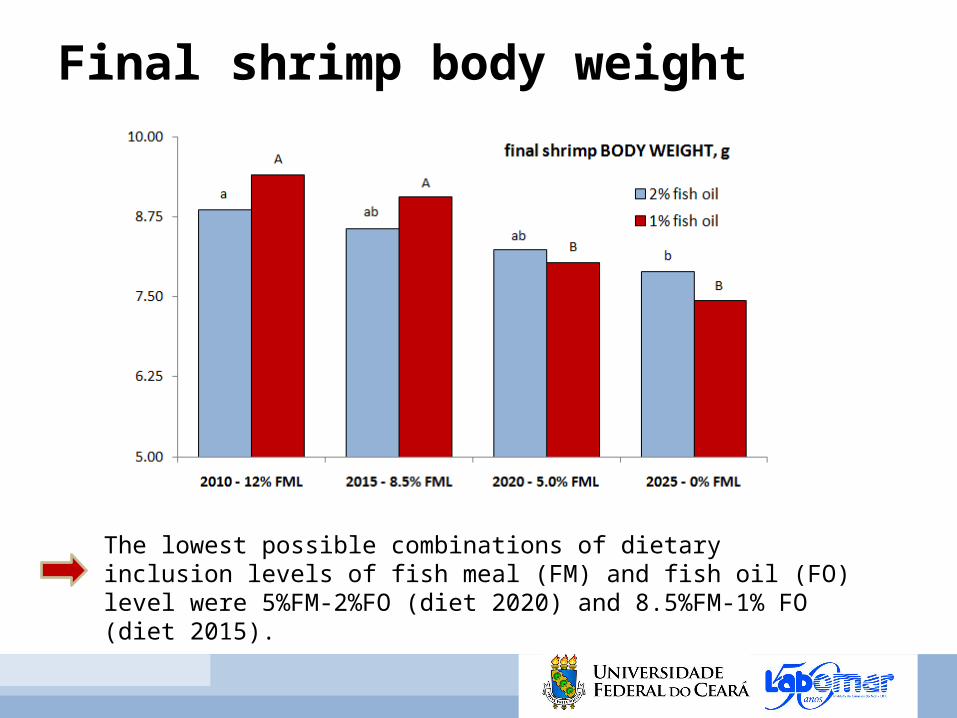
A higher body weight was observed when shrimp were fed the basal diet with 150 g/kg of fish meal (NV_B) or when diets were supplemented with HMTBa
Final shrimp body weight
On day 72, a higher weekly growth rate was found for shrimp fed either the basal diet, NV_B or diets NV50_C+ and NOV100_C+.
Weekly shrimp growth
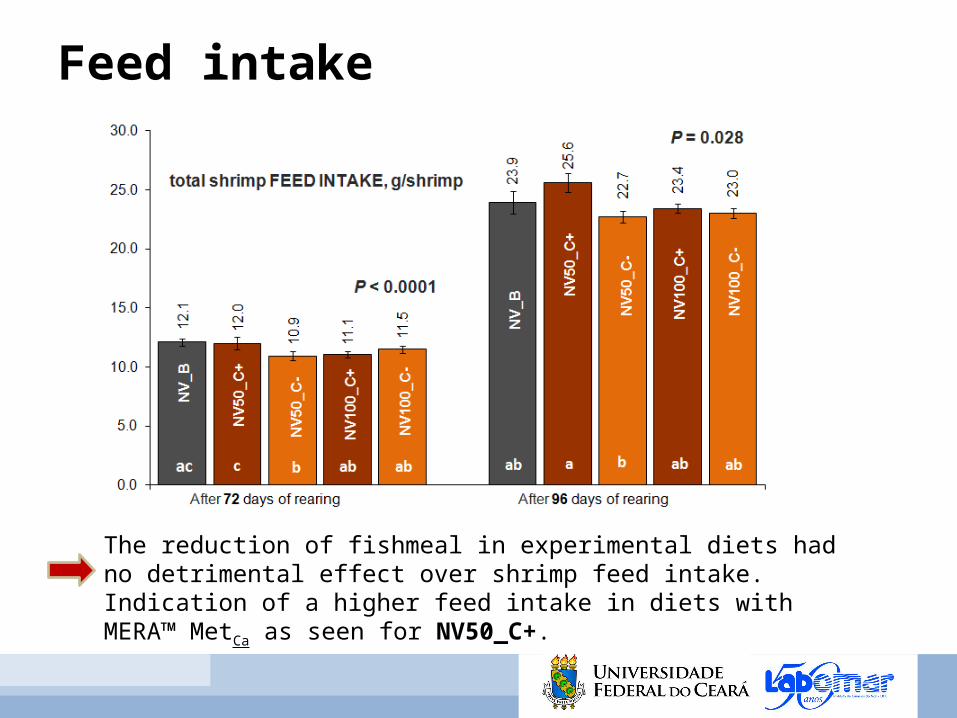
The reduction of fishmeal in experimental diets had no detrimental effect over shrimp feed intake. Indication of a higher feed intake in diets with MERA™ MetCa as seen for NV50_C+.
Feed intake
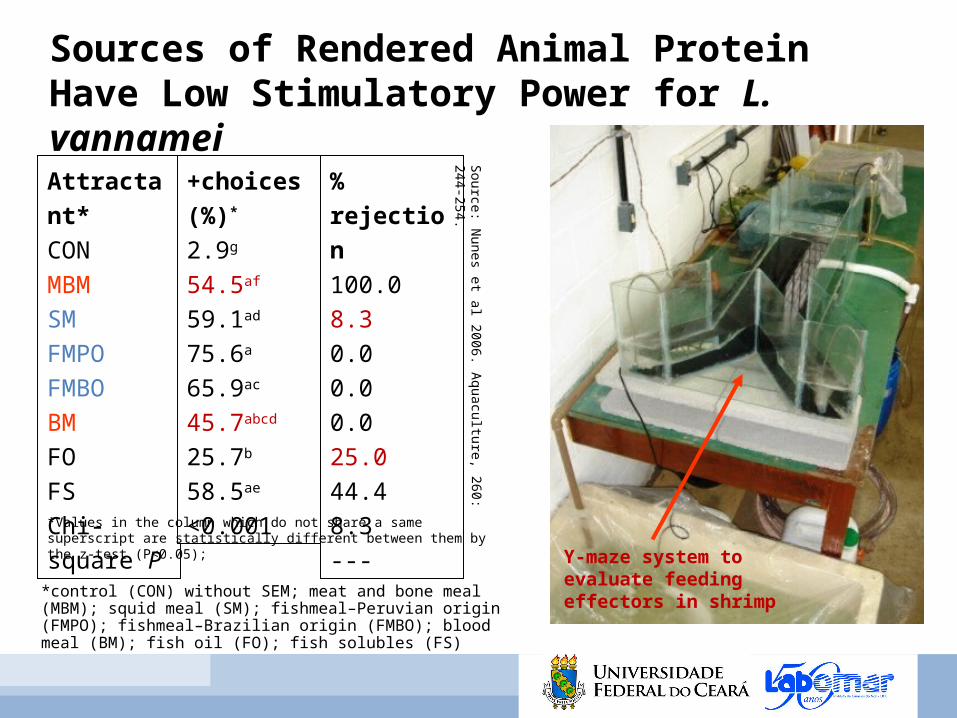
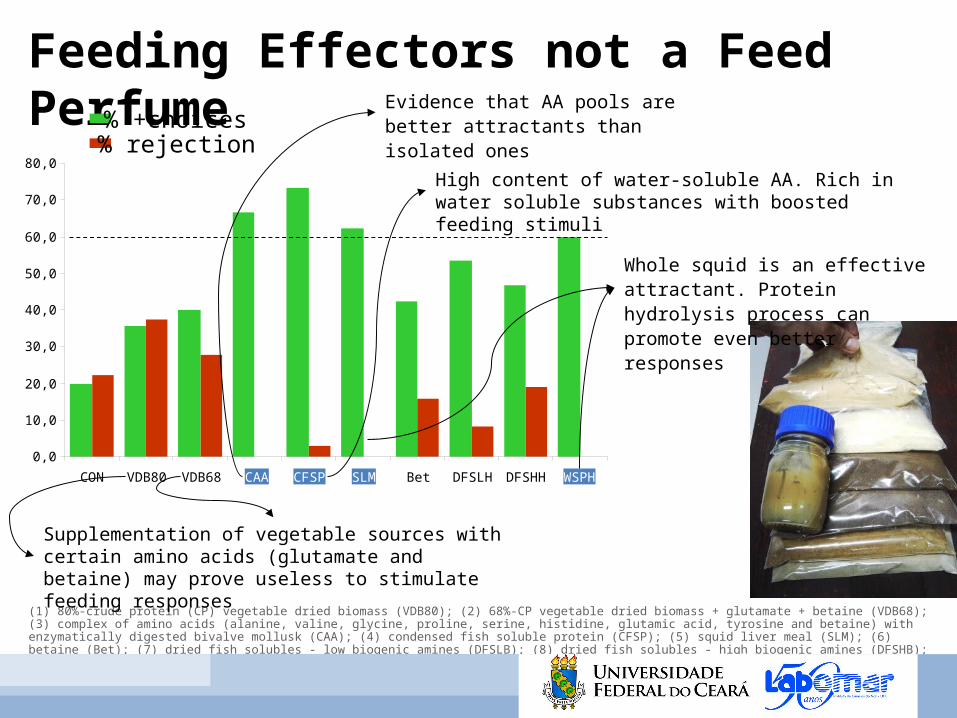
The addition of poultry by-product meal, squid meal and HMTBa may have helped prevent reductions in palatability typically associated with reductions in fish meal content.
Feed attractability
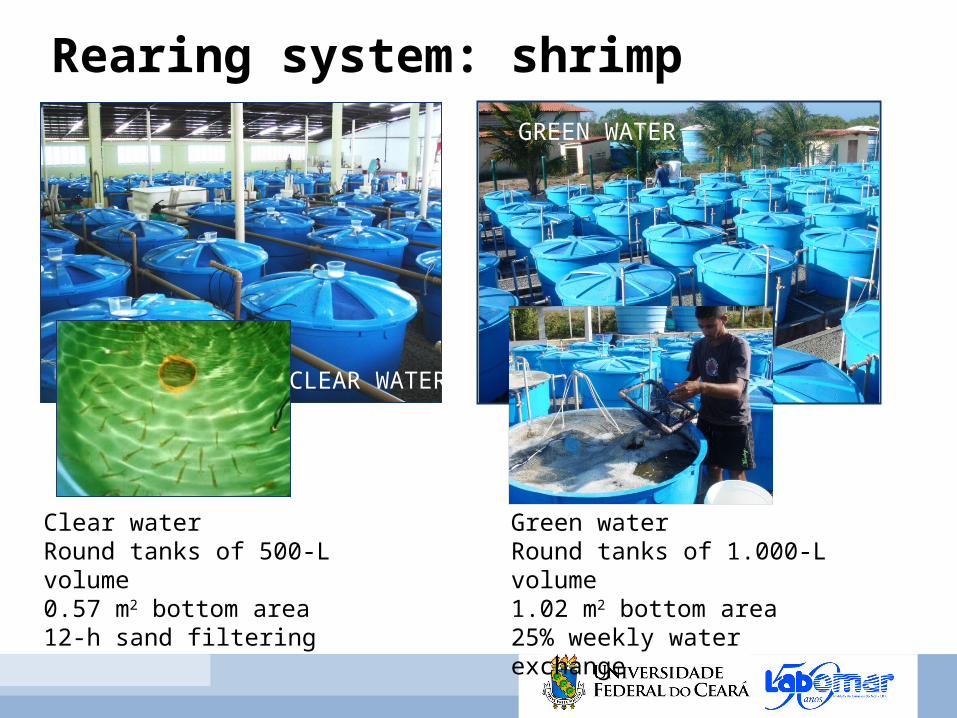
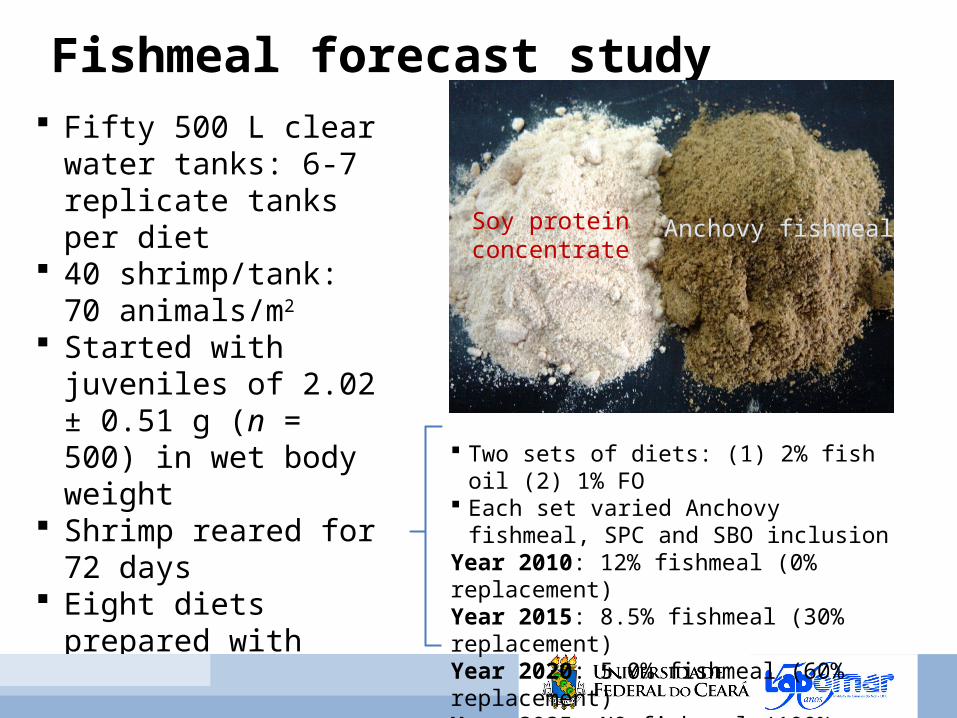
Fifty 500 L clear water tanks: 6-7 replicate tanks per diet
40 shrimp/tank: 70 animals/m2
Started with juveniles of 2.02 ± 0.51 g (n = 500) in wet body weight
Shrimp reared for 72 days
Eight diets prepared with laboratory equipment
Fishmeal forecast study
Anchovy fishmealSoy protein concentrate
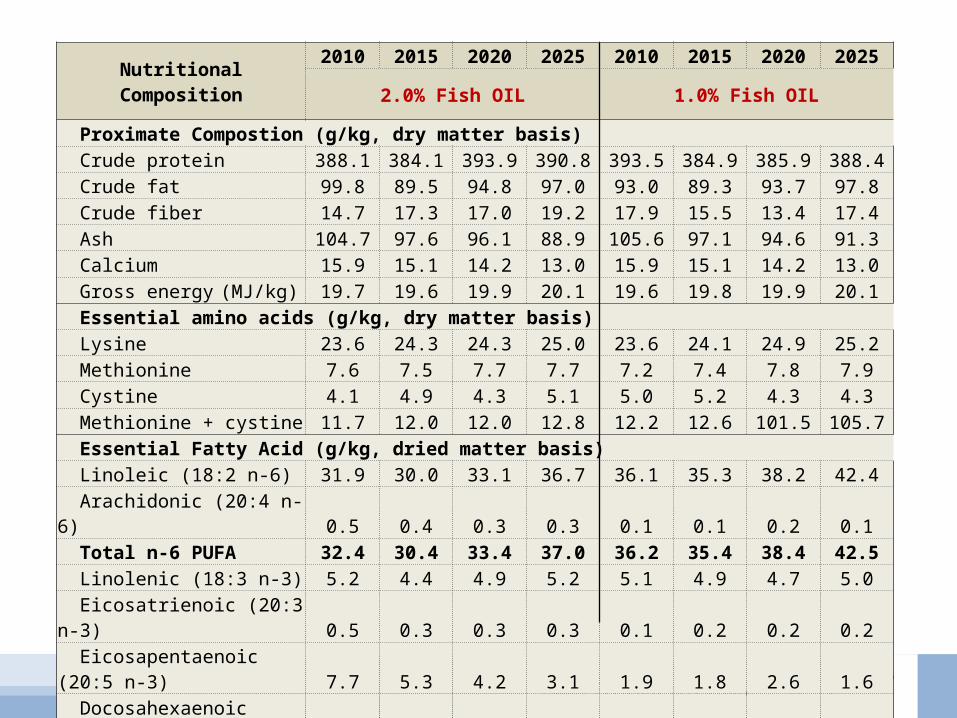
Two sets of diets: (1) 2% fish oil (2) 1% FO Each set varied Anchovy fishmeal, SPC and
12.0 2010 0.69 ± 0.06 A 0.74 ± 0.07 A8.5 2015 0.65 ± 0.04 AB 0.70 ± 0.09 A5.0 2020 0.62 ± 0.09 AB 0.60 ± 0.05 B0.0 2025 0.58 ± 0.07 B 0.53 ± 0.06 B
Yield (g/m²)
12.0 2010 547.5 ± 29.2 Aa 592.7 ± 47.1 Aa8.5 2015 540.0 ± 13.0 Aa 597.4 ± 46.2 Ab5.0 2020 538.5 ± 47.5 Aa 505.5 ± 52.5 Ba0.0 2025 524.5 ± 63.0 Aa 477.7 ± 59.1 Ba
Final shrimp body weight
The lowest possible combinations of dietary inclusion levels of fish meal (FM) and fish oil (FO) level were 5%FM-2%FO (diet 2020) and 8.5%FM-1% FO (diet 2015).
Feed intake
Feed intake was consistent among experimental diets, except when fishmeal was removed in the 1% fish oil diet
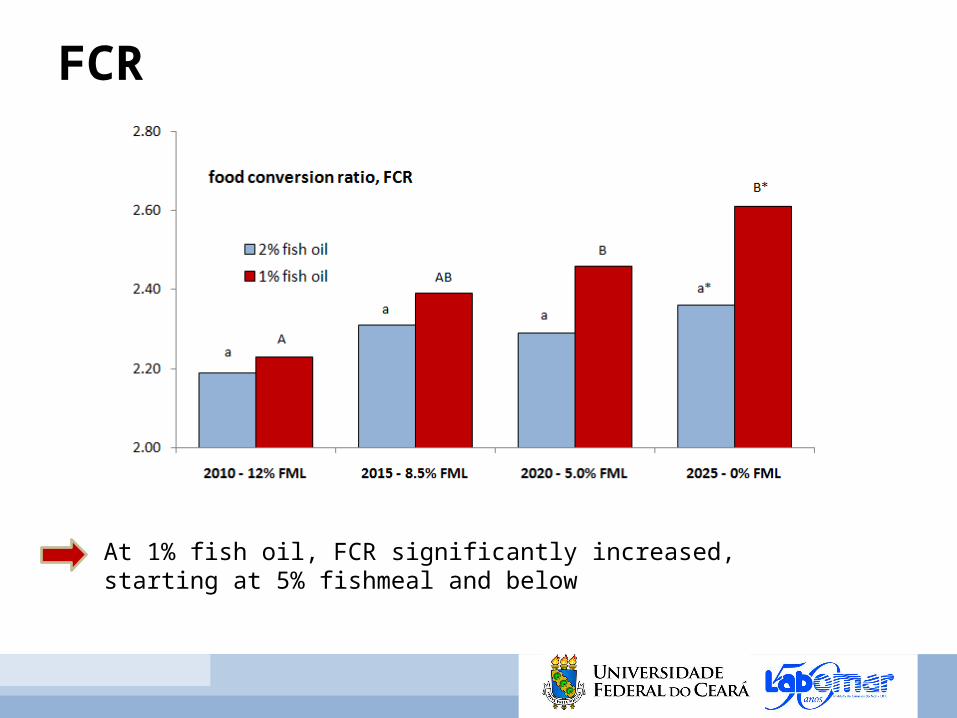
FCR
At 1% fish oil, FCR significantly increased, starting at 5% fishmeal and below
Fishmeal, Anchovy
67.65%Protein7.61%
Lipid
24.74%Other
Krill meal
60.10%Protein25.00%
Lipid
14.90%Other
4.07% 1.57%3.04%5.07%5.01%1.92%2.76%2.55%3.51%
EAA (as is)ARGHISISOLEULYSMETPHETHRVAL 6.11%
2.61%3.85%6.61%7.22%2.66%3.81%3.19%3.99%
EAA (as is)ARGHISISOLEULYSMETPHETHRVAL
4.32% TL1.80% TL
EFA (% of total lipid)ƩHUFA n-3ƩHUFA n-6
22.11% TL4.99% TL
EFA (% of total lipid)ƩHUFA n-3ƩHUFA n-6
versus
> 40% phospholipid
Objectives
1. To evaluate the growth performance of juveniles of L. vannamei when fed diets containing Krill meal and Krill oil under partial or full replacement of fishmeal, fish oil, soy lecithin and cholesterol
2. To determine optimum inclusion levels of Krill meal in diets for the white shrimp in regards its growth and economical performance
Major protein and lipid ingredients used in experimental diets for growth trials with L. vannamei
*AFI, apparent feed intake per area of culture (kg/m2); FCR, food conversion ratio.
Growth response (mean ± standard deviation) of L. vannamei juveniles fed diets containing Krill meal for 72 days in 500-L indoor (clear water) and 1,000-L outdoor (green water) tanks. Source: Nunes et al. (2010). Aquaculture Nutrition.
BFT creates new perspectives in the way shrimp feeds are formulated
Bioflocs can spare protein and the dependence on fishmeal in shrimp diets
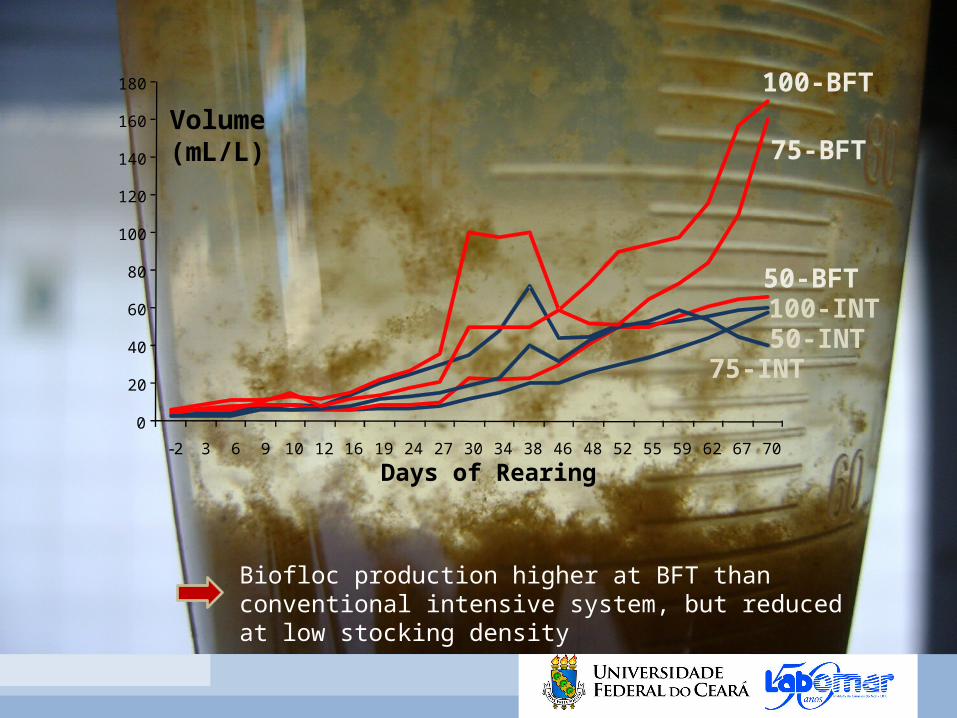
Biofloc system in a commercial shrimp farm in NE Brazil
Biofloc production higher at BFT than conventional intensive system, but reduced at low stocking density
Why shrimp feeds still rely on fishmeal?(1) ECONOMICS: use remains economically
competitive at strategic inclusion levels, for specialty diets (starters, anti-stress/transition, premium) and certain markets
(2) CONVENIENCE: few ingredients available capable of replacing the single value of fishmeal. It contains a highly attractive package from the nutrition standpoint
Highly digestible, few anti-nutritional factors, feeding effectors, unidentified growth factors
(3) MARKET PERCEPTION: feeds with high levels of fishmeal are still perceived as high performers
CONCLUSIONS1. On methionine supplementation:
Supplementation of crystalline amino acids provides a viable cost effective alternative for innovative nutritional strategies focusing on maintaining ideal protein ratios in the diet while providing increased flexibility in ingredient selection.
2. On fishmeal reduction:Effective fishmeal reduction in shrimp diets is dependent on methionine supplementation and an adequate supply of fish oil or another source of n-3 HUFA. Reduction beyond 5% fishmeal inclusion with 1% fish oil caused detriment to shrimp performance.
Acknowledgements
Financial supportNovus International Inc. (USA)EMBRAPA – Empresa de Pesquisa Agropecuária (Brazil)
Co-workers Dr. Marcelo Sá, Hassan Sabry-Neto, students and staff at LABOMAR