27
X600 TRACEability ™ VERSION 3.02 90/00901217-7 ISSUE 7 01/2014 FOR USE WITH MODELS T625 & T631 OPERATION MANUAL

X600 TRACEability™
Ve r s ion 3.02
90/00901217-7 i ssU e 7 01/2014 For Us e with mod e ls t625 & t631
oPe rAtion mAn UAl

2 X600 TRACEability Operation Manual

3 X600 TRACEability Operation Manual
Contents1 Introduction 42 Features 43 Installation 4 3.1 System Requirements 4 3.2 Installation 5 3.3 Screen Tour 5 3.4 Using the mouse to select X600 TRACEability
functions 6 3.5 Using the keyboard to select X600 TRACEability
functions 74 Operating Instructions 7 4.1 Import 8 4.1.1 Select comms port 8 4.1.2 Import from instrument 8 4.2 Functions 12 4.2.1 Graph Menu 12 4.2.2 Edit Function 16 4.2.3 File Menu 16 4.2.4 Toolbar Menu 18 4.2.5 Help Menu 18
4.3 Export 18 4.3.1 To clipboard 18 4.3.2 To file 18 4.3.3 To instrument 185 Application Notes 19Appendix A – Return Loss 23Appendix B – Preloaded Waveforms 25Appendix C – Configuring a Virtual COM Port 26
4 X600 TRACEability Operation Manual
1 Introduction
X600 TRACEability has been designed with ease of use in mind whilst allowing complete facilities to manipulate the information stored.
X600 TRACEability works in the Microsoft Windows system and this manual will guide you from installation of the software, through all the facilities offered. It is expected that you will have some basic knowledge of PC’s and Microsoft Windows software, though minimal knowledge will get you started and we suggest you spend a little time familiarizing with the program if this is so.
We hope that this product will become a key element of your cable maintenance and fault location capability.
2 Features
• Long term mass storage of cable waveforms.
• Transfer of waveforms from any or all of the instrument memories.
• Transfer of waveforms from the PC back into the instrument.
• Manipulation of stored waveforms via the PC controls to adjust Gain, Waveform shift up or down, Zoom, 2 Cursors, Dielectric setting, Units, and Range.
• Waveforms may be identified by Cable ID, time, date, and additional comments may be added.
• Up to four waveforms may be displayed simultaneously.
• The difference waveform between any 2 displayed waveforms may be displayed simultaneously.
• dBRL measurements may be carried out.
3 Installation
3.1 System Requirements
1 X600 is compliant with both the 32 and 64 bit versions of Windows XP, Windows Vista and Windows 7.
2 The computer must have either an available Serial port or a USB port. A user-supplied RS232 cable with cross-over (null modem type) will connect the instrument to a standard DB-9 male serial connector. A USB to RS232 adapter can be used for computers without a DB-9 connector.

5 X600 TRACEability Operation Manual
3.2 Installation
X600 can be installed from the Radiodetection website at: http://www.radiodetection.com/X600.
Follow the instructions on the web page to install X600 to your PC.
3.3 Screen Tour
When the program is first entered the display will be as shown in Figure 1. The large space below the toolbar, which contains the copyright message, is known as the ‘waveform display area’ and will contain the waveform(s) being displayed. The space below this, contained within two lines, will have information relating to the range, cursor positions, and DIEL setting and this is known as the ‘distance and pvf area’.
Figure 1
Figure 2
The space below is split into two areas; a large area left and centre (the ‘waveform information area’) and five grey ‘buttons’ on the right (the ‘waveform selection buttons’) (see Figure 2).

6 X600 TRACEability Operation Manual
As waveforms are loaded into the waveform display area, the filenames appear (minus the ‘.bic’ extension) on one of the grey buttons and the detailed waveform information is displayed in the waveform information area. This may be repeated for up to four waveforms.
The details relating to any individual waveform may be displayed by clicking with the mouse on the appropriate grey button. To facilitate identification, the waveforms are displayed in four distinguishing colours, red, green, dark blue and light blue, and a bar of the same colour is indicated beside each waveform selection button.
When a waveform is selected, the filename is displayed in the waveform information area (here showing the full filename including path and extension) using the same colour as the waveform itself. The bottom waveform selection button is reserved for a difference display which will show the difference between any two waveforms currently being displayed. It is distinguished by its black colour with the button itself identified as ‘Diff’. The waveform information area contains the full filenames of the two waveforms and their respective gain settings, when the ‘Diff’ button is selected.
Access to the X600 TRACEability functions is obtained either by using a mouse to select the drop-down menus, (immediately below the Title bar), or the buttons of the toolbar (which either runs below the menus when the toolbar is in ‘Normal’ mode or bunched up to the right and just below the menus when in ‘Instrument’ mode), or by using Shortcut keys.
3.4 Using the mouse to select X600 TRACEability functions
To access the menus, point to the desired menu header with the mouse and click. The required option is then selected from the drop-down menu that will appear by pointing to it and clicking.
Note: If any of these options are invalid at the time of your selecting the menu it will either appear ‘greyed out’ and clicking on it will be ignored, or selecting the option will result in an error message window to advise you of the reason for its invalidity.
7 X600 TRACEability Operation Manual
3.5 Using the keyboard to select X600 TRACEability functions
There are two sets of Shortcut keys, (as keyboard access to Windows functions are known), those relating to the menu and those to the toolbar. It should be noted that both the menu titles and their submenus, and the toolbar titles have a single letter underlined (e.g. F in the File menu or R in the Recall toolbar button). The Shortcut keys are accessed slightly differently depending on whether the target is in the menu or on the toolbar.
If the target is on the menu, the shortcut key is actioned by pressing and holding down the Alt key and then simultaneously pressing the underlined letter on the target menu. If the target is on the toolbar the action is similar but the Ctrl key is used instead of the ‘Alt’ key.
The exception to this is the cursor movement buttons on the toolbar which are accessed by using the keyboard cursor controls.
In addition, if an action is required to mark a selection (i.e. place a cross in a selection box), this is done by pressing the TAB key to position the ‘dotted select oblong’ alongside the desired selection box, and then pressing the Space Bar to select the option.
File and Graph menus besides indicating shortcut keys, have some instances where an arrow preceding a letter (e.g. ^S) indicates that this function is also available via the toolbar.
The PC program contains some waveforms so it is suggested that the first step should be to have a look at some of these at least. This will enable the operator to become familiar with the functions available on the program. Details of the waveforms are contained in Appendix B.
4 Operating Instructions
Note 1: In this section letters that are shown underlined signify the shortcut key (see section 3.5).
It is possible to transfer trace data between the X600 TRACEability software and T600 series TDR instruments using a standard 9 way null modem cable female-female or a USB to RS232 adapter.
Note 2: Please follow the instructions in Appendix C if you are using a USB to RS232 adapter.

8 X600 TRACEability Operation Manual
4.1 Import
Selecting Import will prompt:
Figure 3
4.1.1 Select comms port
Select port to which the instrument is connected.
Figure 4
• Click the button to refresh the list of available COM ports.
• Click the button to obtain information on setting COM port characteristics.
• Then click Ok button.
4.1.2 Import from instrument
Then, selecting Import from Instrument will prompt:
Figure 5
Select Start which will prompt:
Figure 6
As information is being imported the 0% – 100% box will be filled. The instrument will display the fact that it is transmitting. The instrument must be in a display mode to enable this process, i.e. showing a live or memorized waveform.
9 X600 TRACEability Operation Manual
When importing and Cancel is selected (Figure 6), this will prompt:
Figure 7
• Yes will return to main display and “Data Transfer Incomplete” will appear on the screen.
• No will return to data transfer mode.
Once the transfer is complete, the following display will appear:
Figure 8
Imported memories will be identified as above; the total number of memories indicated will depend on the capacity of the instrument. This will allow you to select which memories you wish to store.
Mark each memory you wish to file in the PC and select OK, or alternatively Select All. Cancel will return screen to previous display.
Having made the selection OK will show:
Figure 9
If No comments is selected, the screen will display as in Figure 10.
Filename and Directory shown are default values.
10 X600 TRACEability Operation Manual
Figure 10
You now have the opportunity to name your file in the Filename box.
File name
The actual filename used by X600 TRACEability to store the waveforms is composed of three elements: the user name, the memory and the file extension. Dealing with the latter first, the X600 TRACEability uses the standard file extension of ‘.bic’ and if no extension is defined by you, this is used as the default1.
1It is recommended that this standard file extension is not changed unless you are fully familiar with Windows file handling/access methods as this may lead to over-complicating the waveform accessing process.
If you now start typing, the X600 TRACEability will assume you are entering the user name. You should choose a name that will assist in identifying the files in future use – the name must consist of one to six characters in length. When you have entered this user name click the OK button. The X600 TRACEability will then append two numbers to this name corresponding to the number of the instrument memory from which the wave form was uploaded (padded with zeroes if necessary i.e. for memory 6, the name is appended with ‘06’).
This is done for each memory selected and the files are stored for future use. As an example, suppose you have imported memories 2, 3 and 11 and have entered the user name for the files ‘btest’ then three files will be saved as: btest02.bic, btest03.bic and btest11.bic.
Figure 11

11 X600 TRACEability Operation Manual
Should you wish to cancel the save operation, click the Cancel button. This will prompt you to confirm your intention to abandon the data transfer as shown.
Figure 12
• Yes will return you to normal display.
• No will return you to Save File as display.
Note 1: If the X600 TRACEability detects that the filename being saved is the same as an existing one, it will prompt you questioning whether the existing file should be overwritten. If you answer Yes, the waveform in the existing file will be permanently lost as the new waveform will replace it. If you are unsure as to whether this is acceptable, you should answer No and you will be returned to the ‘user name’ entry screen and you should enter a different name and try again.
Note 2: This will be repeated for every file you try to replace so if you are saving three waveforms and all three names have been used previously on your PC, it will prompt you three times, it will not assume that you intend to replace all three if you answer Yes to replace the first one.
With reference to Figure 9, Common comments will display:
Figure 13
This allows relevant data to be entered, instrument data such as range; pulse width etc. is automatically stored.
More gives access to a further page for comments.
Having entered relevant information and selected Ok the message ‘Save File as’ will appear as before to enable a filename to be assigned. Cancel will cancel comments entry and again put you into Save File as (Figure 10).

12 X600 TRACEability Operation Manual
With reference to figure 9, Individual comments will display:
Figure 14
This allows relevant data to be entered and stored for each waveform in turn. OK steps on to next waveform. When the last wave form has been okayed, ‘Save File as’ appears to allow a filename to be assigned.
Cancel will stop the save operation for that waveform only and hence will step onto the next memory (if there are more left) and will prompt you for entry as before.
No further comments will take you to Save File as (Figure 10).
4.2 Functions
4.2.1 Graph Menu
Add Waveform and Select Waveform.
To display a waveform Recall or Graph (toolbar key/menu) allows access to the files to select waveforms for display.
Recall/Add waveform (toolbar/menu) will access files. This will allow one waveform at a time to be selected for display. When a waveform is highlighted, any edit comments which were applied to it when imported, or subsequently, will appear in the box below the file directory.
Figure 15

13 X600 TRACEability Operation Manual
The maximum number of waveforms that may be selected is four. If a waveform is already displayed then adding a waveform with a different gain or pulse width will result in a warning message being displayed. A difference in PVF (or DIEL) will not be allowed unless x-axis units are changed to time, or PVF values are all made the same.
Mode/Select Waveform (toolbar/menu) gives the option of displaying any combination of the waveforms accessed, and the difference of any two waveforms.
Figure 16
The waveforms can be selected for display by indicating the Display box.
To display the difference between two waveforms check the Difference Box and the Difference Waveform Box. If more or less than two Difference Boxes are indicated a problem
message will be displayed even if the Difference Waveform is not indicated.
If an attempt is made to recall a waveform with a different PVF the following will appear on screen.
Figure 17
If the x-axis is changed to time, on quit the original PVF will be saved to each waveform.
If all dielectric values are made the same, on quit a prompt will appear for any changed waveform to question whether or not the change is to be saved.
Figure 18
14 X600 TRACEability Operation Manual
If a waveform has a different range from one already in the Waveform Display Mode then the new waveform will be scaled to match that of the one already being displayed. If this results in the waveform being longer that the screen width, it will be truncated at the right hand side of the wave form display area, but the waveform will not be altered or data lost. A subsequent action to increase the displayed range will show this extra information as it was captured to memory in the originating instrument.
While in Waveform Display Mode certain manipulations can be carried out on the waveforms. PVF (DIEL) and Range can be increased or decreased and will apply to all waveforms thereafter until altered again.
Changes to Gain (AMP) or the vertical position of the waveform (Up, Down) will only be carried out on the selected waveform. The Filename for any of the waveforms can be brought up by identifying the relevant box in the bottom right hand corner, but this step is only allowed if the waveform is displayed.
Gain can be varied by ±24 dB (in 6 dB steps) from that originally imported with the waveform.
If the gain is changed before the waveform is removed, a prompt will enquire whether the change is to be saved or not. Since this information will be stored as original gain and the
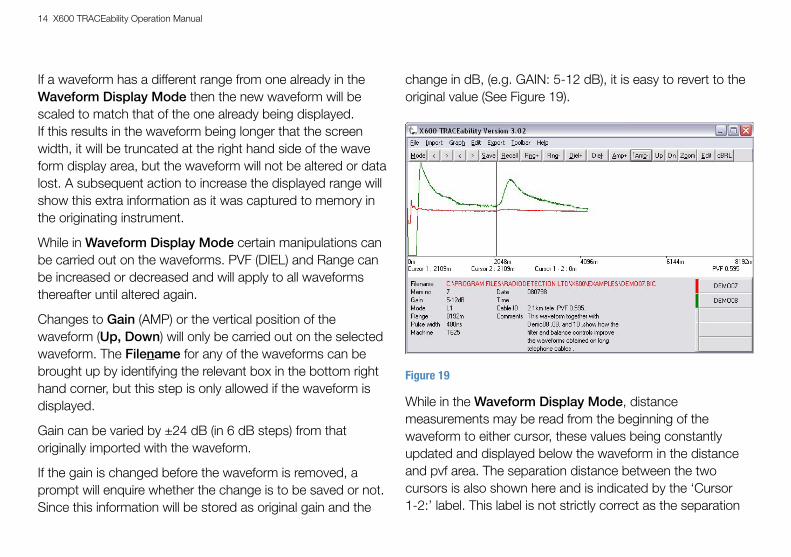
change in dB, (e.g. GAIN: 5-12 dB), it is easy to revert to the original value (See Figure 19).
Figure 19
While in the Waveform Display Mode, distance measurements may be read from the beginning of the waveform to either cursor, these values being constantly updated and displayed below the waveform in the distance and pvf area. The separation distance between the two cursors is also shown here and is indicated by the ‘Cursor 1-2:’ label. This label is not strictly correct as the separation

15 X600 TRACEability Operation Manual
is actually the ‘active’ cursor position minus the “inactive” cursor position. The active cursor is distinguished from the inactive one by the former being displayed with a solid line and the latter a dashed one. To make a particular cursor active is accomplished in one of three ways: point to the required cursor with the mouse and click, click on one of the cursor movement buttons on the toolbar – shown as ‘<’ and ‘>’ (the left pair correspond to Cursor 1, the right to Cursor 2 in either Normal or Instrument toolbar mode), or pressing the space bar toggles between the two cursors. (Note the cursor difference ‘sign’ reflects this action by changing from +ve to -ve as the active cursor switches sides).
Moving a cursor is achieved either by using the cursor movement buttons mentioned above or by clicking on the required cursor and holding the mouse button down – the cursor may then be ‘dragged’ to its new position by moving the mouse left or right until the mouse button is released. The active cursor may also be moved by using the PC’s left and right cursor keys (usually shown as ‘←’ and ‘→’).
dBRL
The dBRL function on the X600 TRACEability toolbar allows the user to perform simple Return Loss calculations on the selected waveform uploaded from the T625 and T631 instruments. For these measurements, the reference pulse
must not saturate at any point (i.e. overshoot the top of the display). For this reason if waveforms are to be imported into a computer for the purpose of measuring return loss ensure that the waveforms do not saturate at any point. It should be noted that the dBRL function on the X600 TRACEability takes no account of pulse attenuation due to cable loss. It should also be noted that the amplitude of the reflection varies with the pulse width and hence the test frequency (see appendix A). The calculation does, however, provide a good indication of the state of a cable for the pulse width chosen. For more accurate measurements of dBRL, the T631 instrument should be used.
To measure the Return Loss of a reflection relative to another feature
1 Open up the required waveform using the ‘Graph’ and ‘Add’ Waveform options (if required).
2 Move cursor 2 over the desired feature (ensure that the correct cursor is moved).
3 Move cursor 1 over the desired reference feature (e.g. transmit pulse, joint etc.).
4 Press the ‘dBRL’ button on the toolbar.
5 A dialog box will appear giving the magnitude of the Return Loss at the point of interest.
16 X600 TRACEability Operation Manual
Close waveform
This will either prompt you for confirmation to ‘clear current trace’ if only one trace is being displayed, or list the waveforms that are open and allow the removal of any selected trace including closing them all if required (see Close all waveforms below). Again if any of the selected waveforms have changed you will be prompted to confirm that you wish the change to be saved.
Close all waveforms
When you select this, you are prompted with the message ‘Clear ALL waveforms from screen’. Selecting Ok will clear all displayed traces (unless any have been altered in which case you will be prompted about saving each of these) and return you to the Radiodetection copyright screen, Cancel will return you to the trace display screen without any changes. (Note: This function is identical to the File menu and New submenu command).
Select waveform or Mode (toolbar)
Gives access to Waveform Display Mode. This will enable waveforms to be selected for display. If two or more waveforms are available a “Difference” waveform may be selected.
Change X-Axis units
Allows measurement units to be displayed as metres,feet, or time (i.e. microseconds or nanoseconds).
Change dielectric units
Allows dielectric units to be displayed as PVF, V or V/2.
4.2.2 Edit Function
The Edit function is available either from menu or toolbar, or by point and click in the Filename area. The text associated with any waveform which is in the waveform display mode can be amended, or added to. Menu access allows any of the waveforms to be selected. Edit is only available if the waveform is actually displayed. In toolbar or filename area only the waveform for which the data is displayed can be edited. The relevant waveform in this instance can be highlighted via the relevant box in the bottom right hand corner.
4.2.3 File Menu
Save
This option, available on the toolbar, will save the waveforms in the Waveform Display Mode, (whether displayed or not), as they are, i.e. if Gain or PVF has been changed, when the waveforms are removed no prompt will appear to ask if the changes are to be saved.

17 X600 TRACEability Operation Manual
Save as
Allows the displayed waveform to be saved under a different filename to that currently used (Note it does not delete the original file and hence the original is left unaltered by this action cf. Save above which updates the current file’s contents). If the new name entered already exists, a prompt will appear:
Figure 20
Yes will implement the change, overwriting the existing file (Note the existing file contents will be replaced by those now saved and the existing trace information will be lost).
No will return to the File, Save as option allowing you to select a different filename.
Cancel will return to the main display, unless other waveforms are available in which case it will return to File, Save as with next waveform highlighted.
Print via a PC
If a printer is available a print will be made. If a printer is not connected, or is out of paper an error message will appear.
Because of the many printer configurations that exist, the print out may not always be clear. If this is the case, select Export to clipboard, then open an application (e.g. Microsoft Word) which will allow the contents of the clipboard to be “pasted” and then printed from the application (see Section 4.3).
To remove waveforms from Waveform Display Mode select either File (New) or Graph (Close waveform) or Graph (Close all Waveforms). Then follow the on screen prompts.
If there has been a change to any waveform a prompt will appear to question whether the change is to be saved or not, this will apply to any waveform which has been changed.
Figure 21
Exit
This will end this session of the X600 TRACEability program. If waveforms are being displayed, they will be closed, (with associated prompts regarding saving if the waveforms have been altered during the session as with normal closing of waveform displays), and will close all Windows operations that have been started by the X600 TRACEability.

18 X600 TRACEability Operation Manual
4.2.4 Toolbar Menu
Toolbar can be displayed as normal, (meaning a ‘normal’ Windows-type toolbar) i.e. under menu headings, or as instrument toolbar, where the active keys will be displayed in the top right hand corner in a similar format to a Bicotest T600-style instrument.
Note: the X600 is a common package for Bicotest’s range of T600 TDRs and hence the toolbar cannot be exactly as the instrument because of the difference between instruments.
4.2.5 Help Menu
The Help menu displays version information for the X600 TRACEability under the ‘About’ submenu.
Note: A Windows-style on-screen help menu does not exist.
4.3 Export
Figure 22
4.3.1 To clipboard
Output the screen image to the standard Windows clipboard. This allows the complete trace screen to be imported into another Windows application package that supports the graphical input of data via the clipboard, such as many word processors and graphical programs.
4.3.2 To file
This will create a Windows standard bitmap file of the currently selected trace (i.e. the trace whose information is being displayed in the ‘trace information area’). The file will have the same filename as the original trace but with an extension of ‘.bmp’ cf. ‘.bic’ as default.
4.3.3 To instrument
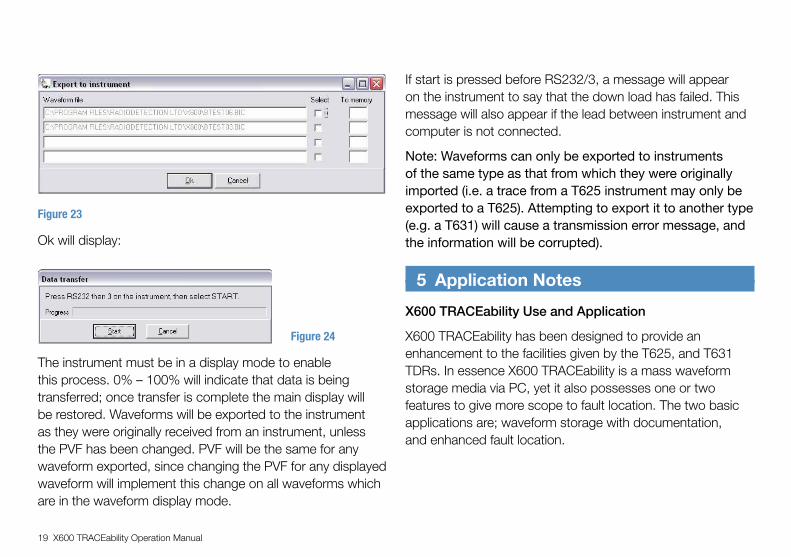
Allow any or all of the open waveforms to be sent to nominated memories in the instrument. The filename of open waveforms will appear below Waveform file. The select boxes allow those waveforms which are to be sent to the instrument to be selected. The memory to which the waveform is to be sent is nominated in the boxes below ‘To memory’. Without a mouse, selection and memory nomination can be carried out with TAB/SPACEBAR, or CURSORS/SPACEBAR.
19 X600 TRACEability Operation Manual
Figure 23
Ok will display:
Figure 24
The instrument must be in a display mode to enable this process. 0% – 100% will indicate that data is being transferred; once transfer is complete the main display will be restored. Waveforms will be exported to the instrument as they were originally received from an instrument, unless the PVF has been changed. PVF will be the same for any waveform exported, since changing the PVF for any displayed waveform will implement this change on all waveforms which are in the waveform display mode.
If start is pressed before RS232/3, a message will appear on the instrument to say that the down load has failed. This message will also appear if the lead between instrument and computer is not connected.
Note: Waveforms can only be exported to instruments of the same type as that from which they were originally imported (i.e. a trace from a T625 instrument may only be exported to a T625). Attempting to export it to another type (e.g. a T631) will cause a transmission error message, and the information will be corrupted).
5 Application Notes
X600 TRACEability Use and Application
X600 TRACEability has been designed to provide an enhancement to the facilities given by the T625, and T631 TDRs. In essence X600 TRACEability is a mass waveform storage media via PC, yet it also possesses one or two features to give more scope to fault location. The two basic applications are; waveform storage with documentation, and enhanced fault location.

20 X600 TRACEability Operation Manual
Waveform Storage and Documentation
This facility is most commonly used in the communications industry, where new installations, or repaired installations, are documented by subcontractors for the purpose of presentation to contractors prior to final signing off, and hence receiving payment for work carried out. In the case of a new installation the contractor will be looking for a certain quality level, and a confirmation of installed length. In the case of cable repair work the contractor will be looking for a ‘before and after’ comparison.
The contractor can assess from the documentation whether the work is to a satisfactory quality level, and has confirmation of installed cable lengths.
The process is simple. After each cable link or network is completed, the subcontractor will take a waveform using the TDR, ideally for each coax link, twisted pair, or core within the cable. It is desirable, though not necessary, to take waveforms of each pair from both ends of the cable. This is in order to ensure that the effects of the cable losses which cause pulse dispersion (spreading) and attenuation (reduction) are eliminated as far as possible.
1 Save the cable waveforms in the instrument memory by pressing save on the TDR and then following the TDR screen instruction to allocate which memory location the waveform is to be saved to.
2 Keep a note of this location and the cable details to enable update of the comments section in the X600 TRACEability display.
3 Download the waveform data from the instrument to a PC (see section 4).
4 Record any comments appropriate to the waveform (see page 15).
The PC records and displays the instrument source data with the waveform, and the subcontractor can allocate his or her own file name to the waveform. At this stage it is possible to enter Date, Time, Cable ID and comments for every waveform loaded into the computer. It is good practice to at least enter the date and cable ID with minimum comment at the time of data entry. These details can be edited at any time using the EDIT facility (see page 23). For incorporation into presentation documentation, the display may be simply saved to the PC ‘clipboard’ memory and pasted into the active document.

21 X600 TRACEability Operation Manual
This can be achieved by selecting Export on the toolbar then To clipboard or To file. Alternatively, it is possible to select ‘print screen’ from your keyboard, and then ‘paste’ the screen into your document. Please refer to your PC and software manuals.
It is good practice for the subcontractor to agree certain parameters prior to taking waveforms to ensure that relevant data is stored and presented. For example, a CATV contractor may wish to stipulate that the pulse width used is constant at 2ns for all measurements regardless of range set and cable length tested.
Fault Location Enhancement
For the purpose of enhancement to fault location, X600 TRACEability possesses two key benefits:
1 The first benefit is that X600 TRACEability can display up to four waveforms on screen at one time, and show a difference waveform between any two of the four. By overlaying waveforms, the user can detect where they deviate. At the point of deviation lies the fault, given that the waveforms are taken from pairs or cores within the same cable. It is sometimes very useful to be able to subtract one waveform from another to detect only the differences, the common parts of the waveforms producing a straight line in difference mode. This can be
achieved on the TDRs using L1–L2 or L1–M. The same facility is present in X600 TRACEability. The difference waveform is displayed in black along the centre of the screen, whilst the other waveforms are displayed in red, green, dark blue and light blue. The position of the difference waveform on screen is unaffected by the UP/DN controls, and this allows the user to move the individual waveforms up or down the screen away from the centrally located difference waveform for extra clarity.
2 The second benefit for fault location is that a TDR user can return to a faulty cable more than once and build a picture of the cable over a period of time. For example, in the case of a Low Voltage (mains) cable, a fuse may blow at a substation. On inspection with the TDR, no obvious fault position appears, perhaps because the fault has ‘dried out’, or because of the complexity of the network. The user should then save the waveform into memory.
Energising the circuit by replacement of the fuse, or a reclosure device, may cause the fault to immediately go again, and a second waveform can be compared to the first in the TDR. The effect of one further fuse operation may not cause the fault characteristics to significantly change and therefore further operations may be needed to build up a picture.

22 X600 TRACEability Operation Manual
By downloading subsequent waveforms into X600 TRACEability, the user can look for a gradual change appearing at the same position on the waveform over several fuse operations.
If on replacement of the fuse the system remains live, the user can return to base, download the waveform to a PC and move onto the next job. At some stage later, the fault may cause the fuse to blow again. In this instance the user can download the original waveform back into the TDR (a unique X600 TRACEability feature), and return to site to take another waveform of the cable. The fault may be located by comparing the previous waveform with the new one. It is even possible with X600 TRACEability to compare waveforms collected from two separate operators using two separate TDRs, which were set (inadvertently) to different ranges, gains, or PVFs, allowing maximum efficiency of operator time on the day.
Illegal Taps
Other variations of this technique are seen in the location of illegal taps on telephone cables (counter espionage), or on power cables (theft). A major problem which faces service providers, whether they be communications suppliers or electricity suppliers, is illegal taps where some person of dubious integrity has illegally connected a cable to the network. In a complex circuit, analysis of a waveform could
almost be impossible as large numbers of junctions are present. This can make it very difficult to locate the site of the illegal junction. Using a Bicotest TDR, a ‘fingerprint’ of the network could be obtained at installation or at any time thereafter. This fingerprint could be archived in a computer using X600 TRACEability and then compared with a fingerprint of the circuit obtained at a later date. By using the difference technique, any substantial change to the original ‘fingerprint’ of the network can be detected, indicating the position of an illegal tap.
Ageing
Cables buried underground are in a very hostile environment and, at the same time, the utility companies to whom these cables belong are under increasing pressure to maintain and increase the reliability of the services provided by these cables. Any buried cable and the joints in these cables, will degrade over a period of time. Periodic investigation of the fingerprint of the circuit will not reveal any deterioration unless a comparison is carried out with an earlier fingerprint. The X600 TRACEability software package allows the provider to archive circuit fingerprints over long periods of time and then carry out comparisons to evaluate the effects of ageing. This comparison will reveal such things as joints becoming faulty enabling planned maintenance to be carried out rather than emergency repairs.

23 X600 TRACEability Operation Manual
Appendix A – Return Loss
Theory
Accurate cable fault location and diagnostics relies on two principle modes of operation:
1 Simple fault location.
2 Qualitative measurement and location.
In simple fault location, the polarity of the reflected pulse is indicative of the type of fault but gives no indication of the magnitude of the fault.
For qualitative measurements, the amplitude of the reflection resulting from an impedance mismatch, relative to that of the transmitted pulse, is a measure of the impedance mismatch at that point. This ratio is referred to as the reflection coefficient.
Reflection Coefficient ρ= Ar/At where:
Ar = amplitude of reflected pulse.
At = amplitude of transmitted pulse.
The amplitude of the reflected pulse cannot normally exceed that of the transmit pulse. It is therefore usual to express it in percentage terms or millirhos (mρ ) where:
1000mρ = 1rho=100% reflection.
Impedance mismatches are normally expressed logarithmically in terms of dB Return Loss (dBRL) where:
dBRL = 20 log10 (At /Ar) dB
or dBRL = 20 log10 (1/ρ) dB
Figure 25
The above assumes an ideal “lossless” cable. In practice, the effect of pulse attenuation due to cable loss should be taken into account to derive the true Return Loss. This is normally carried out with a sample length of the same type of cable as that under test. The cable is open or short circuit. Any measured losses from the cable will be entirely due to the pulse attenuation. Division of the loss obtained by the cable length will give the attenuation loss per metre or per foot.
At Ar
24 X600 TRACEability Operation Manual
i.e. True Return Loss = Measured Return Loss – Pulse Attenuation
As the amplitude of the reflection varies with pulse width and hence frequency (narrow/higher frequency pulses suffer higher Pulse Attenuation losses than wider pulses), the same pulse width should be used when carrying out all pulse measurements.
It is also important that the output impedance of the instrument is matched to that of the cable under test.
The T631 can measure Return Loss even if the waveform saturates, since it ‘manipulates’ the waveform to perform its measurements. Once imported into a computer, the pulse amplitudes, although they can be varied (AMP+, AMP-) are ‘frozen’ as far as dBRL measurements are concerned. Therefore, if a pulse ‘saturates’ the Return Loss measurement will not be accurate due to the ‘missing’ data.

25 X600 TRACEability Operation Manual
Filename Comments
Demo 004 To illustrate the benefit of comparing 2 Demo 006 waveforms to identify the fault position.
Demo 007 From 2.1km of telephone cable, showing how Demo 008 various controls on the TDR (T625) can be used Demo 009 to improve the waveform. Demo 100
Faultr 01 These waveforms show how an increase in Faultr 02 the resistance of an insulation fault reduces the Faultr 03 size of the reflected pulse. Faultr 04
Coax 311 These waveforms show what happens as a Coax 312 pulse encounters a change in characteristic impedance (Zo).
Tee 101 Show the effects of “Tee” joints on waveforms. Tee 202
Demo 201 These illustrate what happens on the T631 Demo 202 if the output impedance of the unit does not Demo 203 match the characteristic impedance of the cable.
Demo 204 Show the advantage of using the narrowest Demo 205 pulse available on the T631 when looking for minor problems.
Appendix B – Preloaded Waveforms
Included with the X600 TRACEability software are some example waveforms that may be useful. These are automatically copied to your PC during the installation procedure under the sub-directory “EXAMPLES” (which may normally be found in the “Directories” box when the normal dialog box for adding a waveform is open – see page 17). These waveforms are provided for two reasons:
1 To enable the operator to become familiar with the program and the manipulation that can be carried out.
2 To enable those who are not familiar with TDRs to look at some typical cable waveforms.
Filename Comments
Demo 001 These 2 waveforms are from 100m lengths, but Demo 002 because the velocity is different, one waveform is longer than the other.
Demo 003 From 200m of telephone cable, showing how Demo 004 reflected pulses can be longer. Demo 005
Coax 209 Show that although a wider transmitted pulse Coax 210 gives a larger reflection, there is a loss of definition.

26 X600 TRACEability Operation Manual
Appendix C – Configuring a Virtual COM Port
When using a USB to RS232 adapter, the operator will need to configure the characteristics of the “virtual” COM port by performing the following actions:
1 Open the Device Manager on your PC or laptop
Start > Run… > Enter “devmgmt.msc” and press OK (XP)
or
Start > All Programs > Accessories > Run > type "devmgmt.msc" and press OK (Vista & 7).
2 Expand Ports (COM & LPT) in Device Manager.
3 Connect PC to TDR using USB to RS232 converter.
A new port shall appear in the list of ports.
4 Right-Click new port and select Properties.
5 Select Port Settings Tab in Properties dialog.
6 Set following Settings for COM port.
Field Value
Bits Per Second 4800
Data Bits 8
Parity None
Stop Bits 1
Flow Control Hardware
Press OK.
7 Run x600win302.exe.
8 Select new COM port number from step 3.
Import > Select comms port.

UsA
Spx Global Headquarters
13515 Ballantyne Corporate Place
Charlotte, NC 28277, USA
Tel: +1 704 752 4400
www.spx.com
Radiodetection
28 Tower Road, Raymond, Maine 04071, USA
Tel: +1 (207) 655 8525
Toll Free: +1 (877) 247 3797
Fax: +1 (207) 655 8535
Email: [email protected] www.radiodetection.com
pearpoint
39-740 Garand Lane, Unit B
Palm Desert, CA 92211, USA
Tel: +1 800 688 8094
Tel: +1 760 343 7350
Fax: +1 760 343 7351
[email protected] www.radiodetection.com
Radiodetection (Canada)
344 Edgeley Boulevard, Unit 34
Concord, Ontario L4K 4B7, Canada
Tel: +1 (905) 660 9995
Toll Free: +1 (800) 665 7953
Fax: +1 (905) 660 9579
[email protected] www.radiodetection.com
e U roPe
Radiodetection Ltd. (UK)
Western Drive, Bristol BS14 0AF, UK
Tel: +44 (0) 117 976 7776
Fax: +44 (0) 117 976 7775
[email protected] www.radiodetection.com
Radiodetection (France)
13 Grande Rue, 76220, Neuf Marché, France
Tel: +33 (0) 2 32 89 93 60
Fax: +33 (0) 2 35 90 95 58
[email protected] http://fr.radiodetection.com
Radiodetection (Benelux)
Industriestraat 11
7041 GD ’s-Heerenberg, Netherlands
Tel: +31 (0) 314 66 47 00
Fax: +31 (0) 314 66 41 30
[email protected] http://nl.radiodetection.com
Radiodetection (Germany)
Groendahlscher Weg 118
46446 Emmerich am Rhein, Germany
Tel: +49 (0) 28 51 92 37 20
Fax: +49 (0) 28 51 92 37 520
[email protected] http://de.radiodetection.com
As iA-PAci Fic
Radiodetection (Asia-pacific)
Room 708, CC Wu Building
302-308 Hennessy Road, Wan Chai
Hong Kong SAR, China
Tel: +852 2110 8160
Fax: +852 2110 9681
[email protected] www.radiodetection.com
Radiodetection (China)
Room 5-10, Workshop 4
No. 10 Zhenggezhuang Village,
Beiqijia Town,
Changping District,
Beijing 102209, China
Tel: +86 (0) 10 8178 5652
Fax: +86 (0) 10 8178 5662
[email protected] http://cn.radiodetection.com
Radiodetection (Australia)
Unit H1, 101 Rookwood Road,
Yagoona NSW 2199, Australia
Tel: +61 (0) 2 9707 3222
Fax: +61 (0) 2 9707 3788
[email protected] www.radiodetection.com
Global locations
© 2014 Radiodetection Ltd. All rights reserved. Radiodetection is a subsidiary of SPX Corporation. SPX, the green “>” and “X” are trademarks of SPX Corporation, Inc. Radiodetection is a trademark of Radiodetection Ltd. Windows, Windows XP, Windows Vista and Windows 7 are registered trademarks of Microsoft Corporation, all rights reserved. Due to a policy of continued development, we reserve the right to alter or amend any published specification without notice. This document may not be copied, reproduced, transmitted, modified or used, in whole or in part, without the prior written consent of Radiodetection Ltd.


