XA0055004 EFFECTS OF NON-CONDENSIBLE GAS ON THE CONDENSATION OF STEAM J.D. JACKSON, P. AN, A. REINERT, M. AHMADINEJAD Nuclear Engineering Laboratories, School of Engineering, University of Manchester, Manchester, United Kingdom Abstract The experimental work reported here was undertaken with the aim of extending the database currently available on the condensation of steam in the presence of non-condensable gases and thereby improving the empirical input to thermal-hydraulic codes which might be used for design and safety assessment of advanced water-cooled nuclear reactors. Heat was removed from flowing mixtures of steam and air in a test section by means of a water-cooled condensing plate. The test facility constructed for the study incorporates a degassing unit which supplies water to a boiler. This delivers steam steadily to a mixing chamber where it joins with a flow of preheated air. The mixture of steam and air is supplied to the bottom of a cylindrical test section in which it flows upwards over a double sided condensing plate which can be vertical, inclined or horizontal. The rate at which heat is removed by cooling water flowing through internal passages in the plate can de determined calorimetrically knowing the flow rate of the water and its temperature rise. After commissioning experiments had shown that reliable measurements of condensation heat transfer rate could be made using the test facility, a programme of development work followed in the course of which three different designs of condensing plate were evaluated in turn. The version eventually used in the main programme of experiments which followed was made from copper. However, its surfaces were coated with a thin layer of nickel and then with one of chromium. It was found that such a surface consistently promoted dropwise condensation and showed no signs of deterioration after lengthy periods of use. The rate of heat removal from pure steam and from mixtures of steam and air in varying proportions was measured as a function of plate sub-cooling for a variety of plate orientations. 1. Introduction Passive decay heat removal systems will play an important part in the future in improving the safety of nuclear reactors of advanced design. Feasibility studies for nuclear reactors utilising such concepts have highlighted the need to improve our understanding of a number of aspects of heat transfer and thermal hydraulics. The influence of non-condensable gas on steam condensation is one of the topics on which further research is needed. The inhibiting effect of non-condensable gas on the condensation of steam has long been recognised (see Ref. [1]) and much has been written on this topic. Some relevant papers on the influence of gas on the condensation of steam on plane surfaces are listed at the end of this paper (Refs. [2] to [23]). However, it is clear that there is a need for further basic experimental data. The present study was initiated to extend the existing database. Work began on the project in 1996 with the design and construction of a test facility. That task was completed by the end of 1996. Calibration of the instrumentation and the commissioning of the test facility began in 1997 and by the middle of that year some preliminary experiments had been carried out. Photographs of the test facility at that stage of the project are shown on Plates 1 and 2. In the light of the experience obtained in the course of those experiments some modifications were made to the test facility and condensing plates of improved design were developed. A detailed programme of experiments was then carried out. 53
Transcript
XA0055004EFFECTS OF NON-CONDENSIBLE GAS ONTHE CONDENSATION OF STEAM
J.D. JACKSON, P. AN, A. REINERT, M. AHMADINEJADNuclear Engineering Laboratories,School of Engineering,University of Manchester,Manchester, United Kingdom
Abstract
The experimental work reported here was undertaken with the aim of extending the databasecurrently available on the condensation of steam in the presence of non-condensable gases andthereby improving the empirical input to thermal-hydraulic codes which might be used for design andsafety assessment of advanced water-cooled nuclear reactors. Heat was removed from flowingmixtures of steam and air in a test section by means of a water-cooled condensing plate. The testfacility constructed for the study incorporates a degassing unit which supplies water to a boiler. Thisdelivers steam steadily to a mixing chamber where it joins with a flow of preheated air. The mixtureof steam and air is supplied to the bottom of a cylindrical test section in which it flows upwards over adouble sided condensing plate which can be vertical, inclined or horizontal. The rate at which heat isremoved by cooling water flowing through internal passages in the plate can de determinedcalorimetrically knowing the flow rate of the water and its temperature rise. After commissioningexperiments had shown that reliable measurements of condensation heat transfer rate could be madeusing the test facility, a programme of development work followed in the course of which threedifferent designs of condensing plate were evaluated in turn. The version eventually used in the mainprogramme of experiments which followed was made from copper. However, its surfaces werecoated with a thin layer of nickel and then with one of chromium. It was found that such a surfaceconsistently promoted dropwise condensation and showed no signs of deterioration after lengthyperiods of use. The rate of heat removal from pure steam and from mixtures of steam and air invarying proportions was measured as a function of plate sub-cooling for a variety of plateorientations.
1. Introduction
Passive decay heat removal systems will play an important part in the future in improving thesafety of nuclear reactors of advanced design. Feasibility studies for nuclear reactors utilising suchconcepts have highlighted the need to improve our understanding of a number of aspects of heattransfer and thermal hydraulics. The influence of non-condensable gas on steam condensation is oneof the topics on which further research is needed.
The inhibiting effect of non-condensable gas on the condensation of steam has long beenrecognised (see Ref. [1]) and much has been written on this topic. Some relevant papers on theinfluence of gas on the condensation of steam on plane surfaces are listed at the end of this paper(Refs. [2] to [23]). However, it is clear that there is a need for further basic experimental data. Thepresent study was initiated to extend the existing database.
Work began on the project in 1996 with the design and construction of a test facility. That taskwas completed by the end of 1996. Calibration of the instrumentation and the commissioning of thetest facility began in 1997 and by the middle of that year some preliminary experiments had beencarried out. Photographs of the test facility at that stage of the project are shown on Plates 1 and 2.In the light of the experience obtained in the course of those experiments some modifications weremade to the test facility and condensing plates of improved design were developed. A detailedprogramme of experiments was then carried out.
53
Plate 1
54
55
2. Description of the test facility
2.1. General description
Figure 1 shows a schematic diagram of the test facility. The degassing system is used to providea supply of water for use in the steam boiler. The boiler generates steam steadily at a rate which iscontrolled by the power input to the electrical immersion heaters. On leaving the boiler and passingthrough a separator section, the steam flows into the mixing chamber where it joins a flow of airwhich has been preheated so as to cause the vapour in the resulting mixture entering the test section tobe in the dry saturated condition. The test section is a cylindrical vessel with a water-cooledcondensing plate suspended within it. The mixture of air and steam leaving the test section passes to ashell and tube heat exchanger where the residual steam is fully condensed. Condensate collected fromthe test section, the shell and tube heat exchanger and the separator is returned to the water degassingsystem.
2.2. Degassing system
The degassing system consists of a cylindrical packed bed column, a vacuum pump, a circulatingpump, associated pipelines and an oxygen content analyser. The column is made of pyrex glass, asalso are the various pipelines. It contains many small stainless steel rings stacked in the form of a bedof height 1.5 m and diameter 0.23 m. Water delivered by the circulating pump is sprayed onto the bedof rings from a distributor at the top. Mounted vertically above the degassing column is a condenserwhich is supplied with cooling water from a chiller unit. The top of the condenser is connected to avacuum pump. The degassing system is able to reduce the oxygen concentration in the water to afraction of a milligram of oxygen per kilogram of water. Sampled water can be passed to an oxygencontent analyser (type Kent EIL-9435) for the purpose of checking the amount of oxygen in it.
2.3. Steam supply system
The boiler shell, which is also made of pyrex glass, is a cylindrical vessel of diameter 0.3 m andheight 1.4 m having a domed top. It contains four electrical immersion heaters, each rated at 9 kW,which are mounted vertically within it on a stainless steel base. The power supplied to these heaterscan be controlled independently. The electrical system is equipped with safety overload and over-temperature protection circuits. An over-pressure safety valve set at a gauge pressure of 0.2 bar isfitted to the top of the boiler. Degassed water can be supplied to the boiler, as needed, via a feed linemade of pyrex glass. The boiler is instrumented so that the steam delivery temperature and pressurecan be measured. Under conditions of maximum power input, water is evaporated in the boiler at arate of about 0.015 kg/s. Steam produced by the boiler passes through a thermally insulated U shapedsection which acts as a separator. Water collects at the bottom of the downward leg from where itdrains to a sump. The steam passes upwards from the separator to the steam/air mixing chamber.
2.4. Air supply system and steam/air mixing chamber
Air drawn from the laboratory by a small centrifugal blower passes through a filter and anelectrical preheater. The flow rate can be adjusted manually using a control valve. It is measured usinga rotameter. Dry steam from the boiler and hot air from the preheater flow into a pyrex glass tubecontaining number of horizontal perforated plates which serves as a mixing chamber.
2.5. Test section
Figure 2 shows a schematic of the test section, which is of diameter 0.3 m and height 0.6 m andis also made of pyrex glass. Within it a water-cooled condensing plate is suspended from the top by anarrangement which allows the plate orientation to be varied. Figure 3 shows the cooling water systemfor the condensing plate.
The steam/air mixture enters the test section through the base and flows upwards over thecondensing plate. On the base there are two condensate collectors. The outside one collects any
56
Waterchillerunit
-
1 !i «
Distributor
Vapour/alr/water mixture
Drain line Centrifugalpump
Water flow meter
Condensing platecooling water in
K Condensate collectorfor the plate
' Steam/air mixing chamber
p) Pressure transducer
?) Temperature transducer
Condensing platecooling water out
Air pre-heater
Air flow meter
Air generated byair blower
Electronicscale
Sump forsteam/airseparator
Sump forcondensatefrom plate Electronic
scale
Figure 1: The test facility
00
Rotameter andelectronic flow cell
Cooling water tocondenser plate
Mwater Steam/air outlet tube
Condensing plates
Test section
Controlled
flow rate
temperature
= Rotameter
To test sectioncondensate rate
measurement system
Malr
Control valve
High pressure
Water pump
Heat exchanger
Control valves
M vapourWater to and from laboratory
cooling water system
Figure 2: The test section Figure 3: Condensing plate cooling system
condensate which is formed on the test section wall. This is minimal because the heat loss to thesurroundings is small. The central collector catches condensate which falls from the condensing plate.This drains to a sump. The rate at which condensate is produced can be determined frommeasurements of the weight of the sump and contents. These are made using an electronic scale. Themixture of residual vapour and air leaves the test section at the top and is ducted through pyrex glasstubing to a water-cooled shell and tube heat exchanger in which the steam is completely condensed.
2.6. Condensing plates
Three different designs of condensing plate have been used in the course of this study. The initialone (see Figure 4) was manufactured from aluminium. When, after some time, it was found that thesurface condition was showing signs of deteriorating the aluminium plate was replaced by one madeof copper with nickel coated surfaces (see Figure 5). The internal passages for cooling water weremodified so as to reduce flow resistance and improve the uniformity of cooling. In the course offurther tests the surface condition of this plate was also found to be deteriorating. A third type ofplate, was designed and manufactured (see Figure 6). The material was again copper but this time thesurfaces were first coated with a thin layer of nickel and then with one of chromium. Also, a novelarrangement of internal passages was used with a view to achieving improved cooling.Commissioning tests showed this plate to have a stable surface condition and also to be satisfactoryfrom the point of view of uniformity of temperature.
2.7. Cooling water system
In the case of the tests performed using the initial plate, the cooling water was taken directlyfrom the laboratory cooling water system. The sub-cooling of the plate was varied by adjusting thewater flow rate. This arrangement was later replaced by another one (see Figure 3, earlier) whichenabled the sub-cooling to be controlled by varying water flow rate and water temperatureindependently. The various condensing plates were each instrumented to enable the temperature riseof the cooling water flowing through them to be measured using thermocouples situated at entry andexit. Thus, knowing the cooling water flow rate and its temperature rise the rate of heat transfer couldbe determined.
2.8. Shell and tube heat exchanger
The residual vapour in the mixture of steam and air leaving the test section is completelycondensed in a water-cooled shell and tube heat exchanger made of stainless steel. The condensateproduced passes to a sump. When the contents exceed a certain value, a pump and magnetic valve isactivated causing the water in it to be returned to the degassing column.
2.9. Measurements
The measurements made are listed below:
• Rate of flow of condensate from the shell and tube condenser to the main sump. This is measuredusing a load cell in conjunction with the data acquisition system.
• Rate at which condensate is produced on a condensing plate. This is also measured using a loadcell in conjunction with the data acquisition system.
• Rate of flow of cooling water through the condensing plate. This is measured using a rotameterand a flow turbine.
• Pressures in the steam delivery line and the test section. These are measured using pressuregauges.
• Temperature of the condensing plate. This is measured using several calibrated K-typethermocouples.
• Temperatures of the steam/air mixture flowing into and out of the test section. There are measuredusing two calibrated K-type thermocouples.
59
10 mm thickness
1.5 mm hole forthermocouple
Cooling water inlet
1.5 mm hole for: thermocouple
Fixing arm
Cooling waterflow path
Cooling water outlet
Figure 4: Initial condensing plate
Copper
Nickel plated
surface
10 mm thick
\
0.000104 m :
\
0.0000283 m
100 mm
Figure 5: Second condensing plate
U w thermal corKtoctivttyfestn
Water out
90 mm
- Water in
Figure 6: Final condensing plate
60
• Temperature of condensate leaving the test section. This is measured using a calibrated K-typethermocouple situated in the condensate collector.
• Rate of flow of air injected into the steam. This is measured using a rotameter and a flow cell.• Temperature of the air injected into the steam. This is measured using a calibrated K-type
thermocouple situated near the air injection nozzle.• Temperatures of the cooling water at inlet to and outlet from the condensing plate. These are
measured using two calibrated K-type thermocouples mounted in the flow passages at inlet andoutlet.
• Electrical power supplied to the boiler immersion heaters. This is determined from measurementsof current and voltage.
2.10. Data acquisition system
A computer-based system consisting of a 16 channel scanner, a precision digital voltmeter andan IBM compatible PC is used for signal monitoring and data acquisition. It takes the signals from thetest facility, stores them, and displays updated information on a monitor.
3.Commissioning of the Test Facility
3.1. Commissioning tests
In the course of commissioning the test facility, checks were carried out to ensure that all themeasurement devices were functioning properly and to assess the accuracy with which themeasurements could be made using them. A number of calibration tests were performed. Particularcare was taken in the case of temperature measurement. All the thermocouples on the test facilitywere calibrated against a standard platinum resistance thermometer.
The test facility was first brought into service with the aluminium condensing plate installed inthe test section. It was initially operated with a fixed electrical power input to the boiler supplyingsteam steadily at atmospheric pressure to the test section without air injection. Condensate from thecondensing plate was collected in the test section and from the sump of the shell and tube heatexchanger which condenses the residual steam leaving the test section. No water was supplied to theboiler whilst this test was in progress. The whole procedure was repeated for a number of values ofelectrical power input to the boiler covering the full working range. These measurements enabled thetotal rate of heat removal from the condensing plate and the heat exchanger to be determined for eachvalue of power input to the boiler. By subtracting this from the electrical power input to the boiler,the heat loss from the test facility to the surroundings was found. This turned out to be quite small(about 1 kW) and did not vary much from test to test because the temperature of the boiler and testsection did not change. These tests demonstrated that the rate of production of steam in the boilercould be readily determined from a knowledge of the electrical power input to the boiler by simplysubtracting the estimated rate of heat loss from it and assuming that the remainder was used toevaporate water in the boiler.
Next, experiments were performed to study the accuracy with which condensation heat transfercould be determined. Measurements of the rate at which condensate was collected from thecondensing plate enabled a check to be made on the accuracy of the calorimetric method ofdetermining heat removal from the plate. Figure 7 shows a comparison of the rates of heat transferdetermined by the two different methods. It can be seen that they are in very good agreement witheach other.
4. Preliminary Experiments Using the Initial Condensing Plate
4.1. Condensation heat transfer measurements with pure steam
(i) Effects of varying the steam flow rate and the plate orientation
Initially experiments were performed with the plate vertical supplying pure steam at atmosphericpressure to the test section at 3.5 g/s by applying a power of 9 kW to the immersion heaters in the
61
3,000
. 2,500
T3i?8£a
2,000
1,500
H 1,000£
1I 500
500 1,000 1,500 2,000Heat transfer rate by Cariorimetric method [W]
2,500 3,000
Figure 7: Comparison of heat transfer rate measured by the carlorimetricand the direct condensate collection methods with initial plate
boiler. The subcooling of the plate was varied by adjusting the flow rate of cooling water passingthrough it. Figure 8 shows the results. Further experiments were then performed with the power inputto the boiler increased to 18 kW, giving a steam flow rate of 7.2 g/s. Next, similar experiments werecarried out with the plate inclined at 45° and then, finally, with the plate in the horizontal position.Figure 9 shows the results obtained for all three cases. It can be seen that there is a clear differencebetween the rate of heat transfer for the three different orientations of the plate. As might have beenanticipated, the rate of heat transfer is highest for the vertical case, slightly reduced for the inclinedcase and very much reduced for the horizontal case. Some effect of varying the steam flow rate can beseen, but this is small.
(ii) Effect of reducing the steam pressure
Experiments to study the effect of reducing the steam pressure were performed next.Measurements were made at pressures of 0.75 bar and 0.60 bar. The results are shown on Figure 10where it can be seen that there was a systematic reduction of rate of heat transfer as the steam pressurewas reduced.
Some limitations of the initial condensing plate design became apparent in the course of thesetests. Only a very limited range of subcooling could be covered and it was clear, therefore, that largercooling passages were needed. A further cause for concern was the fact that the two thermocouples onthe plate gave readings which differed significantly. However, in spite of these limitations, it wasdecided to continue to use this condensing plate for further commissioning tests.
4.2 Measurements with mixtures of air and steam
Experiments were performed next supplying mixtures of air and steam at atmospheric pressure tothe test section. Results were obtained for the vertical, inclined and horizontal cases with values of airflow rate of 0.5 g/s, 1.0 g/s and L5 g/s and steam flow rates of 3.5 g/s and 7.2 g/s. They are shown onFigures 11 and 12, where it can be seen that for each inclination there is a strong and systematicreduction of heat transfer with increase of air concentration. These experiments demonstrated that theair supply system was functioning satisfactorily and that the test facility was capable of yieldinguseful information. However, they highlighted the limitations of the arrangement for cooling thecondensing plate referred to earlier. Also, visible stains became apparent on the condensing plateindicating that its surface condition was changing. This gave rise to concern about the repeatability ofthe results which could be obtained using this plate.
Figure 9: Effect of plate inclination on rate of heat transfer
16
63
3,000
2,500 ~
2,000 -
CO
II 1,500<D
1,000 -
500 -
•
•
•
Pressure: 0.6 bar Pressure
**
IT
B
...
0.78 bar Pressure: 1.0 bar
-
1 2 3 4 5 6 7Mean plate subcooling [ C]
10
Figure 10: Effect of steam pressure on rate of heat transfer (verticalplate, power input to boiler: 9 kW, steam flow rate 3.5 g/s)
5. Development of an Improved Condensing Plate
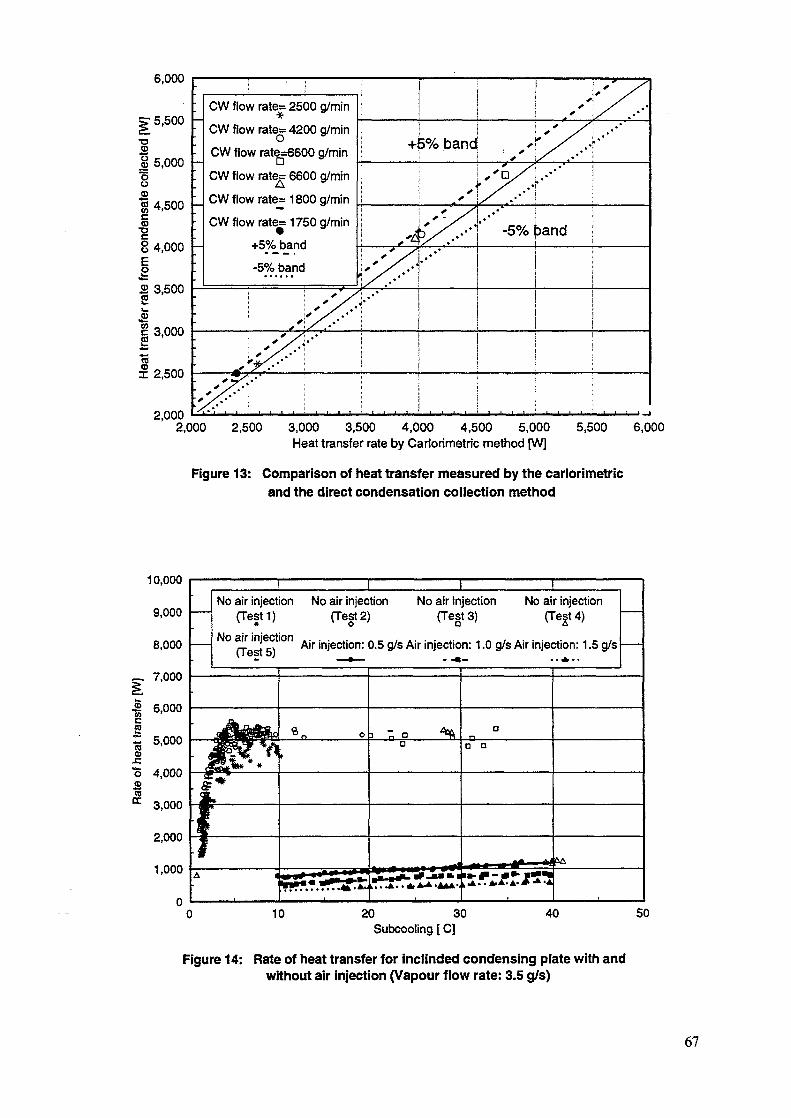
As a result of the experience gained with the initial condensing plate, it was decided tomanufacture a new one using copper rather than aluminium. Four thermocouples were embeddedwithin it to measure the surface temperature and the arrangement of internal cooling passages waschanged to reduce the flow resistance. The outside of the plate was coated with nickel with a view toimproving the stability of its surface condition. In addition, a new cooling system was installed on thetest facility which enabled the temperature of the cooling water to be controlled. Once this was donethe test facility was brought into service again. Figure 13 shows the results of commissioningexperiments to check the accuracy of heat transfer measurement using the new plate and the newcooling system.
A lengthy programme of experiments followed, firstly supplying pure steam and then mixturesof steam and air. Some typical results (obtained with plate inclined at 45°) are shown on Figure 14. Itwas found that a much greater range of subcooling could be covered. However, the plate temperaturedid not prove to be as uniform as expected. Furthermore, after quite a number of tests had beencompleted there was again evidence of discolouration of the plate and lack of repeatability of resultsdue to deterioration of surface condition.
An interesting feature of the results obtained is that with pure steam supplied to the test sectionthe rate of heat transfer increases very rapidly as the subcooling is increased up to about ten degreesafter which it suddenly stops changing. A further feature is the very large reduction of heat transfercaused by injecting small amount of air into the steam. It became obvious that more sensitive controlover air injection was needed.
After careful analysis of the plate-cooling problem, a new condensing plate having a verydifferent arrangement of internal cooling passages was designed, manufactured and installed in thetest section (see Figure 6, earlier). It was manufactured in two halves using copper. These werebrased together in a furnace after the grooves for the cooling passages had been machined on them.To address the problem of obtaining a stable surface condition the condensing surfaces were firstlycoated with a thin layer of nickel and then with one of chromium. The air injection arrangements were
64
2500
2000
ffI 1500
I1000
500
(a) Vertical plate
_LA Air injection: 1 g/s«Air injection 1.5 g/s• Air injection: 0.5 g/sx No air injection
10 15 20 25 30 35 40 45 50
Subcooling ["C]
2500
2000
1500
1000
500
(b) Inclined plate
f
/
I a0-«—"
—tr- A- —
• '
x No air injection
Q Air injection: 0.5 g/s
A Air injection 1.0 g/s
o Air injection: 1.5 g/s
-V — —a
-a—,
-
10 15 20 25
Subcooling [°C]
30 35 40 45
(c) Horizontal plate
2500
2000
I 1500
I 1000
i£1 500
/
B—"— t r
*-<
A Air injection: 1.0 g/s
« Air injection: 1.5 g/s
D Air injection: 0.5 g/s
x No air injection
B—8*
10 15 20 25 30
Subcooling [°C]
35 40 45 50
Figure 11: Effect of air injection on rate of heat transfer (Power input to boiler: 9kW, Vapour flow rate: 3.5 g/s)
65
(a) Vertical plate
2500
. 2000
1500
1000
•X 5 0 0
/
/ A
*
1« Air injection: 1 g/s
• Air injection: 1.5 g/s
o Air injection: 0.5 g/s
x No air injection
10 15 20 25 30 35
Subcooling of the condensing plate
40 45 50
(b) Inclined plate
2500
£ 2000o
1Jr 1500
I•g 1000
500
/
/ /
Xo
* Air injection: 1 g/s
» Air injection: 1.5 g/s
D Air injection: 0.5 g/s
x No air injection
10 15 20 25 30 35
Subcooling of the condensing plate
40 45 50
(c) Horizontal plate
2500
.2000
I 1500
1000
500
/
* Air injection: 1 g/s
« Air injection: 1.5 g/s
a Air injection: 0.5 g/s
x No air injection
9
10 15 20 25 30 35 40 45 50
Subcooling of the condensing plate
Figure 12: Effect of air injection on rate of heat transfer (Power input to boiler: 18kW, Vapour flow rate: 7.4 g/s)
66
6,000
S15,500 | -
1| 5,000"5o
I 4,500 hcoT3
§4,000
IS 3,500
c 3,0002
I 2,500
2,000
•
CW flow rate= 2500 g/min
CW flow rate= 4200 g/min
CW flow rate=6600 g/min
CW flow rate= 6600 g/min
CW flow rate= 1800 g/min
CW flow rate= 1750 g/min
+5% band
-5% band
1 *
sy
| +
] • • • '
ij
f
5% band
•
y~y..
I
I . .-* ' ! !- 5 % i>and i
j
i
ii
j
2,000 2,500 3,000 3,500 4,000 4,500 5,000Heat transfer rate by Carlorimetric method [W]
5,500 6,000
Figure 13: Comparison of heat transfer measured by the carlorimetric
and the direct condensation collection method
10,000
9,000
8,000
_, 7,000
oBCD
cc
6,000
5,000
4,000
3,000
2,000
1,000
J_ _LNo air injection No air injection
(Testi)
No air injection(Test 5)
(Test 2)No air injection
(Test 3)No air injection
(Test 4)
Air injection: 0.5 g/s Air injection: 1.0 g/s Air injection: 1.5 g/s
10 20 30Subcooling [ C]
Figure 14: Rate of heat transfer for incfinded condensing piate with andwithout air injection (Vapour flow rate: 3.5 g/s)
67
modified to enable greater control to be exercised at low flow rates. Commissioning tests were thencarried out to study the effects of these changes. These experiments showed that the uniformity oftemperature was significantly improved with this plate and that accurate and repeatable heat transferresults could be obtained. The mode of condensation promoted on the surfaces was dropwise andthere was no evidence of any deterioration of surface condition after a lengthy period of use. In thefollowing section of this report a series of investigations of condensation heat transfer made using thisplate are reported.
6. Main Programme of Experimental Work
6.1. Experiments promoting condensation on both surfaces
In the first investigation, experiments were performed promoting condensation on both surfacesof the plate. Measurements were made using pure steam and also mixtures of steam and air. Powerinputs of 9 kW, 18 kW, and 27 kW were supplied to the boiler, giving steam flow rates ms of 3.5 g/s,
7.4 g/s and 11.4 g/s. Air was injected into the steam at rates in the range 0.02 g/s to 1.0 g/s. Resultswere obtained for three different orientations of the plate, vertical, inclined at 45° and horizontal. The
results are presented on Figures 15, 17 and 19, respectively, as rate of heat transfer <2 versus sub-
cooling AT for a number of values of air injection rate ma. On these figures, the curves for
condensation with mixtures of steam and air were produced using an equation of the form
Q = CATpma9 , with values of the coefficient C and the indices p and q chosen to give the best fit to
the experimental data for each steam flow rate ms and plate orientation. Comparisons between the
experimental and curve-fitted values of Q for the three different orientations are shown on Figures 16,18 and 20, respectively, along with the corresponding equations. It can be seen that in general the fitto the data is good.
With the plate vertical or inclined at 45° droplets of condensate formed very rapidly at manypoints on the surfaces and coalesced to form rivulets. These ran off the plate leaving the surface clearso that further dropwise condensation could occur. The process was repeated continuously all over thesurface in a very dynamic manner. When pure steam was supplied to the test section the rate of heattransfer increased steadily with increase of subcooling and then remained constant beyond a certainvalue because it was no longer possible for additional steam to reach the condensing plate.
When mixtures of steam and air were supplied to the test section, the presence of a very smallamount of air inhibited the heat transfer process markedly. The rate of heat transfer continued to fallas the concentration of air was raised, but less and less strongly. The limit on heat transfer found withpure steam as subcooling was increased was not reached in the experiments with air present in thesteam.
A good overall description of the results shown on Figures 15 and 17 from the experiments withmixtures of steam and air for the vertical and inclined cases is given by the equation.
085 , (1)
with the coefficient C taking the value 63.7 for the vertical plate and 60.1 for the inclined one.Comparing these values it can be seen that the total rate of heat transfer with the plate inclined is onlyslightly lower than with it vertical. The dependence of rate of heat transfer on air injection rate is verysimilar for these two orientations (Qvarying with ma in a rather non-linear manner). The same can
be said of the variation with steam flow rate (this time with Q increasing almost in proportion to
ms). A measure of the effectiveness of heat transfer is provided by the ratio Ql AT and, it can be
seen from Equation 1 that this falls with increase of subcooling as AT"064.With the plate horizontal, condensate was not able to leave the plate so readily and parts of the
upper and lower surfaces were covered with liquid for a significant proportion of the time. Whereasthe rates of heat removal for the inclined case were only slightly smaller than for the vertical case theywere much lower when the plate was horizontal. For this orientation, the trends with increase of steamflow rate and air injection rate were not completely systematic.
68
10000
9000
^ 8000
$ 7000
2 8000
£ 4000
l ""ce 2000
1000
0*fes=
> • • • n na !
s
'P .-,.*,. • •
:
10000
.000
£ 8000
£ 7000
Ji 5000
j ! 4000
T) 3000oS 2000GC
1000
0
10 15 20 25 30 35 40
Subcooling TC]
Subcooling [ ° C ]
Subcooling [ ° C ]
ANotirk^ction
OAr In^OXKi rau 0.04 g/a
ZAir IniMion at> 0.06 »'«
OAir kifKlico KM 0.0S gfs
n n o 0.12 g/>
AAir intaction ml* 1
9kW
M
a
f
S39L^aaaMt=l
« Y M M
+
eh
nsfe
r
C
too
fh
£
woo
8000
7000 <
6000
sooo
4000
2000-
1000-
/
/1\^
,% •» -
a) Vapour flow rate = 3.5 g/s
• No •» ir^etion
ANoufc^cSon
• Notlrinjtctlon
+ A» in|«Sffli rau 0.02 »(•
O A> kii«««i n a 0.O4 8/«
X Air InjwSonrrt 0.06 »»
O Airlni«tionr>t<O.OSgfi
n r»M 0.12 »'•
A Air Injection nto 1 g/t
18 kW
b) Vapour flow rate = 7.4 g/s
*
•
+
-
X
X
N O * * * * * ,
Mr injtebon m» 0.12 g/»
Air injection mt* 0^5 9ft
Mr)n)Ktionrit*0^^s
27 kW
c) Vapour flow rate = 11.4 g/s
Figure 15: Effect of subcooling, air injection rate and vapour flow rate on rate of heat transferfor the double-sided vertical case with the final plate.
Figure 16: Comparision of experimental and curve-fitted values of heat transfer
70
f•a c1™"1
•i • —
i t i ii !•
_* -
10000
9000
6000
7000
6000
5000
4000
3000
2000
1000
0
^ * 7000
£
Z 5000a
£ 3000
5
Subcooling [°C]
Subcooling [ ° C]
• No sir injection
• No w jnj»dion
« No air injKtion
- Air kl|«cl>on n u 0.12 o/t
A Air inaction reto 0^5 o/>
« Air irfKHon r iU O.S oy>
A Air Inpcbon rats i oyt
9kW
a) Vapour flow rate = 3.5 g/s
X/= ^
- * ^ ? * A
• T
-v -
c
- ^ — •iMVt
Noiiriniwtion
X No >lr Inaction
• Air iniKbonnU 0.12 g/s
• Air injection ral* 0.25 g/a
O to injKtion rate 0.5 g/»
18 kW
b) Vapour flow rate = 7.4 g/s
1
0
•1
V
_d__»^ a3=
10 15 20 25 30
+ No a* iniaction
O Noairiniaction
« Ak Injactoi rata 0.12 o/«
• AriraaebonraUO^Soya
0 Air iraaetion rat* 0.12 g/a
A Alrinjactionntaa25a/s
X AiintKtonimtoO-SOj'i
I — , , 1
27 kW
Subcooling [°C]
c) Vapour flow rate = 11.4 g/s
Figure 17: Effect of subcooling, air injection rate and vapour flow rate on rate of heat transferfor the double-sided inclined at 45° case.
71
•a
1600140012001000
—. IUW r£ 1400 -n_
•= 800
O 600csO 400
200
Q =
<-*•—'
r OQ _n iiji
: 150.5 AT """ma ̂ ~
•
200 400 600 800 1000 1200 1400 1600
Q Experimental (W)
a) Vapour flow rate=3.5 g/s
i
Calc
ula
O
3000-
2500-
2000-
1500-
1000 -
500 •
0-
^Q = 311.2 AT 0 4 I T, -0.38'a
w
500 1000 1500 2000 2500
Q Experimental (W)
3000 3500
b) Vapour flow rate=7.4 g/s
«3
"5uo
3500-
3000-
2500-
2000-
1500-
1000-
500-
0 -
Q =
^ \
681.7 AT0-3ma-°
1
.29
0 500 1000 1500 2000 2500 3000 3500 4000
Q Experimental (W)
c) Vapour flow rate=11.4 g/s
Figure 18: Comparision of experimental and curve-fitted values of heat transfer
72
A satisfactory overall description of the set of results for mixtures of steam and air shown onFigure 19 is given by the equation
° 3 5 ° 3 V - 7 (2)
From this it can be seen that the influences of air injection rate and steam flow rate are bothslightly weaker than for the vertical and inclined cases. The overall rate of heat transfer for thehorizontal case is generally lower by about 20% than for the vertical and inclined cases.
These experiments with a double-sided plate did not allow the contributions of the upper andlower surfaces to be separated. Clearly, in the case of condensation on horizontal or slightly inclinedsurfaces the process of condensation will be different on the two surfaces and the upward facing anddownward facing cases should be studied separately. It was with this in mind that the experimentsreported in the next section were conducted with the plate only promoting condensation on onesurface.
6.2. Experiments promoting condensation on one surface only
The condensing plate was thermally insulated on one face by covering it with a sheet of perspex5mm thick. A programme of experiments was then carried out with the plate horizontal, inclined at 5°and inclined at 20°, firstly with the condensing surface facing upwards and then with it facingdownwards. Experiments were only performed for one value of steam flow rate (7.4 g/s, boiler powerinput 18 kW). The results for the upward and downward facing cases are shown on Figures 21 and 23,respectively.
The data for condensation of steam in the presence of air have again been fitted separately for
each orientation of the plate by an equation of the form Q = CATprhaq. Comparisons between the
experimental and curve-fitted values of Q for the various orientations of the plate are shown onFigures 22 and 24 along with the corresponding equations.
It can be seen from Figures 21 (a) and 23 (a) that with pure steam and the plate inclined at 20° tothe horizontal the rates of heat transfer are clearly higher for the upward facing case than for thedownward facing one. This must be due to the rivulets of condensate running off the surface morereadily. However, with the plate mounted horizontally, or inclined at only 5°, the rates of heat transferare greatly reduced and there is no clear cut difference between the rates of heat transfer for theupward and downward facing cases. However, an irregular variation of rate of heat transfer withsubcooling is evident in the upward facing case and this is indicative of flooding of the surface.
As can be seen from Figures 21(b), (c) and (d) and Figures 23(b), (c) and (d), the pattern ofbehaviour with mixtures of steam and air is quite different. There is a systematic reduction in rate ofheat transfer with increase of air concentration and also with reduction of plate inclination. Thevalues are consistently higher for the downward facing case, presumably as a result of the upwardflow of steam towards the plate helping to control the build up of air near it.
Figure 19: Effect of subcooling, air injection, rate and vapour flow rate on rate of heat transferfor the double-sided horizontal plate.
74
cul
(8
oo
1400
1200
1000
800
600
400
2000
Q -
^ ^
118 8 \T0M 7
—
^«. 2500
^ 2000T3S 1500CO
g 1000
O 500
3000
^ 2500
"g 2000
2 1500
75 100°^ 500
O
200 400 600 800 1000 1200 1400
Q Experimental (W)
a) Vapour flow rate=3.5 g/s
Q = 25B.4AT°-C 9 m n * - 3 4
500 1000 1500 2000 2500
Q Experimental (W)
b) Vapour flow rate=7.4 g/s
T7A A1 •0.17
500 1000 1500 2000 2500 3000
Q Experimental (W)
c) Vapour flow rate=11.4 g/s
Figure 20: Comparision of experimental and curve-fitted values of heat transfer
75
(a) No air injection b) Air injection 0.12 g/s
4000
3S00 —
3000
2500
2000
I 1500
1000
500
• 0 factno up
A20t»ctnflup
/
/
A
/A
A
yA
•
A
% I* 4
A
* JO0O
"5
0 5 10 15 20 25 30 35
Subcooling 1° C]
• 0(acing uP
A 5 facing up
x 20 o facing up
4> - *— * -
1 S 2 0 2 S 3 0 3 5 4 0
Subcooling [° C]
c) Air injection 0.25 g/s d) Air injection 0.5 g/s
|
• 0 facing up
A 5 facing up
x 20 facing up
• l jp-
• 0 facing up
A 5 facing up
x 20 facing up
-
0 5 10 15 20 25 30
Subcooling t ° C ]
0 5 10 15 20 25 30 35 «)
Subcooling [o C]
Figure 21: Effect of subcooling, air injection rate and orientation on rateof heat transfer (upward facing single sided plate, power inputto the boiler 18 Kw, vapour flow rate 7.4 g/s)
76
800
6 0 0 -•o
ii2 400u
15uO
200
1 1 1
Q=76.9AT0 4 6ma
• < * *
-0.28
100 200 300 400 500 600 700 800
Q experimental (W)
a) 0° facing up
^» 1000
80°IBB(0
BB 600 f(0
,0«5O
O
400
200
Q
^*
=113.8 AT0.'
»••
m
>-
-0.2Ja
200 400 600 800
Q experimental (W)1000
b) 5° facing up
pai
u(B
1200
1000
800
600
400
U 200
i
Q =141.2 Al• 0.35 _ .
ma
-0.36
200 400 600 800 1000 1200Q experimental (W)
c) 20° facing up
Figure 22: Comparision of experimental and curve-fitted values of heat transfer
77
«) No air injection b) Air Injection 0.12 g/s
3000
2500
:2000
09
1500
O
S(0C 1000
500
«0 facing down
• 5 facing down
* 20 facing down
\V
/
y
/
/ .
A
/
y
AA
*
0 5 10 15 20 25
Subcooling [o C]
c) Air injection 0.25 g/s
30 35
3000
2500
2000
1500
1000
5O0
• 0 facing down
A 5 facing down
x20facing down
fX * *
X
0 5 10 15 2 0 2 5 3 0 3 5 4 0Subcooling p C]
d) Air Injection 0.5 g/s
3000
2500
2000
1500
i1000
500
• 0 facing down
A 5 facing down
x 20 facing down
A 3
x "
0 5 10 15 2 0 2 5 3 0 3 5 4 0
Subcooling [*C]
3000
2500
2000
1500
1000
500
1
J
3
iO facing down
k 5 facing down
(20 facing down
A
X __x
( X )
A
j
j
1|
j
0 5 10 15 2 0 2 5 3 0 3 5 4 0
Subcooling [°C]
Figure 23: Effect of subcooling, air injection rate and orientation on rateof heat transfer (downward facing single plate, power inputto the boiler 18 Kw, vapour flow rate 7.4 g/s)
78
1400
1200
1000 - —o* - 800to3 600
oO
400
200
Q =94.8
-^
AT 0.48 -0.41a jfcr<^
1600
1400
13
OS
1000
JS 800
calc
u
600
400
O 200
0
200 400 600 800 1000
Q experimental (W)1200 1400
a) 0° facing down
t• a
"S
alcu
l
°a
1600 i1400 -i?nn .
1000 •
800 -
600
400 •
200 •
0 -
Q =94AT°-5ma-0-44
0 200 400 600 800 1000 1200 1400 1600
Q experimental (W)
b) 5° facing down
Q =191.4 AT039 m a - °
200 400 600 800 1000 1200 1400 1600
Q experimental (W)
c) 20°C facing down
Figure 24: Comparision of experimental and curve-fitted values of heat transfer
79
Conclusions
The chromium-plated condensing plate used in the present study proved to be very satisfactory. Itconsistently promoted dropwise condensation and the surface condition showed no signs ofdeteriorating after a lengthy period of use. The novel arrangement of cooling passages enabled asatisfactory uniformity of plate temperature to be achieved.
The experiments using pure steam with the plate mounted vertically in the test section promotingcondensation on both sides showed that the heat transfer rate increased steadily up to a certain valueas subcooling was increased after which ceased to increase-as a result of a limit being reached on therate at which steam could get to the plate. The degree of subcooling at which this occurred and thelimiting value of heat transfer rate both increased as the rate of flow of steam through the test sectionwas increased.
The associated experiments with mixtures of steam and air using the double-sided vertical plateshowed that even a very small amount of air present in the steam caused a large reduction in rate ofheat transfer. This influence varied in a very non-linear manner becoming less and less sensitive tothe amount of air present as the concentration was increased.
With the plate mounted at 45° promoting condensation from steam or mixtures of steam and air onboth sides, heat was removed at almost the same rate as for the vertical case and the pattern ofbehaviour with increase of steam flow rate and air concentration was very similar.
With the plate mounted horizontally the rates of heat transfer achieved were greatly reduced as aresult of the condensate not draining easily from the plate. This was particularly evident in the case ofcondensation of pure steam where the rate of heat transfer actually fell the steam flow rate wasincreased due to flooding of the upper surface with condensate.
With the plate promoting condensation on one surface only and mounted at an angle of 20° to thehorizontal, the rate of heat transfer from pure steam was higher for the upward facing case. With theangle of inclination reduced from 20° to 5°, or with the plate mounted horizontally, the rate of heattransfer was considerably lower due to condensate not draining from the plate so readily. There wasthen no clear cut difference between the results for the upward and downward facing cases except thatthe variation with subcooling became rather irregular with the condensing surface facing upwards dueto flooding of the surface.
Using mixtures of steam and air, the rates of heat transfer reduced systemically as the concentration ofair was increased and also as the inclination of the plate was reduced. The rate of heat transfer washigher in the downward facing case as a result of the upward flow of steam towards the plate aidingthe removal of air from the condensing surface.
Further Work
A follow on programme of experiments with the surface condition of the plate modified so that itpromotes filmwise condensation under all conditions has been initiated.
REFERENCES
[1] REYNOLDS, O., On the condensation of a mixture of air and steam upon cold surfaces, Proc.Roy. SOC. 144, (1873).
[2] HERR, IE. , KADAMBI, J.R. and ROHATGI, U.S., Condensation in presence of non-condensable gases, Proc. ASME 165, 77-86, (1993).
[3] HUHTINIEMI, I , BARRY, J.J. and CORRADINI, MX., Condensation in the presence of a non-condensable gas - The effect of surface orientation, AICHE Symposium Series, 85 250-210,(1989).
80
[4] NUSSELT, W., The condensation of steam on cooled surfaces, Chemical EngineeringFundamentals Vol. 1, No. 2 ISSN 0723-0966, 6-19, (1982)
[5] OTHMER, D.F., The condensation of steam, Ind. Engng. Chem. Vol. 21, No. 6 576-583, (1929).[6] VOTTA, F. JR. and WALKER, C.A., Condensation of vapour in the presence of non-condensing
gas, AICHE Journal Vol. 4, No. 4 413-417, (1958).[7] ROSE, J.W., Condensation of a vapour in the presence of a non-condensing gas, JHMT, Vol.12
233-237, (1969).[8] COLBURN, A.P. and HOUGEN, O.A., Design of cooler condensers for mixtures of vapours with
non-condensing gases, Ind. Engng. Chem. Vol. 26, No. 11 1178-1182, (1934).[9] CORRADESfl, M.L., Turbulent condensation on a cold'wall in the presence of a non-condensable
gas, Nuclear Technology, Vol. 64 186-195, (1984).[10] DEHBI, A.A., GOLAY, M.W. and KAZIMI, M.S., The effects of non-condensable gases on
steam condensation under turbulent natural convection conditions, Massachusetts Institute ofTechnology, Cambridge, MA, Report No. MIT-ANP-TR-004, (1991).
[11] HENDERSON, C.L. and MARCHELLO, J.M., Film condensation in the presence of a non-condensable gas, ASME JHT Vol. 91 447-450, (1969).
[12] MORI, Y. and HIJIKATA, K., Free convective condensation heat transfer with non-condensablegas on a vertical surface, IJHMT Vol. 16 2229-2240, (1973).
[13] SPARROW, E.M. and LIN, S.H., Condensation heat transfer in the presence of non-condensablegas, ASME JHT Vol. 86 430-436, (1964).
[14] VEEROW, K.M. and SCHROCK, V.E., Condensation in a natural circulation loop with non-condensable gases: Part 1 -HeatTransfer, Proc. ICMF, Tsukuba, Japan 183-186 (1991).
[15] PETERSON, P.F., SCHROCK, V.E. and KAGEVAMA, T., Diffusion layer theory for turbulentvapour condensation with non-condensable gases, Transactions of ASME JHT Vol. 115 998-1003, (1993).
[16] ANDERSON, M.H. and CORRADINI, M.L., Condensation in the presence of non-condensablegases: AP600 containment simulation, NURETH-7, Saratoga Springs, NY, USA 1519-1534,(1995).
[17] ASANO, K. and NAKANO, Y., Forced convection film condensation of vapours in the presenceof non-condensable gas on a small vertical flat plate, JCHE of Japan, (1978).
[18] CHO, D.C. and STEIN, R.P., Steam condensation on the underside of a horizontal surface, Proc.of Third Int. Topical meeting on nuclear power plant thermal hydr. and operations, Seoul, Korea,1988.
[19] HENDERSON, C.L. and MARCHELLO, J.M., Film condensation in the presence of a non-condensable gas, Transactions of ASME, JHT Vol. 91(3) 447-450, (1969).
[20] AL-DIWANY, H.K. et al., Free convection film condensation of steam in the presence of non-condensing gas, IHMT, Vol. 16, (1973).
[21] LEE, W.C. et al., Forced convection film condensation on a horizontal tube with and withoutnon-condensing gas, IHMT., Vol. 27, (1984).
[22] GERSTMANN et al., Laminar film condensation on the underside of horizontal and inclinedsurfaces, IHMT, Vol. 10, (1967).
[23] LEDUC, C. COSTE, P., BARTHEL, V. and DESLANDES, H., The modelling of wallcondensation with non-condensable gases for the containment codes, NURETH-7, SaratogaSprings, NY, USA 1456-1477, (1995).