Building the Core Building the Core Sustainable Growth Sustainable Growth Ben Ben Fowke Fowke Vice President and CFO Vice President and CFO Wall Street Utility Group Wall Street Utility Group December 6, 2006 December 6, 2006
Transcript
Building the CoreBuilding the CoreSustainable GrowthSustainable Growth
Ben Ben FowkeFowkeVice President and CFOVice President and CFO
Wall Street Utility GroupWall Street Utility GroupDecember 6, 2006December 6, 2006
This material includes forwardThis material includes forward--looking statements that are subject to certain looking statements that are subject to certain risks, uncertainties and assumptions. Such forwardrisks, uncertainties and assumptions. Such forward--looking statements looking statements include projected earnings, cash flows, capital expenditures aninclude projected earnings, cash flows, capital expenditures and other d other statements and are identified in this document by the words statements and are identified in this document by the words ““anticipate,anticipate,””““estimate,estimate,”” ““expect,expect,”” ““projected,projected,”” ““objective,objective,”” ““outlook,outlook,”” ““possible,possible,””““potentialpotential”” and similar expressions. Actual results may vary materially. and similar expressions. Actual results may vary materially. Factors that could cause actual results to differ materially incFactors that could cause actual results to differ materially include, but are lude, but are not limited to: general economic conditions, including the availnot limited to: general economic conditions, including the availability of ability of credit, actions of rating agencies and their impact on capital ecredit, actions of rating agencies and their impact on capital expenditures; xpenditures; business conditions in the energy industry; competitive factors;business conditions in the energy industry; competitive factors; unusual unusual weather; effects of geopolitical events, including war and acts weather; effects of geopolitical events, including war and acts of terrorism; of terrorism; changes in federal or state legislation; regulation; costs and ochanges in federal or state legislation; regulation; costs and other effects of ther effects of legal administrative proceedings, settlements, investigations anlegal administrative proceedings, settlements, investigations and claims d claims including litigation related to companyincluding litigation related to company--owned life insurance (COLI); actions owned life insurance (COLI); actions of accounting regulatory bodies; the higher degree of risk assocof accounting regulatory bodies; the higher degree of risk associated with iated with Xcel EnergyXcel Energy’’s nonregulated businesses compared with Xcel Energys nonregulated businesses compared with Xcel Energy’’s s regulated business; and other risk factors listed from time to tregulated business; and other risk factors listed from time to time by Xcel ime by Xcel Energy in reports filed with the SEC, including Exhibit 99.01 toEnergy in reports filed with the SEC, including Exhibit 99.01 to Xcel Xcel EnergyEnergy’’s report on Form 10s report on Form 10--K for year 2005.K for year 2005.
Safe HarborSafe Harbor
Delivering Value Delivering Value —— Now and in the FutureNow and in the Future
Building the core— Meeting customers’ needs— Environmental leadership — Getting the rules right
Accomplishments— Regulatory— Legislative
Future growth
Financing the plan
Building the core— Meeting customers’ needs— Environmental leadership — Getting the rules right
Accomplishments— Regulatory— Legislative
Future growth
Financing the plan
Building the CoreBuilding the CoreDelivering competitively priced, reliable energyDelivering competitively priced, reliable energy
Milwaukee
Milwaukee
Milwaukee
0
3
6
9
12
15
18
21
0
3
6
9
12
15
18
21Cents per kWh (Retail)Cents per kWh (Retail)Cents per kWh (Retail)
Building the CoreBuilding the CoreEnvironmental LeadershipEnvironmental LeadershipPromoting Conservation and Load ManagementPromoting Conservation and Load Management
Number of plants avoidedNumber of plants avoided
1 Plant = 250 MW1 Plant = 250 MW
1.61.62.72.7
3.73.74.74.7
5.55.56.56.5
7.47.48.28.2
Building the CoreBuilding the CoreEnvironmental LeadershipEnvironmental Leadership
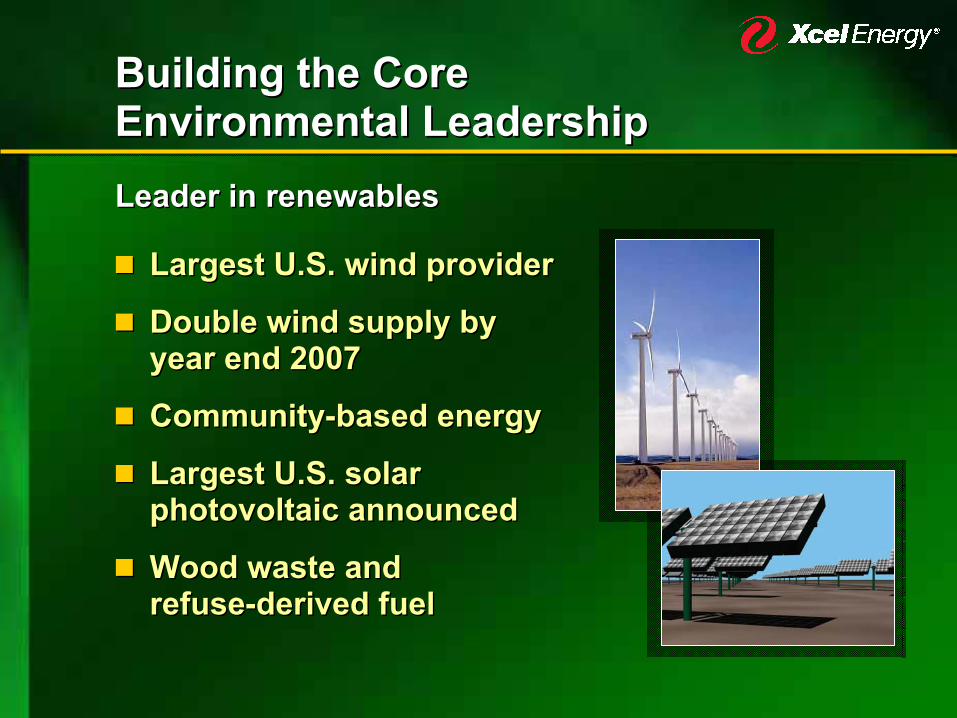
Largest U.S. wind provider
Double wind supply byyear end 2007
Community-based energy
Largest U.S. solarphotovoltaic announced
Wood waste andrefuse-derived fuel
Largest U.S. wind provider
Double wind supply byyear end 2007
Community-based energy
Largest U.S. solarphotovoltaic announced
Wood waste andrefuse-derived fuel
Leader in renewablesLeader in renewables
Building the CoreBuilding the CoreEnvironmental LeadershipEnvironmental Leadership
Building the CoreBuilding the CoreEnvironmental LeadershipEnvironmental Leadership
IGCC with sequestration
Wind Hydrogen Energy
IGCC with sequestration
Wind Hydrogen Energy
Adopting new technologyAdopting new technology
Xcel Energy in Dow Jones Sustainability IndexXcel Energy in Dow Jones Sustainability Index
Getting the Rules RightGetting the Rules RightHelping shape public policy –One of the most important things we can doHelping shape public policy –One of the most important things we can do
Credibility and leadership to achieveconsensus on the appropriate balance:— Customers— Communities — Environmentalists— Regulators — Legislators— Investors
Credibility and leadership to achieveconsensus on the appropriate balance:— Customers— Communities — Environmentalists— Regulators — Legislators— Investors
Constructive RegulationConstructive RegulationRecent rate case outcomesRecent rate case outcomesDollars in millionsDollars in millions
Colorado Gas $34.5 $22.0 11.0% 10.5%Wisconsin Electric 53.1 43.4 11.9 11.0Wisconsin Gas 7.8 3.9 11.9 11.0Minnesota Electric 156 131/115 * 11.0 10.54Colorado Electric 208 151 ** 11.0 10.50
Colorado Gas $34.5 $22.0 11.0% 10.5%Wisconsin Electric 53.1 43.4 11.9 11.0Wisconsin Gas 7.8 3.9 11.9 11.0Minnesota Electric 156 131/115 * 11.0 10.54Colorado Electric 208 151 ** 11.0 10.50
Dollar IncreaseDollar Increase Return on EquityReturn on EquityRequested GrantedRequested Granted Requested GrantedRequested Granted
** $131 million for 2006 reduced to $115 million in 2007 for large $131 million for 2006 reduced to $115 million in 2007 for large customer customer coming oncoming on--line January 1, 2007 line January 1, 2007
**** $107 million base rates, $39.4 million PCCA and $4.6 million$107 million base rates, $39.4 million PCCA and $4.6 millionWindsource Windsource costscosts
Colorado Gas Rate Case HighlightsColorado Gas Rate Case Highlights
Capital Expenditure ForecastCapital Expenditure Forecast
20062006 20072007 20082008 20092009 20102010
Dollars in millionsDollars in millions Denotes enhanced recovery processDenotes enhanced recovery process
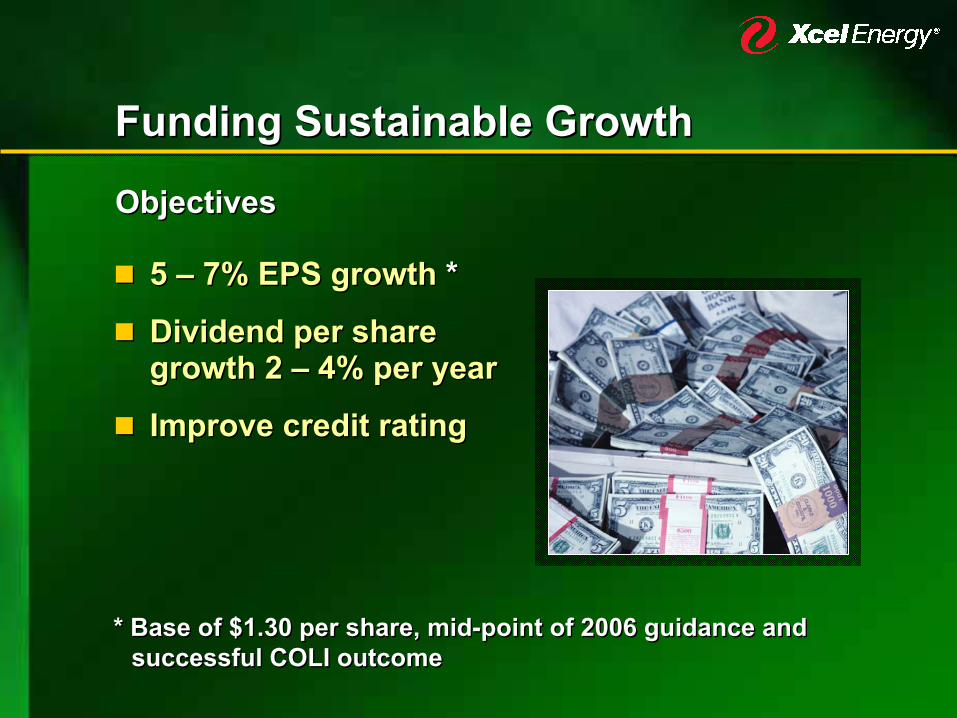
Assumptions Assumptions —— Potential SourcesPotential Sourcesand Uses of Cashand Uses of Cash
The forecast scenario is illustrative of a potential outcome, and does not imply guidance or a mostlikely outcomeEPS growth of 6% per year, mid-point of the 5 – 7% objective range, from 2006 midpoint of $1.30Dividend rate increase 3% per year, mid-point of the 2 – 4% objective rangeDividends increase in 2007 and 2008 for expected conversion of convertible notesDepreciation growth consistent with rate baseNo change in working capital or deferred taxesCOLI successfully resolved
The forecast scenario is illustrative of a potential outcome, and does not imply guidance or a mostlikely outcomeEPS growth of 6% per year, mid-point of the 5 – 7% objective range, from 2006 midpoint of $1.30Dividend rate increase 3% per year, mid-point of the 2 – 4% objective rangeDividends increase in 2007 and 2008 for expected conversion of convertible notesDepreciation growth consistent with rate baseNo change in working capital or deferred taxesCOLI successfully resolved
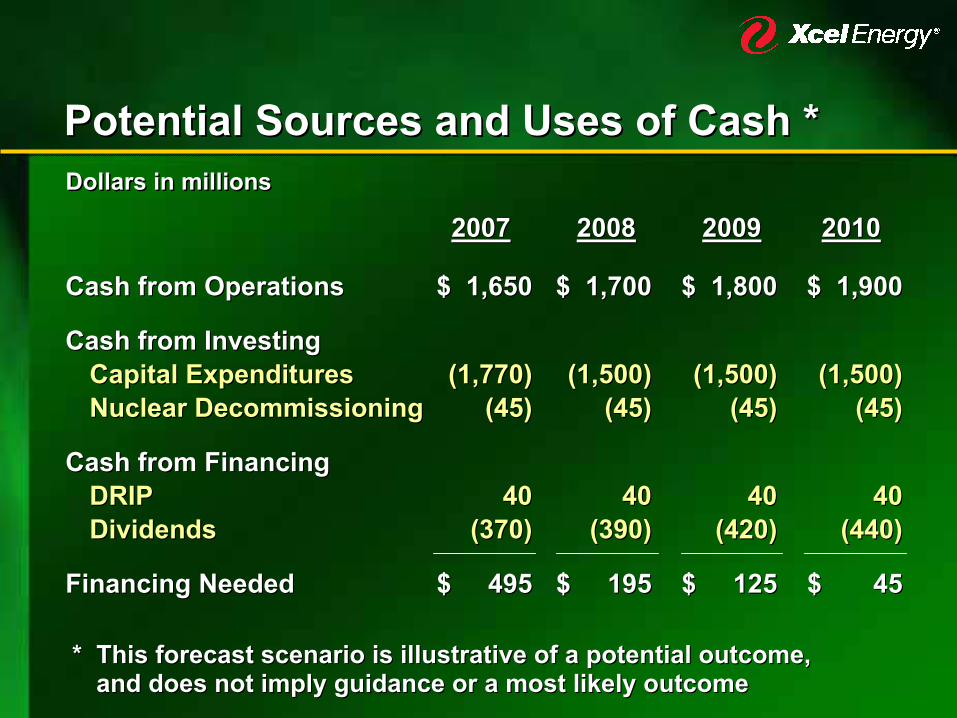
Cash from OperationsCash from Operations $ 1,650$ 1,650 $ 1,700$ 1,700 $ 1,800$ 1,800 $ 1,900$ 1,900
Cash from InvestingCash from InvestingCapital ExpendituresCapital Expenditures (1,770)(1,770) (1,500)(1,500) (1,500)(1,500) (1,500)(1,500)Nuclear DecommissioningNuclear Decommissioning (45)(45) (45)(45) (45)(45) (45)(45)
Cash from FinancingCash from FinancingDRIPDRIP 4040 4040 4040 40 40 DividendsDividends (370)(370) (390)(390) (420)(420) (440)(440)
Potential Sources and Uses of Cash *Potential Sources and Uses of Cash *
20072007 20082008 20092009 20102010Dollars in millionsDollars in millions
** This forecast scenario is illustrative of a potential outcome, This forecast scenario is illustrative of a potential outcome, and does not imply guidance or a most likely outcomeand does not imply guidance or a most likely outcome
Financing GrowthFinancing Growth
Current financing plan includes:— DRIP— Modest debt ($600 million)— Hybrid preferred ($300 million 2008)
Current financing plan includes:— DRIP— Modest debt ($600 million)— Hybrid preferred ($300 million 2008)
Financing plans to remain flexible:— Capital expenditure opportunities— Unanticipated credit events
Financing plans to remain flexible:— Capital expenditure opportunities— Unanticipated credit events
* This forecast scenario is illustrative of a potential outcome, and does not imply guidance or a most likely outcome
** Assuming conversion of convertible notes into equity
** This forecast scenario is illustrative of a potential outcome, This forecast scenario is illustrative of a potential outcome, and does not imply guidance or a most likely outcomeand does not imply guidance or a most likely outcome
** Assuming conversion of convertible notes into equity
2006 Earnings Guidance Range * 2006 Earnings Guidance Range *
Regulated Utility $1.25 – $1.35Holding Company
and Other (0.10)COLI – Tax Benefit 0.10
Continuing Operations $1.25 – $1.35 **
Regulated Utility $1.25 – $1.35Holding Company
and Other (0.10)COLI – Tax Benefit 0.10
Continuing Operations $1.25 – $1.35 **
20062006
Dollars per shareDollars per share
* Assumptions in appendix** Expectation is to end the year in the upper half of the
guidance range
* Assumptions in appendix** Expectation is to end the year in the upper half of the
guidance range
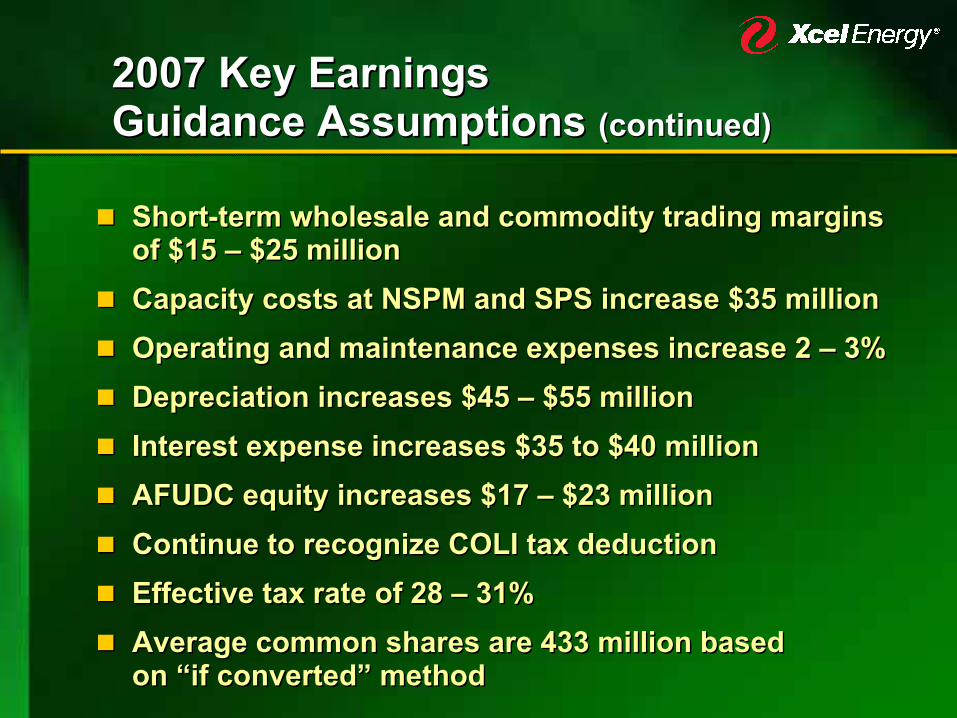
2007 Earnings Guidance Range *2007 Earnings Guidance Range *
Regulated Utility $1.39 – $1.49Holding Company
and Other (0.15)COLI – Tax Benefit 0.11
Continuing Operations $1.35 – $1.45
Regulated Utility $1.39 – $1.49Holding Company
and Other (0.15)COLI – Tax Benefit 0.11
Continuing Operations $1.35 – $1.45
20072007
Dollars per shareDollars per share
* Assumptions in appendix* Assumptions in appendix
Sustainable GrowthSustainable Growth
Collaborative process that balances various interests and delivers value to customers and investorsConstructive rate case outcomesForward recovery on significant incremental investmentsPipeline of investments beyond 2010
Collaborative process that balances various interests and delivers value to customers and investorsConstructive rate case outcomesForward recovery on significant incremental investmentsPipeline of investments beyond 2010
Attractive Total ReturnAttractive Total ReturnSustainable 5 Sustainable 5 –– 7% earnings per share growth7% earnings per share growthDividend yield Dividend yield 4%4%Dividend growth of 2 Dividend growth of 2 –– 4% per year4% per year
AppendixAppendix
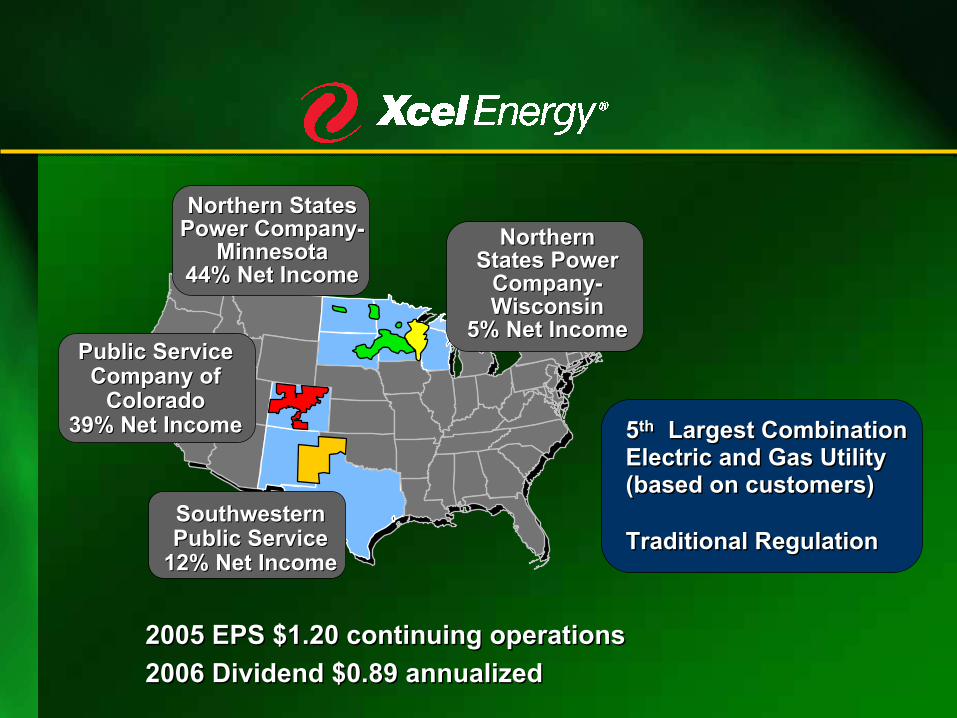
Northern States Northern States Power CompanyPower Company--
MinnesotaMinnesota44% Net Income 44% Net Income
Public Service Public Service Company of Company of
ColoradoColorado39% Net Income39% Net Income
Southwestern Southwestern Public ServicePublic Service
12% Net Income12% Net Income
Northern Northern States Power States Power
CompanyCompany--WisconsinWisconsin
5% Net Income5% Net Income
5th Largest Combination Electric and Gas Utility (based on customers)
5th Largest Combination Electric and Gas Utility (based on customers)
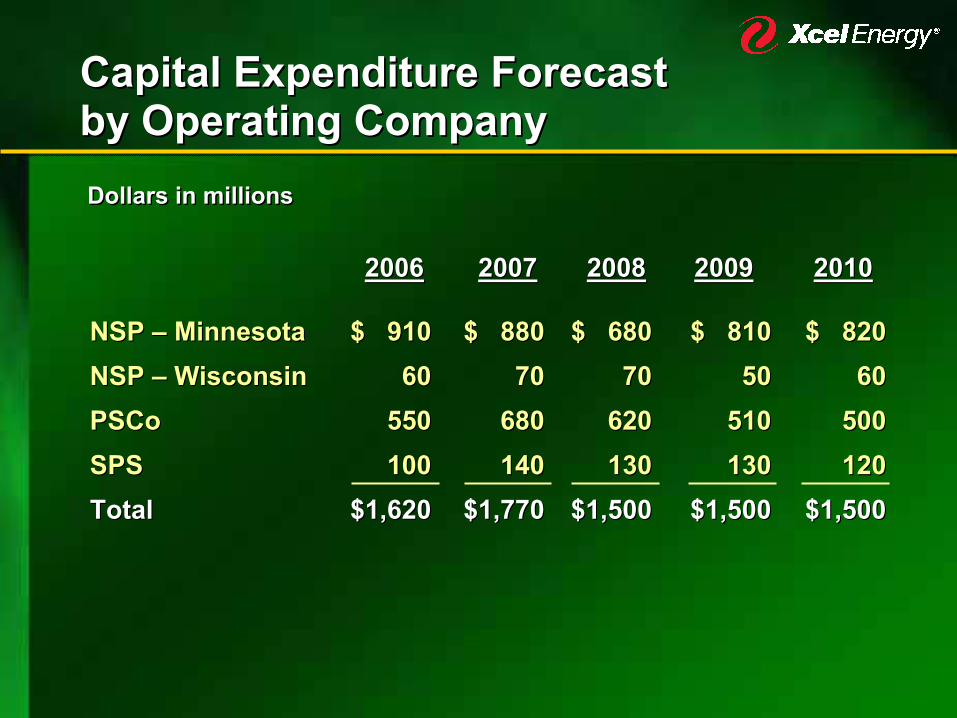
Capital Expenditure ForecastCapital Expenditure Forecastby Operating Companyby Operating Company
20062006 20072007 20082008 20092009 20102010
Dollars in millionsDollars in millions
2005 Rate Base and Returns2005 Rate Base and Returns
Colorado Electric $3,120 8.5%Colorado Gas 1,084 7.00Minnesota Electric 3,230 10.61 9.98%Minnesota Gas 422 6.30 7.42North Dakota Electric 175 12.46 12.65North Dakota Gas 42 5.71 6.81South Dakota Electric 191SPS Electric 1,422Wisconsin Electric 613Wisconsin Gas 83
Colorado Electric $3,120 8.5%Colorado Gas 1,084 7.00Minnesota Electric 3,230 10.61 9.98%Minnesota Gas 422 6.30 7.42North Dakota Electric 175 12.46 12.65North Dakota Gas 42 5.71 6.81South Dakota Electric 191SPS Electric 1,422Wisconsin Electric 613Wisconsin Gas 83
Rate Weather-Base Actual NormalizedRateRate WeatherWeather--BaseBase ActualActual NormalizedNormalized
** Reflects regulatory reporting requirementsReflects regulatory reporting requirements**** Electric and GasElectric and Gas
Return on Equity *Return on Equity *Return on Equity *
Projected electric fuel and purchased energy costs billed for the current month with subsequent true-up; MISO energy and ancillary services being recovered through FCA.
Projected purchased gas cost billed for the current monthwith subsequent true-up
Conservation Improvement Program rider which providesrecovery of program costs plus incentives
Metro Emission Reduction Program, Renewable Development Fund and State Energy Policy rider in place
General Transmission rider authorized by law
Mercury Reduction and Environmental Improvement rider authorized by law
Projected electric fuel and purchased energy costs billed for Projected electric fuel and purchased energy costs billed for the current month with subsequent truethe current month with subsequent true--up; MISO energy and up; MISO energy and ancillary services being recovered through FCA. ancillary services being recovered through FCA.
Projected purchased gas cost billed for the current monthProjected purchased gas cost billed for the current monthwith subsequent truewith subsequent true--upup
Conservation Improvement Program rider which providesConservation Improvement Program rider which providesrecovery of program costs plus incentivesrecovery of program costs plus incentives
Metro Emission Reduction Program, Renewable Development Metro Emission Reduction Program, Renewable Development Fund and State Energy Policy rider in place Fund and State Energy Policy rider in place
General Transmission rider authorized by lawGeneral Transmission rider authorized by law
Mercury Reduction and Environmental Improvement rider Mercury Reduction and Environmental Improvement rider authorized by lawauthorized by law
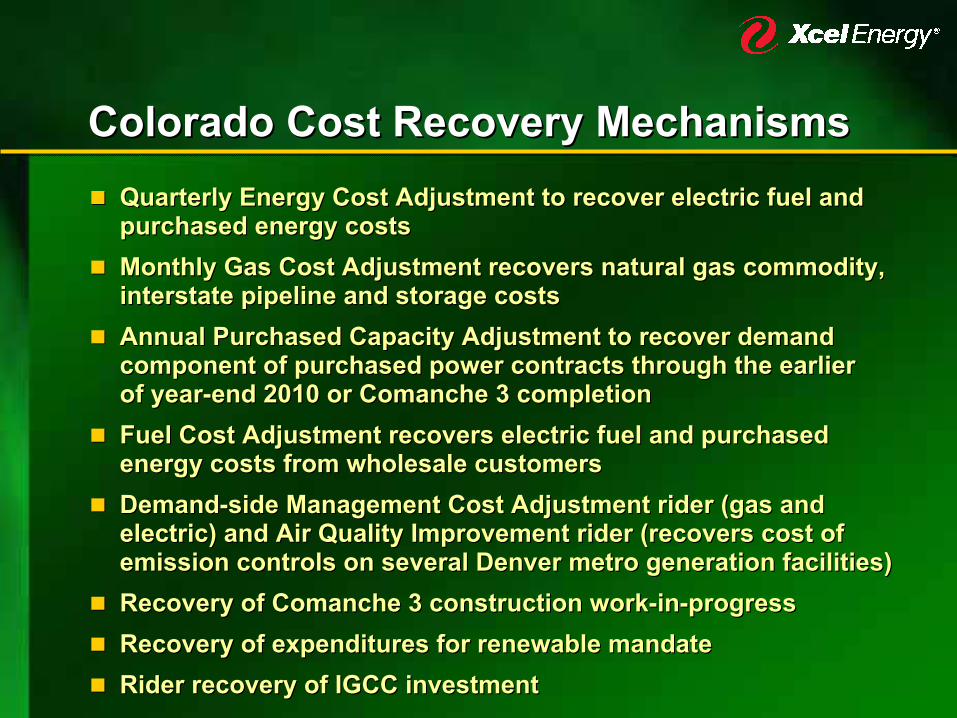
Colorado Cost Recovery MechanismsColorado Cost Recovery MechanismsQuarterly Energy Cost Adjustment to recover electric fuel and Quarterly Energy Cost Adjustment to recover electric fuel and purchased energy costspurchased energy costsMonthly Gas Cost Adjustment recovers natural gas commodity, Monthly Gas Cost Adjustment recovers natural gas commodity, interstate pipeline and storage costsinterstate pipeline and storage costsAnnual Purchased Capacity Adjustment to recover demand Annual Purchased Capacity Adjustment to recover demand component of purchased power contracts through the earliercomponent of purchased power contracts through the earlierof yearof year--end 2010 or Comanche 3 completion end 2010 or Comanche 3 completion Fuel Cost Adjustment recovers electric fuel and purchased Fuel Cost Adjustment recovers electric fuel and purchased energy costs from wholesale customersenergy costs from wholesale customersDemandDemand--side Management Cost Adjustment rider (gas and side Management Cost Adjustment rider (gas and electric) and Air Quality Improvement rider (recovers cost of electric) and Air Quality Improvement rider (recovers cost of emission controls on several Denver metro generation facilities)emission controls on several Denver metro generation facilities)Recovery of Comanche 3 construction workRecovery of Comanche 3 construction work--inin--progress progress Recovery of expenditures for renewable mandateRecovery of expenditures for renewable mandateRider recovery of IGCC investmentRider recovery of IGCC investment
CorporateCorporate--Owned Life InsuranceOwned Life InsuranceLitigation (COLI)Litigation (COLI)
Positive pre-deduction cash flowsMortality gainsThe buildup of cash values
Positive prePositive pre--deduction cash flowsdeduction cash flowsMortality gainsMortality gainsThe buildup of cash valuesThe buildup of cash values
The courtThe court’’s opinion in the Dow case outlined three indicators s opinion in the Dow case outlined three indicators of potential economic benefits to be examined in a COLI case. of potential economic benefits to be examined in a COLI case.
In Xcel EnergyIn Xcel Energy’’s COLI case, the plans:s COLI case, the plans:Were projected to have sizeable preWere projected to have sizeable pre--deduction cash flows, deduction cash flows, based upon the relevant assumptions when purchasedbased upon the relevant assumptions when purchasedPresented the opportunity for mortality gains that were not Presented the opportunity for mortality gains that were not eliminated either retroactively or prospectivelyeliminated either retroactively or prospectivelyHad large cash value increases that were not encumbered by Had large cash value increases that were not encumbered by loans during the first seven years of the policiesloans during the first seven years of the policies
Hearing likely second half of 2006Hearing likely second half of 2006
Approval of Minnesota electric rate case decisionApproval of Colorado electric rate case settlementReasonable rate recovery is approved— Texas electric rate request — Potential Minnesota gas rate request— Potential Colorado gas rate requestNo material incremental accruals in SPS regulatory proceedingsNormal weather patternsWeather adjusted sales growth:— Retail electric 1.7 – 2.2%— Retail gas decline 1 – 2%
Approval of Minnesota electric rate case decisionApproval of Colorado electric rate case settlementReasonable rate recovery is approved— Texas electric rate request — Potential Minnesota gas rate request— Potential Colorado gas rate requestNo material incremental accruals in SPS regulatory proceedingsNormal weather patternsWeather adjusted sales growth:— Retail electric 1.7 – 2.2%— Retail gas decline 1 – 2%