27
Xcel Tolk Project Overview Xcel Tolk Project Overview Fall Plant Optimization Tour Xcel Harrington Generating Station November 17 th , 2010

Xcel Tolk Project OverviewXcel Tolk Project Overview
Fall Plant Optimization TourXcel Harrington Generating StationNovember 17th, 2010

Xcel Tolk Optimization Projects
� Tolk 2:� CombustionOpt install completed Jan ’09� SootOpt install completed April ’09
� Tolk 1:� CombustionOpt install completed June ’09� CombustionOpt install completed June 09� SootOpt install completed July ‘09
Xcel Energy’s Tolk Station
� Located southeast of Muleshoe, Texas� Coal-fired, steam-electric generating station� Two operating units, up to 1,100 MWs:
� 550 MW each
� Low-sulfur coal from WY’s Powder River Basin� NOx reduction efforts included:
� Low NOx burners� Changed air and coal nozzle tips� Ruggedized mills� Boiler Optimization: CombustionOpt & SootOpt

Tolk Unit 2� T-fired, Alstom (CE) boiler� Commissioned in 1985� Max gross load 565 MWs
� Operates 225 – 550 GMW� Six pulverizers
� Five needed for full load� LNBs� LNBs� CCOFA� DCS is Foxboro I/A rev7� DCS historian stores plant data� Modified stack loss (Shinskey) calculation estimates
boiler efficiency

Tolk 2 Optimization Goals
� Reduce NOx Emissions� While maintaining CO at permitted levels
� Increase Boiler Efficiency (reduce stack heatloss)� Maintain SH and RH temps within narrower range� Reduce APH inlet temperature� Better control burner tilts
� Improve Sootblowing Operations� Minimize over-cleaning & under-cleaning
� Be Responsive to “Wind World” Load Profiles

CombustionOpt Implementation
� Unit 2 implemented Nov ‘08-Jan. ‘09� Unit 1 implemented Feb ‘09-May ‘09� CombustionOpt configured to:
� Reduce NOx� Maintain permitted CO� Increase Boiler Efficiency (reduce stack heat loss)
� Controllable parameters configured for bias control:� Feeder Speed� Excess O2� Windbox-to-Furnace DP� PA Fan Duct Bias� Primary, Auxiliary & Fuel Air Dampers� Corner to corner Burner Tilt control� OFA Top & Bottom Air Flow
SootOpt Implementation
� U2 Installed Oct 2008 – April 2009� U1 Installed April 2009 – August 2009� Designed to take control of all sootblowers
� 96 IRs� 50 IKs� 2 Air Heater blowers
� Rules designed to respond to live measurements� ProcessLink logic modified to allow multiple blowers
to operate at any time� SootOpt capable of requesting 120 operations per hour or
one every 30 seconds� SootOpt rules configured to satisfy operational
requirements

Initial Results U2CombustionOpt: NOx
2 day NOx compare
0.25
0.3
0.35
440 MW 500 MW 560 MW
0.25lb/MBTU
CombustionOptOFF
0
0.05
0.1
0.15
0.2
400 420 440 460 480 500 520 540 560 580
MW
lb/MBtuCOpt on
COpt off
Linear (COpton)
Linear (COptoff)
0.15lb/MBTU CombustionOpt
ON
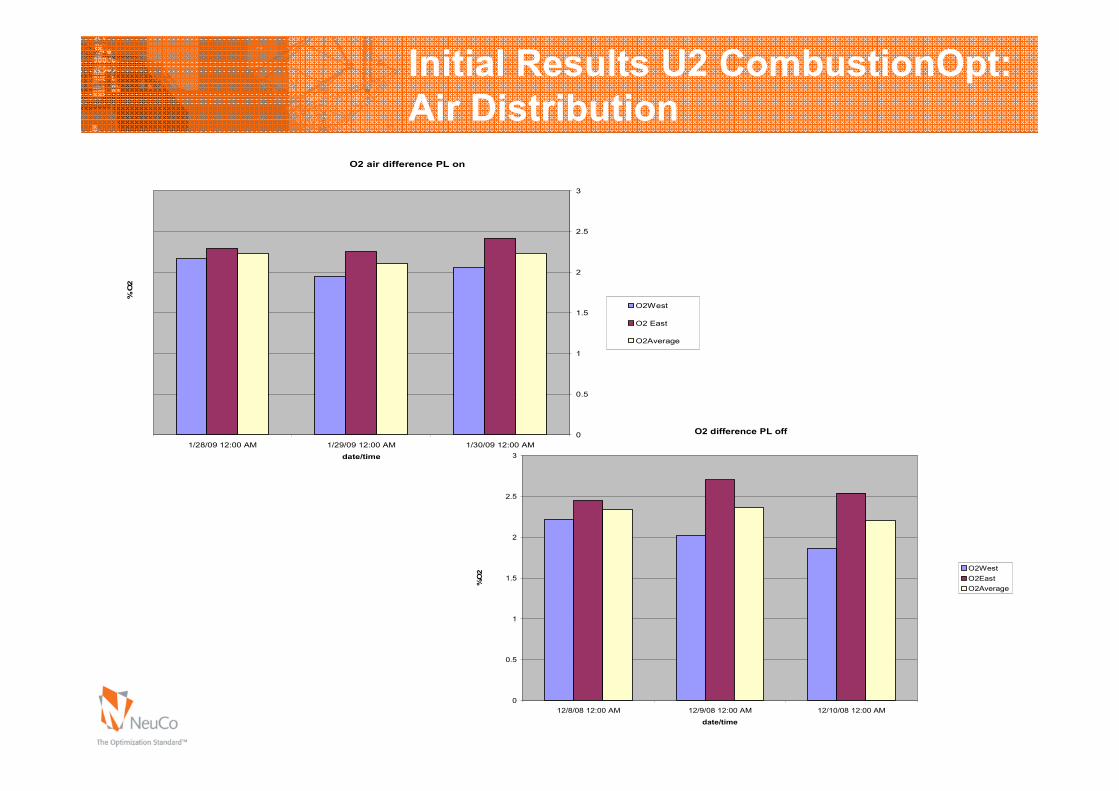
Initial Results U2 CombustionOpt:Air Distribution
O2 air difference PL on
0 5
1
1.5
2
2.5
3
%O
2
O2West
O2 East
O2Average
0
0.5
1/28/09 12:00 AM 1/29/09 12:00 AM 1/30/09 12:00 AM
date/time
O2 difference PL off
0
0.5
1
1.5
2
2.5
3
12/8/08 12:00 AM 12/9/08 12:00 AM 12/10/08 12:00 AM
date/time
%O
2 O2WestO2EastO2Average
Initial Results U2: SootOpt
� Operators have one less thing to worryabout� Takes the right actions, consistently
� Changing MW profile not a problem� SH & RH temps better balancedp� Superheat Sprays significantly reduced� Air Preheater gas inlet temps significantly
reduced� Boiler Efficiency increased slightly
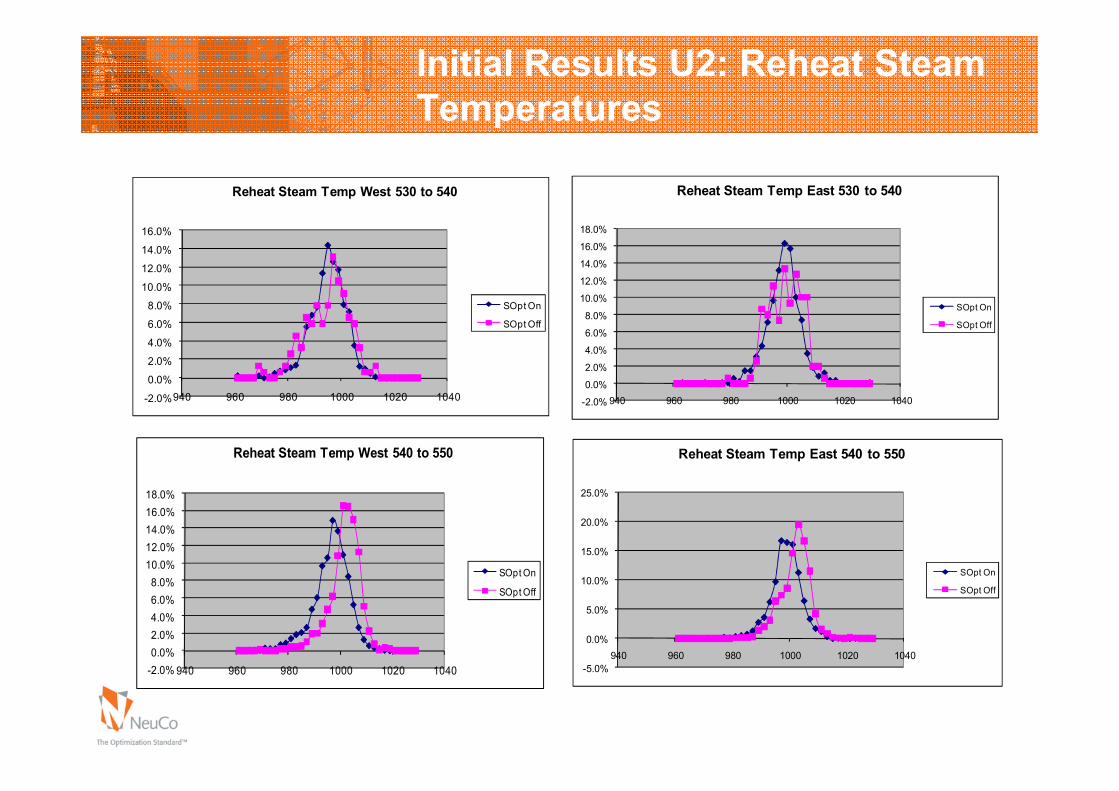
Initial Results U2: Reheat SteamTemperatures
2 0%
0.0%
2.0%
4.0%
6.0%
8.0%
10.0%
12.0%
14.0%
16.0%
940 960 980 1000 1020 1040
Reheat Steam Temp West 530 to 540
SOpt On
SOpt Off
0.0%
2.0%
4.0%
6.0%
8.0%
10.0%
12.0%
14.0%
16.0%
18.0%
Reheat Steam Temp East 530 to 540
SOpt On
SOpt Off
-2.0%940 960 980 1000 1020 1040 -2.0% 940 960 980 1000 1020 1040
-2.0%0.0%2.0%4.0%6.0%8.0%
10.0%12.0%14.0%16.0%18.0%
940 960 980 1000 1020 1040
Reheat Steam Temp West 540 to 550
SOpt On
SOpt Off
-5.0%
0.0%
5.0%
10.0%
15.0%
20.0%
25.0%
940 960 980 1000 1020 1040
Reheat Steam Temp East 540 to 550
SOpt On
SOpt Off

Superheat Steam Temperature East 530 to 540
-5.0%
0.0%
5.0%
10.0%
15.0%
20.0%
25.0%
970 980 990 1000 1010 1020
SootOpt ONSootOpt OFF
Superheat Steam Temperature West 530 to 540
-5.0%
0.0%
5.0%
10.0%
15.0%
20.0%
25.0%
970 980 990 1000 1010 1020
SootOpt ONSootOpt OFF
Initial Results U2: SuperheatSteam Temps
Superheat Steam Temperature East 540 to 550
-5.0%
0.0%
5.0%
10.0%
15.0%
20.0%
25.0%
970 980 990 1000 1010 1020
SootOpt ONSootOpt OFF
Superheat Steam Temperature West 540 to 550
-5.0%
0.0%
5.0%
10.0%
15.0%
20.0%
25.0%
30.0%
970 980 990 1000 1010 1020
SootOpt ONSootOpt OFF
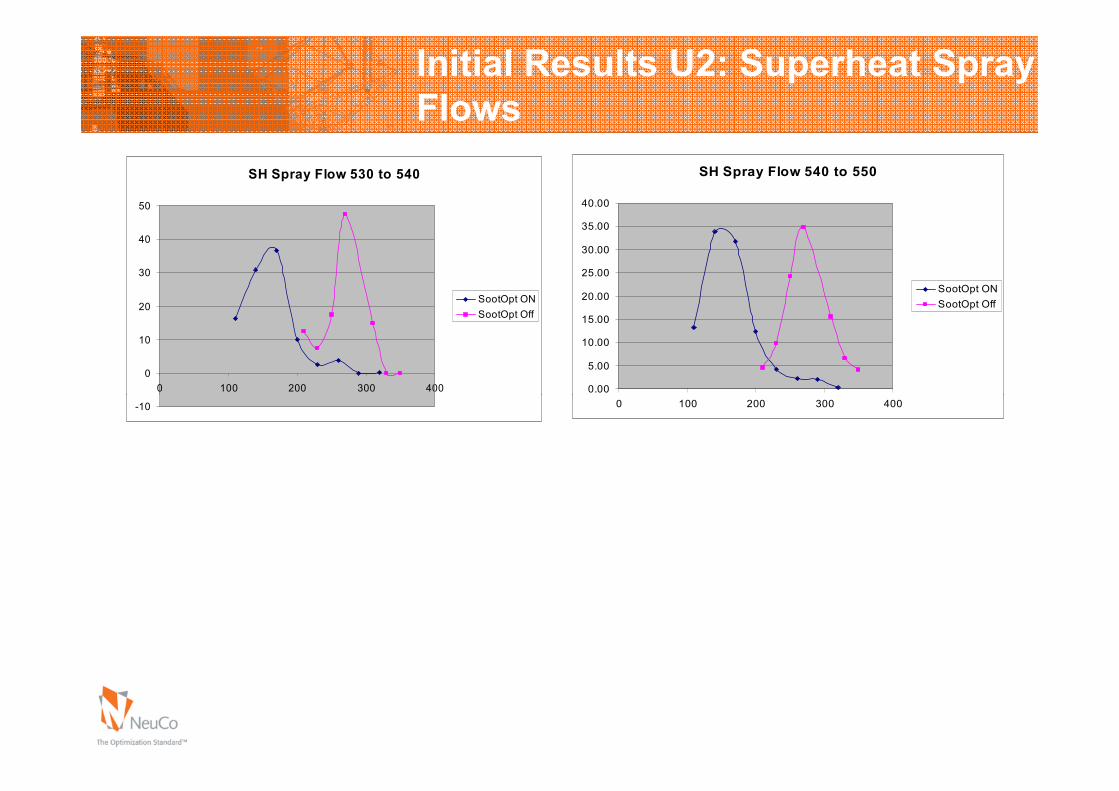
SH Spray Flow 540 to 550
0.00
5.00
10.00
15.00
20.00
25.00
30.00
35.00
40.00
SootOpt ONSootOpt Off
SH Spray Flow 530 to 540
0
10
20
30
40
50
0 100 200 300 400
SootOpt ONSootOpt Off
Initial Results U2: Superheat SprayFlows
0 100 200 300 400-10
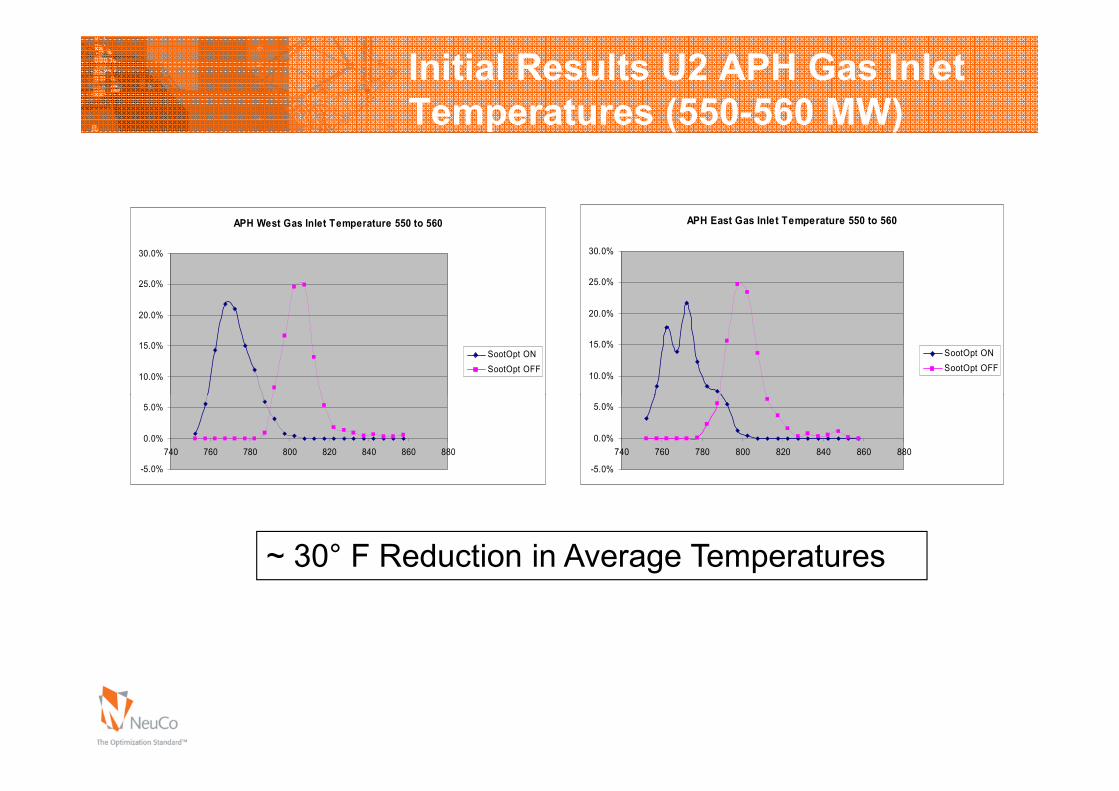
APH East Gas Inlet Temperature 550 to 560
10.0%
15.0%
20.0%
25.0%
30.0%
SootOpt ONSootOpt OFF
APH West Gas Inlet Temperature 550 to 560
10.0%
15.0%
20.0%
25.0%
30.0%
SootOpt ONSootOpt OFF
Initial Results U2 APH Gas InletTemperatures (550-560 MW)
-5.0%
0.0%
5.0%
740 760 780 800 820 840 860 880
-5.0%
0.0%
5.0%
740 760 780 800 820 840 860 880
~ 30° F Reduction in Average Temperatures

Initial Results U2: ImprovedBoiler Efficiency
� Shinskey efficiency with SootOpt off and on
2030405060708090
Shinsky Efficiency 530 to 540
SOpt ON
SOpt Off
10 00
20.00
30.00
40.00
50.00
60.00
Shinsky Efficiency 540 to 550
SOpt ON
SOpt Off
-100
1020
87.96 87.965 87.97 87.975 87.98 87.985 87.99 87.995 -10.00
0.00
10.00
87.96 87.97 87.98 87.99 88

Initial Results U2:More Balanced Sootblowing
� Before SootOpt:� Economizer was rarely cleaned due to tube erosion concerns
� With SootOpt:� Rules provided confidence that economizer would not be over-cleaned.
Increased but balanced sootblowing resulted in significantly lower APH gasinlet temps, more consistent economizer temps and more stable air flows.

U2 Conclusions
� Achieved Initial Objectives� Reduced NOx emissions
• Averaging between .17 and .18 as a result of overall NOx reductionproject
� Maintained SH and RH temps within narrower range� Achieved better control of burner tilts� Improved overall sootblower operations� Improved overall sootblower operations� Increased Boiler Efficiency (reduce stack heat loss)
• Stack loss decreased (per Shinskey calc)• Significantly lower spray flows• Significantly lower air preheater inlet temperatures
� Optimization has adjusted well to changing dispatch profile� Economizer can now be blown safely
� Changed operational philosophy� Operators have confidence in system and are free to focus on
other tasks

Initial Results U1:SH Temps West & East by Load

Initial Results U1:SH Sprays West & East by Load

Initial Results U1:RH Temps West & East by Load

Initial Results U1:APH West & East Gas Inlet Temps

Initial Results U1:Shinskey Efficiency

Initial Results U1: NOx
0.225
0.23
0.235
0.24
0.245
0.25
0.255
0.26
lb/M
mbtu
NOx ON
NOx OFF
� Average NOx vs. Load for SootOpt ON vs. OFF
0.22
530 535 540 545 550 555
MW

Customer Support Activities
� Alerts Monitoring� Optimizer Health� Utilization
� Periodic Reports� Continuous Improvements: Maximize Utilization and
Value� Tweak existing models for better model fidelity� Tweak optimizer’s priorities as per changed plant priorities� Create new models to address new operational constraints� Leverage new additional instrumentation� Leverage new manipulated variables and controls� Tweak bias constraints for better optimizer response and
address operational constraints� Software upgrades to leverage new ProcessLink features

Continuous Improvements at XcelTolkManaging NOx versus CO Tradeoff
4: But then NOxgot higher
1: Optimizer did anExcellent job reducingNOx
1: Optimizer did anExcellent job reducingNOx 4: But then NOx
got higher
2: But CO gothigher
3: Operatorscontrolled O2 biasto address CO

Managing NOx versus COTradeoff
� Objectives:� Find an optimal sweet spot (NOx versus CO)� Improve optimizer’s response during load ramps
� Strategy:� Improve models’ fidelity specifically during load ramps� Improve O2 bias response to find NOx and CO sweet spot� Improve O2 bias response to find NOx and CO sweet spot� Investigate dynamic optimization tools
� Action Plan:� Step 1: Improve models through providing possible missing
information: Additional “Disturbance Variables”� Step 2: Improve model retuning� Step 3: Improve O2 bias response: Expert rules for O2 Bias
Continuous Improvements
� Recent Events:� SootOpt utilizing CombustionOpt’s knowledge about boiler
heat transfer profile to achieve best NOx and boilerefficiency• CombustionOpt model to determine best tilt position for NOx reduction
and provide tilt set point to SootOpt• SootOpt blows to help CombustionOpt maintain best tilt position whileSootOpt blows to help CombustionOpt maintain best tilt position while
trying to maintain steam temperatures at the setpoint
� MPC being used to help with increased load variations dueincreasing Renewable Energy portfolio requirements
� Integrating new instruments (Zolo combustion tomography)with CombustionOpt and SootOpt• CombustionOpt now working on “flattening CO profile in the Upper
Furnace• Slag process identification (in progress)• Incorporating Heat Flux sensors, Strain Gauges, Delta T’s
![PROCESS BURNERS SPARES MANUAL - lanemark.com · 2 burner windbox 3 flame tube 4 combustion tube (if fitted) 5 burner head assembly gasket (1.5mm) [ matl = wcl superior ] 6 burner](https://static.documents.pub/doc/80x56/5fa04a60398ae222006afb43/process-burners-spares-manual-2-burner-windbox-3-flame-tube-4-combustion-tube.jpg)


![[XLS] · Web view86453 28 35 7 0 0 87324 4 5 1 0 0 88881 4 5 1 0 0 87326 5 5 0 0 0 87327 3 5 2 0 0 88895 4 5 1 0 0 87329 4 5 1 0 0 87332 1 5 4 0 0 87083 14 30 16 0 0 89274 2 5 3 0](https://static.documents.pub/doc/80x56/5af0fdb97f8b9ac2468eca92/xls-view86453-28-35-7-0-0-87324-4-5-1-0-0-88881-4-5-1-0-0-87326-5-5-0-0-0-87327.jpg)