41
User Reference Manual Xcelsius 2008 iTree Consulting Private Limited Copyright © iTree Consulting Pvt. Ltd.| All rights reserved
| Date post: | 23-Oct-2014 |
| Category: |
Documents |
| Upload: | ketanpotdar |
| View: | 253 times |
| Download: | 3 times |

User Reference Manual
Xcelsius 2008 iTree Consulting Private Limited Copyright © iTree Consulting Pvt. Ltd.| All rights reserved

Copyright © iTree Consulting Pvt. Ltd.| All rights reserved. June 2009.
Contents
1. Introduction .............................................................................................................................................. 3 2. Getting Started with Crystal Xcelsius 2008 ............................................................................................... 4 3. Working with Chart Component ............................................................................................................... 7 4.Dynamic Visibility ..................................................................................................................................... 12 5.Working with Selector ............................................................................................................................. 14 6. Working with Single Value Components................................................................................................. 16 7. Working with Maps, Text, Arts n Background and Other Components ................................................. 17 8. Other Components ................................................................................................................................. 20 9. Working with Live Office ......................................................................................................................... 33
Copyright © iTree Consulting Pvt. Ltd.| All rights reserved. June 2009.
1. Introduction Xcelsius is a Dashboarding tool which provides visualization power to your business
data.
Xcelsius is more powerful because it is based on Microsoft Excel.
Xcelsius has ability to provide “What-If-Analysis” for better decision making.
Copyright © iTree Consulting Pvt. Ltd.| All rights reserved. June 2009.
2. Getting Started with Crystal Xcelsius 2008
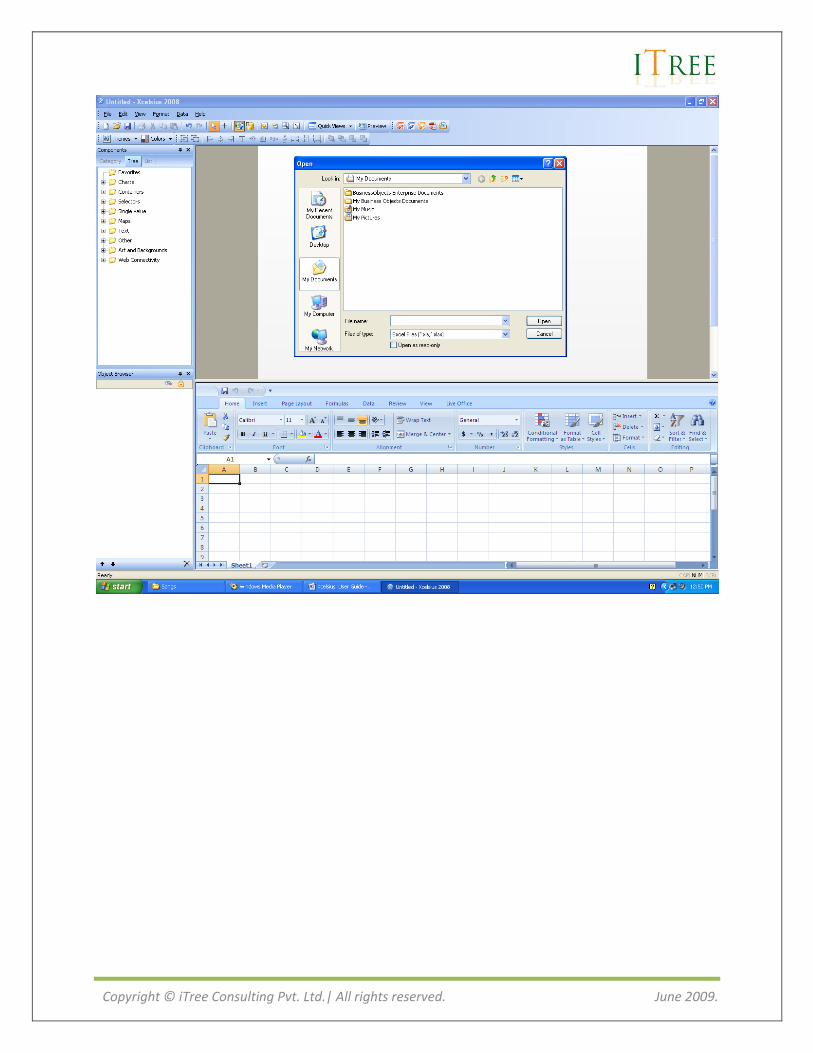
Start Crystal Xcelsius 2008 and you will find the screen as shown consisting Canvas, &
Excel.
As specified on standard tool-bar you can have view to only canvas or excel or both,
save .xlf file, increase or decrease the size of canvas as required, preview visualization.
From Export tool –bar, you have variety of export options like Excel, PDF, PPT, and SWF
& even to BOE.
You have THEMEs tool-bar to apply various themes and colors to visualization.
Format toll-bar is used to bring your components in front or back, center horizontally,
vertically and both, align top or bottom.
Click on View- Components to see list of all available components. You have tree list
for Charts, Containers, Selectors, Single Value, Maps, Test, Other, Art and Background
and Web Connectivity. All components can be viewed in Category, Tree or List mode.
Cock on View- Object Browser to see all components placed on canvas as object. You
can set properties for each object like name, group, visible or not in non-preview mode.

Copyright © iTree Consulting Pvt. Ltd.| All rights reserved. June 2009.
When you open Xcelsius by default blank Excel is also embedded.
If you have any other Excel spreadsheet then you can also import it from Data-Import
or from Import Spreadsheet option from Standard tool-bar.
You have also option of import from Enterprise and even exporting embedded Excel.
Copyright © iTree Consulting Pvt. Ltd.| All rights reserved. June 2009.
Copyright © iTree Consulting Pvt. Ltd.| All rights reserved. June 2009.
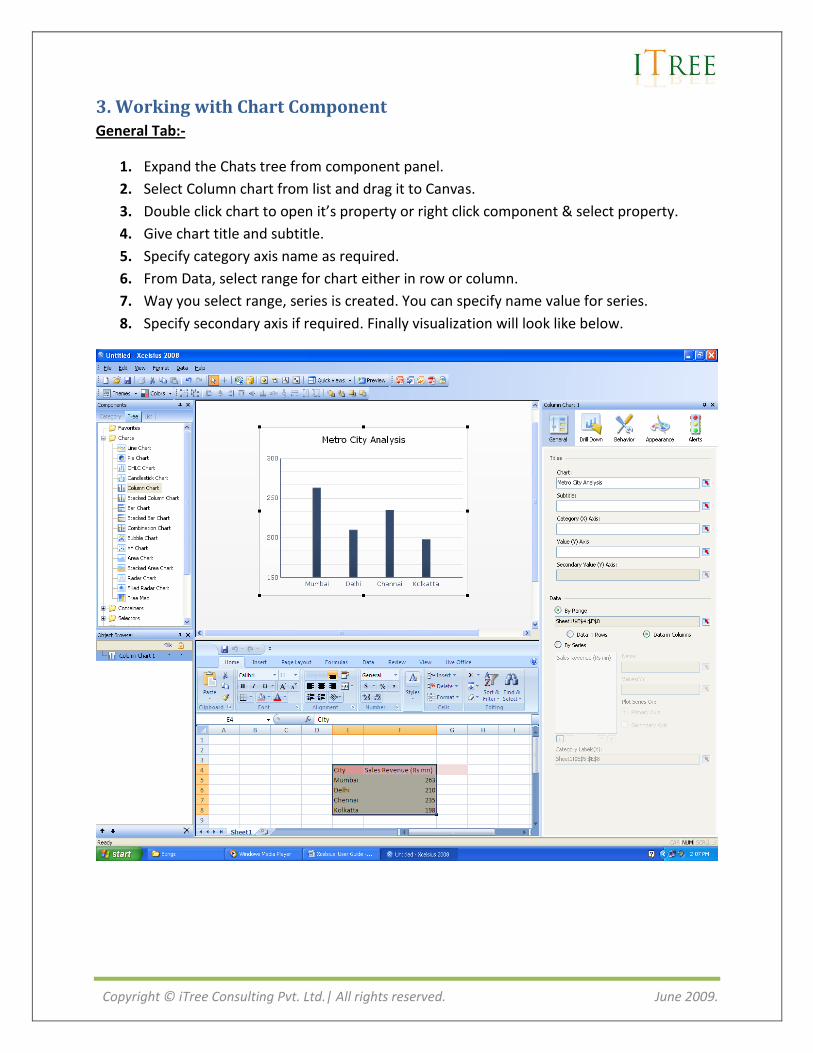
3. Working with Chart Component General Tab:-
1. Expand the Chats tree from component panel.
2. Select Column chart from list and drag it to Canvas.
3. Double click chart to open it’s property or right click component & select property.
4. Give chart title and subtitle.
5. Specify category axis name as required.
6. From Data, select range for chart either in row or column.
7. Way you select range, series is created. You can specify name value for series.
8. Specify secondary axis if required. Finally visualization will look like below.
Copyright © iTree Consulting Pvt. Ltd.| All rights reserved. June 2009.
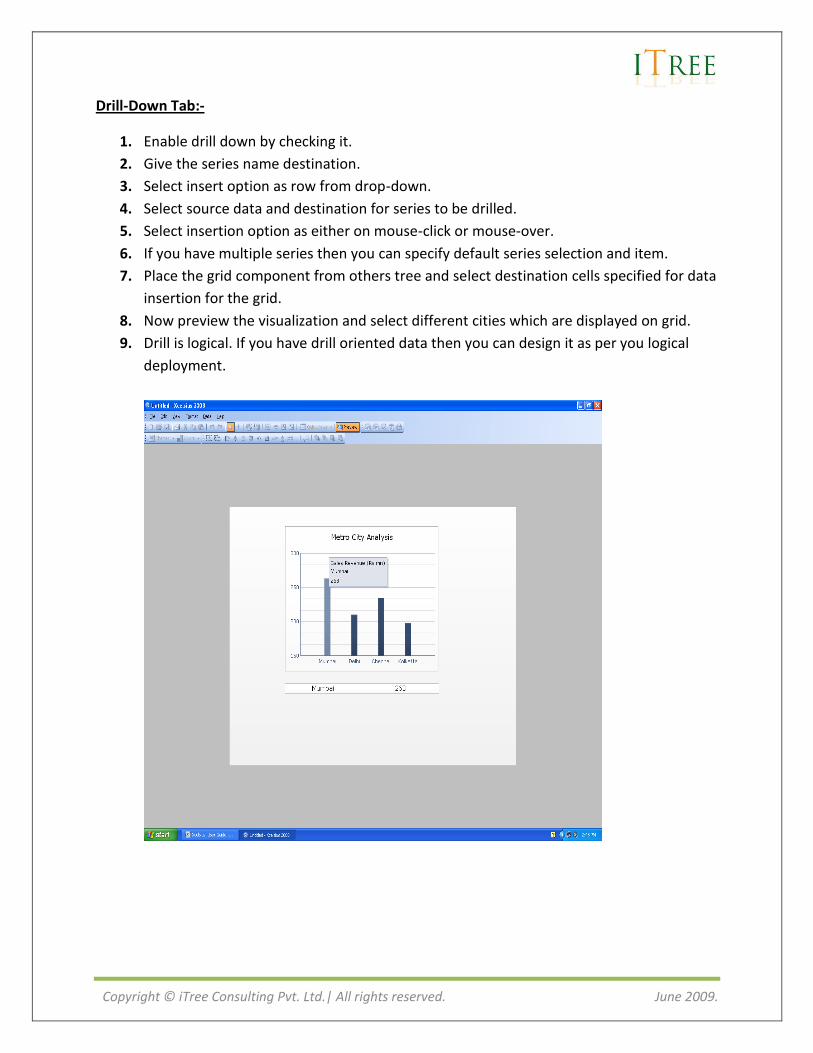
Drill-Down Tab:-
1. Enable drill down by checking it.
2. Give the series name destination.
3. Select insert option as row from drop-down.
4. Select source data and destination for series to be drilled.
5. Select insertion option as either on mouse-click or mouse-over.
6. If you have multiple series then you can specify default series selection and item.
7. Place the grid component from others tree and select destination cells specified for data
insertion for the grid.
8. Now preview the visualization and select different cities which are displayed on grid.
9. Drill is logical. If you have drill oriented data then you can design it as per you logical
deployment.
Copyright © iTree Consulting Pvt. Ltd.| All rights reserved. June 2009.
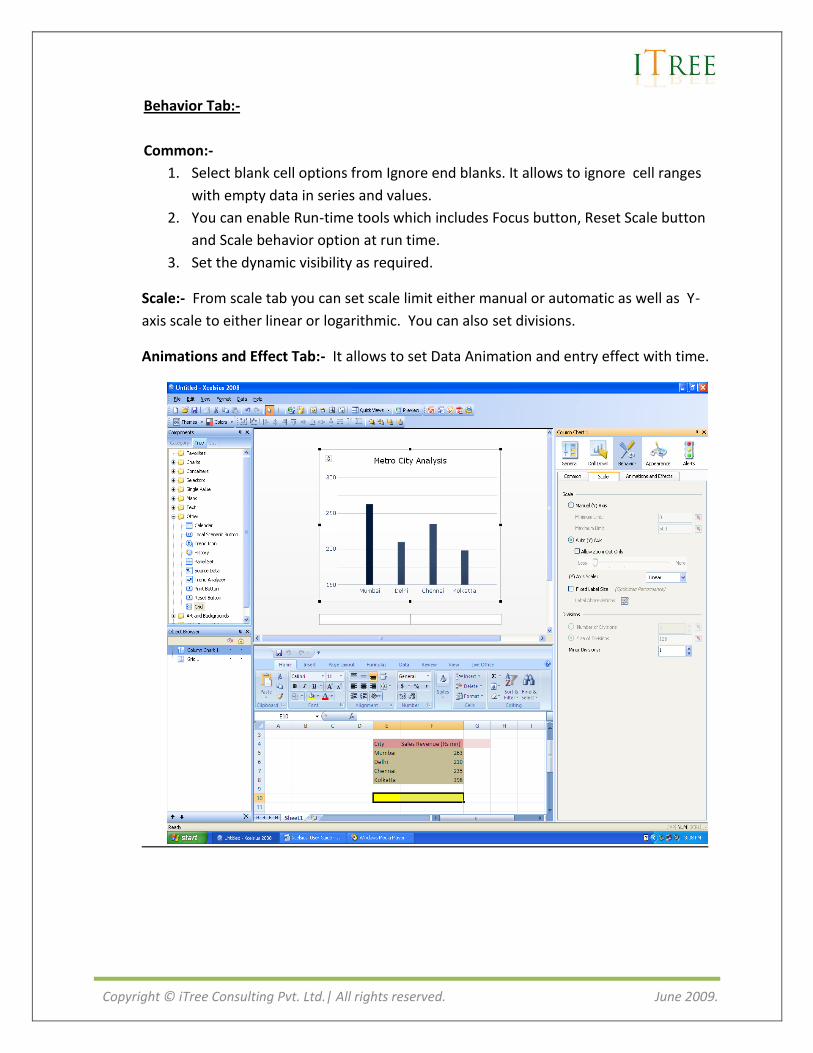
Behavior Tab:-
Common:-
1. Select blank cell options from Ignore end blanks. It allows to ignore cell ranges
with empty data in series and values.
2. You can enable Run-time tools which includes Focus button, Reset Scale button
and Scale behavior option at run time.
3. Set the dynamic visibility as required.
Scale:- From scale tab you can set scale limit either manual or automatic as well as Y-
axis scale to either linear or logarithmic. You can also set divisions.
Animations and Effect Tab:- It allows to set Data Animation and entry effect with time.
Copyright © iTree Consulting Pvt. Ltd.| All rights reserved. June 2009.
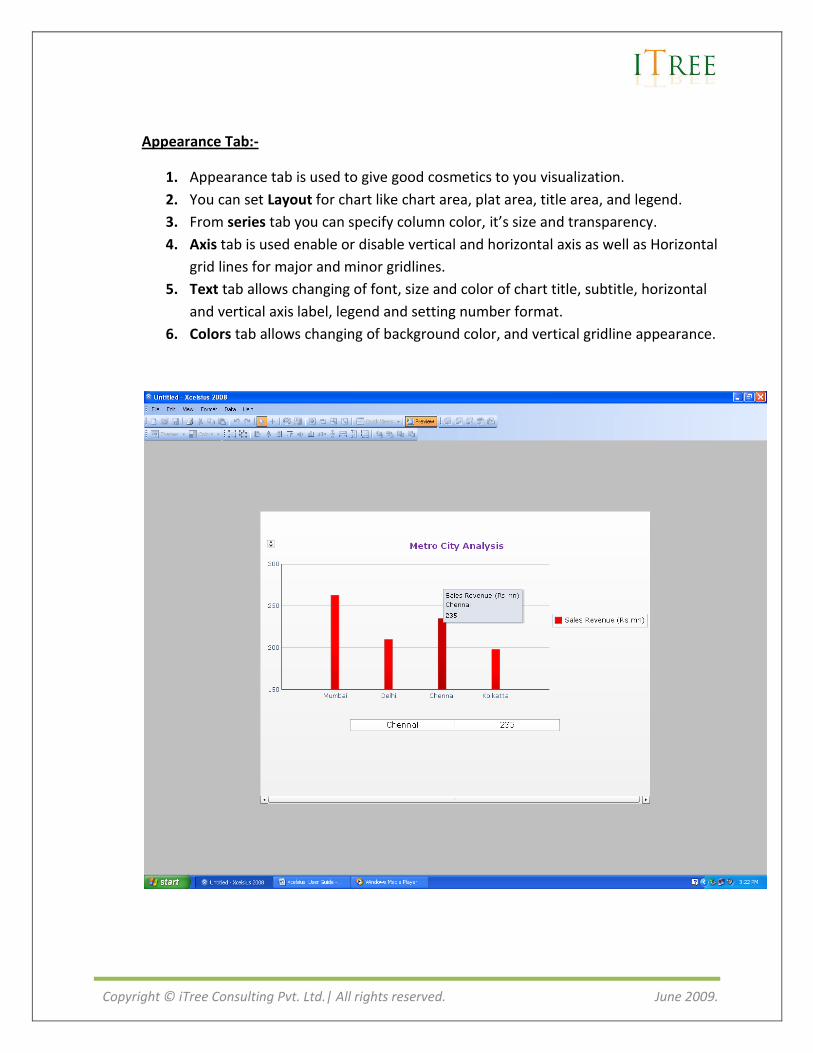
Appearance Tab:-
1. Appearance tab is used to give good cosmetics to you visualization.
2. You can set Layout for chart like chart area, plat area, title area, and legend.
3. From series tab you can specify column color, it’s size and transparency.
4. Axis tab is used enable or disable vertical and horizontal axis as well as Horizontal
grid lines for major and minor gridlines.
5. Text tab allows changing of font, size and color of chart title, subtitle, horizontal
and vertical axis label, legend and setting number format.
6. Colors tab allows changing of background color, and vertical gridline appearance.
Copyright © iTree Consulting Pvt. Ltd.| All rights reserved. June 2009.
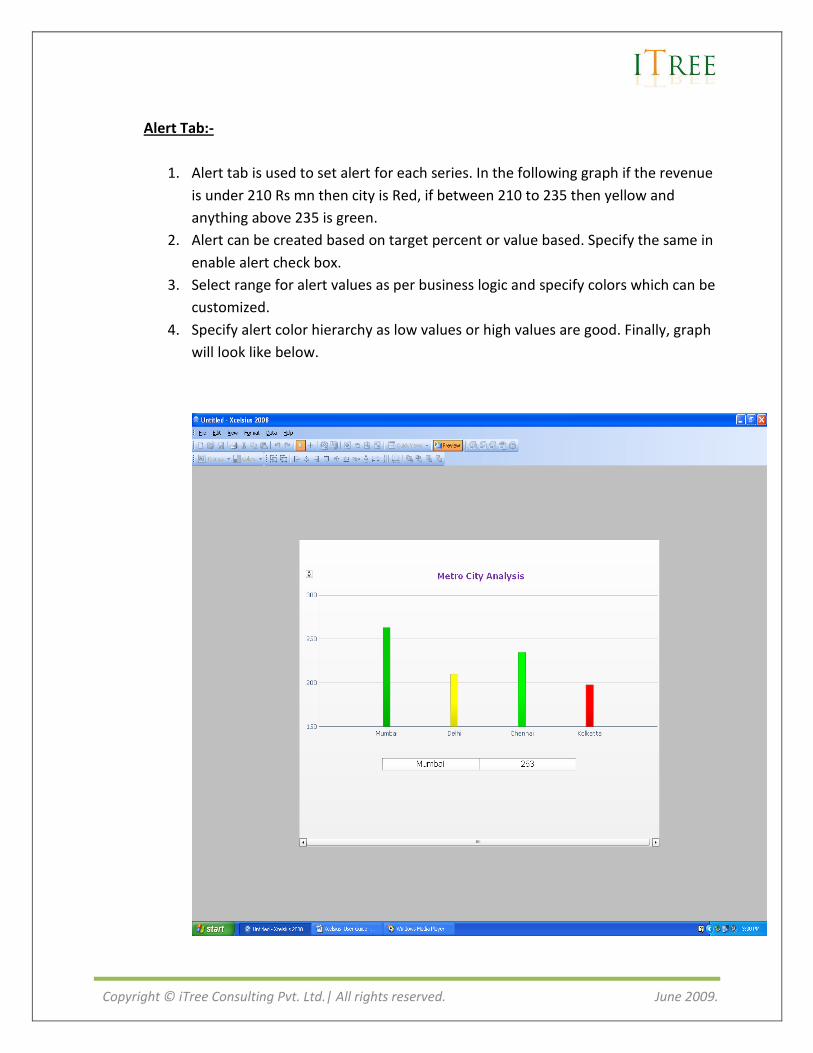
Alert Tab:-
1. Alert tab is used to set alert for each series. In the following graph if the revenue
is under 210 Rs mn then city is Red, if between 210 to 235 then yellow and
anything above 235 is green.
2. Alert can be created based on target percent or value based. Specify the same in
enable alert check box.
3. Select range for alert values as per business logic and specify colors which can be
customized.
4. Specify alert color hierarchy as low values or high values are good. Finally, graph
will look like below.
Copyright © iTree Consulting Pvt. Ltd.| All rights reserved. June 2009.
4.Dynamic Visibility
1. Dynamic visibility is very important concept in Xcelsius. It is used to show or hide
component at run time.
2. To make it possible we insert some value in excel cell then depending upon the
status of the cell component is shown or hidden.
3. We have different insert option like:
Position
Label
Value
Row
Column
Status List
Filtered Row
All insert option works with blank excel cells.
4. If you insert by Position, then the actual numbers starting from 1 is inserted to
the specified cell destination. E.g. for list box selector if you have 5 items in it
then for each selection numbers from 1 to 5 is inserted. Say for 3rd item number
3 is inserted.
5. If you insert by Label, then actual string of the selector is inserted to specified
cell destination. E.g. for Label based menu selector if you have three labels
named Mumbai, Delhi & Chennai then for respective selection of button actual
string is inserted. Say for selection of Mumbai, actual text “Mumbai” is inserted.
6. If you insert by value, you need to select source data from excel and then specify
cell destination. E.g. if you have combo box as selector with three items then you
select any three cells as range having data 12,34,56. For selection of first item
value 12 is inserted to destination. For second and third selection respective
values 34 and 56 is inserted to destination. It works with any cell values.
7. If you insert by Row, you need to select source data from excel sheet and specify
destination as blank excel row. E.g. if you have spreadsheet table as selector
then specify source data for table to insert value by row. On selection of
individual row from table respective row from selected source data is inserted to
destination row.
Copyright © iTree Consulting Pvt. Ltd.| All rights reserved. June 2009.
8. If you insert by Column, you need to select source data from excel sheet and
specify destination as blank excel column. E.g. if you have list view as selector
then select source data for list view component to insert value by column. Say
list view has three items and source data contains three columns then on
selection of first item first column is inserted. For the rest of the items respective
column is inserted.
9. If you insert by Filtered Row, then the scenario is same as insert by row but it
inserts data by filtering it.
10. If you insert by status list, it inserts 1 for selected item and 0 for unselected. E.g.
if you have Fish eye as selector with tree items then select three cells as
destination. For first selected item value 1 is inserted to first cell and 0 in
inserted in two other cells. If item 2 is selected then value 1 is inserted in second
cell and value 0 is inserted in first and third cell. Same combination happens
when third item is selected.
After setting insert option for selector component or for drill with chart go to the
components Behavior tab. There is Dynamic Visibility option. You have status, select
excel cell specified as destination for insert option. In the key, specify appropriate value
or select appropriate cell range to satisfy condition.
Copyright © iTree Consulting Pvt. Ltd.| All rights reserved. June 2009.
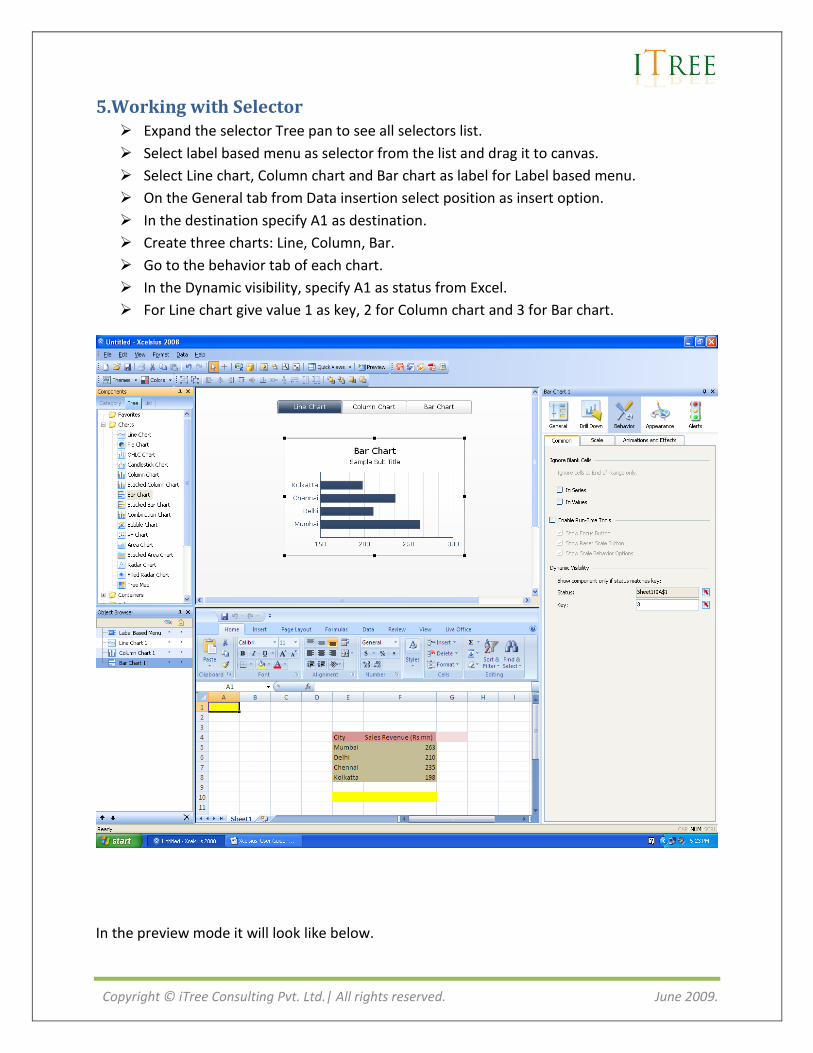
5.Working with Selector Expand the selector Tree pan to see all selectors list.
Select label based menu as selector from the list and drag it to canvas.
Select Line chart, Column chart and Bar chart as label for Label based menu.
On the General tab from Data insertion select position as insert option.
In the destination specify A1 as destination.
Create three charts: Line, Column, Bar.
Go to the behavior tab of each chart.
In the Dynamic visibility, specify A1 as status from Excel.
For Line chart give value 1 as key, 2 for Column chart and 3 for Bar chart.
In the preview mode it will look like below.
Copyright © iTree Consulting Pvt. Ltd.| All rights reserved. June 2009.
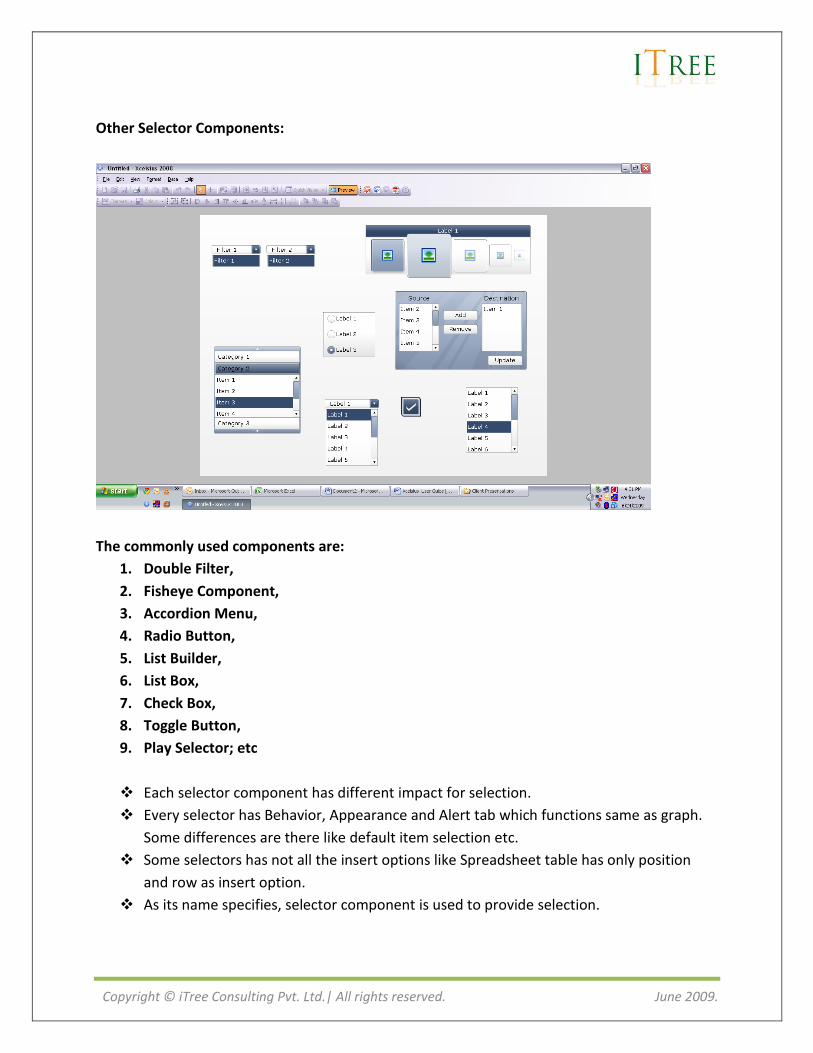
Other Selector Components:
The commonly used components are:
1. Double Filter,
2. Fisheye Component,
3. Accordion Menu,
4. Radio Button,
5. List Builder,
6. List Box,
7. Check Box,
8. Toggle Button,
9. Play Selector; etc
Each selector component has different impact for selection.
Every selector has Behavior, Appearance and Alert tab which functions same as graph.
Some differences are there like default item selection etc.
Some selectors has not all the insert options like Spreadsheet table has only position
and row as insert option.
As its name specifies, selector component is used to provide selection.
Copyright © iTree Consulting Pvt. Ltd.| All rights reserved. June 2009.
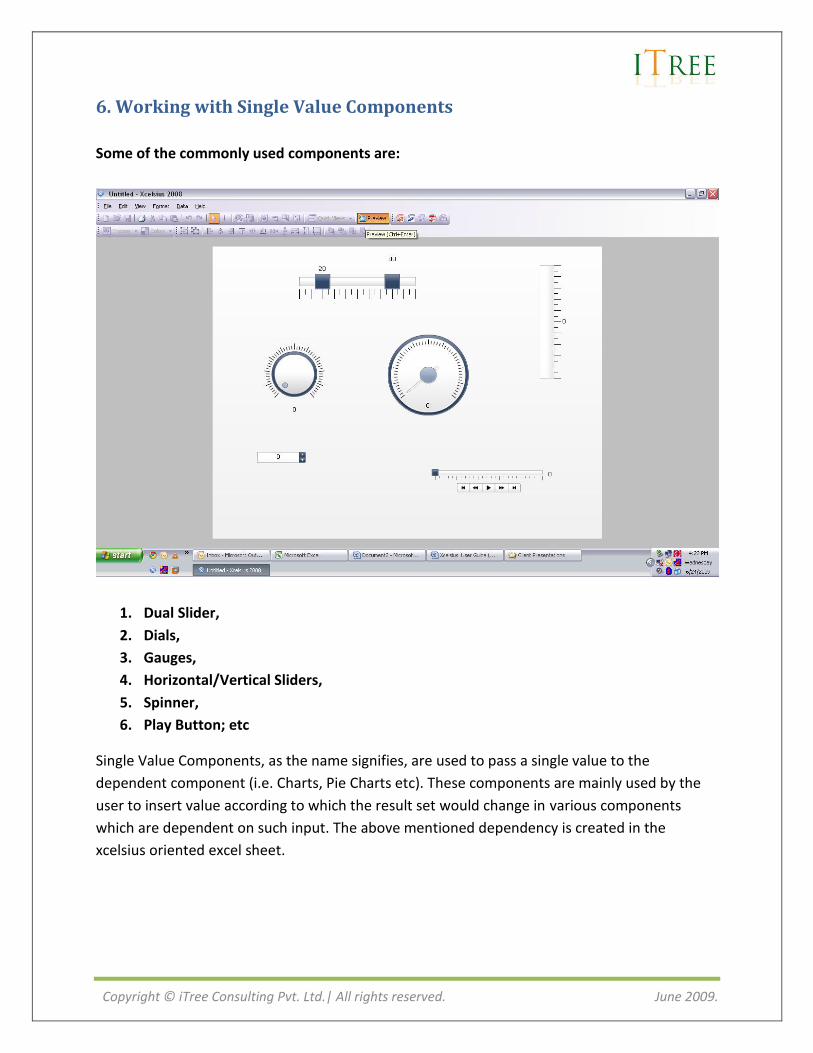
6. Working with Single Value Components
Some of the commonly used components are:
1. Dual Slider,
2. Dials,
3. Gauges,
4. Horizontal/Vertical Sliders,
5. Spinner,
6. Play Button; etc
Single Value Components, as the name signifies, are used to pass a single value to the
dependent component (i.e. Charts, Pie Charts etc). These components are mainly used by the
user to insert value according to which the result set would change in various components
which are dependent on such input. The above mentioned dependency is created in the
xcelsius oriented excel sheet.
Copyright © iTree Consulting Pvt. Ltd.| All rights reserved. June 2009.
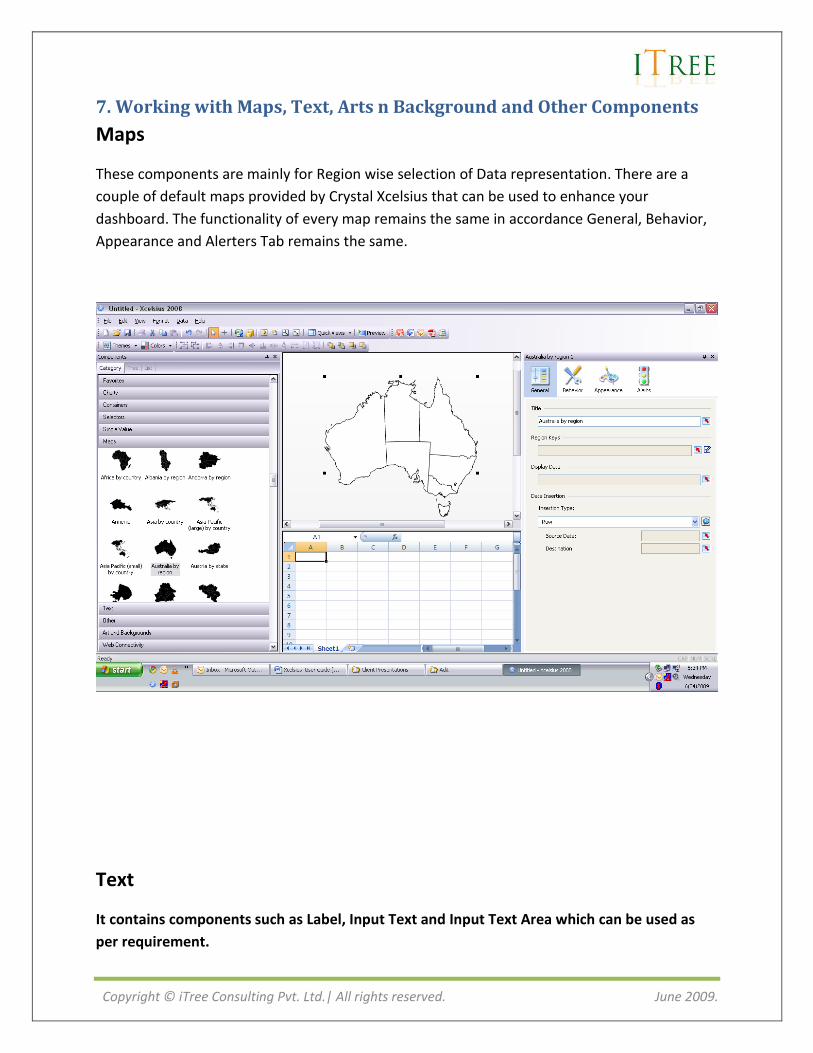
7. Working with Maps, Text, Arts n Background and Other Components
Maps
These components are mainly for Region wise selection of Data representation. There are a
couple of default maps provided by Crystal Xcelsius that can be used to enhance your
dashboard. The functionality of every map remains the same in accordance General, Behavior,
Appearance and Alerters Tab remains the same.
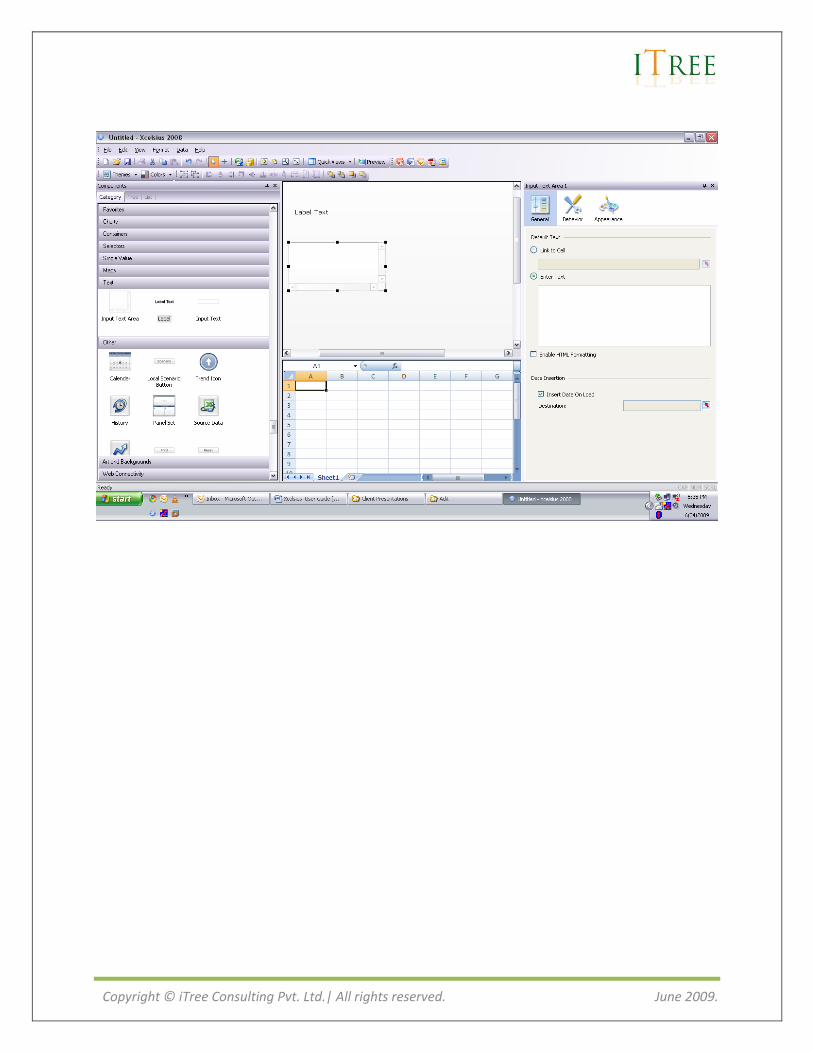
Text
It contains components such as Label, Input Text and Input Text Area which can be used as
per requirement.
Copyright © iTree Consulting Pvt. Ltd.| All rights reserved. June 2009.
Copyright © iTree Consulting Pvt. Ltd.| All rights reserved. June 2009.
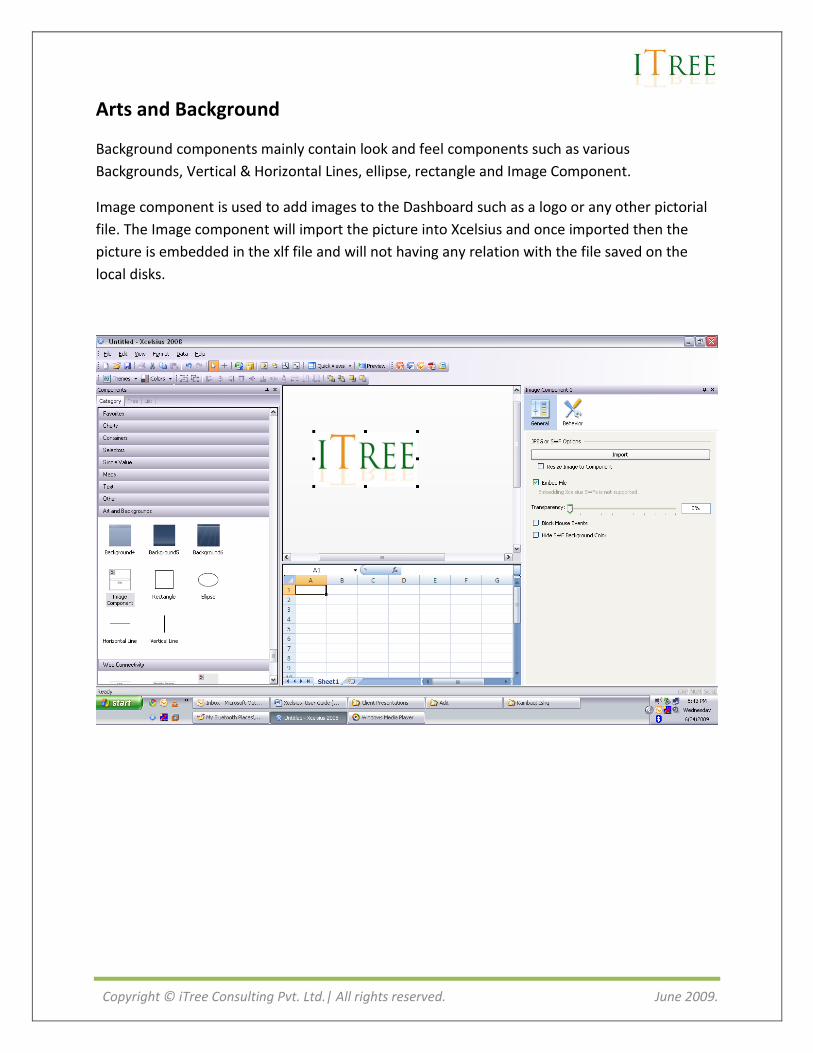
Arts and Background
Background components mainly contain look and feel components such as various
Backgrounds, Vertical & Horizontal Lines, ellipse, rectangle and Image Component.
Image component is used to add images to the Dashboard such as a logo or any other pictorial
file. The Image component will import the picture into Xcelsius and once imported then the
picture is embedded in the xlf file and will not having any relation with the file saved on the
local disks.
Copyright © iTree Consulting Pvt. Ltd.| All rights reserved. June 2009.
8. Other Components Other components contain many important components that can be used in various scenarios
according to the needs and requirement of the users. Every component has a distinct
functionality catering to the requirement.
1. Calendar
2. Local Scenario Button
3. Trend Icon
4. History
5. Panel Set
6. Source Data
7. Trend Analyzer
8. Print Button
9. Reset Button
10. Grid
Calendar:
It can be used in day to day activity.
Components Others Calendars.
Data insertion: Use the options in this section to define how the Calendar component will
behave when a selection is made.
Insert Type: Use this option to specify the type of data (Day or Date) that is inserted when a
selection is made.
Destination: Use this option to select the cell into which the Day or Date from the calendar will
be inserted.
Month Destination / Year Destination: Click the cell selector button to select a cell for the
Month and/or Year of the date selected on the Calendar to be inserted into.

Copyright © iTree Consulting Pvt. Ltd.| All rights reserved. June 2009.
Copyright © iTree Consulting Pvt. Ltd.| All rights reserved. June 2009.
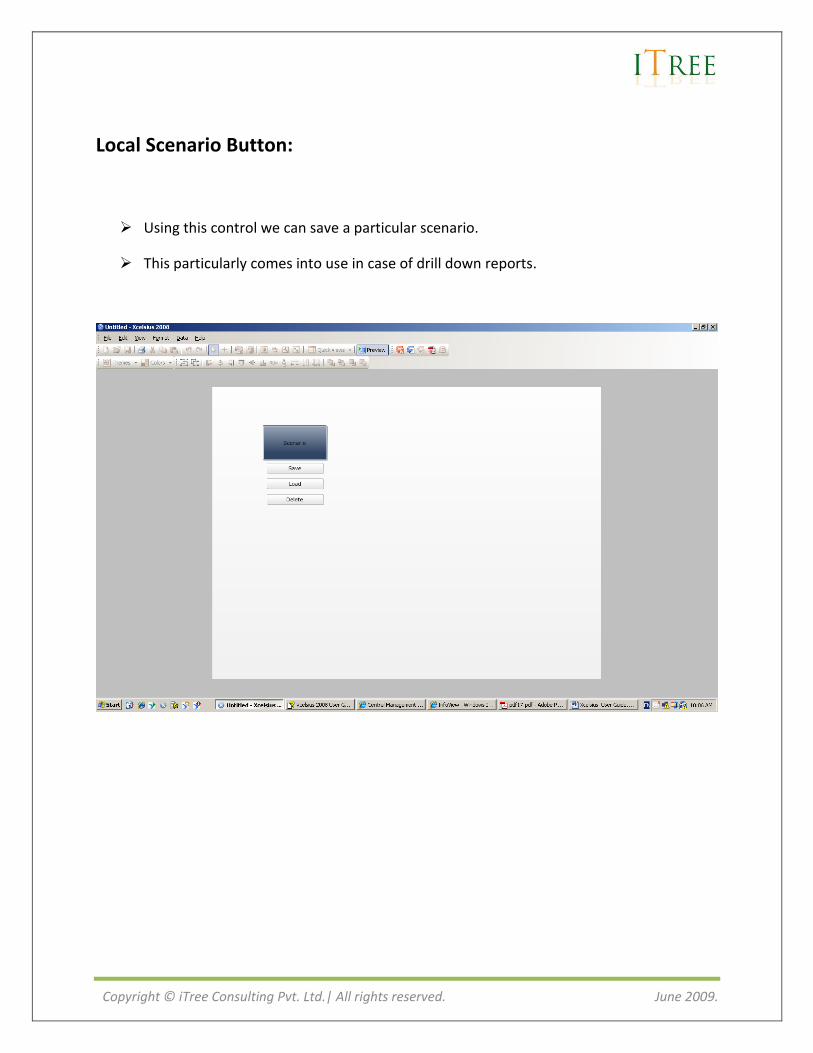
Local Scenario Button:
Using this control we can save a particular scenario.
This particularly comes into use in case of drill down reports.
Copyright © iTree Consulting Pvt. Ltd.| All rights reserved. June 2009.
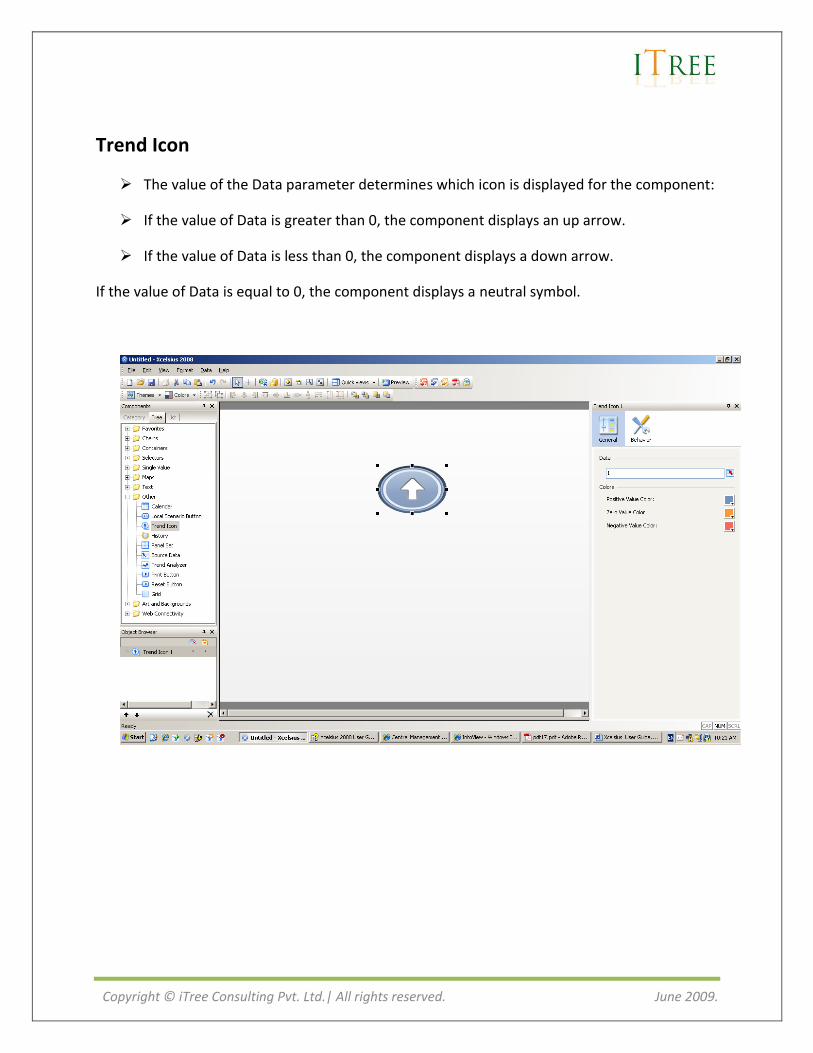
Trend Icon
The value of the Data parameter determines which icon is displayed for the component:
If the value of Data is greater than 0, the component displays an up arrow.
If the value of Data is less than 0, the component displays a down arrow.
If the value of Data is equal to 0, the component displays a neutral symbol.
Copyright © iTree Consulting Pvt. Ltd.| All rights reserved. June 2009.
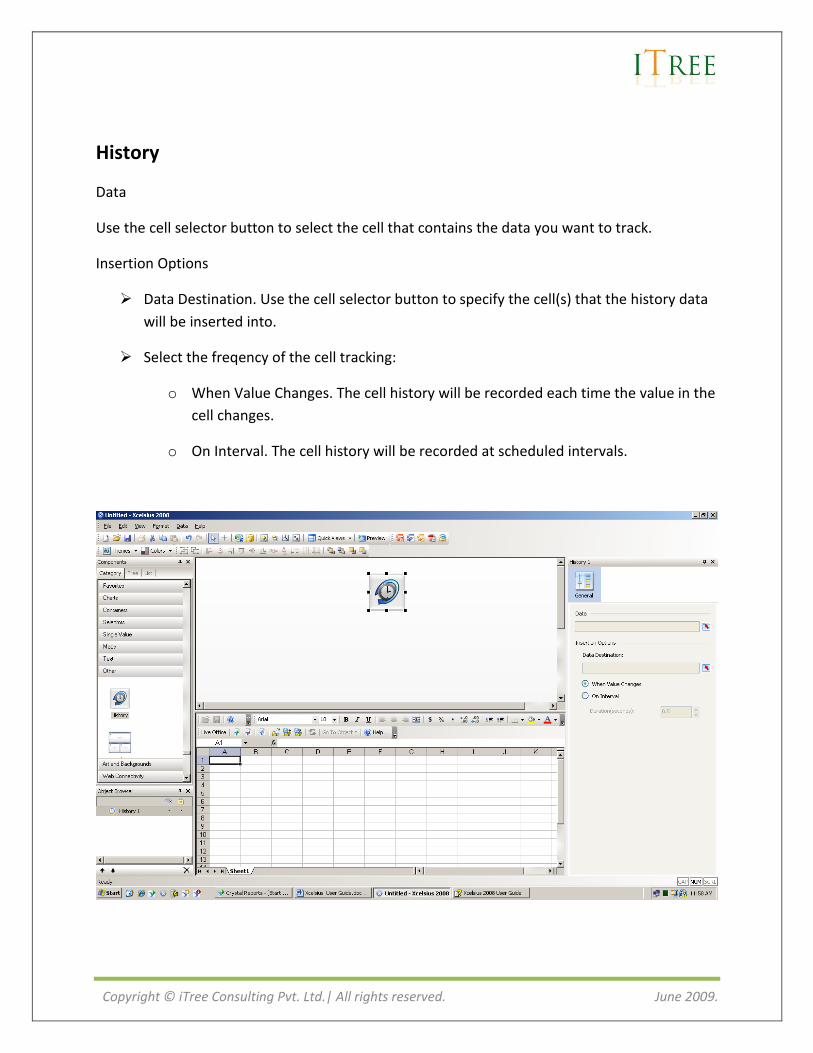
History
Data
Use the cell selector button to select the cell that contains the data you want to track.
Insertion Options
Data Destination. Use the cell selector button to specify the cell(s) that the history data
will be inserted into.
Select the freqency of the cell tracking:
o When Value Changes. The cell history will be recorded each time the value in the
cell changes.
o On Interval. The cell history will be recorded at scheduled intervals.
Copyright © iTree Consulting Pvt. Ltd.| All rights reserved. June 2009.
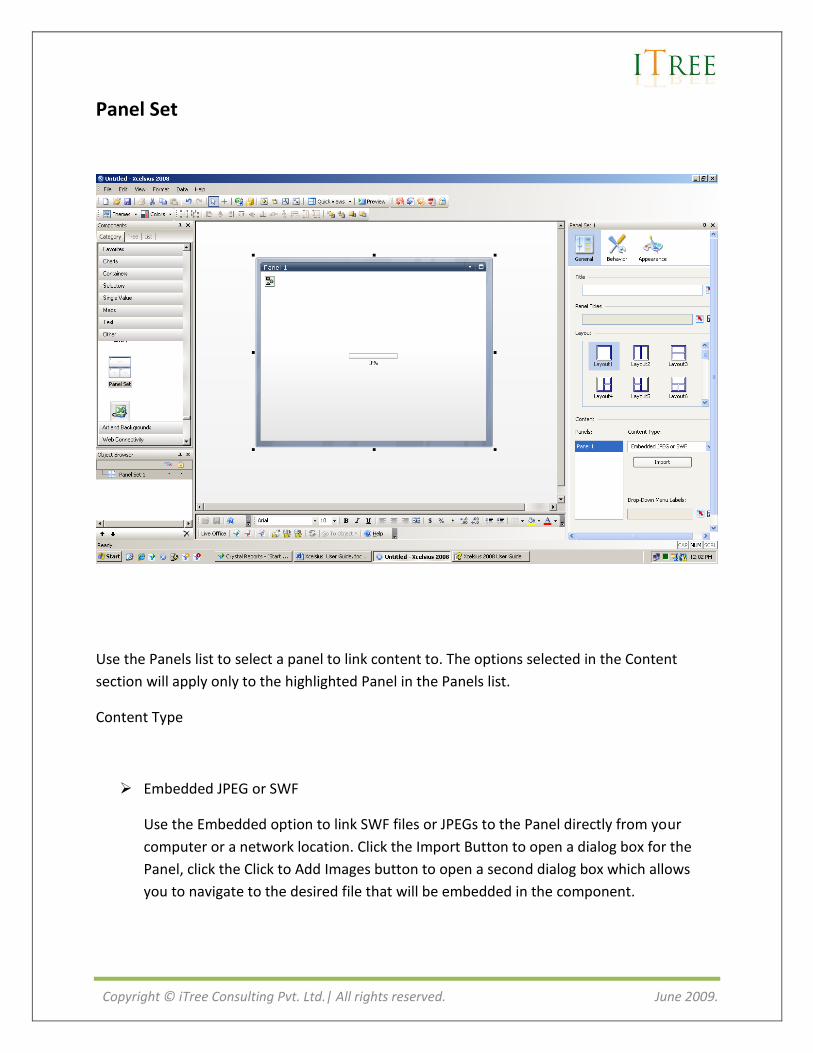
Panel Set
Use the Panels list to select a panel to link content to. The options selected in the Content
section will apply only to the highlighted Panel in the Panels list.
Content Type
Embedded JPEG or SWF
Use the Embedded option to link SWF files or JPEGs to the Panel directly from your
computer or a network location. Click the Import Button to open a dialog box for the
Panel, click the Click to Add Images button to open a second dialog box which allows
you to navigate to the desired file that will be embedded in the component.
Copyright © iTree Consulting Pvt. Ltd.| All rights reserved. June 2009.
By URL
Use the By URL option to enter the URL location for the JPEG or SWF files that you want
to link to the panel.
The URLs box is only available if the Content Type selected is By URL. You can use the
manual edit button or the cell selector button to point the component to one or more
URLs. Click the manual edit button to type in the URLs manually. Click the cell selector
button to link the URLs to cells in the spreadsheet.
None
Use this option to leave the selected panel empty.
Drop-Down Menu Labels
Use Drop-Down Menu Labels to add labels to the content in the selected Panel. If you
use the manual edit button you can type in the labels manually. If you select the cell
selector button, you can link the labels to cells in your spreadsheet.
Copyright © iTree Consulting Pvt. Ltd.| All rights reserved. June 2009.
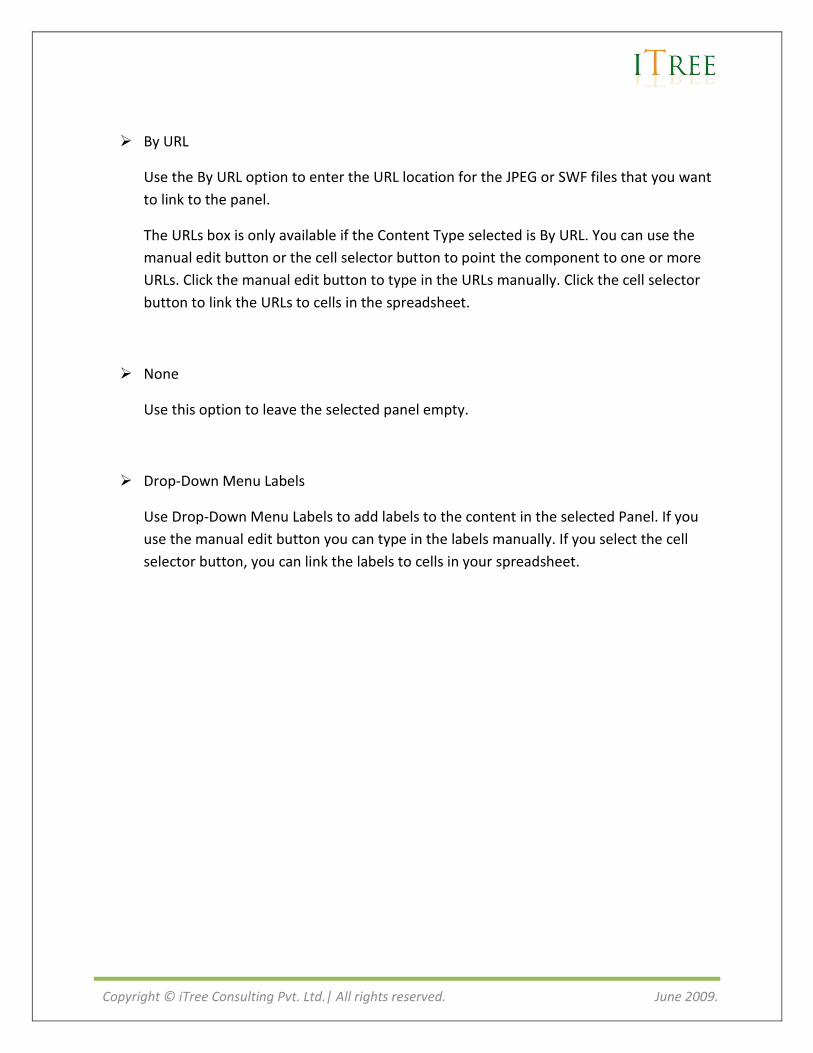
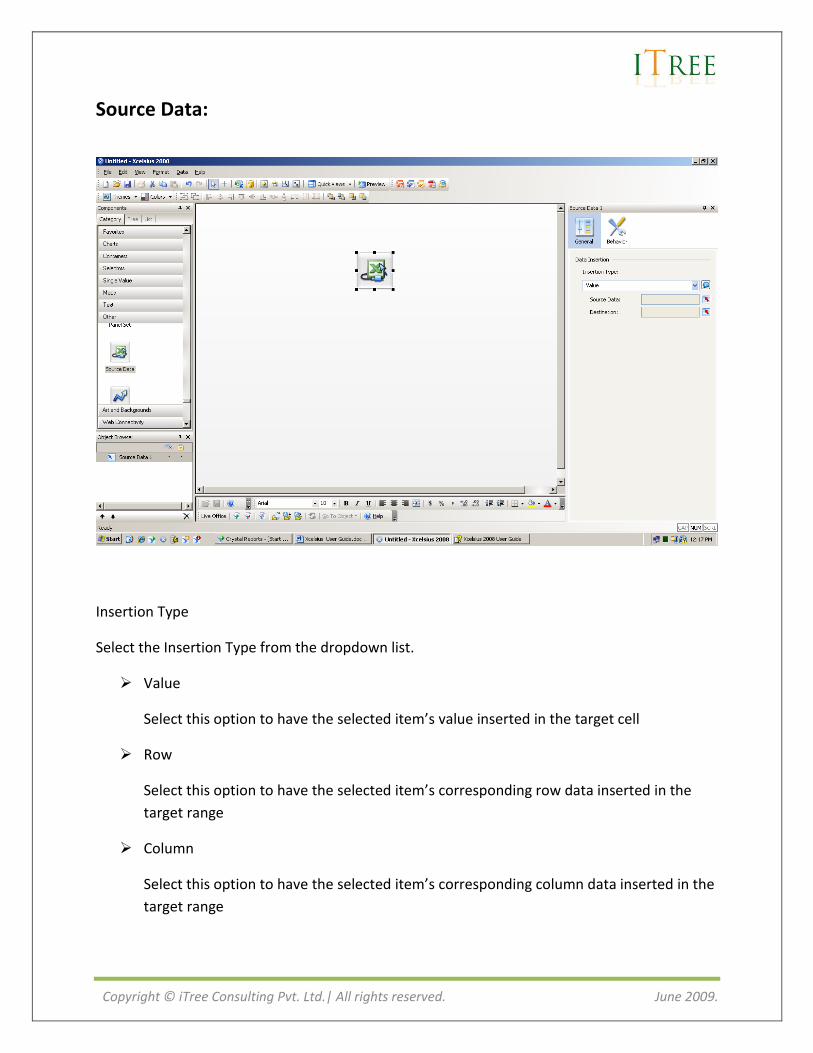
Source Data:
Insertion Type
Select the Insertion Type from the dropdown list.
Value
Select this option to have the selected item’s value inserted in the target cell
Row
Select this option to have the selected item’s corresponding row data inserted in the
target range
Column
Select this option to have the selected item’s corresponding column data inserted in the
target range
Copyright © iTree Consulting Pvt. Ltd.| All rights reserved. June 2009.
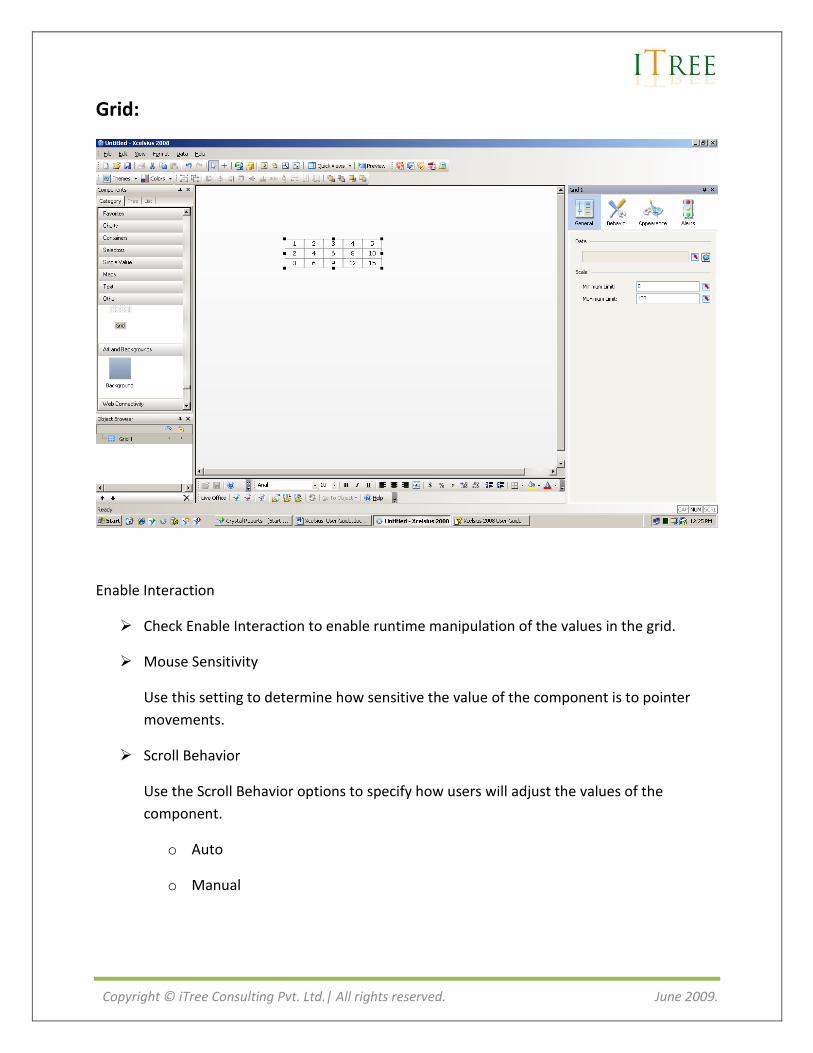
Grid:
Enable Interaction
Check Enable Interaction to enable runtime manipulation of the values in the grid.
Mouse Sensitivity
Use this setting to determine how sensitive the value of the component is to pointer
movements.
Scroll Behavior
Use the Scroll Behavior options to specify how users will adjust the values of the
component.
o Auto
o Manual
Copyright © iTree Consulting Pvt. Ltd.| All rights reserved. June 2009.
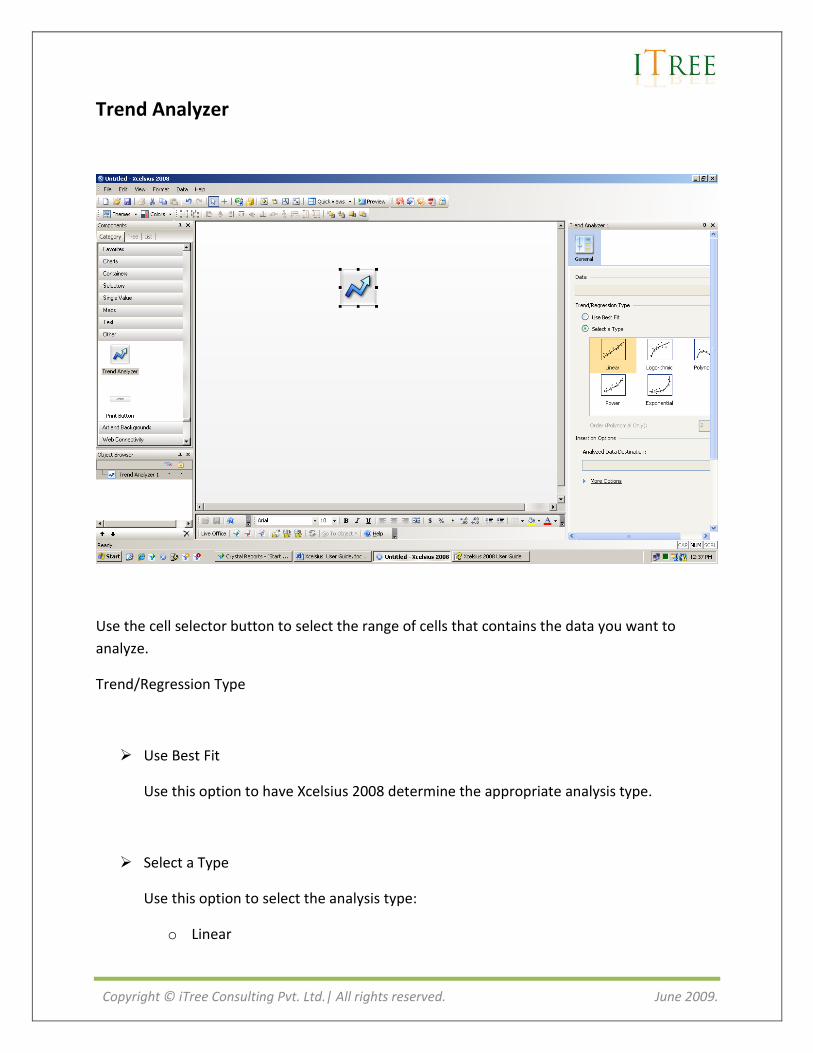
Trend Analyzer
Use the cell selector button to select the range of cells that contains the data you want to
analyze.
Trend/Regression Type
Use Best Fit
Use this option to have Xcelsius 2008 determine the appropriate analysis type.
Select a Type
Use this option to select the analysis type:
o Linear
Copyright © iTree Consulting Pvt. Ltd.| All rights reserved. June 2009.
o Logarithmic
o Polynomial
o Power
o Exponential
o Order
This option is only available when the Trend Type: Polynomial is selected.
Insertion Options
Analyzed Data Destination
Use the cell selector button to select the spreadsheet destination range for the analyzed
data. The spreadsheet cells must be empty.
More Options
Use these options to insert additional analysis information in the spreadsheet
Copyright © iTree Consulting Pvt. Ltd.| All rights reserved. June 2009.
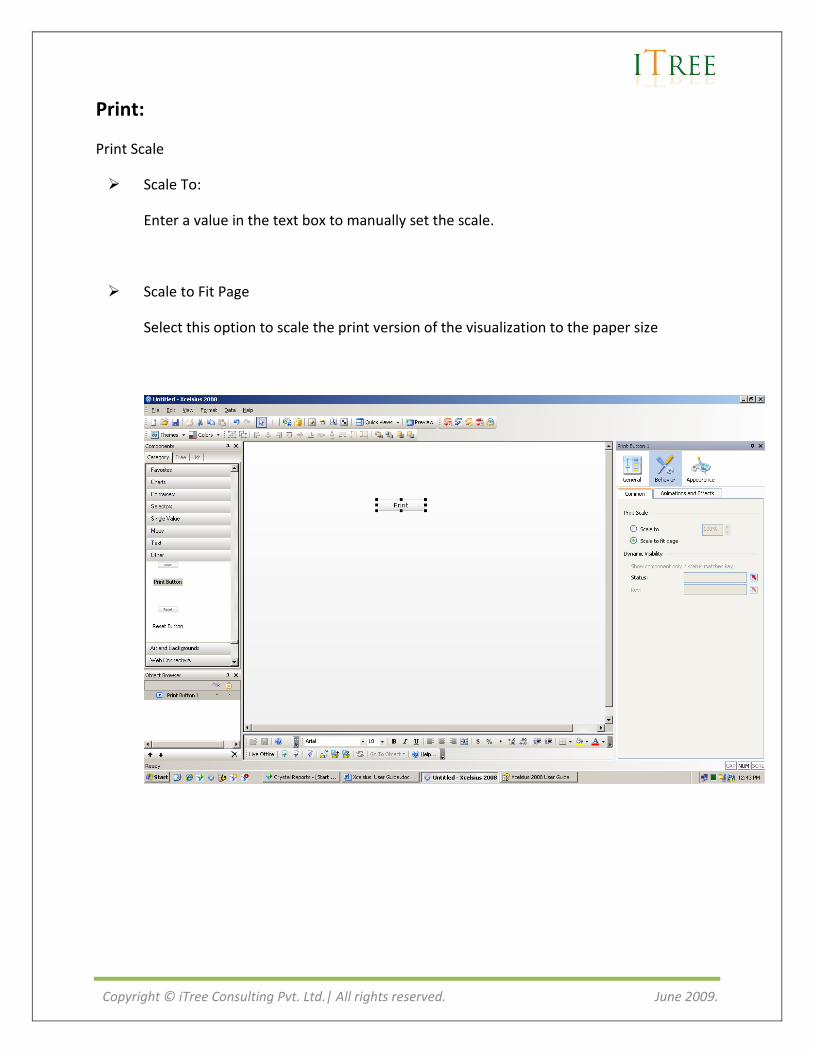
Print:
Print Scale
Scale To:
Enter a value in the text box to manually set the scale.
Scale to Fit Page
Select this option to scale the print version of the visualization to the paper size
Copyright © iTree Consulting Pvt. Ltd.| All rights reserved. June 2009.
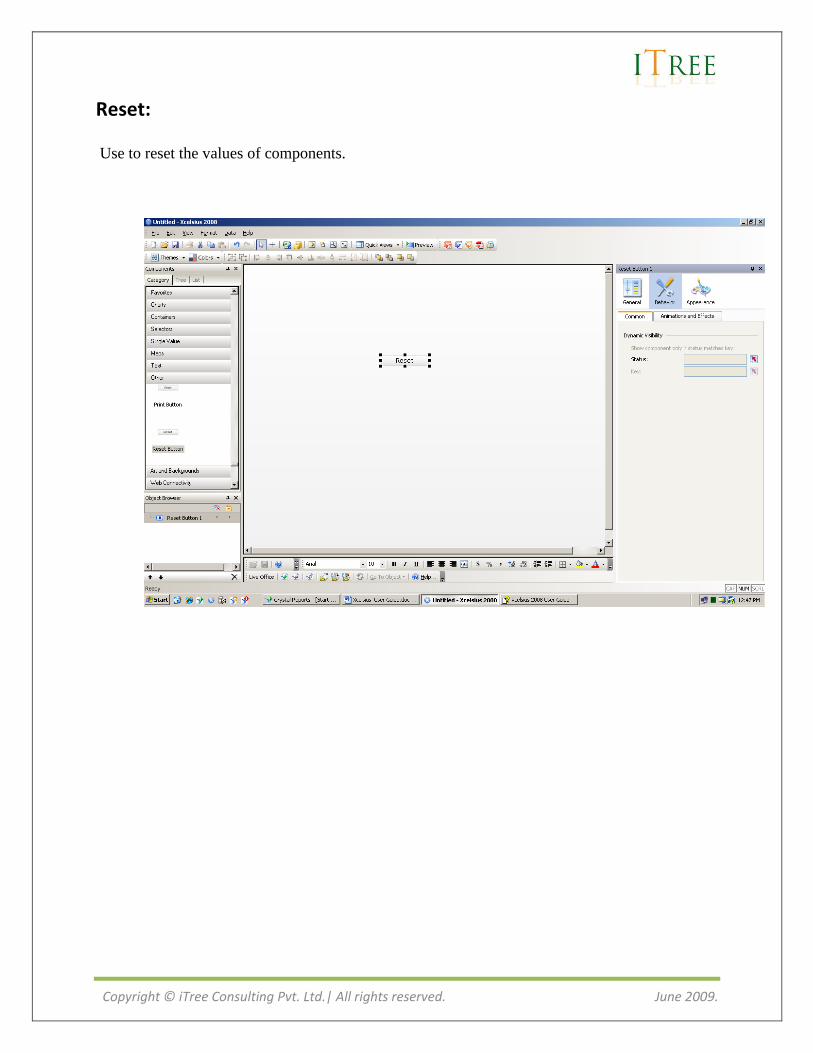
Reset:
Use to reset the values of components.
Copyright © iTree Consulting Pvt. Ltd.| All rights reserved. June 2009.
9. Working with Live Office
How to Use Live Office
Overview:
With Business Objects Live Office you can import data from Crystal reports, OLAP reports, and
Business Views into Microsoft Office. This process is known as inserting a View. The source
Crystal reports, OLAP Intelligence reports, and Business Views must already be published to
Business Objects Enterprise. To import data, you must have the appropriate rights for the
published objects.
Logging on to the Business Objects Enterprise
Go to Live Office OptionsEnterprise Tab
User Name Password Web Service URL: http://severname:portno/ dswsbobje/services/session System Authentication
Click Log On.
Copyright © iTree Consulting Pvt. Ltd.| All rights reserved. June 2009.
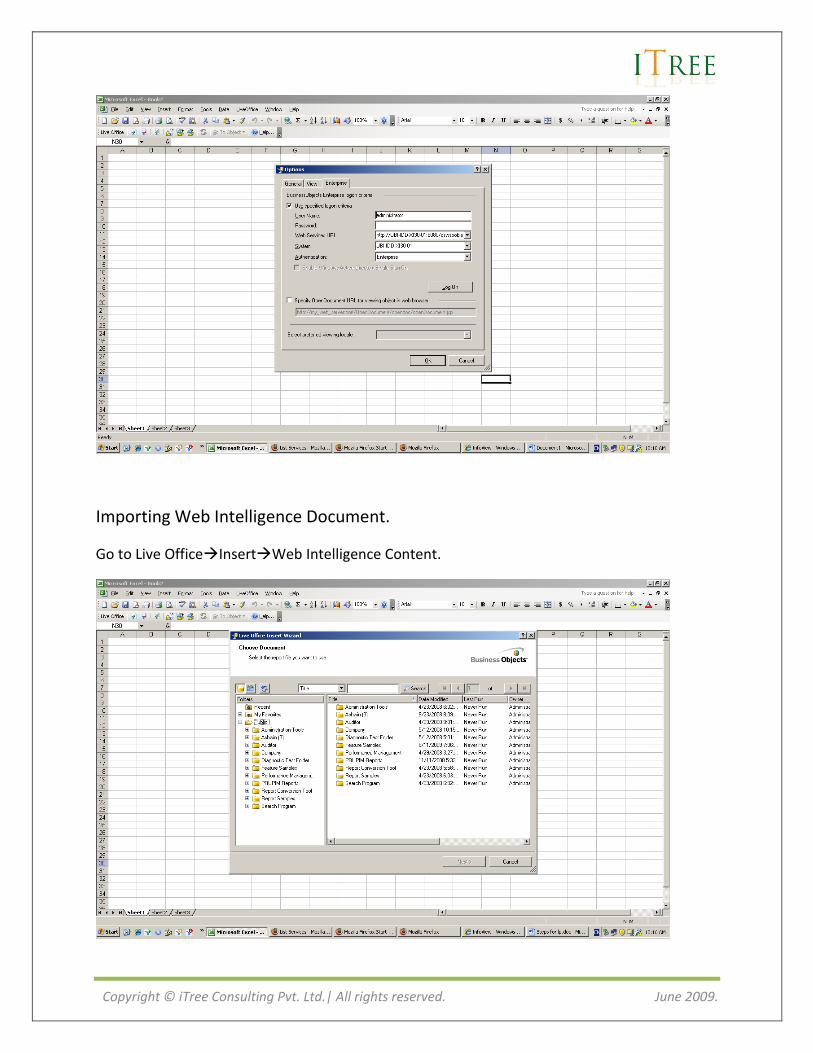
Importing Web Intelligence Document.
Go to Live OfficeInsertWeb Intelligence Content.
Copyright © iTree Consulting Pvt. Ltd.| All rights reserved. June 2009.
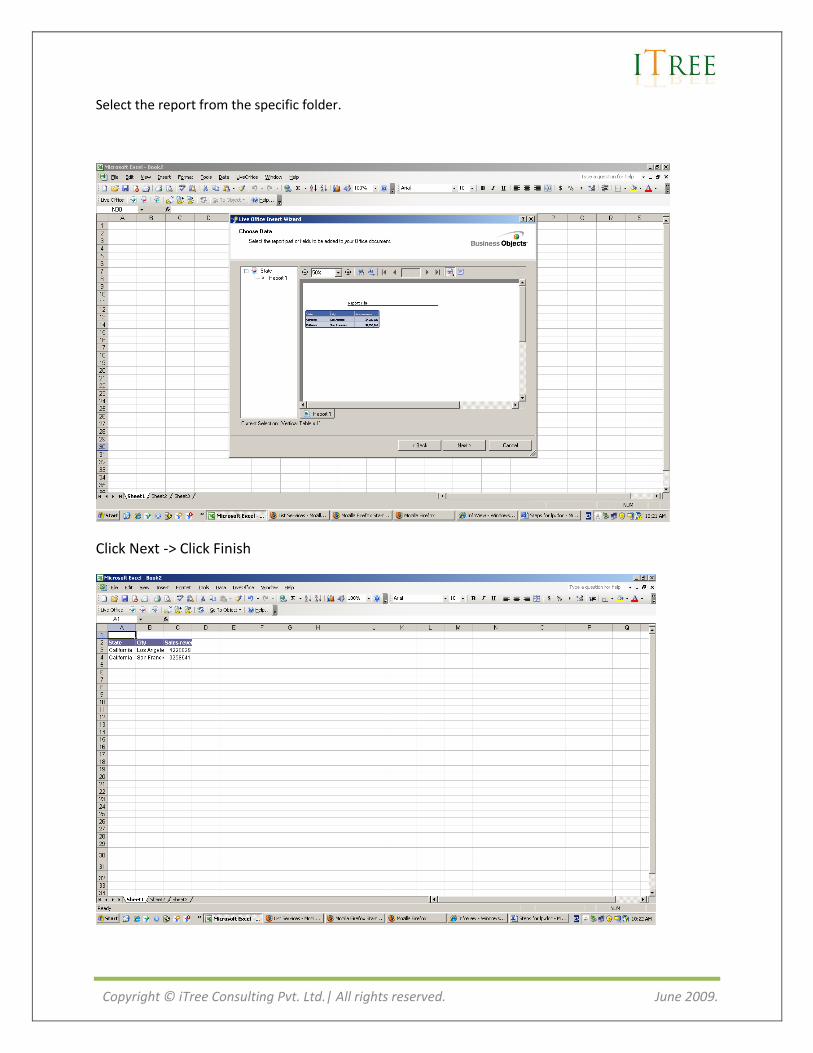
Select the report from the specific folder.
Click Next -> Click Finish
Copyright © iTree Consulting Pvt. Ltd.| All rights reserved. June 2009.
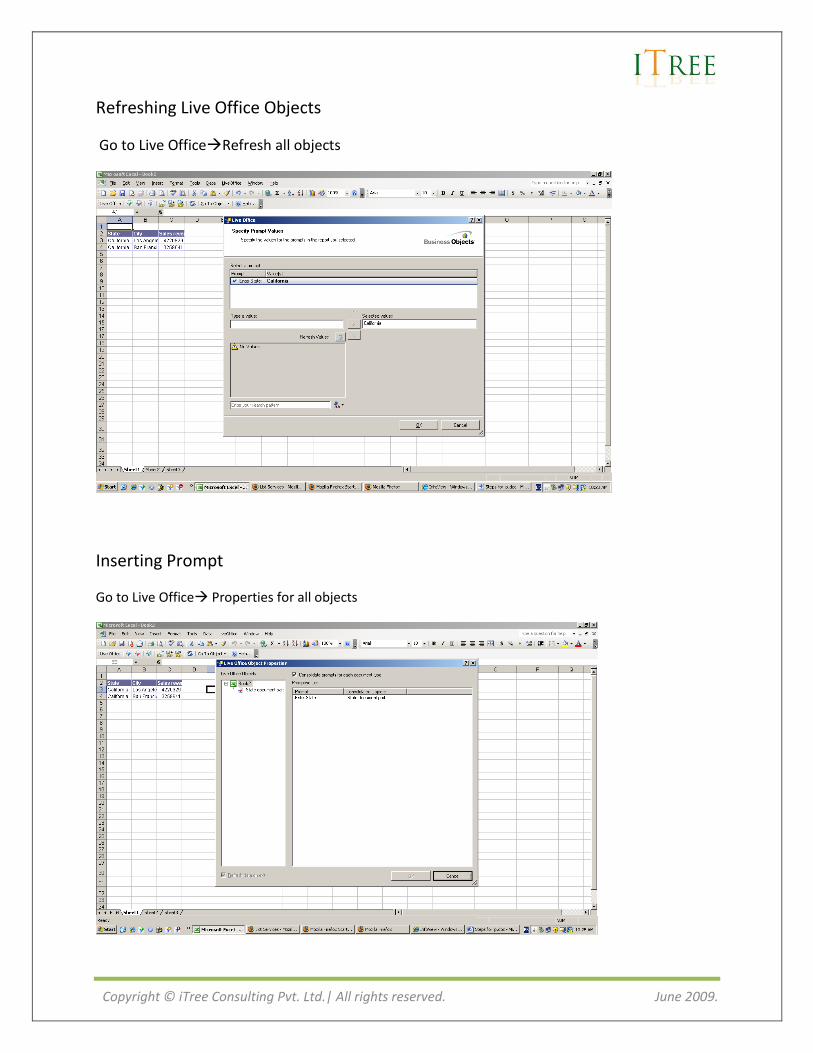
Refreshing Live Office Objects
Go to Live OfficeRefresh all objects
Inserting Prompt
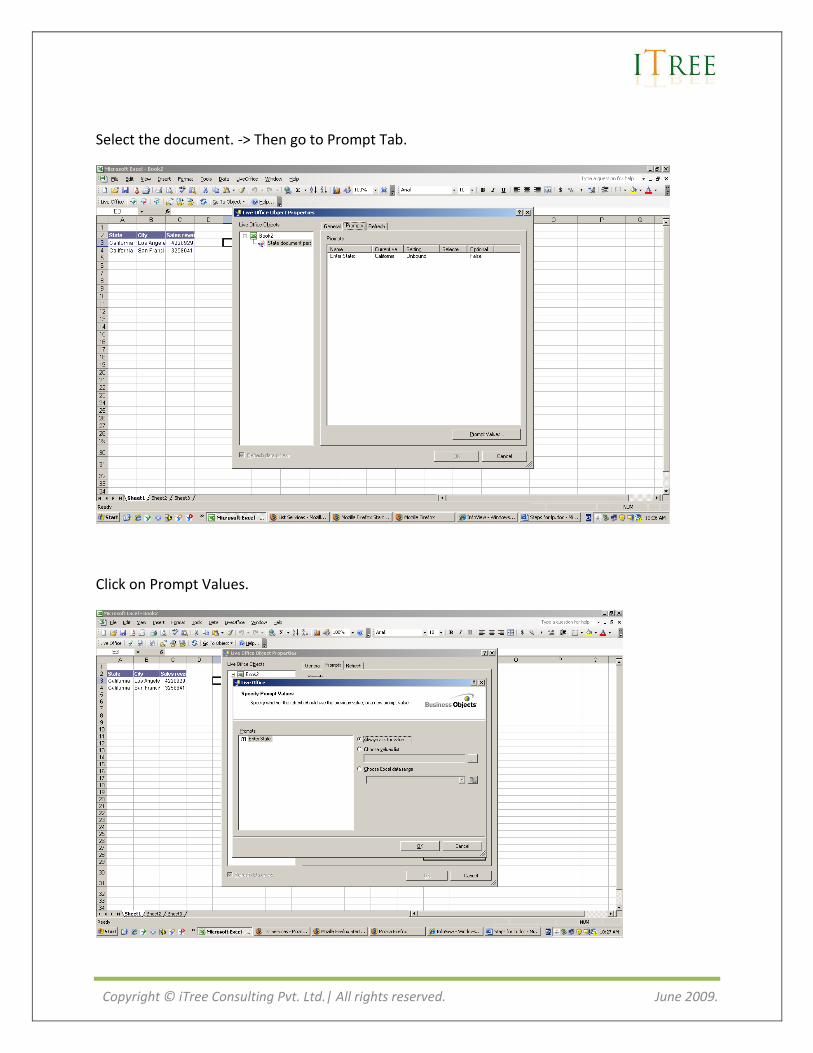
Go to Live Office Properties for all objects
Copyright © iTree Consulting Pvt. Ltd.| All rights reserved. June 2009.
Select the document. -> Then go to Prompt Tab.
Click on Prompt Values.
Copyright © iTree Consulting Pvt. Ltd.| All rights reserved. June 2009.
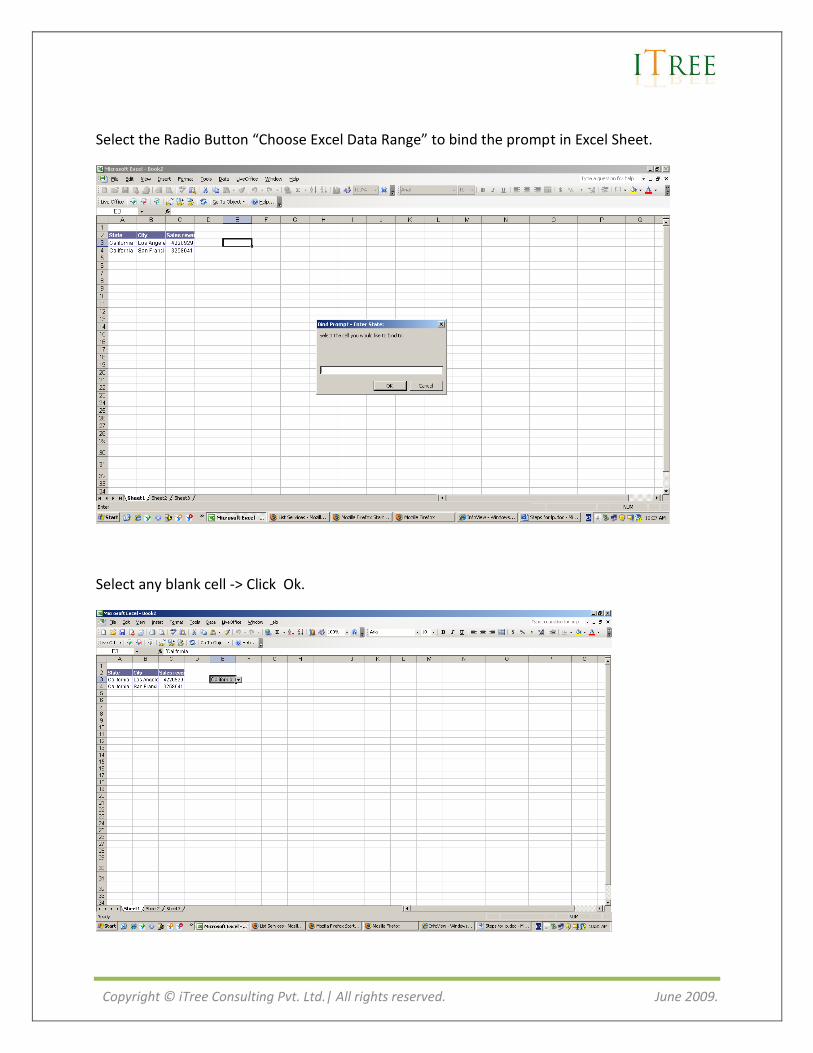
Select the Radio Button “Choose Excel Data Range” to bind the prompt in Excel Sheet.
Select any blank cell -> Click Ok.
Copyright © iTree Consulting Pvt. Ltd.| All rights reserved. June 2009.
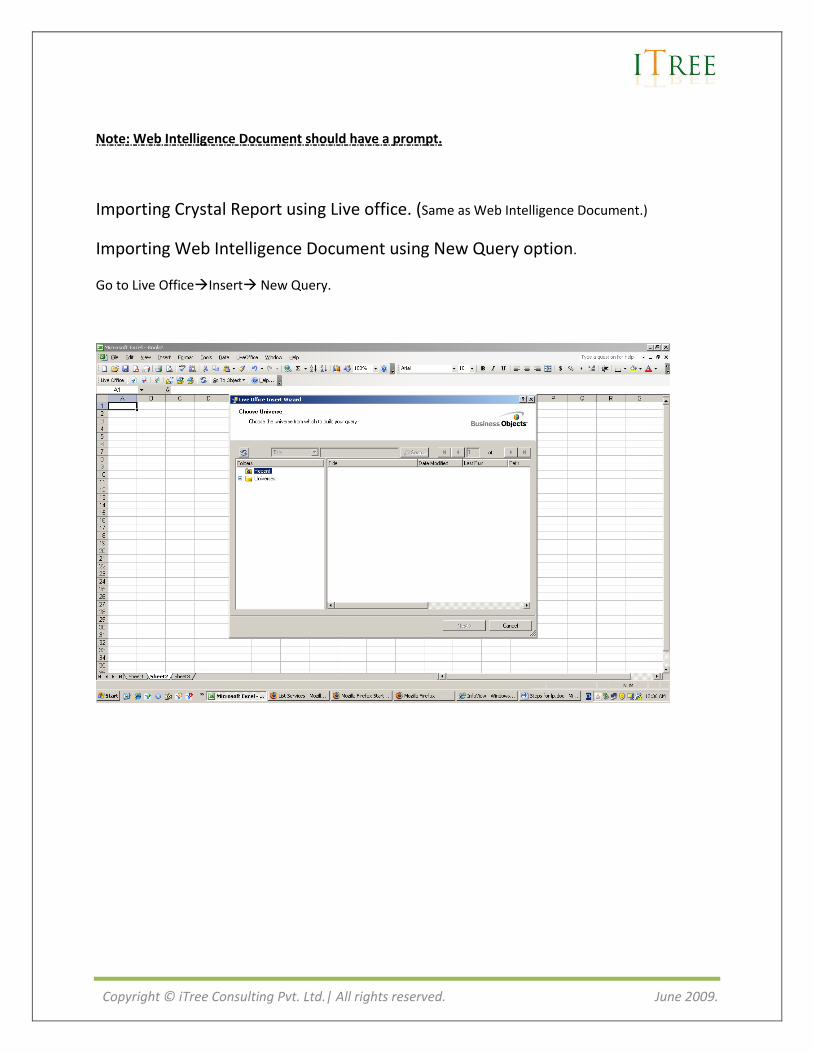
Note: Web Intelligence Document should have a prompt.
Importing Crystal Report using Live office. (Same as Web Intelligence Document.)
Importing Web Intelligence Document using New Query option.
Go to Live OfficeInsert New Query.
Copyright © iTree Consulting Pvt. Ltd.| All rights reserved. June 2009.
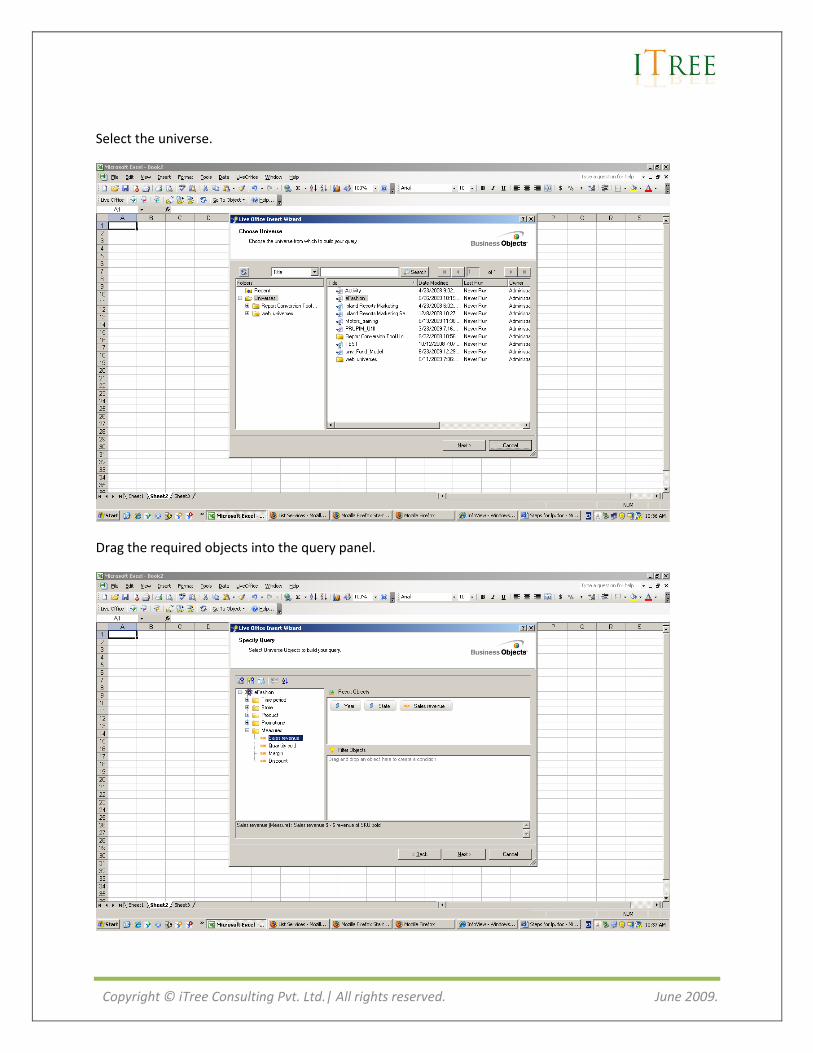
Select the universe.
Drag the required objects into the query panel.
Copyright © iTree Consulting Pvt. Ltd.| All rights reserved. June 2009.
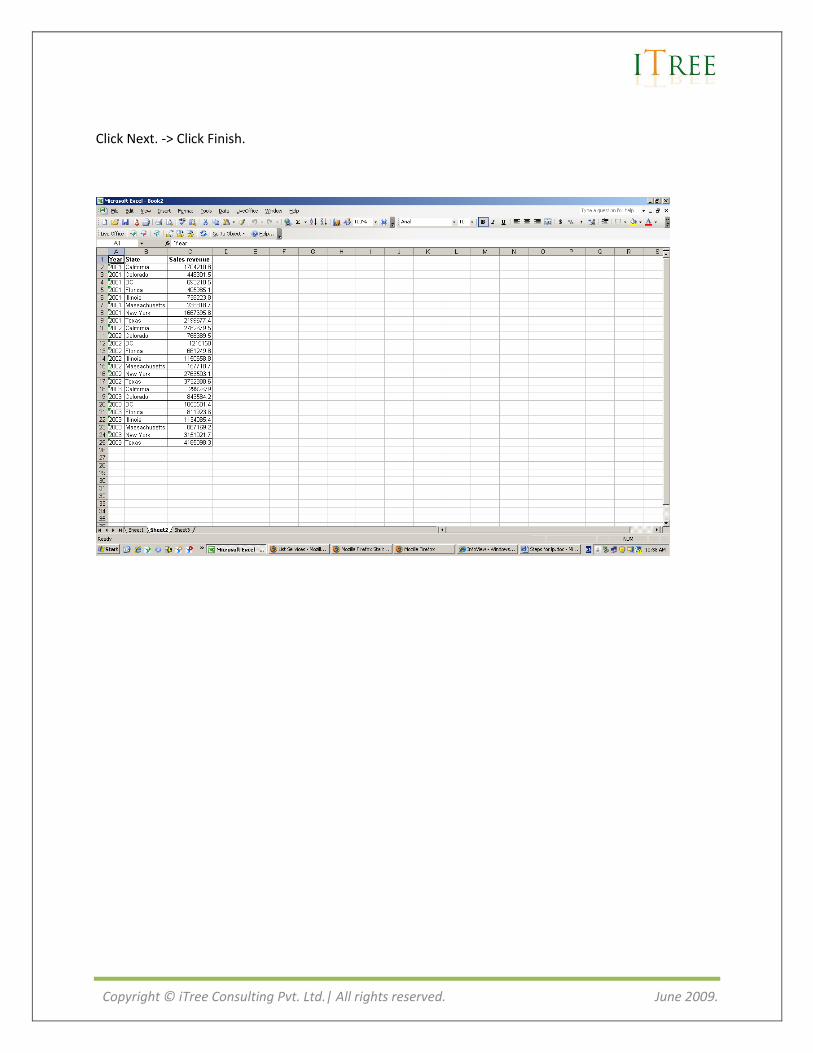
Click Next. -> Click Finish.


