This material was produced from a microfilm copy of the original document. While the most advanced technological means to photograph and reproduce this document
have been used, the quality is heavily dependent upon the quality of the original submitted.
The following explanation of techniques is provided to help you understand markings or patterns which may appear on this reproduction.
1. The sign or "target" for pages apparently lacking from the document photographed is "Missing Page(s)". If it was possible to obtain the missing page(s) or section, they are spliced into the film along with adjacent pages. This may have necessitated cutting thru an image and duplicating adjacent pages to insure you complete continuity.
2. When an image on the film is obliterated with a large round black mark, it is an indication that the photographer suspected that the copy may have moved during exposure and thus cause a blurred image. You will find a good image of the page in the adjacent frame.
3. When a map, drawing or chart, etc., was part of the material being photographed the photographer followed a definite method in "sectioning" the material. It is customary to begin photoing at the upper
left hand corner of a large sheet and to continue photoing from left to right in equal sections with a small overlap. If necessary, sectioning is continued again — beginning below the first row and continuing on until complete.
4. The majority of users indicate that the textual content is of greatest value,
however, a somewhat higher quality reproduction could be made from "photographs" if essential to the understanding of the dissertation. Silver prints of "photographs" may be ordered at additional charge by writing the Order Department, giving the catalog number, title, author and specific pages you wish reproduced.
5. PLEASE NOTE: Some pages may have indistinct print. Filmed as received.
Xerox University Microfilms 300 North Zeeb Road Ann Arbor, Michigan 40106
76-29,347
YOUNG, Veronica Marie Ladensack, 1948-THE IN VITRO EFFECTS OF ETHYL METHANESULFONATE ON HUMAN LYMPHOCYTE CHROMOSOMES.
The University of Arizona, Ph.D., 1976 Genetics
Xerox University Microfilms, Ann Arbor, Michigan 48106
In Partial Fulfillment of the Requirements For the Degree of
DOCTOR OF PHILOSOPHY
In the Graduate College
THE UNIVERSITY OF ARIZONA
19 7 6
Copyright 1976 Veronica Marie Ladensack Young
THE UNIVERSITY OF ARIZONA
GRADUATE COLLEGE
I hereby recommend that this dissertation prepared under my
direction by Veronica Marin Ladensack Yonng
entitled THE VITRO EFFECTS OF ETHYL METHANESULFONATE
ON HUMAN LYMPHOCYTE CHROMOSOMES
be accepted as fulfilling the dissertation requirement of the
degree of Doctor of Philosophy
Dissertation Director Date <=>/
After inspection of the final copy of the dissertation, the
following members of the Final Examination Committee concur in
its approval and recommend its acceptance:-
/
s
^h{ <*+1. f9 -76 —* /
This approval and acceptance is contingent on the candidate's adequate performance and defense of this dissertation at the final oral examination. The inclusion of this sheet bound into the library copy of the dissertation is evidence of satisfactory performance at the final examination.
STATEMENT BY AUTHOR
This dissertation has been submitted in partial fulfillment of requirements for an advanced degree at The University of Arizona and is deposited in the University Library to be made available to borrowers under rules of the Library.
Brief quotations from this dissertation are allowable without special permission, provided that accurate acknowledgment of source is made. Requests for permission for extended quotation from or reproduction of this manuscript in whole or in part may be granted by the copyright holder.
SIGNED: t I '.III
—
DEDICATION
To my mother, Regina Mary, my brother, Robert
Joseph, and to my daughter, Katherine Marie.
iii
ACKNOWLEDGMENTS
I would like to acknowledge the guidance and in
struction of my committee members: Drs. John Davis,
Ivan Lytle, Arlene Putt, Karen Sechrist, and my major
professor, Oscar Ward.
Joseph and Regina Ladensack, my parents, deserve
special praise for their uncompromising love and patience
Joseph, Robert, Carl, Alvin, Gerard, Chris, Mary, and
Paul, my brothers and sister, gave me laughter and com
panionship. My husband, Jim, and Katherine, our daughter
share my life and love.
Special thanks go to Ed Lavor and Roy Whitehead,
for advice and technical equipment.
Dr. Robert Harris deserves praise for encouraging
"nurses".
I would like to especially thank Dr. Marie
Bourgeois, R. N., Ph. D. who guided my graduate program.
I gratefully acknowledge the support from the
Special Predoctoral Nursing Research Fellowship, granted
by the Public Health Service, National Institutes of
Health, which made possible my graduate studies.
iv
V
Finally, I would like to thank Chere Crandall
for her friendship and help during the preparation of
this manuscript.
TABLE OF CONTENTS
Page
LIST OF ILLUSTRATIONS viii
LIST OF TABLES ix
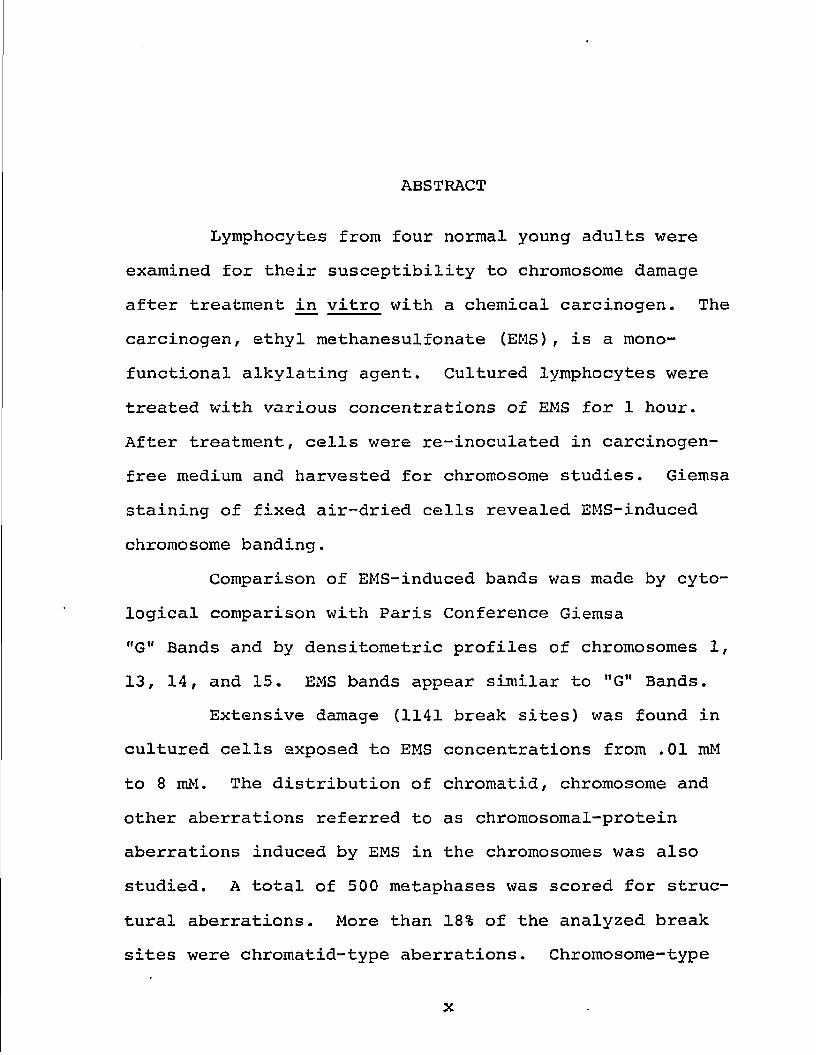
ABSTRACT X
1. INTRODUCTION 1
General Literature Review 1 Molecular Activity of EMS 3 DNA Instability After Alkylation 5 EMS-Induced Chromosome Banding 6 Clinical Significance of EMS 6
2. METHODS AND MATERIALS 9
Literature Review 9 Cell Cycle of Human Lymphocytes
in vitro 11 General Materials 12
Tissue Culture Media 12 Other Chemicals 13 Equipment . 13
methyl sulfonic acid and ethyl alcohol. Pseudo-first order
kinetics for this hydrolysis reaction have been reported
(Froese-Gertzen et al. 1963) and reaction rate constants
appear in a current review by Lawley (1974).
In general, alkylating agents are electrophilic
reactants capable of transferring alkyl groups to electron
dense (nucleophilic) sites in other molecules. In the case
of EMS-induced alkylation of deoxyribonucleic acid (DNA)
4
an ethyl groups is added to one or more sites within DNA.
The primary alkylation sites in the purine bases are the
nitrogen-7 and nitrogen-3 atoms of guanine, and the nitrogen-
3 and nitrogen-1 atoms of adenine. The phosphate and sugar
backbone of DNA may also be alkylated by EMS (Ehling et al.
1968; Natarajan and Upadhya 1964).
Amino acids also contain many nucleophilic centers:
the imidiazole groups, amino groups, and the guanidium
groups. As amino acids determine the primary structure of
proteins, EMS undoubtedly alkylates proteins, although
reports of such effects in the literature are meager.
A study by Engle (1972) bears on this subject.
After treatment of Vicia faba embryos with tritium-
labelled EMS, nuclear proteins were extracted and analyzed
for radioactivity. The radioactive label was found as
sociated with several of the histone fractions and, in
addition, with non-histone proteins. The non-histones
(acidic proteins) have recently been suggested to play a
role in gene-derepression (Stein, Spelsberg, and Kleinsmith
1974). Because nucleoproteins are also concerned with the
maintenance of chromosome ultrastructure, alterations of
chromosomal proteins may modify the chromosome and enhance
mutagenesis.
5
DNA Instability After Alkylation
Alkylation of the nucleic acid bases has been
postulated to weaken the beta-glycosidic bond resulting
in depurination, or loss of the 7-ethyl guanine (Freese
1961). The proposed genetic consequences of depurination
and gap production in DNA are: (1) any of the four bases
of DNA may be incorporated into the gap, resulting in a
transition, a transversion, or in the restoration of the
original base-pair sequence (Bautz and Freese 1960)
(2) single base-deletions may result (Krieg 1963) ; and (3)
scission of the DNA chain may take place {Brookes and
Lawley 1961). Lawley (1974) suggested that alkylation of
DNA bases could be responsible for DNA inactivation.
Although no mechanism for DNA inactivation was proposed,
it is conceivable that the alkylated DNA might fail to
bind with polymerases.
If the 7-ethyl guanine is not removed, transitions
can also be obtained. In this case, alkylated guanine
pairs with thymine instead of its normal pairing mate,
cytosine and miscoding then results in a guanine-cytosine
(G-C) to adenine-thymine (A-T) transition.
The instability of DNA after EMS treatment has
lead to much speculation about chromosome breakage being
correlated with DNA damage.
6
EMS-Induced Chromosome Banding
Early in this investigation treated chromosomes
were found to display banding patterns (Ward and Young
1974). Production of EMS bands was confirmed with in vivo
studies on rodents (Kitchin and Loudenslager 1976).
Chromosome banding has been reported for several chemicals
by treating cells in culture prior to fixation {Hsu, Pathak
and Shafer 1973).
Clinical Significance of EMS
EMS has not been applied to humans clinically,
but its sister-sulfonic ester, myleran has been used.
Myleran, a double molecule of EMS, has been widely used as
a chemotherapeutic agent in the treatment of leukemias
in man, particularly the granulocytic, lymphatic and
myelocytic forms. It is not a curative agent, but is used
to control the clinical manifestations of leukemia (elevated
white blood cell count) and hopefully prolong life.
Myleran is however, a bifunctional alkylating
agent, while EMS is a monofunctional agent. Therefore
variation in toxicity, as well as DNA inactivation may be
expected when comparing EMS and myleran. For example,
myleran is reported to be 50 times more active than EMS
tRieger and Michaelis 1960). Other mono- and bifunctional
alkylating analogues reveal similar variations.
7
Dangerous side effects of myleran have been re
ported, and include bone marrow depression, hemorrhage,
and pulmonary fibrosis. Complications of myleran treatment
and alkylating agents in general have been documented
(Krakoff 1971).
The number of chemotherapeutic agents in the treat
ment of cancer has been growing rapidly in recent years
(Kaplan and Rosenberg 1975). Alkylating agents are among
the most powerful chemicals used in man, but significantly
the sites of major toxicity of these agents are not all
the same. Most are myelotoxic and some effect primarily
the nervous system or gastrointestinal tract. Investiga
tion of EMS-induced damage of human lymphocyte chromosomes
has implications for the use of its sister compound myleran
in the clinical treatment of leukemias.
Considerations of the foregoing has shown that
ethyl methanesulfonate is a mutagen, carcinogen, anti
cancer agent, reversible sterilant, and is capable of
causing gene or point mutations in progeny. In addition
it induces localized chromosome aberrations. In view of
these actions, this study was undertaken to assess the
effects of EMS on human peripheral lymphocyte chromosomes
in vitro.
8
The major hypothesis was that the alkylating
chemical EMS would induce chromosome aberrations in cul
tured human lymphocyte chromosomes.
Additional hypotheses are: (1) the chromosome
aberrations produced by EMS are non-random in their dis
tribution among the chromosome groups and within chromosome
arms, (2) the specific breaks (non-randomness) are corre
lated with the distribution of the heterochromatic segments
in the genome, (3) the specific breaks are correlated with
the distribution of the Giemsa "G" Bands of the Paris
Conference (1971), and (4) the EMS-induced chromosome band
patterns are similar if not identical to Giemsa "G" Bands.
CHAPTER 2
METHODS AND MATERIALS
Literature Review
Human peripheral lymphocytes were chosen as an
in vitro test system for the measurement of the mutagenic
effects of ethyl methanesulfonate. Lymphocytes are ex
tremely sensitive indicators of chromosome structural
changes induced either by in vivo or in vitro means.
Visible changes in chromosome structure offer readily
scored morphological evidence of damaged DNA (Evans and
0'Riordan 1975).
The lymphocyte test system offers several advan
tages: (1) human cells are easily available in a large
number. A few milliliters of peripheral blood can be
easily and repeatedly obtained from an individual, and each
ml of blood contains 1-3 million small lymphocytes; (2)
lymphocytes are distributed throughout the body, circulate
in all tissues and a proportion are long-lived (Barr,
Wang-Peng, and Perry 1975); (3) virtually all the peripheral
blood lymphocytes are a synchronized cell population in
the same Gq or stage of mitotic interphase. In healthy
individuals, these cells are only infrequently involved
9
in mitotic proliferation in vivo (Rasniussen and Painter
1964; Evans and Norman 1968); (4) a proportion of the
lymphocytes can be stimulated by mitogens to undergo
mitosis in culture (Nowell I960; Toms and Western 1971;
Phillips and Roitt 1973; Haber, Rosenau and Goldberg
1972; Forsdyke 1973); (5) numerous techniques are avail
able for making chromosome preparations from lymphocytes
(Moorhead et al. 196 0; Arakaki and Sparkes 1963; Shall
1973); C6) the spontaneous chromosome aberration fre
quency in human peripheral lymphocytes has been reported
to be low (Bender and Brewen 1969; Brogger 1971; Bochkov
1972; Funes-Cravioto et al. 1974); (7) short-term culture
of human peripheral lymphocytes have been standardized
in many laboratories, for DNA synthesis (Bender and
Prescott 1962; Dudin, Beek and Obe 1974; Rasmussen and
Painter 1964), RNA synthesis (Kohler, Karacan and Rennert
1972), and protein synthesis (Shapiro and Levina 1968;
Cave 1966); (8) each individual's blood can serve as its
own control for in vitro tests; and (9) human peripheral
lymphocytes have been reported as a successful test
system to screen mutagens (Beek and Obe 1974; Brewen
and Gengozian 1971; Stefanescu et al. 1972; Holmberg and
Jonasson 1973; Evans and O'Riordan 1975).
11
Cell Cycle of Human Lymphocytes in vitro
It is important to establish the time and length
of the different stages of mitosis in culture, because
marked differences have been reported in their suscepti
bility to chemicals (Chang and Elequin 1967). DNA synthesis
of human peripheral lymphocytes after stimulation by phyto-
hemagglutinin has been reported by several workers (as
mentioned on page 10). DNA replication and transcription
are preceeded by temporary, localized separation from
chromosomal proteins and unwinding of the double strand
(.Richardson 1969) . It is necessary to know when the DNA
synthesis occurs in tissue culture in order to make in
ferences as to the mode of action of a mutagen or clastogen.
Free DNA regions are very susceptible to attack,
and perhaps this is when alkylating agents do the most
damage. Alkylated DNA would probably be less capable of
serving as a template for DNA and RNA synthesis.
DNA synthesis has been reported to range from
12-100 hr for human peripheral lymphocytes in tissue cul
ture, with the mean synthesis of 26 hr, and peaks of DNA
synthesis of 34, 40 and 51 hr (Bender and Prescott 1962;
Dudin et al. 1974). The GQ period is considered the time
between culture initiation and the start of protein syn
thesis , and is around 9 hr in length (Bender and Prescott
1962). The period is pre-DNA synthesis and is situated
12
between protein synthesis and the beginning of DNA syn
thesis. This period is thought to occur 13-24 hr after
culture initiation (Chang and Elequin 1967).
Mitosis is initiated 36 hr after cultures are
started and peaks at 44 and 48 hr; the length of individual
mitosis is anywhere from H to 2h hr. In this stage, the
rate of protein synthesis is at a minimum. RNA synthesis
is limited to early prophase and late telophase (Prescott
1974) .
The G2 stage is post-DNA synthesis. Cells are
still synthesizing RNA and proteins, but not DNA during this
stage. The G£ stage is considered to be constant in mam
malian cells, and has been reported to be h to 1% hr up to
a maximum of 6 hr in length (Ling 1968).
General Materials
The following general materials were used for both
the EMS test groups and the control groups.
Tissue Culture Media
1. Minimal Essential Media with L-glutamine and
25 mM Hepes Buffer for monolayer culture, with Earle1s
salts (Gibco 236); or RPMI (Gibco 1640).
2. Fetal Calf Serum with a final volume of 20%
CGibco 614L).
13
3. Penicillin-Streptomycin (Gibco 507L), the
penicillin was 5 000 jig/ml, and the streptomycin was 5000
mcg/ml. One ml of the penicillin-streptomycin was added
per 100 ml of media.
4. Phytohemagglutinin, M-form, lyophilized
(Burroughs Wellcome R 15-0576). 1.66 ml of PHA per 100 ml
of tissue culture media.
Other Chemicals
1. Minimal essential media with 25 mM Hepes Buffer
for monolayer cultures without glutamine with Hank's salts
(Gibco 237). This was used to wash EMS from treated cul
tures .
2. Sodium heparin 5000 units/ml (Gibco 568).
3. Colcemid 10 mcg/ml (Gibco 521L).
4. 70% ethanol for swabbing skin, in preparation
for intravenous samples of whole blood.
Equipment
1. Sterile 21 gauge needles, 1% inches long;
sterile syringes of various sizes (1 ml to 20 ml).
2. Various sizes of volummetric flasks, rubber
stoppered vials, beakers, and pasteur pipettes. All were
acid-cleaned, tap-water and distilled-water rinsed, and
autoclaved at 121°C for 20 minutes.
14
General Methods
Procedures for obtaining blood samples, initiation
of tissue cultures, incubation factors and harvest pro
cedures are common to both the test and control groups.
Test groups were cell cultures inoculated with EMS, while
control groups were untreated parallel cultures inoculated
with sterile media. Test group methods are delineated in
detail in EMS methods.
Blood Donors
All individuals tested were healthy and had fasted
three hr prior to blood collection. None of the studied
individuals had been exposed to therapeutic doses of
ionizing radiation or cancer chemotherapy. Preliminary
studies used seven males varying in age from 20-50 yr.
Final studies used 2 male and 2 female young adults (20
to 30 yr).
Blood Samples
Sterile needles were used to withdraw venous blood
into heparinized syringes. Whole blood was inverted
several times gently and 0.2-0.5 ml was sterilly injected
into 10 ml of prewarmed (37°C) culture medium at pH 7.3-7.4.
Incubation
Cell-containing mediums were placed at 37° ± 0.5°C
in a water-jacketed CO 2 incubator (Heinicke Co. Model
15
3221). Carbon dioxide was maintained at 5% level, with
95% air.
Harvest Method
1. Arrest. Colcemid was utilized as a mitotic
spindle inhibitor to maximize the number of metaphase
spreads harvested from the cultures. A 10 yg/ml Colcemid
solution stock was used to prepare a final concentration
of 0.6 yg/ml to which cultures were exposed for 30-45
minutes. Alternately 0.1 yg/ml was sometimes used for
2 hr. Cells were maintained at 37°C during the arrest
period.
To halt the arrest period, cells were transferred
to 15 ml conical centrifuge tubes and centrifuged on an
International Centrifuge (International Equipment Co.,
Model PR-J) at 750 rpm (130 x g) for 6 minutes. All but
0.5 ml of the supernatant was discarded and the cell button
was resuspended.
2. Hypotonic. A .075 M potassium chloride solu
tion was used as the hypotonic agent for all test and
control groups. EMS-treated cells were found to be more
fragile and, as a result, required shorter hypotonic
treatment than the controls. Controls were treated with
room temperature KCL for 12 minutes. EMS-treated cultures
were exposed to KCL for 10-11 minutes. Cells were sus
pended gently in the hypotonic and left at room temperature
16
for the hypotonic treatment. Cells were centrifuged as
before and except for 0.5 ml, the supernatant was aspirated
and discarded. The cell button was suspended in the re
maining supernatant.
3. Fixative. A standard methanol;glacial acetic
acid fixative (.3:1 v/v) was used on all cultures. Cells
were fixed by adding the fixative quickly to the cell
suspension to avoid cell clumping, and allowed to set at
room temperature for 5-20 minutes. Cells were centrifuged,
the supernatant aspirated, and the cell button suspended
in fresh fixative 2x more.
Slide Preparation
Microscope slides were pre-cleaned by soaking in
Alconox and hot tap water overnight, rinsed in hot tap
water for 1 hour, and placed in distilled water at room
temperature.
Cell suspensions were dropped on wet slides.
Cells were blown quickly on an angle across the slide's
surface and the slides were air-dried at room temperature.
Slide Staining
Slides were stained 3-5 minutes with Giemsa Blood
Stain, an Azure A & B Blend (Standardized Reagents) or
Giemsa Blood Stain (Harleco, Stock) in a 2% aqueous buffer
solution. The buffer consisted of .01 M Nal^PO^'l^O
17
(340 ml/liter) and .01 M Na2HP04 (660 ml/liter) in distilled
water. Slides were examined using a Wild-Heerbrugg M20
microscope with camera lucida and photomicroscopy attach
ments .
Permanent Slides
DePex (Gurr) was used as a mounting medium and
22 x 50 mm cover slips (No. 1) were used to protect the
cells that were fixed, dried and stained on the slides.
Slide Coding
Slides were coded with a five digit number drawn
from a table of random numbers. An individual who did not
scan slides in this investigation, coded and mixed the
slides before they were scanned. The code for deciphering
the random numbers was kept separate from daily research
notes and records.
Slide Scanning
Slides were methodically scanned on a horizontal
plane, starting at one corner of the slide and proceeding
back and forth until the entire slide was examined.
All scanning was done on a 10 x objective under
bright field illumination. Under this magnification cells
that appeared to be intact, sufficiently spread for cyto-
logical examination, and stained were chosen for analysis.
Once a cell was chosen, it was not eliminated.
18
EMS Method
Preparation of EMS
Presh solutions of EMS (K & K Laboratories, Calif.)
were made up prior to lymphocyte cell culture innoculation.
EMS was aspirated with a sterile needle and syringe, and
injected into a sterile, rubber-stoppered vial. All tissue
culture media was handled sterilely. Tissue culture media
was added to the EMS, and the solution was shaken vigor
ously for 15-20 minutes before preparation of the next
EMS dilution. The pH of the culture media was tested on
a Coleman pH meter (Model 39) before and after EMS inocula
tion.
Safety Measures
Since EMS is volatile, all work was done under a
general fume hood (Class II). Every attempt was made to
avoid skin and respiratory contact with the chemical.
Rubber gloves and laboratory coat were used during all
EMS procedures.
Inoculation of Cell Cultures
Cell cultures were inoculated with EMS solutions
varying from 10 mM to .01 mM, tightly capped and shaken
gently. Cultures were placed in a 37°C water bath (Pre
cision Scientific Model 81) for 1-2 hours. Sterile water
or culture media was injected into the control groups.
19
Culture Time for EMS Inoculation
To maximize the damage to human chromosomes, the
26th hr of cell culture was chosen as the time for exposure
to EMS. Preliminary experiments showed that a 2-hr exposure
to EMS proved lethal for cells, so EMS treatment time was
held to 1 hr. After 1 hr the cultures were centrifuged on
an International Centrifuge (Model PR-J) at 750 rpm (130
x g) for 6 minutes. The supernatant was removed and the
pH tested. The cell button, in the bottom of the conical
tube was washed with 10-15 ml of prewarmed 37°C minimal
essential medium (Gibco 236) , recentrifuged, and then
transferred to a fresh, sterile vial of complete tissue
culture medium for recovery.
Recovery Periods
A recovery period was the time allotted for the
mutagen-treated cells to grow in fresh tissue culture media
after treatment with, and following removal of, EMS. Pre
liminary groups had recovery periods ranging from 1-10,
11-20, 21-30, 31-40, 41-50, 51-60, 61-70, and 70 plus hrs.
With less than 65 hr recovery, cells were viable but not
dividing. Seventy hours or more were required for EMS-
treated lymphocytes to undergo mitosis (after exposure to
10 raM EMS), so this was set as the minimum recovery period
for the test groups.
20
The recovery time for the test groups was neces
sary to allow for. the mitotic delay caused by the EMS
treatment. Control groups were all harvested after 45
hours of "recovery", giving a total cell culture time of
72 hours, a standard culture time for human peripheral
lymphocytes in short term tissue culture.
EMS Concentrations Tested
The final concentrations of EMS used in vitro
ranged from 100 mM (1 x 10 to .01 mM (.1 x 10 ^) . This
range was chosen to find the highest concentration of the
chemical that would still allow cell growth and division,
to test an intermediate dose, and to assess the approxi
mate physiological dose that would be suggested for in vivo
studies.
The final concentrations tested and analyzed in
this investigation were: 100 mM, 50 mM, 20 mM, 10 mM,
8 mM, 6 mM, 4 mM, 2 mM, and 0.01 mM.
Cell Culture Control Groups
Control groups were set up parallel to the EMS-
test groups. Control groups were made from blood samples
on the same day and from the same donor as mentioned in
general material and methods. Two or three replications
were made of each control group. The total cell culture
time of the control groups was 72 hr, followed by harvest
21
and fixation. Slides with cell preparations were air-
dried and stained with Giemsa as mentioned previously in
general materal and methods.
Densitometer Analysis
Since the Paris Conference (1971) several methods
for eliciting differential banding of human chromosomes
have been reported. Nilsson (1973) compiled a bibliography
of literature on chromosome banding and staining tech
niques. Visual identification of chromosomes through
photography has been the standard procedure to match homo-
logs. An analytical method of chromosome band analysis
was developed (Caspersson 1973) by measuring densitometer
oscilloscope tracings of chromosomes. The original
densitometer method was expensive and required considerable
technical equipment. A similar technique, used in the
current study, has been modified and simplified by workers
at The University of Arizona College of Medicine (Davis
and Lavor 1976).
Materials
The Rapid television system for chromosome band
analysis was utilized as a modification of the documented
densitometer analysis. Equipment used in the Rapid
Television System included:
22
1. A standard Sony TV camera, Model 32-10.
2. A 17 inch Sony TV monitor, Model CVM-112.
3. A Tektronix waveform monitor, Model 529.
4. A Zeiss research microscope.
5. A Sony Special Effects Generator.
6. A Polaroid Camera with Face Hood, and 107
Film.
Rapid Television Procedure
Individual metaphase spreads were photographed and
printed prior to this step. Negatives of 35 mm film were
mounted under a 22 x 50 mm coverslip on a 2 x 3 inch glass
slide. Chromosomes were viewed with a 2.5 x objective and
their image was projected via the Sony video camera onto
the television monitor. The image on the TV screen could
be enhanced by the adjustment on the television set.
Brightness, contrast, and size could be equalized from one
chromosome to another, helping to overcome the variations
in the original negatives. The TV chromosome picture could
be scanned electronically along any chosen line. The
result, displayed on an oscilloscope, approximates the
length and excursion of differential banding patterns of
human chromosomes.
Superimposed on the screen was the Oscilloscope
waveform from the Tektronix monitor. In this manner, both
23
chromosome waveform and the chromosome itself could be
photographed on one picture.
Each chromosome studied was aligned horizontally,
with the short arm (p) to the left of the centromere line.
Original photographs of the spread facilitated the search
and identification of the chromosome. The horizontal line
selector on the waveform monitor was used to assess which
axis would yield maximum band information. After selection
of a chromatid axis, the Polaroid Camera with face hood
attachment was placed close to the television screen and
a photograph was made of the oscilloscope tracing and the
chromosome. A total of 72 photographs were made of 57
chromosomes. Comparisons were made of the A1 chromosome
from 4 mM, 6 mM, 8 mM, and 10 mM EMS cultures. The A2
and A3 chromosomes were compared between 6 mM, 8 mM, and
10 mM EMS. Every chromosome in one cell from a 10 mM
EMS culture was analyzed by the rapid television densitom
eter procedure. Two abnormal chromosomes from EMS cultures
were also analyzed.
Control Group for Densitometer Analysis
The photographs and 35 mm negatives of the control
group chromosomes were donated through the courtesy of the
Cytogenetics Laboratory at The University of Arizona
Medical Center (AMC).
24
Cell cultures were done in the AMC Cytogenetics
Laboratory using similar methods and materials. Cells
which were fixed and air-dried on slides were dipped 10-15
seconds in a 37°C solution of Viokase (Gibco) and Hank's
solution (Gibco) (1:9 v/v). Slides were dipped in a Giemsa
staining solution (1 ml Giemsa:50 ml Gurr's Buffer) for
5-10 minutes and rinsed in distilled water.
Chromosomes were banded using the above technique
and one Al chromosome was used as the control group chromo
some (Figures 5-8) for the comparisons between EMS-induced
chromosome banding.
Chromosome Classification Methodology
Human Chromosomes
The normal human somatic cell .contains a diploid
complement of 46 chromosomes. The London Conference
(1963) classified the human chromosomes into seven groups:
A, B, C, Dr E, F and G.
Group A consists of the three longest meta- and
submetacentric chromosomes, numbered 1, 2 and 3. Group B
contains chromosomes 4 and 5. The C group is the largest
group and consists of chromosomes 6-12, and the X chromo
some. The acrocentric chromosomes 13, 14 and 15 are in the
D group. The group E chromosomes 16, 17 and 18 are small
submetacentrics. Chromosomes 19 and 20 are the small
25
metacentrics from group F. Group G is the last group and
consists of the acrocentrics 21, 22 and Y chromosomes.
Aberrations were classified as occurring in the
A-G groups. Also aberrations were designated as occurring
in the short arm (p), centromere (c) , or long arm (q)
regions of the chromosome (Appendices A and B). Complete
karyotype analysis was performed on some of the cells.
Localization of aberrations to specific chromosomes was
performed on a few cells.
Classification of Aberrations
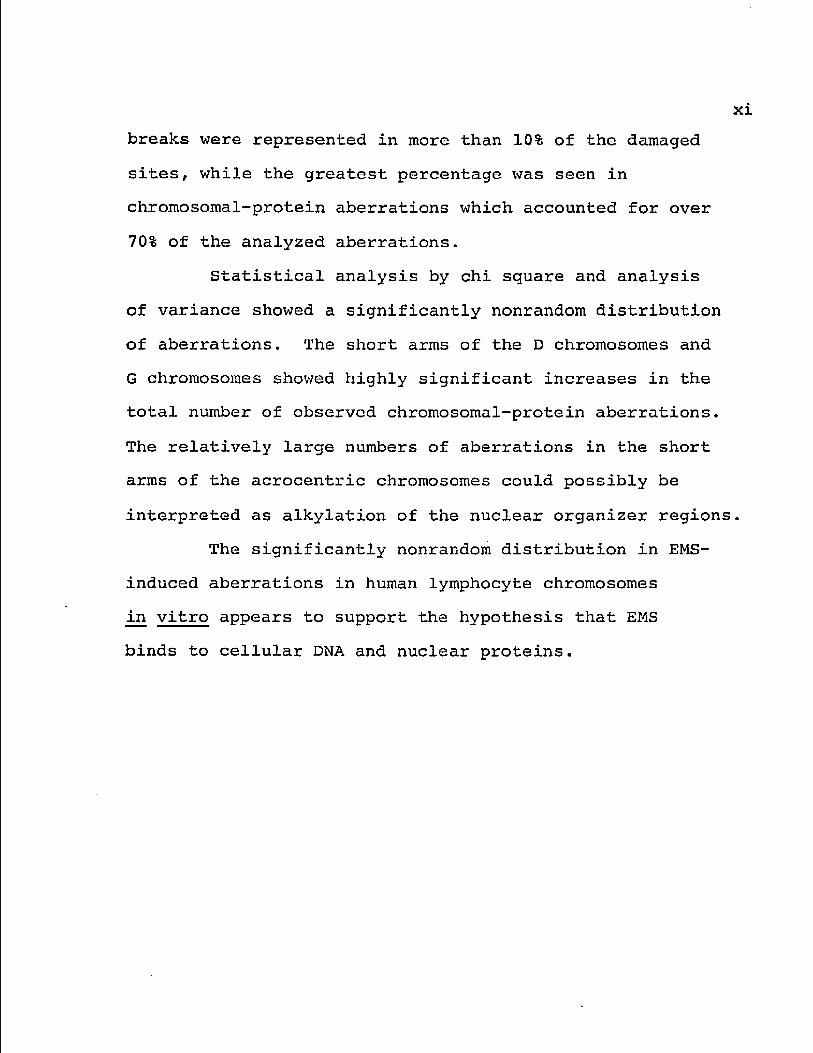
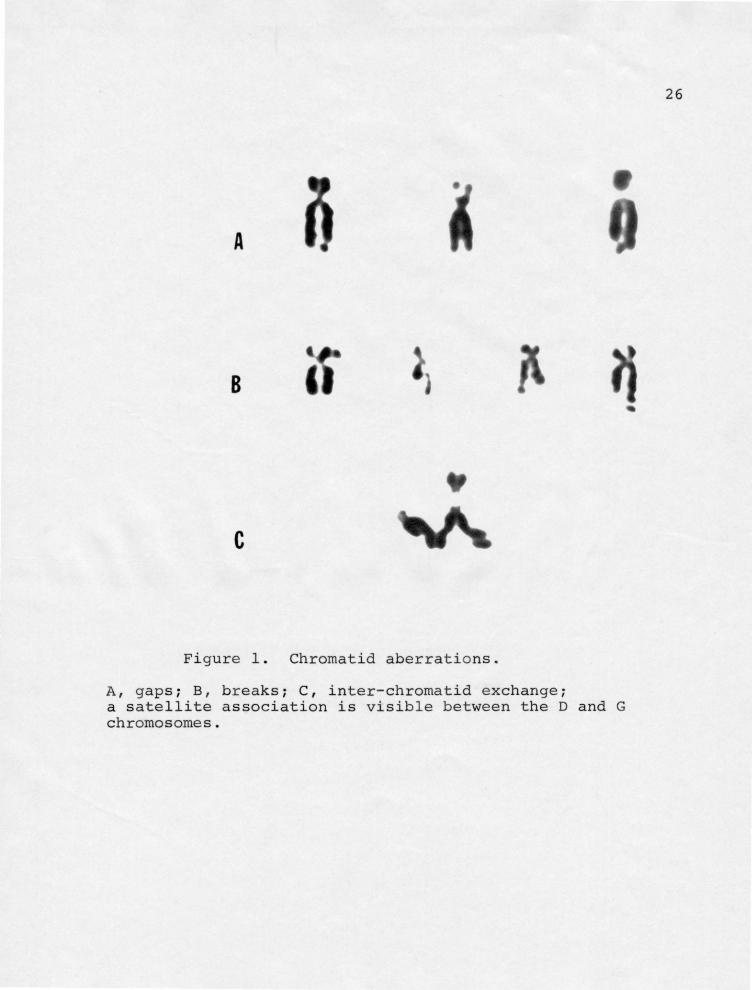
Aberrations were classified by three types. Type I
were chromatid aberrations, and consisted of chromatid
gaps, breaks and interchromatid exchanges (Figure 1). A
chromatid gap was defined as a discontinuity in one arm of
the chromosome with no displacement of the chromatid, or a
displacement of the chromatid segment connected to the
chromosome by a fine fiber (Figure 1-A). A chromatid
break was defined as a discontinuity in one chromosome arm
that was displaced and unconnected (Figure 1-B). Inter
chromatid exchanges were defined as breaks and exchanges
of single chromatids between chromosomes (Figure 1-C).
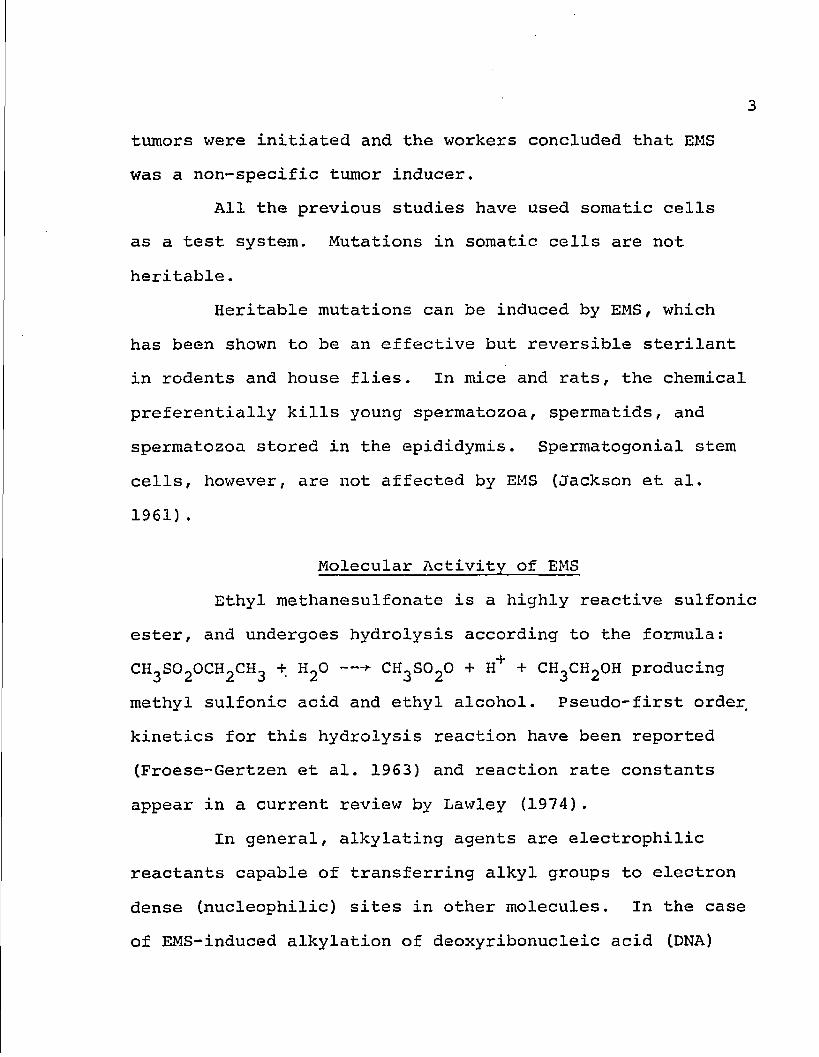
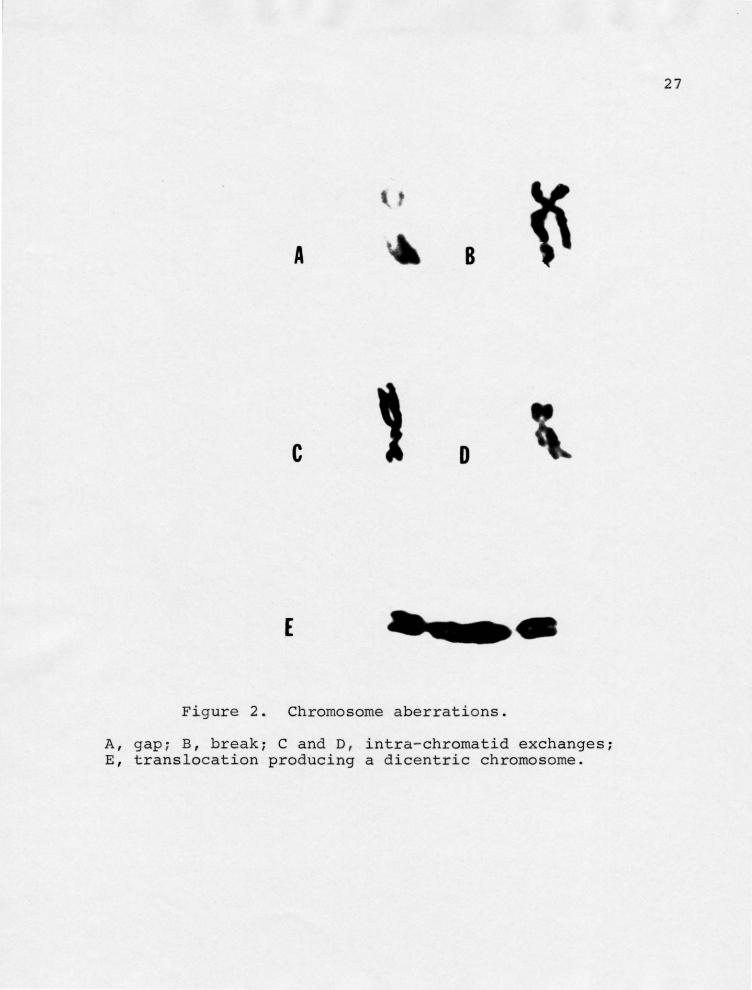
Type II were chromosomal aberrations. This cate
gory consisted of chromosome gaps, breaks, translocation,
double deletions, dicentrics, and intra-chromatid exchanges
(Figure 2). Chromosome gaps were defined as a discontinuity
A
8
c
Figure 1. Chromatid aberrations.
A, gaps; B, breaks; C, inter-chromatid exchange; a satellite association is visible between the D and G chromosomes.
26
A 8
c 0
E
Figure 2. Chromosome aberrations.
A, gap ; B, break; C and D, intra- chromatid exchanges; E , translocat1on producing a dicentric chromosome.
27
28
in both arms of the chromosome, and occurring at the same
position (Figure 2-A). Chromosome breaks were defined as
a displacement of both sister chromatids from the parent
in the same region (Figure 2-B). Double deletions were
defined as unassigned sister chromatids that were displaced
from the parent. Intra-chromatid exchanges were defined
as a discontinuity in one chromatid, with the fragment
portion attached to the sister chromatid at the same posi
tion as the discontinuity (Figure 2-C, D). A translocation
was defined as a dicentric chromosome in cells containing
only 45 chromosomes, with the dicentric chromosome having
an increased length approximately proportionate to the
size of the missing chromosome (Figure 2-E).
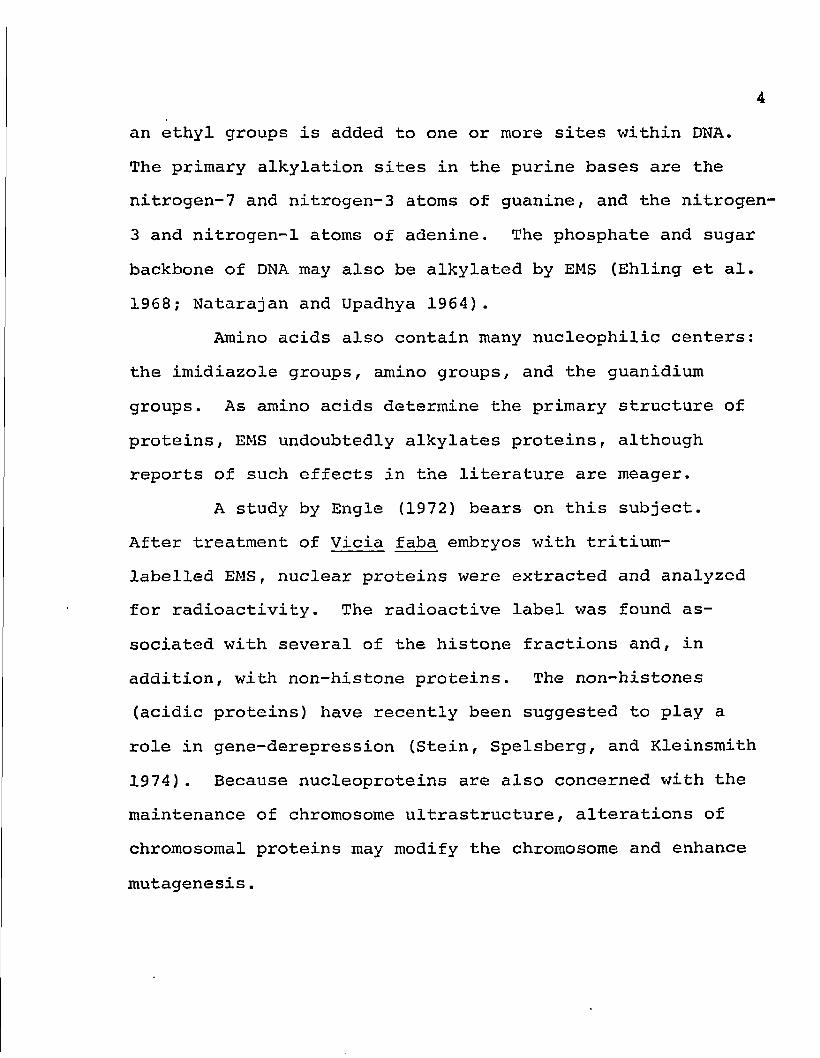
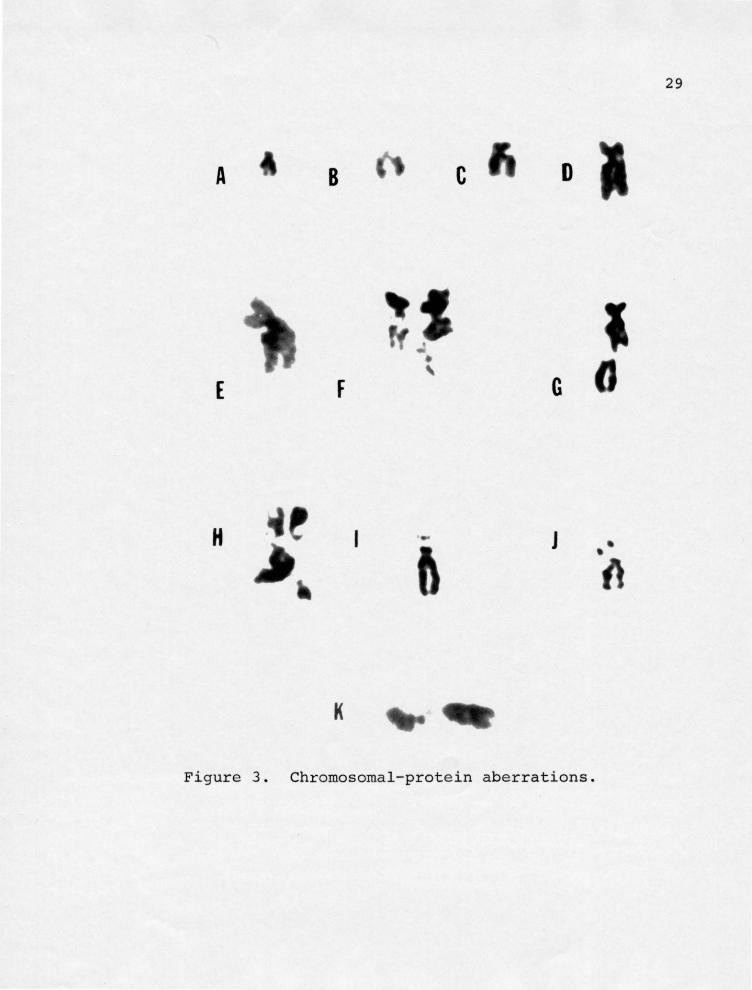
Type III aberrations were chromosomal-protein
(Figure 3) aberrations, which was a general category that
included cytological observations thought to involve only
the proteins of the chromosome and not the DNA. This type
included lateral extensions or protrusions, stickiness,
satellite extensions, centromere attenuations, and others.
Lateral extensions or protrusions (Figure 3 A-G) were
stained chromatid or chromosome regions that protruded
abruptly from the chromosome. Stickiness was defined as
fibers which often appeared fuzzy and maintained contact
between chromosomes during metaphase (Figure 3-G), or
between the short and long arms of chromosomes. Satellite
Figure 3. Chromosomal-protein aberrations.
A, B, C, lateral extensions on the long arm (q); D, lateral extensions on the short arm (p); and long arm (q) appear to be inter-sticking; E, large lateral extension on the long arm (q) adjacent to the centromere. F, lateral extension in close association with satellite region of a D group chromosome? G, upper chromosome has lateral extension on the long arm (q); lower chromosome has a long centromere attenuation of a D group chromosome; H, several lateral extensions in close proximity with satellite regions of D and G group chromosomes. I and J, satellite extensions; K, centromere attenuation of a C group chromosome .
29
A 8 c D
E F G
H J
K
Figure 3. Chromosomal- protein aberrations.
30
extensions were defined as either increased size of the
satellite stalk or the satellite stalk was positioned
away from the parent chromosome (Figure 3 I-J). Centromere
attenuations were defined as stretched centromere regions
that were not broken (Figure 3K). "Others" were defined
as additional aberrations that were too numerous to tally
separately, but were still hypothesized to be chromosomal-
protein in nature (i.e., puffing, curling, etc.). If an
aberration could not be assigned to a chromosome group,
it was labeled an "unknown". Although this "unknown"
category leaves much room for speculation, it was devised
because many aberrations could not be analyzed and yet
the cell was not eliminated from the study simply because
of the difficulty in analysis.
CHAPTER 3
RESULTS
General Location of Aberrations
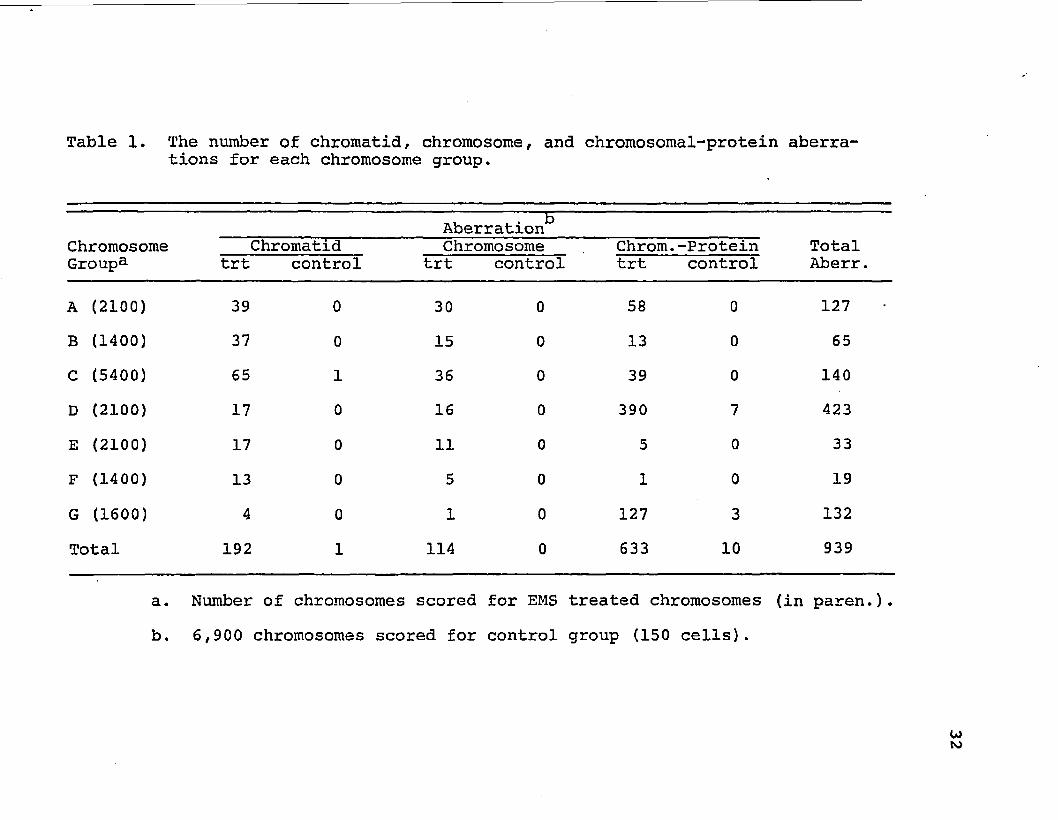
Aberrations were found in chromosomes of every
group. The chromosomal groups displayed a difference in
their aberration frequency. The group D chromosomes (13,
14, 15) displayed the greatest number of aberrations (Table
1). The B group chromosomes (4, 5) displayed the greatest
frequency of chromatid and chromosome aberrations combined
(Table 2).
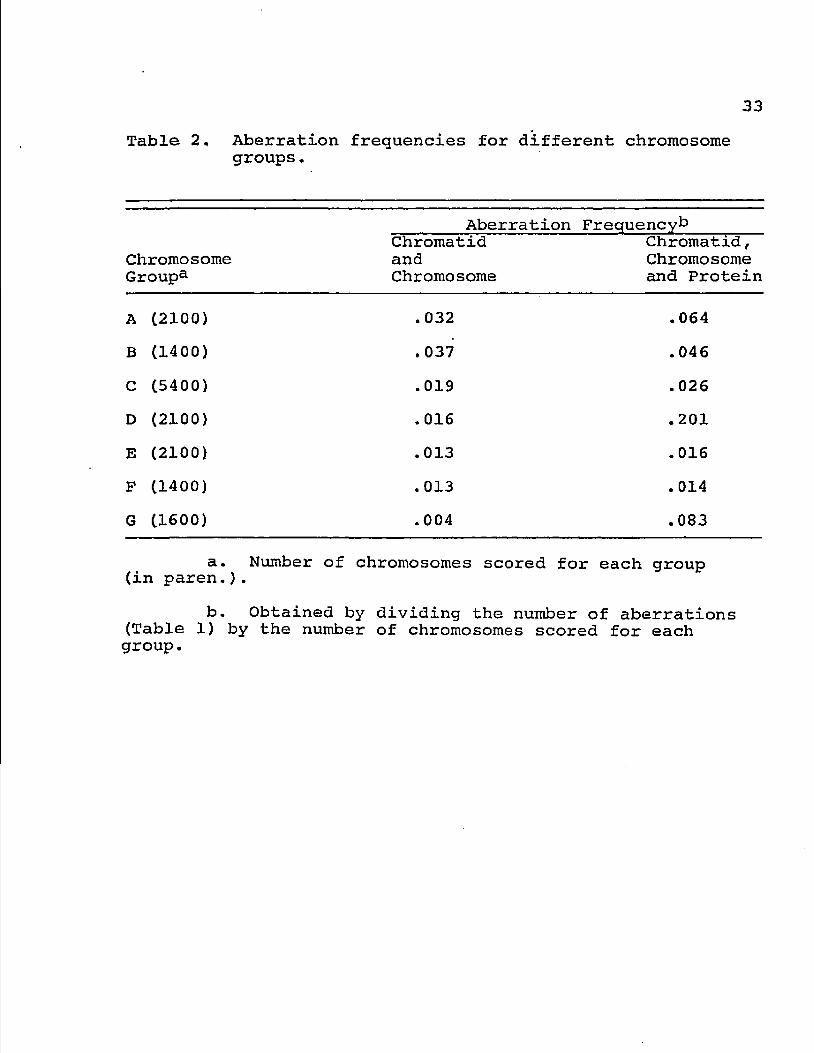
EMS was found to preferentially damage the chromo
somes of the groups in decreasing order: D, G, A, B, C,
E and F only when all three types of aberrations (chromatid,
chromosome, and chromosomal protein) were combined (Table
2). The decreasing order was found to be statistically
significant at the .001 level of probability by chi square.
Analysis of chromatid and chromosome aberrations combined
indicated that ethyl methanesulfonate had no preference
for specific chromosomal groups (P = >.05). The number
of chromatid and chromosome aberrations induced by EMS
occurred generally in proportion to those expected on the
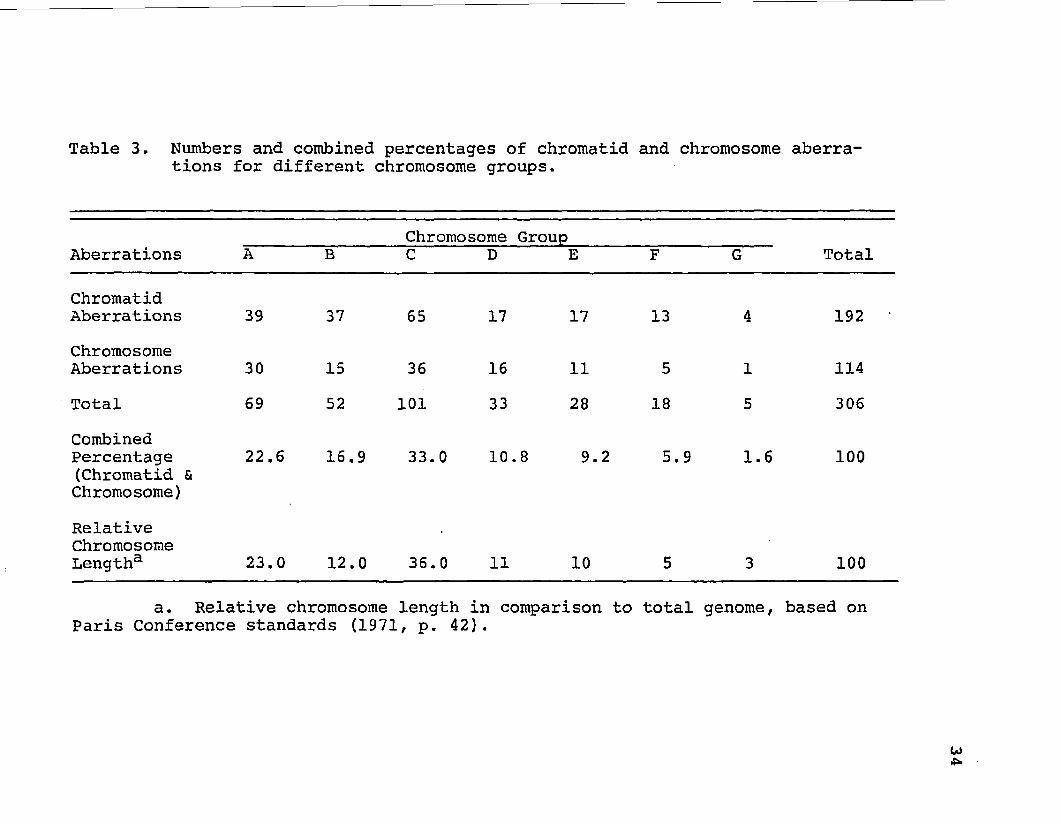
basis of relative chromosome lengths (Table 3).
31
Table 1. The number of chromatid, chromosome, and chromosomal-protein aberrations for each chromosome group.
Aberration' Chromosome Chromatid Chromosome Chrom. -Protein Total Groupa trt control trt control trt control Aberr.
A (2100) 39 0 30 0 58 0 127
B (1400) 37 0 15 0 13 0 65
C (5400) 65 1 36 0 39 0 140
D (2100) 17 0 16 0 390 7 423
E (2100) 17 0 11 0 5 0 33
F (1400) 13 0 5 0 1 0 19
G (1600) 4 0 1 0 127 3 132
Total 192 1 114 0 633 10 939
a. Number of chromosomes scored for EMS treated chromosomes (in paren.).
b, 6,900 chromosomes scored for control group (150 cells).
33
Table 2. Aberration frequencies for different chromosome groups.
Aberration Frequency*3
Chromosome Group3
Chromatid and Chromosome
Chromatid, Chromosome and Protein
A (2100) . 032 .064
B (1400) . 037 .046
C (5400) .019 .026
D (2100) .016 .201
E (2100) .013 .016
F (1400) .013 . 014
G (1600) .004 .083
a. Number of chromosomes scored for each group (in paren.).
b. Obtained by dividing the number of aberrations (Table 1) by the number of chromosomes scored for each group.
Table 3. Numbers and combined percentages of chromatid and chromosome aberrations for different chromosome groups.
with "small whisker-like stainable material attached to
the centroraeric regions of all the chromosomes". In the
current study, damage clustered on the A1 long arm near
the secondary constriction. For example, in Table A-
(Appendix A), chromosomes treated with 8 mM EMS had 13
protein aberrations in the long arm (q) of the A group
chromosomes. Although not recorded in this table, it
worthy of notation here that 9 of the 13 aberrations were
in the A1 chromosome near the secondary constriction, but •%
distinct from the centromere. Lateral extensions stained
heavily with Gierasa and were situated above poorly-stained
regions. Occasionally lateral extensions appeared opposite
gaps, breaks or other lateral extensions in the homologous
region on the sister chromatid. The appearance of lateral
extensions ranged from knobby bands to severe lateral
protrusions.
Stickiness appeared as fuzzy fibers maintaining
contact between chromosomes during metaphase. The ap
pearance of stickiness ranged from slight to considerable
stickiness involving most of the chromosomes, rendering
the cell unanalyzable.
Satellite extensions apeared as stretched secondary
constrictions, and were clustered in the Dp and Gp regions
(Tables B-4 and B-6, Appendix B). Centromere attenuations,
46
which appeared as over-extended centromeres in comparison
with the homolog, were clustered in the Ac regions.
Chromosome Banding
Treatment of cell cultures with EMS prior to
harvesting and fixation, resulted in chromosome banding.
Banding also occurred as a result of post-fixation treat
ment with EMS (Ward and Young 1974). The mutagen-induced
chromosome banding was observed in all cultures treated with
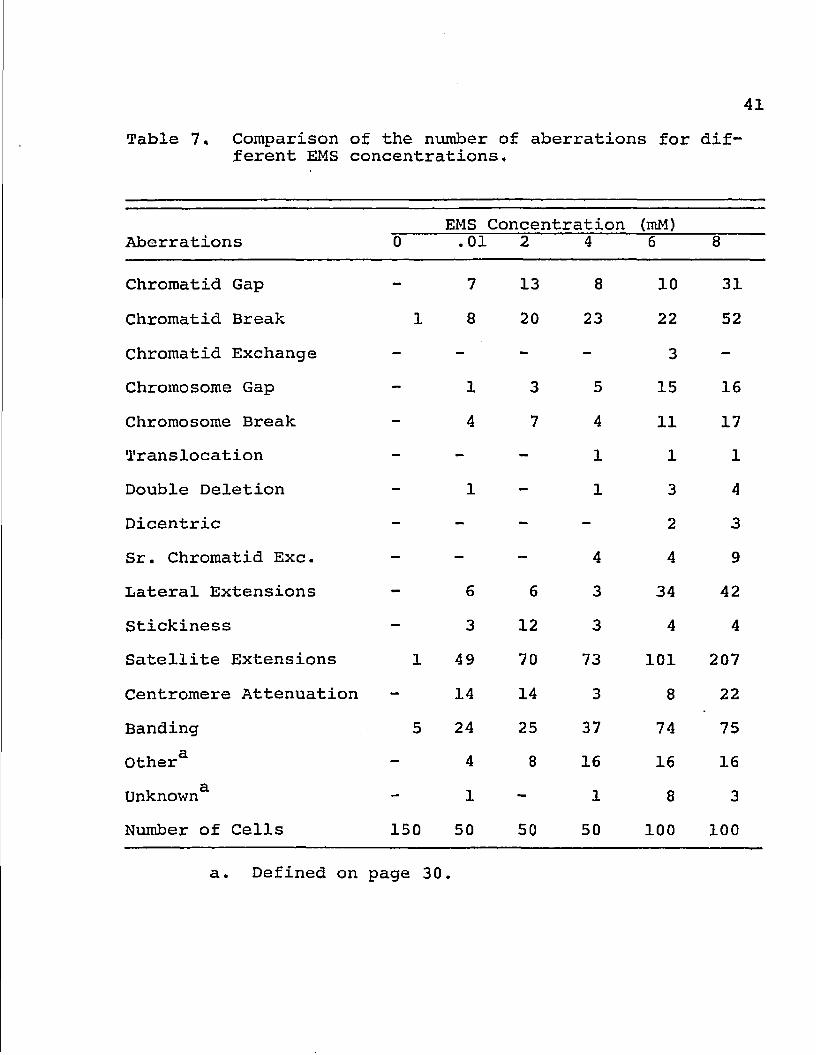
EMS. The numbers (and percentages) of cells displaying
banded chromosomes increased with the treatment con
centration (Table 7). In general, the amount of time neces
sary to produce visible chromosome bands with Giemsa was
greatly decreased for cells treated with EMS. Adequately
stained slide preparations could be obtained in 1-2
minutes.
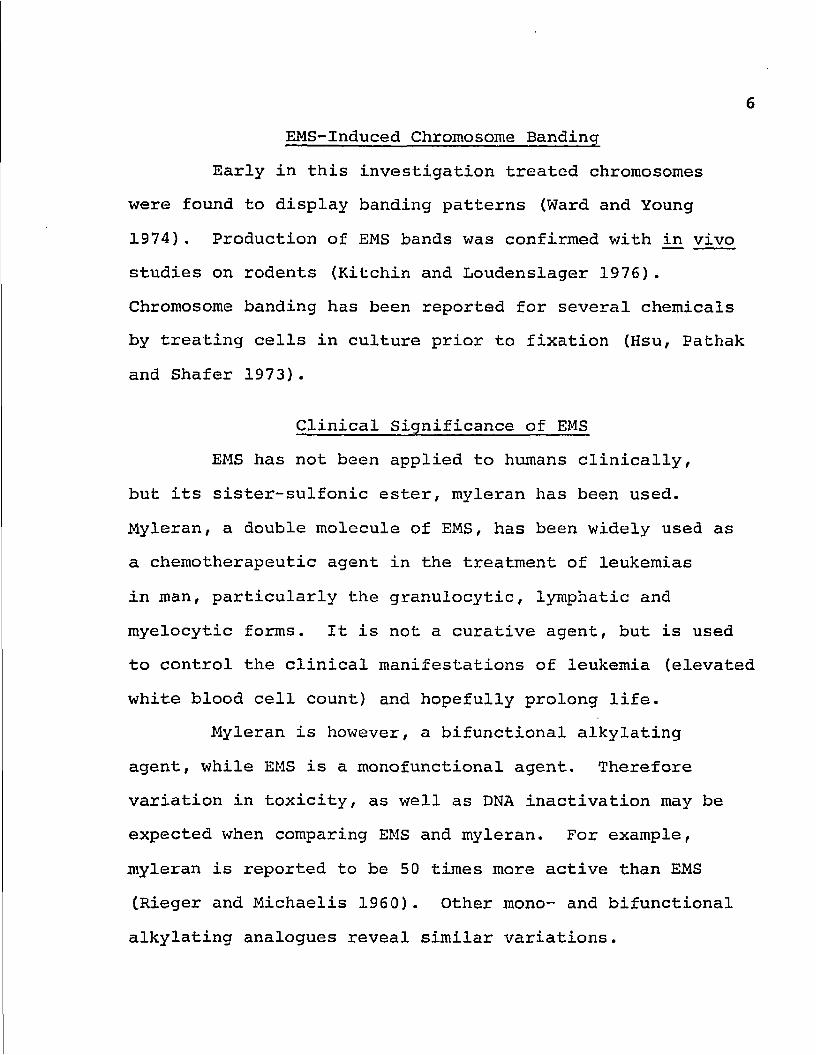
Chromosome banding patterns induced by EMS were
analogous to the Giemsa ("G" bands) patterns of the Paris
Conference (1971) (Figure 5). Densitometer analysis of
the Al chromosome revealed a pattern consistent with the
A1 pattern of the Paris Conference (Figures 6-9). The
EMS-induced band pattern of the Al chromosome was consis
tent between EMS treatments (Figures 6-9). The variable
band regions of the Al long arm (q), adjacent to the
centromere consistently stained heavily when exposed to
A o o 1 - -2 3 B -- 4 5
Ht H I H ~ H I H H 1~ 12 c D 0 6 7 8 9 10
n t n ' • •
! He· ~ a -H n 0 13 14 15 E 16 17 18
&£ t M " ~ ,. ~ f
Sex H x F 19 20 G 21 22 y
Figure 5. EMS - induced chromosome bands.
~ -....)
10 mM EMS
Control
Figure 6. Densitometer wave patterns of human chromosome A1 stained with Giemsa (EMS 10 mM).
Upper solid line indicates the oscilloscope wave pattern from chromosome treated with EMS 10 mM; lower line indicates control wave pattern, chromosome treated with Viokase. Dotted lines indicate comparable wave peaks. Vertical line indi-cates centromere position. co
8mM EMS
Control
Figure 7, Densitometer wave patterns of human chromosome A1 stained with Giemsa (EMS 8 mM).
Upper solid line indicates the oscilloscope wave pattern from chromosome treated with EMS 8 mM; lower line indicates control wave pattern, chromosome treated with Viokase. Dotted lines indicate comparable wave peaks. Vertical line indicates centromere position.
Figure 8. Densitometer wave patterns of human chromosome A1 stained with Giemsa (EMS 6 mM).
Upper solid line indicates the oscilloscope wave pattern from chromosome treated with EMS 6 mM; lower line indicates control wave pattern, chromosome treated with Viokase. Dotted lines indicate comparable wave peaks. Vertical line indicates centromere position.
6mM EMS
Control
Figure 8. Densitometer wave patterns of human chromosome A1 stained with Giemsa (EMS 6 mM).
4mM EMS
Control
Figure 9. Densitometer wave patterns of human chromosome A1 stained with Giemsa (EMS 4 mil) .
Upper solid line indicates the oscilloscope wave pattern from chromosome treated with EMS 4 mM; lower line indicates control wave pattern, chromosome treated with Viokase. Dotted lines indicate comparable wave peaks. Vertical line indicates centromere position.
52
Giemsa for 1-2 minutes. Although this variable band in
consistently stains with quinacrine mustard (Q bands),
it is much jnore consistently seen with Viokase bands (simi
lar to Trypsin-Giemsa "G" bands). The densitometer compari
son of EMS-Giemsa bands was made with Viokase-Giemsa bands,
rather than comparison with "Q" bands.
Densitometer analysis of the seven chromosomal
groups (A-G) reveals a remarkable similarity between EMS
induced banding stained with Giemsa and the Viokase-Giemsa
banding. Densitometer peaks were compared on the presence
or absence of peaks, and not the excursion (height) of the
light deflection through chromosome regions (Figures 6-12).
Others have found variations in densitometer profiles
due to: variations in staining procedures, variations
between profiles of corresponding chromosomes selected from
different metaphases, and even in variations from patterns
of homologues in the same metaphase (Disteche and Bontemps
1976). The greatest variation in the densitometer profiles
are in the length and averaged height of the profiles. The
position of the peaks (with respect to the total length)
and the relative intensities of the bands are more con
stant (Caspersson, Lomakka and Moller 1971). Other
laboratories have used expensive and complicated equip
ment to overcome the variations in densitometric pro
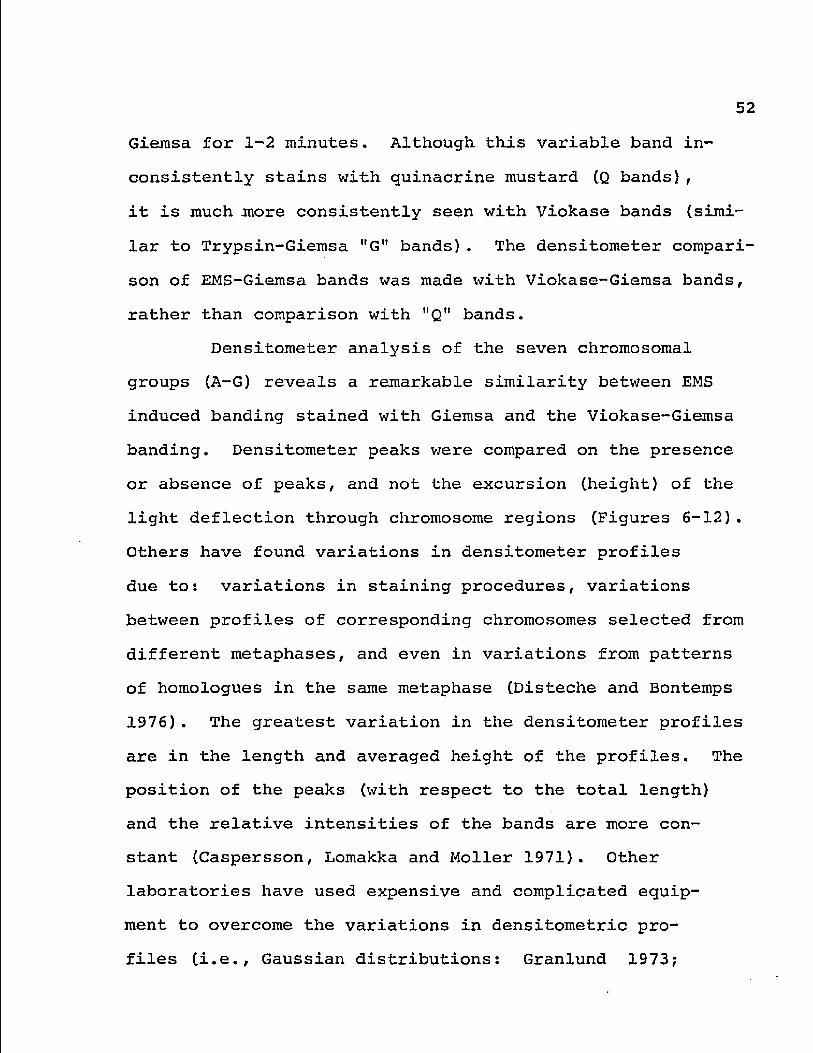
Figure 10. Densitometer wave patterns of human chromosome D 13 stained with Giemsa.
Upper and lower solid lines indicate wave patterns of homologs from a cell treated with 10 mM EMS in culture. Hatched lines indicate a translocation onto the long arm of the D 13. Dotted lines indicate comparable peaks. Vertical line indicates centromere position.
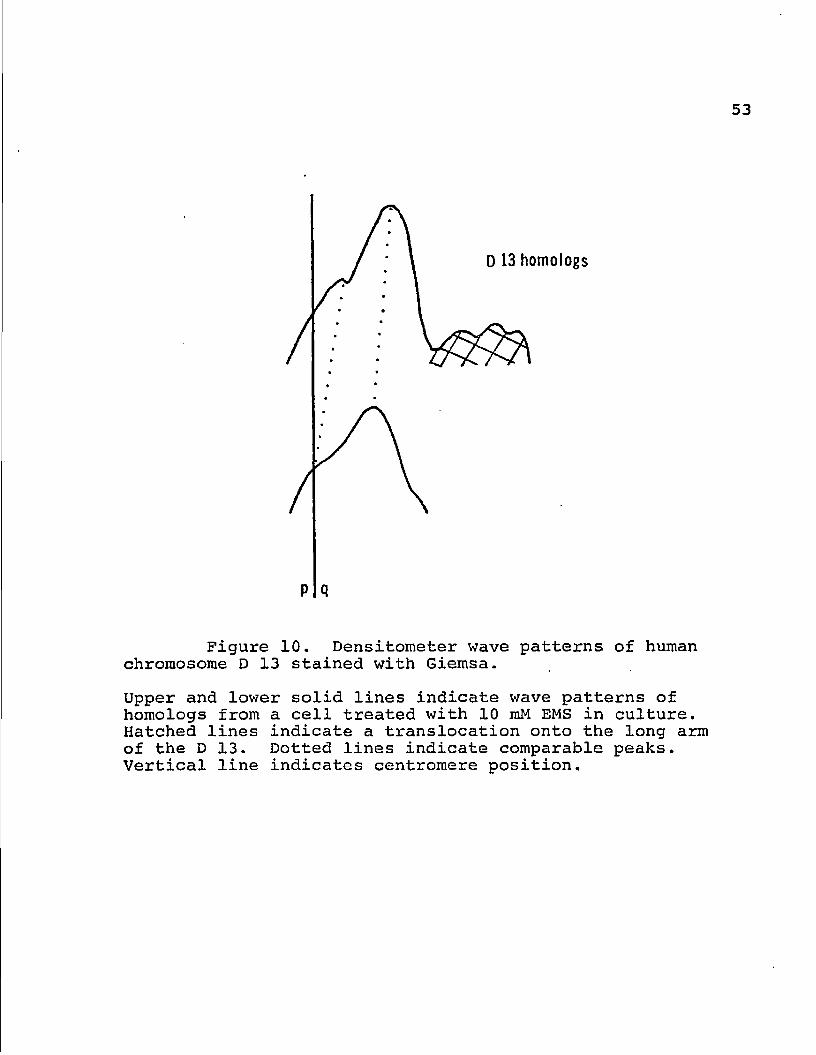
D 14 homologs
Figure 11. Densitometer wave patterns of human chromosome D 14 stained with Giemsa.
Upper and lower solid lines indicate homologous wave patterns of a cell treated with 10 raM EMS in culture. Dotted lines indicate comparable peaks. Vertical line indicates centromere position.
55
D 15 homologs
Figure 12. Densitometer wave patterns from human chromosome D 15 stained with Giemsa.
Upper and lower solid lines indicate D homologs from one cell. The cell was treated with 10 mM EMS in culture. Dotted lines indicate comparable peaks. Vertical line indicates centromere position.
56
Fourier series: Caspersson, Lomakka and Zech 1971}. In
the current study, no such equipment was available for
standardization of variations. As a result, the only com
parisons made involved the presence or absence of peaks.
If serious consideration were given to using densitometric
profiles, one could adopt the mini-computer normalization
procedure (Disteche and Bontemps 1976) which averages the
profiles every 0.1 ym along the chromosome length.
CHAPTER 4
DISCUSSION
EMS, an alkylating agent, induced chromosome aber
rations in cultured human lymphocyte chromosomes. Analysis
of 500 metaphase cells revealed 1141 aberrations, the
majority (1068) of which could be classified. Of the
total aberrations produced in the study, chromatid aberra
appear "knobby"; (9) lateral extensions visible at site
of bands; (10) visible gaps in the interband regions below
bands; Cll) bands appear as lateral extensions; (12) chromo
some and chromatid breaks appear in the interband regions
most often; (13) severe despiralization of one or more
chromosomes; and (14) the cells become unanalyzable due
65
to severe breaks, stickiness and general clumping of chromo
somes (Figure 131-.
Chromosomal-Protein Aberrations
In this study, chromosomal-protein aberrations
(753) accounted for over 70% of the analyzed aberrations.
The chromosome regions which displayed the greatest number
of these aberrations were the D and G short arms (p). It
has been previously mentioned that these regions contain
blocks of highly repetitive DNA. In addition it is known
that these regions are in close proximity with the nucleolus
during the transcription of the 45S ribosomal RNA precursor.
This close proximity during interphase lead to an increased
chance for translocations. Evidence of this increased
translocation rate is seen in individuals with chronic
myelogenous leukemia (Rowley 1973). The human chromosomes
1, 9, and 16 also have been reported to contain cistrons
for 5S RNA and to have highly repeated DNA sequences
(Steffensen and Duffey 1974). Other workers have reported
the close association of the D and G satellites and the
long arms (q) of the 1, 9, and 16 chromosome with the
nucleolus (Ferguson-Smith and Handmaker 1963; Shaw 1961).
It is possible that EMS alkylation of the ribosomal
RNA has caused the large numbers of lateral extensions of
the A long arm (q) and the satellited short arms (p) of
the D and G group chromosomes. Chromosomes of Hela cells
A
c
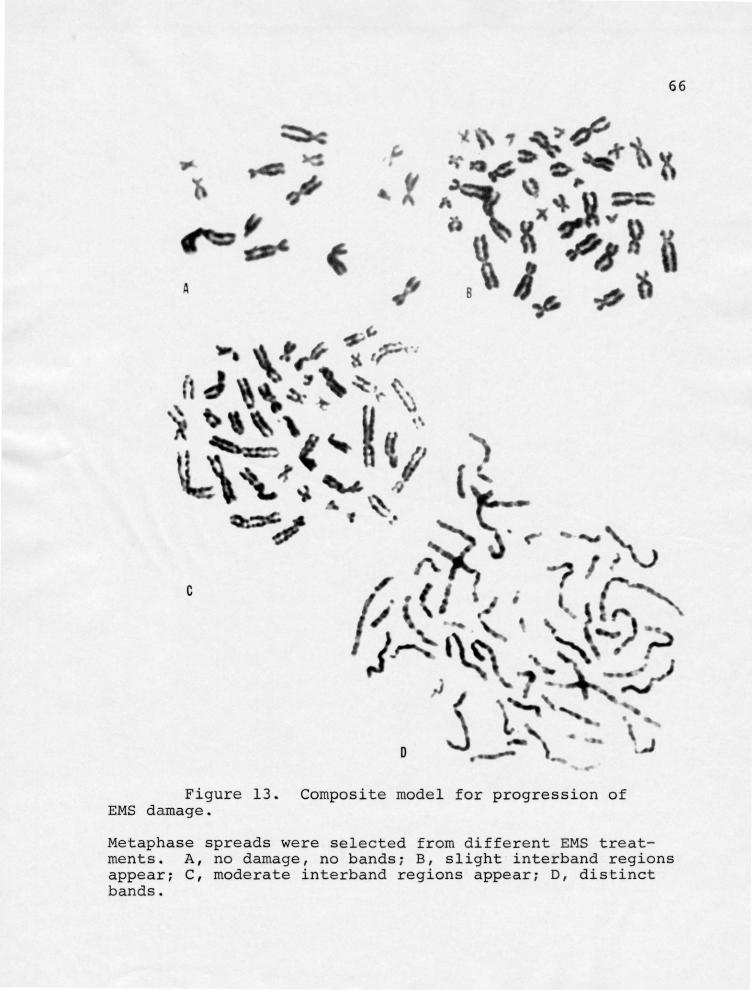
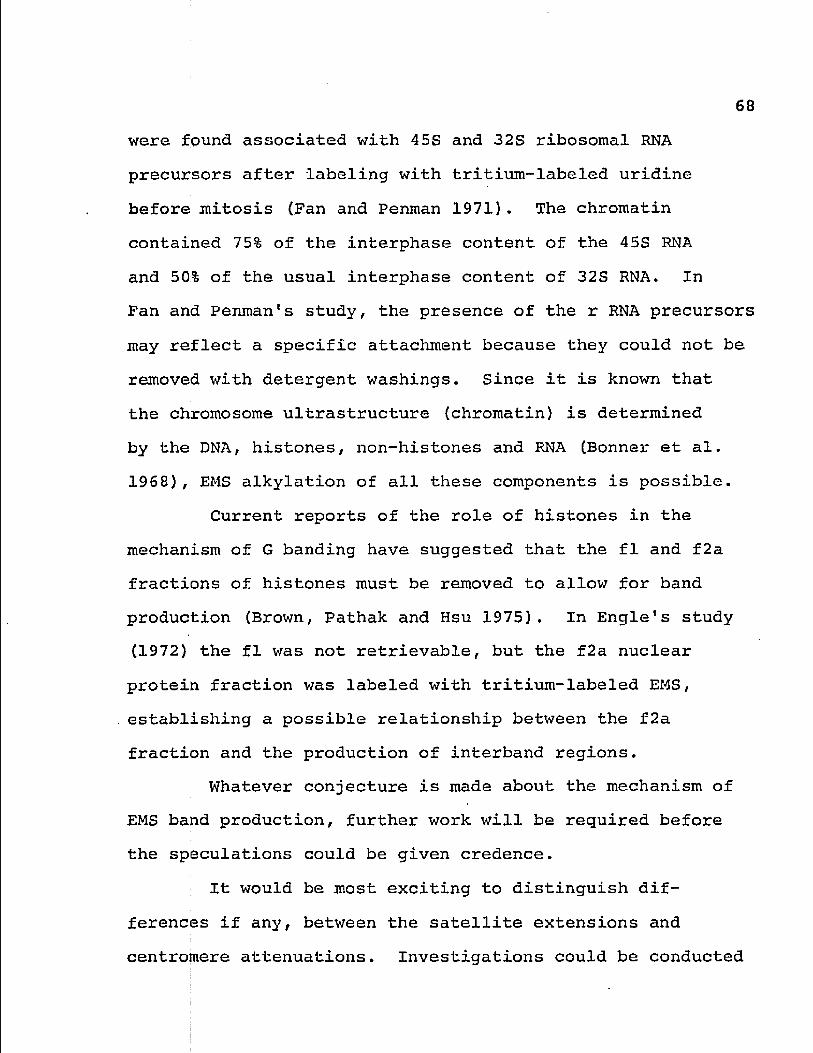
Figure 13- Composite model for progression of EMS damage.
66
Metaphase spreads were selected from different EMS treatments. A, no damage, no bands; B, slight interband regions appear; C, moderate interband regions appear; D, distinct bands.
E
••
• F G
Figure 13. (Continued) Composite model for progression of EMS damage.
E, lateral extensions visible at site of bands; F, visible gaps in interband regions below bands, some lateral extensions visible; G, severe damage to chromosomes, some are unanalyzable.
67
68
were found associated with 45S and 32S ribosoraal RNA
precursors after labeling with tritium-labeled uridine
before mitosis (Fan and Penman 1971). The chromatin
contained 75% of the interphase content of the 45S RNA
and 50% of the usual interphase content of 32S RNA. In
Pan and Penman's study, the presence of the r RNA precursors
may reflect a specific attachment because they could not be
removed with detergent washings. Since it is known that
the chromosome ultrastructure (chromatin) is determined
by the DNA, histones, non-histones and RNA (Bonner et al.
1968), EMS alkylation of all these components is possible.
Current reports of the role of histones in the
mechanism of G banding have suggested that the fl and f2a
fractions of histones must be removed to allow for band
production (Brown, Pathak and Hsu 1975). In Engle's study
(1972) the fl was not retrievable, but the f2a nuclear
protein fraction was labeled with tritium-labeled EMS,
establishing a possible relationship between the f2a
fraction and the production of interband regions.
Whatever conjecture is made about the mechanism of
EMS band production, further work will be required before
the speculations could be given credence.
It would be most exciting to distinguish dif
ferences if any, between the satellite extensions and
centromere attenuations. Investigations could be conducted
69
on an organism which has nuclear organizer regions dis'-
tinct from the centromeres or telomeres. Muntiacus muntjak
has nuclear organizers which are cytologically distinct
from their centromeres (Goodpasture and Bloom 1975), EMS
treatment of Muntiacus chromosomes, followed by NOR staining
procedures could possibly lead to differentiation of satel
lite extensions and centromere attenuations.
In summary, the alkylating chemical EMS induced
chromosome aberrations in cultured human lymphocyte chromo
somes abberations in cultured human lymphocyte chromosomes.
In addition, (1) the chromosome aberrations produced by
EMS are non-random in their distribution, clustering in
the D and G group chromosomes. (2) EMS-induced aberrations
are also non-random in their distribution within the
chromosome arms; the q arms of the meta- and submetacentric
chromosomes sustained extensive damage, while the p arms
of the acrocentric chromosomes displayed aberrations more
often than the other D and G arm regions. (3) The specific
breaks (non-randomness) are correlated with the distribution
of the heterochromatic segments in the genome; the con
stitutive heterochromatin ("C" bands) and the nuclear
organizer regions which contain highly repetitive DNA,
were sites of EMS-induced aberrations. (4) The specific
breaks were not correlated with the distribution of the
Giemsa "G" Bands of the Paris Conference (1971), but
appeared to occur more often in the interband regions.
C5) The EMS-induced chromosome band patterns appear
similar to the Giemsa "G" Bands.
APPENDIX A
FREQUENCY OF ABERRATIONS FOR THREE REGIONS OF CHROMOSOMES
71
72
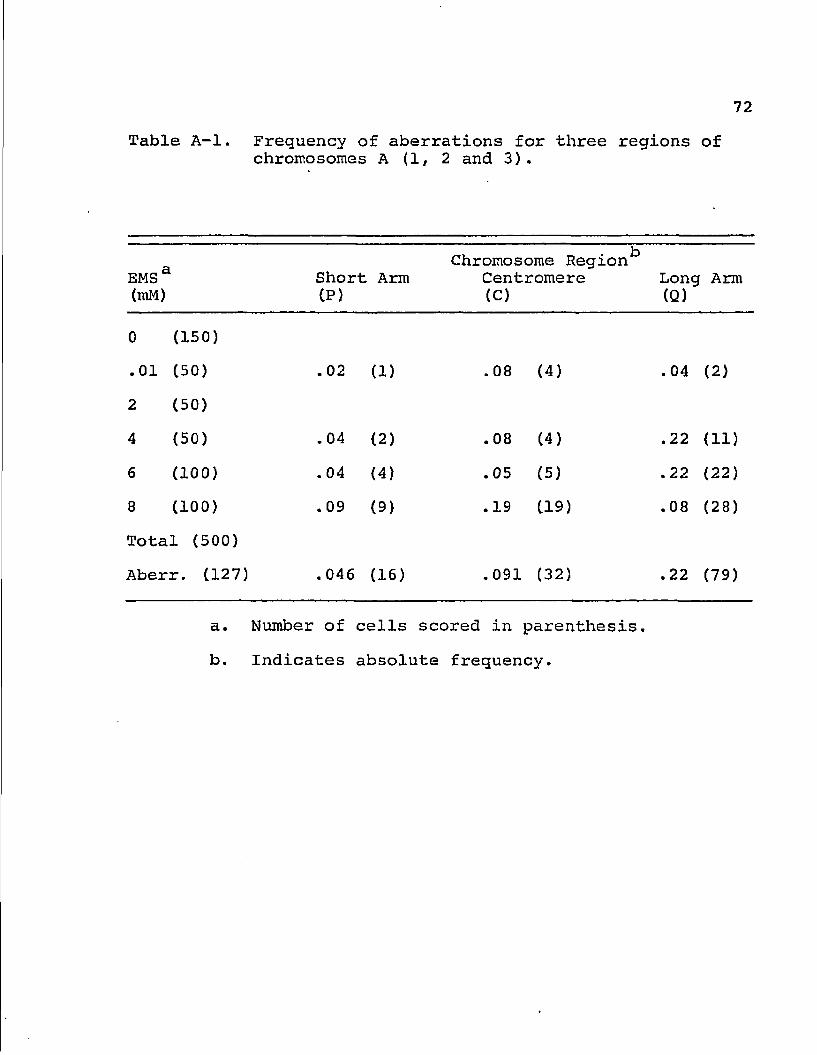
Table A-l. Frequency of aberrations for three regions of chromosomes A (1, 2 and 3).
EMS 3 (mM)
Short CP)
Arm Chromosome Region*3
Centromere (C)
Long (Q)
Arm
0 (150)
.01 (50) .02 (1) .08 (4) .04 (2)
2 (50)
4 (50) .04 (2) .08 (4) .22 (11)
6 (100) .04 (4) .05 (5) .22 (22)
8 (100) .09 (9) .19 (19) .08 (28)
Total (500)
Aberr. (127) . 046 (16) .091 (32) .22 (79)
a. Number of cells scored in parenthesis.
b. Indicates absolute frequency.
73
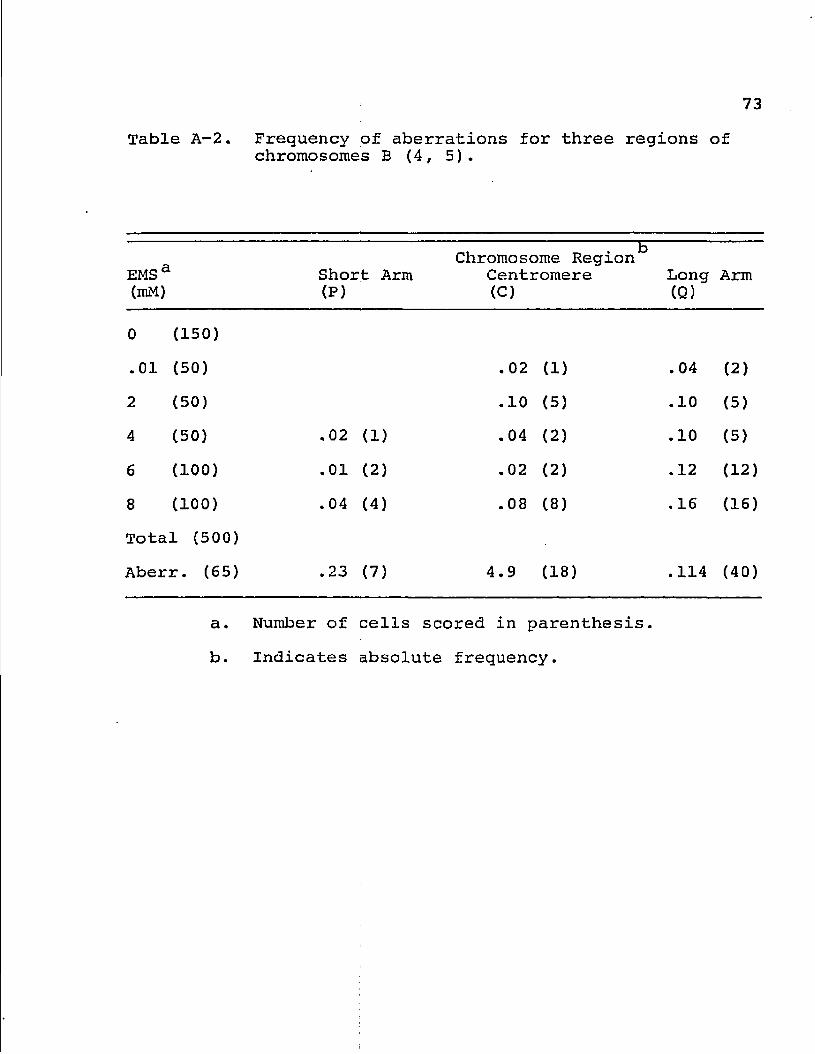
Table A-2. Frequency of aberrations for three regions of chromosomes B (4, 5).
EMS a (mM)
Short Arm (P)
Chromosome Region*3 Centromere (C)
Long (Q)
Arm
0 (150)
.01 (50) .02 (1) . 04 (2)
2 (50) .10 (5) .10 (5)
4 (50) .02 (1) .04 (2) .10 (5)
6 (100) .01 (2) .02 (2) .12 (12)
8 (100) .04 (4) .08 (8) .16 (16)
Total (500)
Aberr. (65) .23 (7) 4.9 (18) .114 (40)
a.
b.
Number of cells scored in parenthesis.
Indicates absolute frequency.
Table A-3. Frequency of aberrations for three regions of chromosomes C (6, 7, 8, 9, 10, 11, 12, X).
EMSa (mM)
Short Arm (P)
Chromosome Region ̂ Centromere (C)
Long (Q)
Arm
0 (150) .09 (1)
.01 (50) .02 (1) . 04 (2) .12 (6)
2 (50) .12 (6) .12 (6)
4 (50) .06 (3) .08 (4) .10 (5)
6 (100) . 02 (2) .05 (5) .32 (32)
8 (100) .08 (8) .25 (25) .35 (35)
Total (500)
Aberr. (141) .03 (15) .084 (42) .17 (84)
a.
b.
Number of cells scored in parenthesis.
Indicates absolute frequency.
75
Table A-4. Frequency of aberrations for three regions of chromosomes D (13, 14, 15).
a Chromosome Region EMS Short Arm Centromere Long Arm (mM) (P) (C) (Q)
0 (150) .064 (7)
.01 (50) .72 (36) .04 (2)
2 (50) .98 (49) .14 (7)
4 (50) 1.00 (50) .02 (1) .06 (3)
6 (100) .79 (79) .14 (14)
8 (100) 1.65 (165) .02 (2) .15 (15)
Total (500)
Aberr. (430) .758 (386) .06 (3) .08 (41)
a. Number of cells scored in parenthesis.
b. Indicates absolute frequency.
76
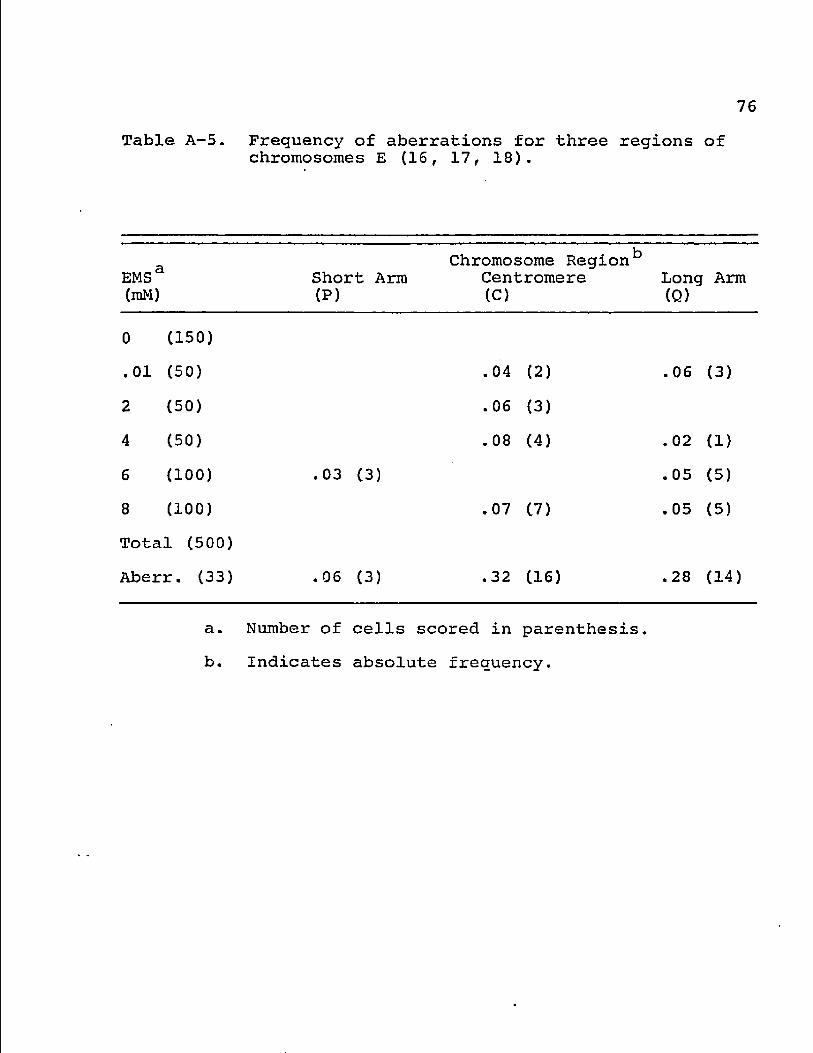
Table A-5. Frequency of aberrations for three regions of chromosomes E (16, 17, 18).
a
V-
Chromosome Region EMS Short Arm Centromere Long Arm (mM) (P) (C) (Q)
0 (150)
.01 (50) .04 (2) .06 (3)
2 (50) .06 (3)
4 (50) .08 (4) .02 (1)
6 (100) .03 (3) .05 (5)
8 (100) .07 (7) .05 (5)
Total (500)
Aberr. (33) .06 (3) .32 (16) .28 (14)
a. Number of cells scored in parenthesis.
b. Indicates absolute frequency.
77
Table A-6. Frequency of aberrations for three regions of chromosomes F (19, 20).
T_
Chromosome Region EMS a Short Arm Centromere Long Arm (lUM) (P) (C) (Q)
0 (150)
.01 (50) .02 (1)
2 (50) .08 (4)
4 (50) .02 (1) .08 (4)
6 (100) .02 (2) .02 (2)
8 (100) .02 (2) .03 (3)
Total (500)
Aberr. (19) .02 (1) .026 (13) .01 (5)
a.
b.
Number of cells scored in parenthesis.
Indicates absolute frequency.
78
Table A—7» Frequency of aberrations for three regions of chromosomes G (21, 22, Y).
a* Chromosome Region EMS Short Arm Centromere Long Arm (mM) (P) (C) (Q)
0 (150) .02 (3)
.01 (50) .24 (12)
2 (50) .42 (21)
4 (50) .44 (22)
6 (100) .29 (29) .01 (1) .01 (1)
8 (100) .42 (42) .02 (2) .02 (2)
Total (500)
Aberr. (135) .252 (129) .06 (3) .06 (3)
a. Number of cells scored in parenthesis.
b. Indicates absolute frequency.
APPENDIX B
DISTRIBUTION OF ABERRATION TYPES PER REGIONS CHROMOSOME GROUPS, A, B, C, D, E, F, AND G,
FOR DIFFERENT EMS CONCENTRATIONS
79
80
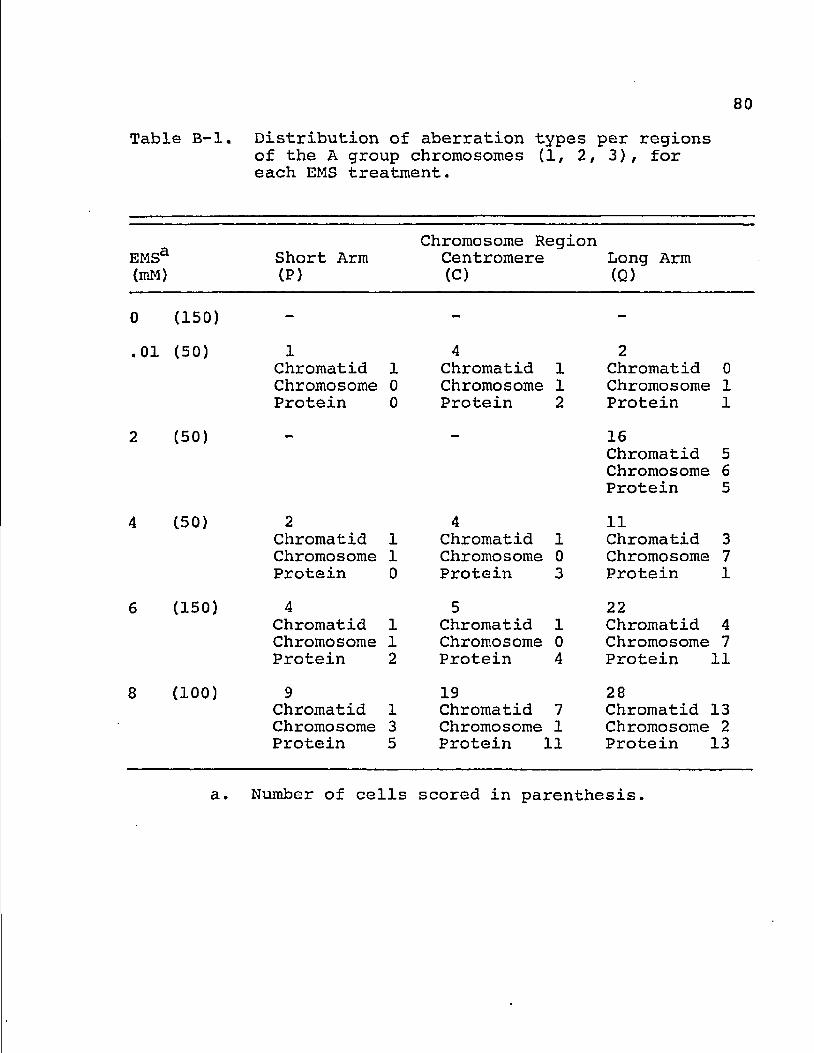
Table B-l. Distribution of aberration types per regions of the A group chromosomes (1, 2, 3), for each EMS treatment.
Chromosome Region EMSa Short Arm Centromere Long Arm (mM) (P) (C) (Q)
0 (150) - - -
.01 (50) 1 4 2 Chromatid 1 Chromatid 1 Chromatid 0 Chromosome 0 Chromosome 1 Chromosome 1 Protein 0 Protein 2 Protein 1
2 (50) — 16 Chromatid 5 Chromosome 6 Protein 5
4 (50) 2 4 11 Chromatid 1 Chromatid 1 Chromatid 3 Chromosome 1 Chromosome 0 Chromosome 7 Protein 0 Protein 3 Protein 1
6 (150) 4 5 22 Chromatid 1 Chromatid 1 Chromatid 4 Chromosome 1 Chromosome 0 Chromosome 7 Protein 2 Protein 4 Protein 11
8 (100) 9 19 28 Chromatid 1 Chromatid 7 Chromatid 13 Chromosome 3 Chromosome 1 Chromosome 2 Protein 5 Protein 11 Protein 13
a. Number of cells scored in parenthesis.
81
Table B-2. Distribution of aberration types per regions of the B group chromosomes (4, 5) for each EMS treatment.
-a Chromosome Region
EMS Short Arm Centromere Long Arm (mM) (P) (C) (Q)
0 (150) — - -
.01 (50) — 1 2 Chromatid 0 Chromatid 2 Chromosome 1 Chromosome 0 Protein 0 Protein 0
2 (50) — 5 5 Chromatid 1 Chromatid 5 Chromosome 4 Chromosome 0 Protein 0 Protein 0
4 (50) 1 2 5 Chromatid 1 Chromatid 2 Chromatid 4 Chromosome 0 Chromosome 0 Chromosome 1 Protein 0 Protein 0 Protein 0
6 (100) 2 2 12 Chromatid 0 Chromatid 0 Chromatid 5 Chromosome 2 Chromosome 1 Chromosome 2 Protein 0 Protein 1 Protein 5
8 (100) 4 8 16 Chromatid 3 Chromatid 8 Chromatid 6 Chromosome 1 Chromosome 0 Chromosome 3 Protein 0 Protein 0 Protein 7
a. Number of cells scored in parenthesis.
82
Table B-3. Distribution of aberration types per regions of the C group chromosomes (6, 7, 8, 9, 10, 11, 12, X) for each EMS treatment.
Chromosome Region EMSa Short Arm Centromere Long Arm (mM) (P) (C) (Q)
0 (150) 1 Chromatid 1 Chromosome 0 Protein 0
.01 (50) 1 2 6 Chromatid 1 Chromatid 2 Chromatid 3 Chromosome 0 Chromosome 0 Chromosome 1 Protein 0 Protein 0 Protein 2
2 (50) — 6 6 Chromatid 5 Chromatid 4 Chromosome 1 Chromosome 0 Protein 0 Protein 2
4 (50) 3 4 5 Chromatid 2 Chromatid 4 Chromatid 3 Chromosome 1 Chromosome 0 Chromosome 1 Protein 0 Protein 0 Protein 1
6 (100) 2 5 32 Chromatid 1 Chromatid 3 Chromatid 4 Chromosome 1 Chromosome 2 Chromosome 10 Protein 0 Protein 0 Protein 18
8 (100) 8 25 35 Chromatid 3 Chromatid 16 Chromatid 14 Chromosome 4 Chromosome 2 Chromosome 13! Protein 1 Protein 7 Protein 8
a. Number of cells scored in parenthesis.
83
Table B-4. Distribution of aberration types per region of the D group chromosomes (13, 14, 15) for each EMS treatment.
a Chromosome Region EMS Short Arm Centromere Long Arm (mM) (P) (C) (Q)
0 (150) 7 —
Chromatid 0 Chromosome 0 Protein 7
.01 (50) 36 — 2 Chromatid 0 Chromatid 0 Chromosome 0 Chromosome 1 Protein 36 Protein 1
2 (50) 49 — 7 Chromatid 0 Chromatid 4 Chromosome 0 Chromosome 0 Protein 49 Protein 3
4 (50) 50 1 3 Chromatid 0 Chromatid 1 Chromatid 0 Chromosome 0 Chromosome 0 Chromosome 1 Protein 50 Protein 0 Protein 2
6 (100) 79 — 14 Chromatid 2 Chromatid 5 Chromosome 0 Chromosome 4 Protein 77 Protein 5
8 (100) 165 2 15 Chromatid 0 Chromatid 0 Chromatid 5 Chromosome 0 Chromosome 1 Chromosome 9 Protein 165 Protein 1 Protein 1
a. Number of cells scored in parenthesis.
84
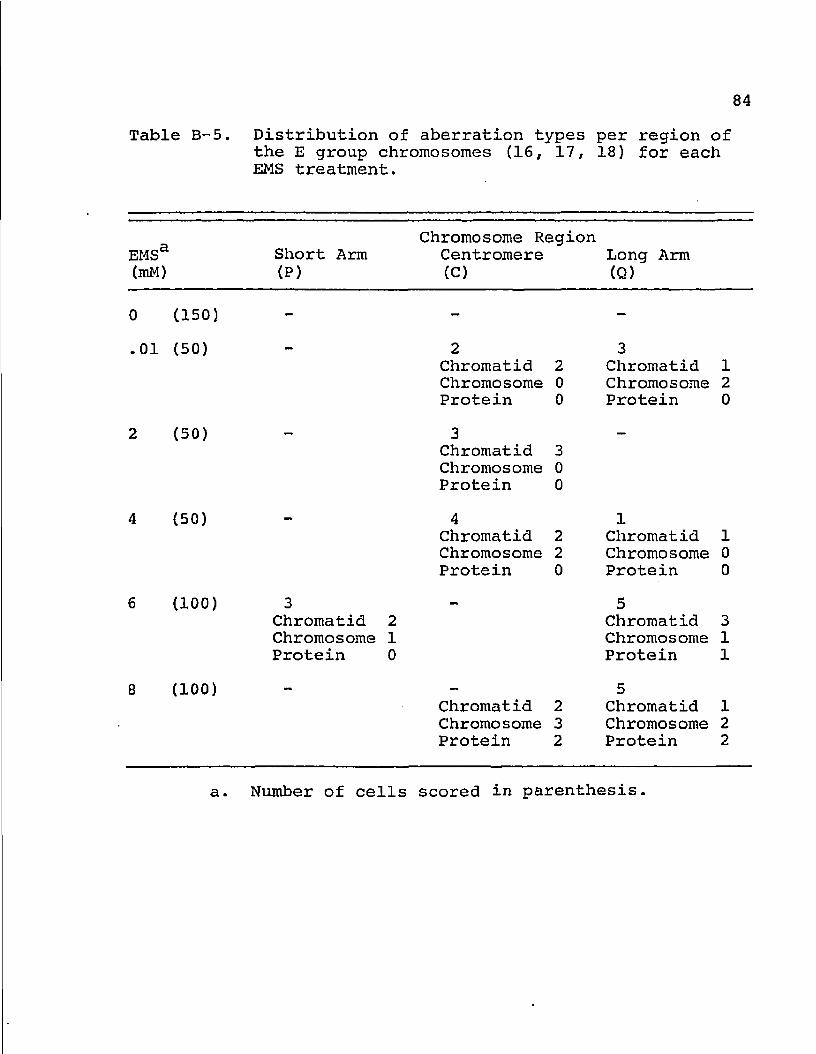
Table B-5. Distribution of aberration types per region of the E group chromosomes (16, 17, 18) for each EMS treatment.
Chromosome Region EMSa Short Arm Centromere Long Arm (mM) (P) (C) (Q)
0 U50) - - -
.01 (50) — 2 3 Chromatid 2 Chromatid 1 Chromosome 0 Chromosome 2 Protein 0 Protein 0
2 (50) 3 —
Chromatid 3 Chromosome 0 Protein 0
4 (50) — 4 1 Chromatid 2 Chromatid 1 Chromosome 2 Chromosome 0 Protein 0 Protein 0
6 (100) 3 5 Chromatid 2 Chromatid 3 Chromosome 1 Chromosome 1 Protein 0 Protein 1
8 (100) — — 5 Chromatid 2 Chromatid 1 Chromosome 3 Chromosome 2 Protein 2 Protein 2
a. Number of cells scored in parenthesis.
85
Table B-6. Distribution of aberration types per region of the F group chromosomes (19/ 20) for each EMS treatment.
a Chromosome Region EMS Short Arm Centromere Long Arm (mM) (P) (c) (Q)
0 (150) - - -
.01 (50) — 1 —
Chromatid 1 Chromosome 0 Protein 0
2 (50) — 4 —
Chromatid 4 Chromosome 0 Protein 0
4 (50) 1 4 —
Chromatid 0 Chromatid 4 Chromosome 1 Chromosome 0 Protein 0 Protein 0
6 (100) — 2 2 Chromatid 1 Chromatid 2 Chromosome 1 Chromosome 0 Protein 0 Protein 0
8 (100) — 2 3 Chromatid 1 Chromatid 0 Chromosome 0 Chromosome 3 Protein 1 Protein 0
a. Number of cells scored in parenthesis.
86
Table B-7. Distribution of aberration types per region of the G group chromosomes (21, 22, Y) for each EMS treatment.
Chromosome Region EMS Short Arm Centromere Long Arm (mM) (P) (C) (Q)
0 (150) Chromatid 0 Chromosome 0 Protein 3
.01 (50) 12 Chromatid 0 Chromosome 0 Protein 12
2 (50)
4 (50)
6 (100)
8 (100)
21 Chromatid 0 Chromosome 0 Protein 21
22 Chromatid 0 Chromosome 0 Protein 22
29 Chromatid 0 Chromosome 0 Protein 29
42 Chromatid 0 Chromosome 0 Protein 42
Chromatid 0 Chromosome 0 Protein 1
Chromatid 2 Chromosome 0 Protein 0
Chromatid 1 Chromosome 0 Protein 0
Chromatid 1 Chromosome 1 Protein 0
a. Number of cells scored in parenthesis.
REFERENCES
Amaldi, F. and G. Attardi. 1968. Partial sequence analysis of ribosomal RNA from HeLa cells. I. Oligonucleotide pattern of 28S and 18S RNA after pancreatic ribonuclease digestion. J. Mol. Biol. 33: 737-756.
Amano, Etsuo. 1968. Comparison of Ethyl methane-sulfonate and radiation-induced waxy mutants in maize. Mutat. Res. _5: 41-46.
Arakaki, D. T. and R. S. Sparkes. 1963. Microtechnique for culturing leukocytes from whole blood. Cytogenetics 2i 57-6 0.
Barr, Ronald D., J. Whang-Peng, and S. Perry. 1975. Hemopoietic stem cells in human peripheral blood. Science 190: 284-285.
Bautz, E. and E. Freese. 1960, On the mutagenic effect of alkylating agents. Proc. Nat. Acad. Sci. 46: 1585-1594.
Beek, B. and G. Obe. 1974. The human leukocyte test system. II. Different sensitivities of sub-populations to a chemical mutagen. Mutat. Res. 24: 395-398.
Bender, M. A. and J. G. Brewen. 1969. Factors influencing chromosome aberration yields in the human peripheral leukocyte system. Mutat. Res. £: 3 83-399.
Bender, M. A. and D. M. Prescott. 1962. DNA synthesis and mitosis in cultures of human peripheral leukocytes. Exp. Cell Res. 27_: 221-229.
Bochkov, N. P. 1972. Spontaneous chromosome aberrations in human somatic cells. Humangenetik L6: 159-164.
Bodor, F., B. Dahlerus, T. Gustafsson, C. H. Hakansson, and A. Levan. 1974. A method for the mathematical study of the stained mass of the chromosomes. Hereditas 77: 63-72.
87
88
Bonner, J., M. E. Dahmus, D. Fambrough, R. C. Huang, K. Marushige, and D. Y. Tuan. 196 8. The biology of isolated chromatin. Science 159: 47-56.
Brewen, J. G. and N. Gengozian. 1971. Radiation-induced human chromosome aberrations. II. Human in vitro irradiation compared to in vitro and in vivo irradiation in marmoset leukocytes. Mutat. Res. 13: 383-391.
Brogger, A. 1971. Apparently spontaineous chromosome damage in human leukocytes and the nature of chromatid gaps . Humangenetik 13_: 1-14 .
Brogger, A. 1974. Different patterns of chromosome exchange induced by methyl-methanesulphonate and mitomycin C in human cells. Hereditas 11_\ 205-208.
Brookes, P. and P. D. Lawley. 1961. The reaction of mono-and di-functional alkylating agents with nucleic acids. Biochem. J. 80^: 496-503.
Brown, D. D. and C. S. Weber. 1968. Gene linkage by RNA-DNA hybridization. II. Arrangement of the redundant gene sequences for 21S and 18S rRNA. J. Mol * Biol. 3_4: 681-698.
Brown, R. L., S. Pathak, and T. C. Hsu. 1975. The possible role of histones in the mechanism of chromosomal G banding. Science 189: 1090-1091.
Caspersson, T. 1973. Procedures for the study of the reproducibility of normal mammalian banding patterns and for analysis of aberrant chromosome patterns. In: Chromosome Identification. (T. Caspersson and L. Zech, eds.) pp. 50-55. New York, London: Academic Press.
Caspersson, T., G. Lomakka, and A. Moller. 1971. Computerized chromosome identification by aid of the quinacrine mustard fluorescence technique. Hereditas 6_7: 103-110.
Caspersson, T., G. Lomakka, and L. Zech. 1971. The 24 fluorescence patterns of the human metaphase chromosomes-distinguishing characters and variability. Hereditas 67: 89-102,
89
Cave, M. D. 196 6. Incorporation of 3H-labeled thymidine and lysine into chromosomes of cultured human leukocytes. J. Cell Biol. 29: 209-222.
Chang, T. H. and F. T. Elequin. 1967. Induction of chromosome aberrations in cultured human cells by ethylenimine and its relation to cell cycle. Mutat. Res. 83-89.
Chourey, P. S. and D. Schwartz. 1971. Ethyl methane-sulfonate-induced mutations of the SHI protein in maize. Mutat. Res. 12_: 151-157.
Chu, E. H. Y., and H. V. Mailing. 1968. Mammalian Cell Genetics. Genetics 61_: 1306-1312.
Clive, D., W. G. Flamm, M. R. Machesko and N. J. Bernhim. 1972. A mutational assay system using thymidine kinase locus in mouse lymphoma cells. Mutat. Res. L6: 77-87.
Comings, D. E. 1975. Mechanism of chromosome banding. IV. Optical properties of the Giemsa dyes. Chromosoma 5_0: 89-110.
Comings, D. E. and E. Avelino. 1974. Mechanism of chromosome banding. II. Evidence that histones are not involved. Exp. Cell Res. 8j6: 202-206.
Comings, D. E., E. Avelino, T. A. Okada and H. E. Wyandt. 1973. The mechanism of C- and G-banding of chromosomes. Exp. Cell. Res. 7J7: 46 9-493.
Davis, J. R., and E. M. Lavor. 1976. Closed circuit television in cytogenetics. J. Ariz. Acad. Sci. 11: 54-55 Csuppl).
Disteche, C. and J. Bontemps. 1976. Method for the determination of mean densitometric profiles of chromosomes. Chromosoma _54: 39-59.
Dudin, G., B. Beek, and G. Obe. 1974. The human leukocyte test system. I. DNA synthesis and mitosis in PHA-stimulated 2-day cultures. Mutat. Res. 23: 279-281.
Ehling, U. H., R. B. Cumming, and H. V. Mailing. 1968. Induction of dominant lethal mutations by alkylating agents in male mice. Mutat. Res. _5: 417-428.
90
Engle, J. B. 1972. A comparison of in vivo and in vitro alkylation by ethyl methanesulfonate in Vicia faba. M.A. Thesis, University of Arizona.
Evans, H. J., R. A. Buckland, M. L. Pardue. 1974. Location of the genes coding for 18S and 28S ribosomal RNA in the human genome. Chromosoma 4_8_: 405-426.
Evans, H. J. and M. L. O'Riordan. 1975. Human peripheral blood lymphocytes for the analysis of chromosome aberrations in mutagen tests. Mutat. Res. 31: 135-148.
Evans, R. A. and A. Norman. 1968. Unscheduled incorporation of thymidine in ultraviolet-irradiated human lymphocytes. Radiat. Res. 36_: 287-298.
Fahmy, O. G. and M. J, Fahmy. 1957. Mutagenic response to the alkyl methanesulfonates during supermato-genesis in Drosophila melanogaster. Nature 180; 31-34.
Fan, H. and S. Penman. 1971. Regulation of synthesis and processing of nucleolar components in metaphase arrested cells. J. Mol. Biol. S9: 27-42.
Ferguson-Smith, M. A. and S. D. Handmaker. 1963. The association of satellited chromosomes with specific chromosomal regions in cultured human somatic cells, Ann. Human Genet. _27: 143-156.
Forsdyke, D. R. 1973. Serum and lymphocyte activation by phytohaemagglutinin (PHA). Exp. Cell Res. 77; 216-222.
Freese, E. B. 1961. Transitions and transversions induced by depurinating agents. Proc. Nat. Acad. Sci. 47: 540-545.
Froese-Gertzen, E. E., C. F. Konzak, R. Foster, R. A. Nilan. 1963. Correlation between some chemical and biological reactions of ethyl methanesul-phonate. Nature 198 : 447-448.
Funes-Cravioto, F., K. H. Yakovienko, N. P. Kuleshov, and V. S. Zhurkov. 1974. Localization of chemically induced breaks in chromosomes of human leucocytes. Mutat. Res. 23: 87-105.
91
Goodpasture, C. and S. Bloom. 1975. Visualization of nucleolar organizer regions in mammalian chromosomes using silver staining, Chromosoma 53: 37-50.
Gormley, I, P. and A. Ross. 1976. Studies on the relationship of a collapsed chromosomal morphology to the production of Q- and G-bands. Exp. Cell Res. 9£: 152-158.
Granlund, G. H. 19 73. The use of distribution functions to describe integrated profiles of human chromosomes. In; Chromosome identification. (T. Caspersson and L. Zech, eds.) pp. 85-87. New York: Academic Press.
Haber, J., W. Rosenau, and M. Goldberg. 1972. Separate factors in phytohaemagglutinin induce lymphotoxin, interferon, and nucleic acid synthesis. Nature New Biol. 2381: 60-61.
Haddow, A. and W. C. Ross. 1956. Tumor growth-inhibitory alkyl sulphonates. Nature 177: 995-996,
Henderson, A. S., D. Warburton, and K. C. Atwood. 1972. Location of ribosomal DNA in the human chromosome complement. Proc. Nat. Acad. Sci. 6_9: 3394-3398.
Holmberg, M. and J. Jonasson. 1973. Preferential location of x-ray induced chromosome breakage in the R-bands of human chromosomes. Hereditas 74: 57-68.
Hrushesky, W. , D. Sampson, and G.! P. Murphy. 1972. Carcinogenicity of ethyl methanesulfonate. J. Nat. Cancer Inst. 4_9_: 1077-1083.
Hsu, T. C., S. Pathak, and D. A. Shafer. 1973. Induction of chromosome crossbanding by treating cells with chemical agents before fixation. Exp, Cell Res. 79: 484-487.
Hsu, T. C., S. E. Spirito and M. L. Pardue. 1975. Distribution of the 18 and 28S ribosomal genes in mammalian genomes. Chromosoma 53^: 25-36.
Jackson, H. 1970. Antispermatogenic agents. Brit. Med. Bull. 26: 79-86.
92
Jackson, H., B. W. Fox and A. W. Craig, 1961. Anti-fertility substances and their assessment in the male rodent. J. Reprod. Fert. 2^: 447-465.
Kaplan, H. S. and S. A. Rosenberg. 1975. Hodgkin's Disease: current recommendations for management. Cancer-A Journal for Clinicians 2_5: 306-319.
Kato, H. and K. Moriwaki. 1972. Factors involved in the production of banded structures in mammalian chromosomes. Chromosoma 38_: 105-120.
Kitchin, R. and E. J. Loudenslager. 1976. An in vivo Giemsa chromosome banding technique. Stain Technol. 50: 371-374.
Kohler, W. C., I. Karacan and 0. M. Rennert. 1972. Circadian variation in RNA in human leukocytes. Nature 238: 94-96.
Krakoff, I. H. 1971. Growth-inhibiting drugs. In: Drill's Pharmacology in Medicine, Section 73. (J. DiPalma, ed.) pp. 1587-1628. San Francisco: McGraw-Hill Book Company.
Krieg, D. R. 1963. Ethyl methanesulfonate-induced reversions of bacteriophage T4 rll mutants. Genetics 4J3: 561-580.
Lawley, P. D. 1974. Some chemical aspects of dose-response relationships in alkylation mutagenesis. Mutat. Res. 23^ 283-295.
Lim, J. K. and L. A. Snyder. 1968. The mutagenic effects of two monofunctional alkylating chemicals on mature spermatozoa of Drosophila. Mutat. Res. 6: 129-137.
Ling, N. R. 1968. Lymphocyte stimulation. pp. 175, 201, 286. (N. R. Ling, ed.) New York: John Wiley and Sons, Inc.
London Conference (1963). Birth Defects Original Article Series. The National Foundation Vol. 2, No, 2 (1966).
93
Loveless, A. 1958. Increased rate of plaque-type and host-range mutations following treatment of bacteriophage in vitro with ethyl methanesulphonate. Nature 181: 1212-1213.
Matsui, S. and M. Sasaki. 1973. Differential staining of nucleolus organizers in mammalian chromosomes. Nature 246: 148-150.
Matter, B. E. and J. Grauwiler. 1974. Micronuclei in mouse bone-marrow cells. Mutat. Res. 23^: 239-249.
Moorhead, P, S., P. C. Nowell, W. J. Mellman, D. M. Battips, and D. A. Hungerford. 196 0. Chromosome preparations of leukocytes cultured from human peripheral blood. Exp. Cell Res. 2j0: 613-616.
Morad, M., J. Jonasson and J. Lindsten. 1973. Distribution of mitomycin C induced breaks on human chromosomes. Hereditas 7_4: 273-282.
Natarajan, A. T. and M. D. Upadhya. 1964. Localized chromosome breakage induced by ethyl methane-sulfonate and hydroxylamine in Vicia faba. Chromosome 1E>: 156-169.
Nesbitt, M. N. 1974. Evolutionary relationships between rat and mouse chromosomes. Chromosoma 46_: 217-224.
Nicoloff, H. 1974. Effects of sodium acetate and sodium chloride on EMS induced chlorophyll mutations in barley. Mutat. Res. 23: 57-62.
Nilsson, B. 1973. A bibliography of literature concerning chromosome identification with special reference to fluorescence, Giemsa staining techniques. Hereditas 13_i 259-270.
Nowell, P. C. 1960, Phytohemagglutinin; an initiator of mitosis in culture of normal human leukocytes. Cancer Res. 20^: 462-466.
Paris Conference (1971). Standardization in Human Cytogenetics. Birth Defects Original Article Series. The National Foundation Vol. 8, No. 7 (1972).
Pearson, P. 1972. The use of the new staining techniques for human chromosome identification. J. Med. Genet. 9: 264-275.
94
phillips, A. and B. Roitt. 1973. Evidence for transformation of human B lymphocytes by PHA. Nature 241; 254-256.
Prescott, D. M. 1974. Regulation of DNA replication in eukaryotic cells. Seminar presented Feb. 11-13, College of Medicine, University of Arizona.
Rasmussen, R. E. and R. B. Painter. 1964. Evidence for repair of ultra-violet damaged deoxyribonucleic acid in cultured mammalian cells. Nature 203; 1360-1362.
Richardson, J. P. 1969. Progress in nucleic acid research and molecular biology. (J. Cavidson and W. Cohn, eds.) pp. 75-90. New York: Academic Press.
Rieger, E. and U. A. Michaelis. 1960. Chromatiden-aberrationen nach einwirkung von aethyl-methane-sulfonat (methanesulfonsaur aethylester) auf primarwurzwln von Vicia faba L. Kulturpflanze 8: 230-243.
Rowley, J. D. 1973. A new consistent chromosomal abnormality in chronic myelogenous leukemia identified by guinacrine fluorescence and Giemsa staining. Nature 243: 290.
Shall, S. 1973. Cells at defined stages of the cell cycle. In: Tissue Culture. (P. F. Kruse and M. K. Patterson, eds.) pp. 195-204. New York: Academic Press.
Shapiro, I. M. and L. Y. Levina. 1968. Incorporation of proteins labeled with ^h-lysine into chromosomes of human leukocytes cultured in vitro. Chromosoma 25: 30-39.
Shaw, M. W. 1961. Association of acrocentric chromosomes with the centromere region of chromosome No. 1. Lancet i: 1351-1352.
Shaw, M. W., L. E. Schwab, and B. R. Brinkley. 1972. Electron microscopy of human chromosomes. In: Perspectives in cytogenetics. (S. W. Wright, B. F. Crandall, and L. Bayer, eds.) pp. 251-282. Springfield, Illinois: Charles C. Thomas.
95
Stefanescu, D. T., M. Teodorescu, S. I. Popescu, and J, Brucher. 1972, Lack of recovery from radiation induced chromosome damage in G human lymphocytes. Exp. Cell Res, 71: 156-160.
Steffensen, D. M. and P. Duffey. 1974. Localisation of 5S ribosomal RNA genes on human chromosome 1. Nature 252: 741-743.
Stein, G. S., T. C. Spelsberg and L. J. Kleinsmith. 1974. Nonhistone chromosomal proteins and gene regulation. Science 183: 817-824.
Toms, G. C. and A. Western. 1971. Phytohaemagglutinins. In: Chemotaxonomy of the leguminosae. (J. G. Harborne, D. Boulter and B. L. Turner, eds.) pp. 367-456. New York: Academic Press.
Ward, 0. G. 1966. The nature of chromosome breakage induced by ethyl methanesulfonate in Vicia faba. Ph. D. Dissertation, Purdue University.
Ward, O. G. and V. M. Young. 1974. Mutagen induced bands in human chromosomes. J. Colo.-Wyo. Acad. Sci. ]_i 82.
Weintraub, H., K. Palter and F. Van Lente. 1975. Histones H2a, H2b, H3, and H4 form a tetrameric complex in solutions of high salt. Cell 6: 85-110.