8
Xgig®1000 16 G Fibre Channel and 10 G Ethernet Portable Analysis and Test Platform Comprehensive multiprotocol analysis, load testing, and error injection for all SAN/NAS technologies
Xgig®1000 16 G Fibre Channel and 10 G Ethernet Portable Analysis and Test Platform
Comprehensive multiprotocol analysis, load testing, and error injection for all SAN/NAS technologies
2
Comprehensive multiprotocol analysis, load testing, and error injection for all SAN/NAS technologies
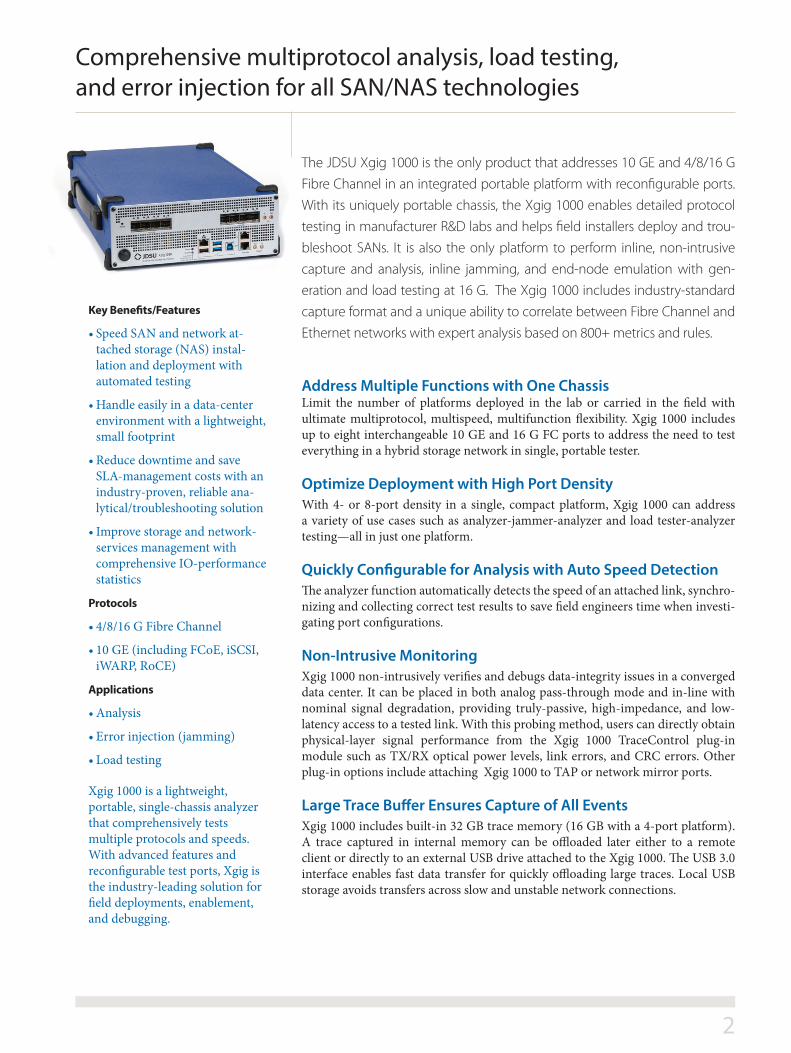
The JDSU Xgig 1000 is the only product that addresses 10 GE and 4/8/16 G Fibre Channel in an integrated portable platform with reconfigurable ports. With its uniquely portable chassis, the Xgig 1000 enables detailed protocol testing in manufacturer R&D labs and helps field installers deploy and trou-bleshoot SANs. It is also the only platform to perform inline, non-intrusive capture and analysis, inline jamming, and end-node emulation with gen-eration and load testing at 16 G. The Xgig 1000 includes industry-standard capture format and a unique ability to correlate between Fibre Channel and Ethernet networks with expert analysis based on 800+ metrics and rules.
Address Multiple Functions with One ChassisLimit the number of platforms deployed in the lab or carried in the field with ultimate multiprotocol, multispeed, multifunction flexibility. Xgig 1000 includes up to eight interchangeable 10 GE and 16 G FC ports to address the need to test everything in a hybrid storage network in single, portable tester.
Optimize Deployment with High Port DensityWith 4- or 8-port density in a single, compact platform, Xgig 1000 can address a variety of use cases such as analyzer-jammer-analyzer and load tester-analyzer testing—all in just one platform.
Quickly Configurable for Analysis with Auto Speed DetectionThe analyzer function automatically detects the speed of an attached link, synchro-nizing and collecting correct test results to save field engineers time when investi-gating port configurations.
Non-Intrusive MonitoringXgig 1000 non-intrusively verifies and debugs data-integrity issues in a converged data center. It can be placed in both analog pass-through mode and in-line with nominal signal degradation, providing truly-passive, high-impedance, and low-latency access to a tested link. With this probing method, users can directly obtain physical-layer signal performance from the Xgig 1000 TraceControl plug-in module such as TX/RX optical power levels, link errors, and CRC errors. Other plug-in options include attaching Xgig 1000 to TAP or network mirror ports.
Large Trace Buffer Ensures Capture of All EventsXgig 1000 includes built-in 32 GB trace memory (16 GB with a 4-port platform). A trace captured in internal memory can be offloaded later either to a remote client or directly to an external USB drive attached to the Xgig 1000. The USB 3.0 interface enables fast data transfer for quickly offloading large traces. Local USB storage avoids transfers across slow and unstable network connections.
Key Benefits/Features
Speed SAN and network at-tached storage (NAS) instal-lation and deployment with automated testing
Handle easily in a data-center environment with a lightweight, small footprint
Reduce downtime and save SLA-management costs with an industry-proven, reliable ana-lytical/troubleshooting solution
Improve storage and network-services management with comprehensive IO-performance statistics
Protocols
4/8/16 G Fibre Channel
10 GE (including FCoE, iSCSI, iWARP, RoCE)
Applications
Analysis
Error injection (jamming)
Load testing
Xgig 1000 is a lightweight, portable, single-chassis analyzer that comprehensively tests multiple protocols and speeds. With advanced features and reconfigurable test ports, Xgig is the industry-leading solution for field deployments, enablement, and debugging.
3
Comprehensive multiprotocol analysis, load testing, and error injection for all SAN/NAS technologies
Easily Access and Control Testing with Remote Management (Ethernet/USB)Xgig 1000 can be remotely managed through 10/100/1000 Mbps Ethernet connec-tions. Field engineers and IT admins can also easily access Xgig 1000 in the field with a USB 2.0 Type B interface, letting the client PC connect directly to the unit to access platform status and update firmware and licenses.
API for Advanced Automation and Easy Integration with Existing SystemsThe platform includes an API library (both C/C++ and TCL) and supports all functions. The API lets users script and automate sophisticated functions, empowering users at all levels to run complex tests with a few button clicks. Users become instant experts with the equipment and the protocols. The API integrates seamlessly with in-house and commercial management consoles that can control and manage equipment and directly retrieve test results. This provides the consoles with access to sophisticated SAN metrics and KPIs.
Optimize Resources with Multiuser SharingUnique Xgig multiuser capabilities deliver the greatest flexibility and the most efficient use of equipment. Multiple users can control different port pairs on one hardware blade to simultaneously conduct separate tests. Up to 32 concurrent users can access locked ports to view test status or data at any time.
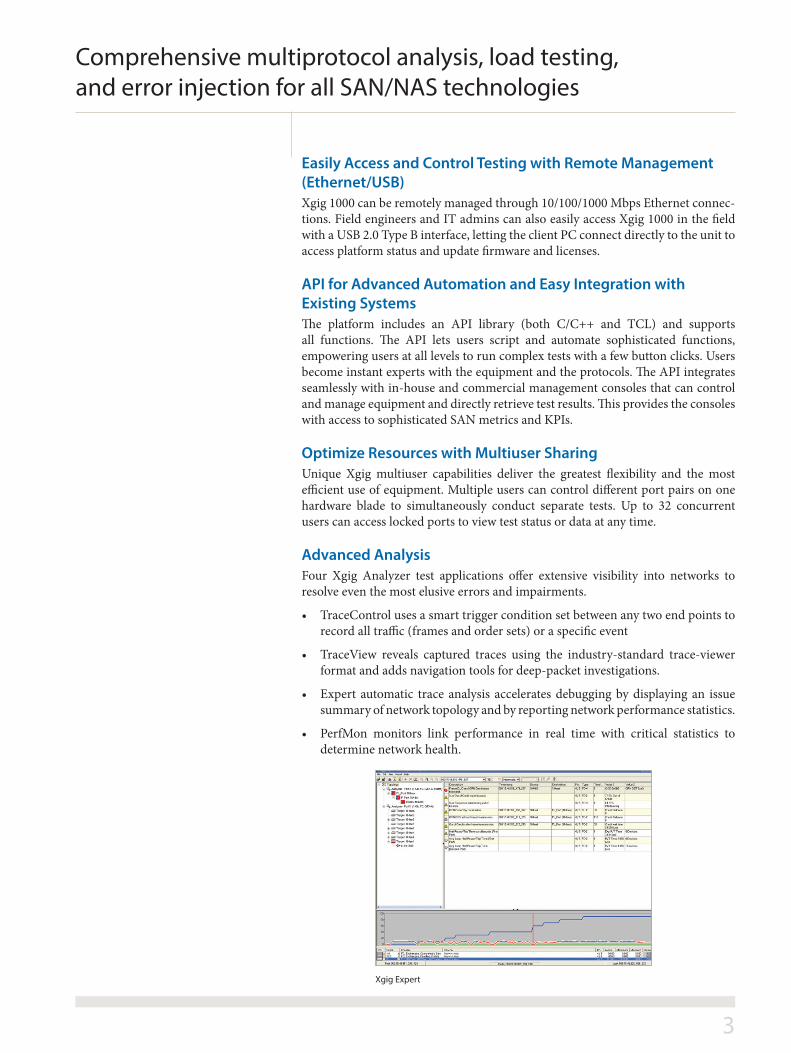
Advanced AnalysisFour Xgig Analyzer test applications offer extensive visibility into networks to resolve even the most elusive errors and impairments.
TraceControl uses a smart trigger condition set between any two end points to record all traffic (frames and order sets) or a specific event
TraceView reveals captured traces using the industry-standard trace-viewer format and adds navigation tools for deep-packet investigations.
Expert automatic trace analysis accelerates debugging by displaying an issue summary of network topology and by reporting network performance statistics.
PerfMon monitors link performance in real time with critical statistics to determine network health.
Xgig Expert
4
Comprehensive multiprotocol analysis, load testing, and error injection for all SAN/NAS technologies
Analyzer Key FeaturesExtensive Xgig capabilities and flexibility provide unmatched visibility into networks to simplify problem identification and resolution, accelerate new product design, and speed time-to-market. Features include:
Largest trace capture buffers — captures up to 4 GB of traffic per port—up to 32 GB per blade, giving developers enough trace data to resolve even the most elusive problems
Performance measurements — graphically displays useful performance statistics for every active link
Hidden non-relevant data — preset filter order hides traffic-control primitives to only display data so developers can focus on specific frames or packets
Adjustable payload size — reduces trace size to capture extra frame-header information by truncating payloads/frames
Drag-and-drop filters — simplifies filter setup with pre-defined protocol templates
Exchange view — summarizes trace by exchanges
Traffic summary view — provides top-level event information in the trace buffer within seconds
Protocol view — lets users focus on a specific protocol layer
Customized filters — Filters template editor lets users create user-defined protocol templates for advanced filtering
SCSI Expert view — simplifies trace analysis by collapsing exchanges and associated behavioral information into a single event in the Data Inspector pane
Protocol tree view — displays the tree structure of data when it is mapped to the current protocol
Histogram view — lets users focus on small areas of a trace, change the appearance and scale of graphs, and show/hide traces
DWORD view — provides a detailed view for each line of the TraceView Summary view
Filter/search/hide tool — simplifies the display and lets users access specific events quicker than any tool available
5
Comprehensive multiprotocol analysis, load testing, and error injection for all SAN/NAS technologies
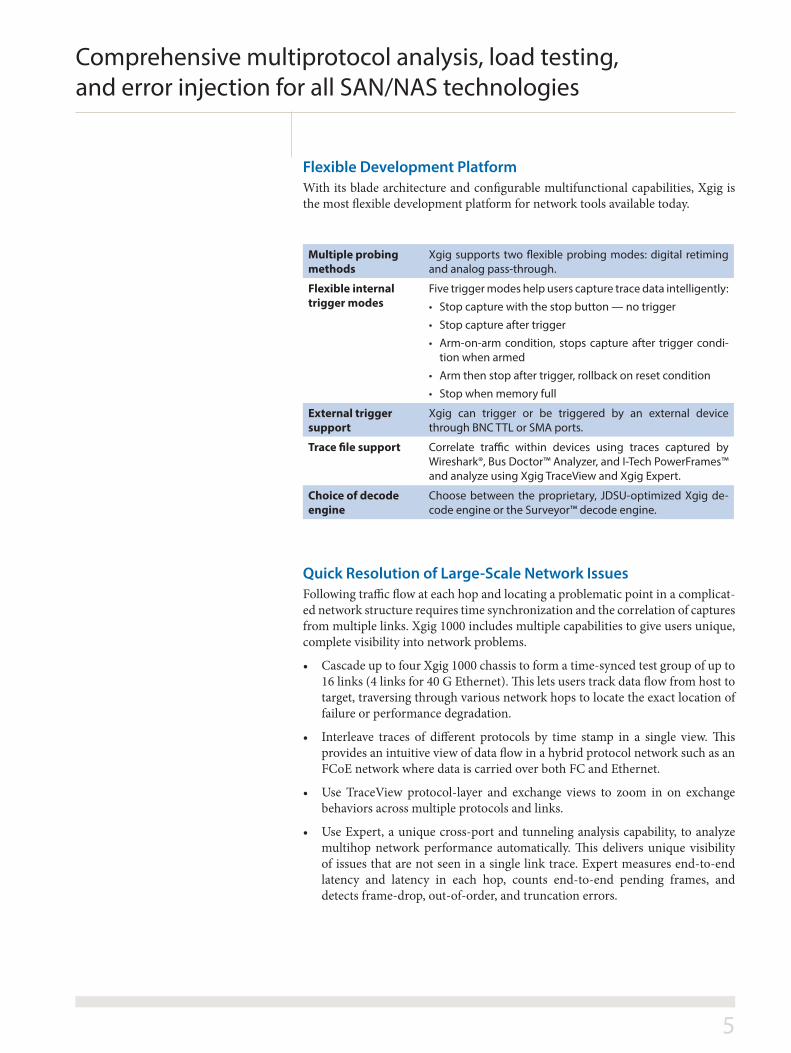
Flexible Development PlatformWith its blade architecture and configurable multifunctional capabilities, Xgig is the most flexible development platform for network tools available today.
Multiple probing methods
Xgig supports two flexible probing modes: digital retiming and analog pass-through.
Flexible internal trigger modes
Five trigger modes help users capture trace data intelligently:
• Stop capture with the stop button — no trigger
• Stop capture after trigger
• Arm-on-arm condition, stops capture after trigger condi-tion when armed
• Arm then stop after trigger, rollback on reset condition
• Stop when memory full
External trigger support
Xgig can trigger or be triggered by an external device through BNC TTL or SMA ports.
Trace file support Correlate traffic within devices using traces captured by Wireshark®, Bus Doctor™ Analyzer, and I-Tech PowerFrames™ and analyze using Xgig TraceView and Xgig Expert.
Choice of decode engine
Choose between the proprietary, JDSU-optimized Xgig de-code engine or the Surveyor™ decode engine.
Quick Resolution of Large-Scale Network IssuesFollowing traffic flow at each hop and locating a problematic point in a complicat-ed network structure requires time synchronization and the correlation of captures from multiple links. Xgig 1000 includes multiple capabilities to give users unique, complete visibility into network problems.
Cascade up to four Xgig 1000 chassis to form a time-synced test group of up to 16 links (4 links for 40 G Ethernet). This lets users track data flow from host to target, traversing through various network hops to locate the exact location of failure or performance degradation.
Interleave traces of different protocols by time stamp in a single view. This provides an intuitive view of data flow in a hybrid protocol network such as an FCoE network where data is carried over both FC and Ethernet.
Use TraceView protocol-layer and exchange views to zoom in on exchange behaviors across multiple protocols and links.
Use Expert, a unique cross-port and tunneling analysis capability, to analyze multihop network performance automatically. This delivers unique visibility of issues that are not seen in a single link trace. Expert measures end-to-end latency and latency in each hop, counts end-to-end pending frames, and detects frame-drop, out-of-order, and truncation errors.
6
Comprehensive multiprotocol analysis, load testing, and error injection for all SAN/NAS technologies
Error Injection/JammingUsed in conjunction with one or more Xgig Analyzers, Xgig Jammer manipulates network traffic to simulate errors in real time so users can verify the responsiveness and robustness of error-recovery processes. Errors can be precisely defined and timed to thoroughly test networks and automate the testing process.
FC/FCoE Load TestingFibre Channel and FCoE switches and networks must withstand sustained bursts of traffic without losing data. Xgig Load Tester loads Fibre Channel and FCoE links to capacity to verify that they can adequately manage high-traffic loads, maintain-ing network performance and reliability.
7
Comprehensive multiprotocol analysis, load testing, and error injection for all SAN/NAS technologies
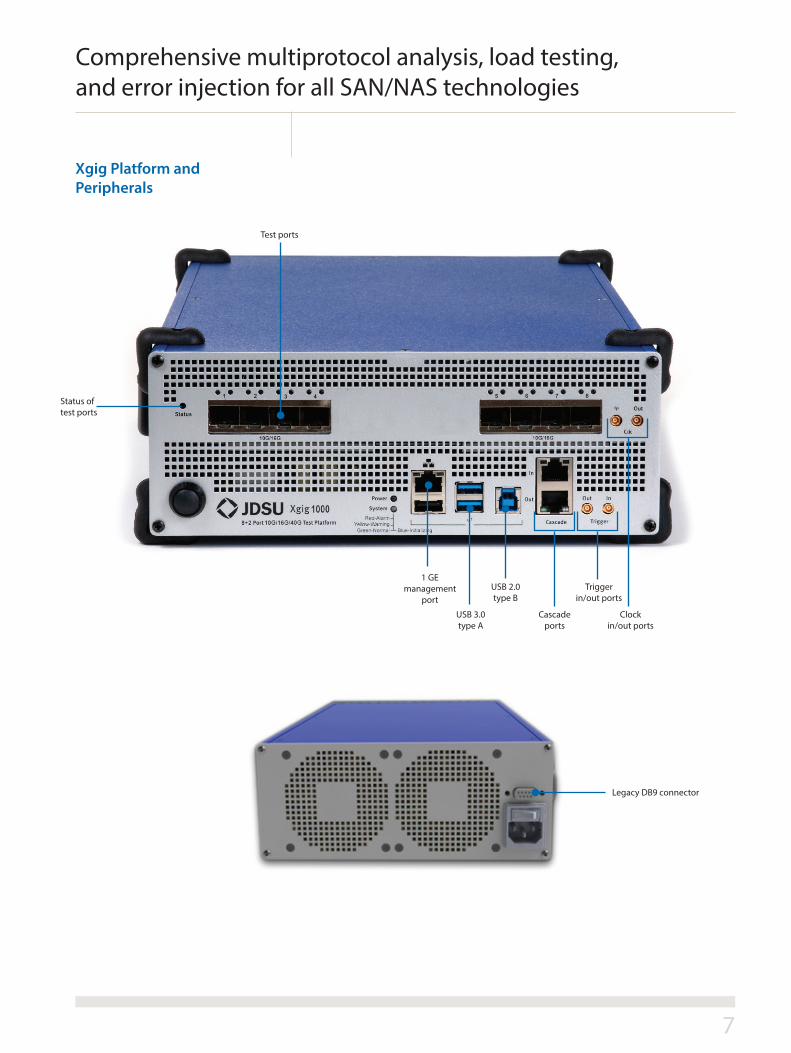
Legacy DB9 connector
Trigger in/out ports
Clock in/out ports
Test ports
Status of test ports
Cascade ports
USB 2.0 type B
1 GEmanagement
port
USB 3.0 type A
Xgig Platform and Peripherals
Product specifications and descriptions in this document subject to change without notice. © 2013 JDS Uniphase Corporation 30173425 000 0413 XGIG1000.BRO.SNT.TM.AE April 2013
Test & Measurement Regional Sales
NORTH AMERICATEL: 1 888 746 [email protected]
ASIA [email protected]
WEBSITE: www.jdsu.com/snt
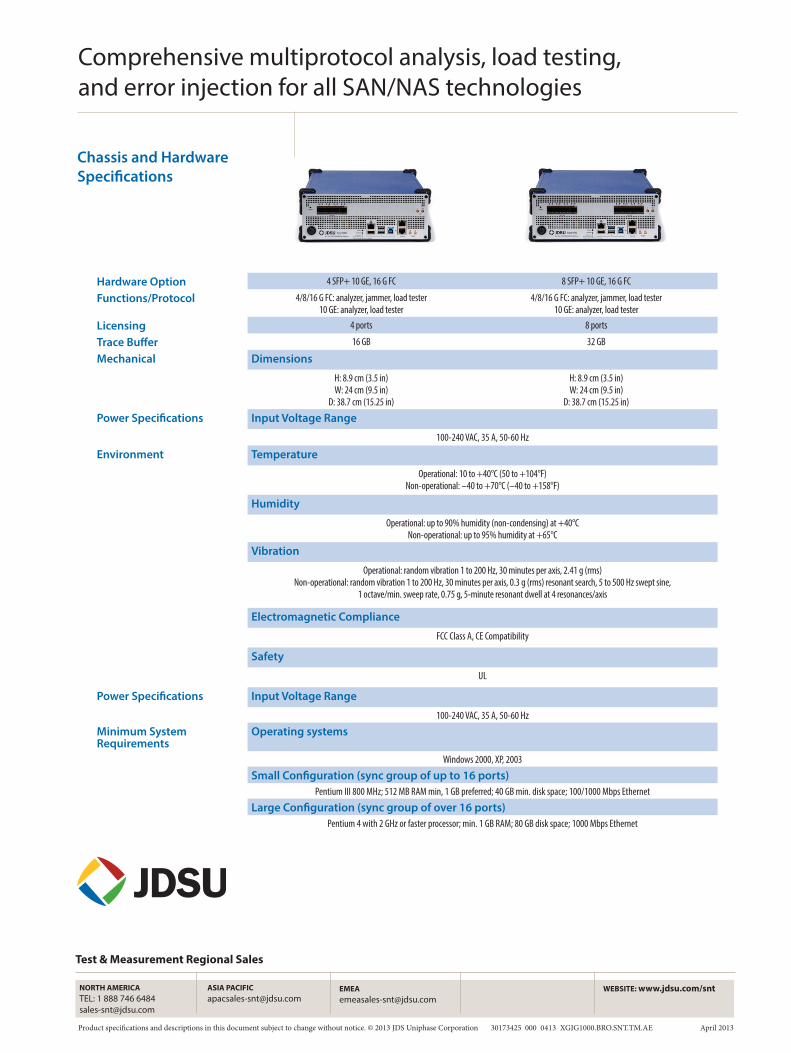
Hardware Option 4 SFP+ 10 GE, 16 G FC 8 SFP+ 10 GE, 16 G FC
Functions/Protocol 4/8/16 G FC: analyzer, jammer, load tester10 GE: analyzer, load tester
4/8/16 G FC: analyzer, jammer, load tester10 GE: analyzer, load tester
Licensing 4 ports 8 ports
Trace Buffer 16 GB 32 GB
Mechanical Dimensions
H: 8.9 cm (3.5 in)W: 24 cm (9.5 in)
D: 38.7 cm (15.25 in)
H: 8.9 cm (3.5 in)W: 24 cm (9.5 in)
D: 38.7 cm (15.25 in)
Power Specifications Input Voltage Range
100-240 VAC, 35 A, 50-60 Hz
Environment Temperature
Operational: 10 to +40°C (50 to +104°F)Non-operational: –40 to +70°C (–40 to +158°F)
Humidity
Operational: up to 90% humidity (non-condensing) at +40°CNon-operational: up to 95% humidity at +65°C
Vibration
Operational: random vibration 1 to 200 Hz, 30 minutes per axis, 2.41 g (rms)Non-operational: random vibration 1 to 200 Hz, 30 minutes per axis, 0.3 g (rms) resonant search, 5 to 500 Hz swept sine,
1 octave/min. sweep rate, 0.75 g, 5-minute resonant dwell at 4 resonances/axis
Electromagnetic Compliance
FCC Class A, CE Compatibility
Safety
UL
Power Specifications Input Voltage Range
100-240 VAC, 35 A, 50-60 Hz
Minimum System Requirements
Operating systems
Windows 2000, XP, 2003
Small Configuration (sync group of up to 16 ports)Pentium III 800 MHz; 512 MB RAM min, 1 GB preferred; 40 GB min. disk space; 100/1000 Mbps Ethernet
Large Configuration (sync group of over 16 ports)Pentium 4 with 2 GHz or faster processor; min. 1 GB RAM; 80 GB disk space; 1000 Mbps Ethernet
Chassis and Hardware Specifications
Comprehensive multiprotocol analysis, load testing, and error injection for all SAN/NAS technologies


