1 6-7 January 2020 – Montpellier BOOK OF ABSTRACTS XII th Stics users seminar https://www6.paca.inrae.fr/stics_eng/ Stics2020 is a side event of the iCROP symposium (https://www.icropm2020.org/)
Transcript
1
6-7 January 2020 ndash Montpellier
BOOK OF ABSTRACTS
XIIth Stics users seminar
httpswww6pacainraefrstics_eng
Stics2020 is a side event of the iCROP symposium (httpswwwicropm2020org)
2
XIIth Stics users seminar
Book of abstracts
Montpellier
6-7 January 2020
Scientific committee
Franccedilois Affholder - CIRADAIDA
Eric Justes - CIRADPERSYST
EPS Stics Team
Gatien Falconnier - CIRADAIDA
Guillaume Jeacutego ndash AFFC
Organization committee
Franccedilois Affholder - CIRADAIDA
Michel Giner - CIRADAIDA
Brigitte Giudicelli - CIRADAIDA
Anne-Laure Fruteau de Laclos - CIRADAIDA
Remi Vezy - CIRADAMAP
Krishna Naudin - CIRADAIDA
3
EDITORIAL
The STICS team is happy to invite you to the 12th Stics users seminar
This seminar is a side-session of the iCROPM symposium that gathers eminent crop modelers from all around the globe The iCROPM will focus on advances in crop modelling in general with a great diversity of models and views on crop modelling This seminar will focus more specifically on the Stics model and on the scientists community familiar to or interested in the way the model (i) conceptualizes and simulates cropping systems (ii) has evolves over the past years to account for an increasing range of cropping systems properties It offers a unique opportunity to take advantage of the great diversity of the views and expertise of the scientists coming to Montpellier this week
We chose to host the seminar at the Agropolis campus in Montpellier at the French agricultural research and international cooperation organization CIRAD that works for the sustainable development of tropical and Mediterranean regions It is not mere coincidence - it underlies our will to strengthen the ability of the Stics model to deal with issues at stake in tropical environments This is also reflected in the program and the list of participants
We truly hope you will enjoy this Stics2020 seminar and that it will offer you the opportunity to connect and exchange with new people on your favorite topic as well as on other challenges you want to undertake for the future
900 - 915 Welcome speeches 15 JP Laclau (CIRAD) + P Cellier (INRAE) + STICS team head
915 - 1040 Session 1 News from the last STICS workshop
News and propects for the STICS team and network 20 5 E Justes D Ripoche M Launay and S Buis
The Red Book of STICS towards version 2 2 - N Beaudoin
The genesis of STICS v10 and new formalisms implemented in the next standard version 20 5 L Strullu
SticsRpacks a set of packages for managing Stics from R 15 5 S Buis S amp P Lecharpentier
1040 - 11 00 Coffee break
1110 - 1230 Session 2 New formalisms and crop calibration for crop diagnosis Chair G
Falconnier
Development of a new formalism for the establishment of grain yield and protein for determinate growing plants in a dedicated research version of STICS 15 5 N Beaudoin or B Dumont
Assessment of the impact of water stress on soybean yield in Canada using STICS 15 5 G Jeacutego
Comparison of sugarcane STICS model calibrations to simulate growth response to climate variability 15 5 M Christina
Use of the STICS model for simulating physiological and soil evolution in the Champagne vineyard under different scenarios 15 5 C Demestihas
1230 - 1400 Lunch break (Agropolis International - Vanille room)
1400 - 1530 Session 3 Modelling intercropping with STICS Chair G Louarn
How to model crop-weed competition for soil resources Connecting the STICS soil submodel to the FLORSYS weed dynamics model 15 5 N Colbach
Improving the intercropping version of the STICS model for simulating inter-specific competition 15 5 R Vezy
Calibration and Evaluation of the STICS Intercrop Model for Two Cereal-Legume Mixtures 15 5 K Paff
5
Modelling the agronomic performance of millet-cowpea intercropping under the semi-arid environment of Senegal 12 3 Y Senghor
Calibration of STICS soil-crop model for sorghum crop mixed with cowpea bean to evaluate the performance of this crop-system in sub-Saharan Africa 12 3 A Traoreacute
1530 - 16 00 Coffee break
1600 - 1730 Session 4 Methods and new tools for modelling with STICS Chair F Affholder
AgGlob Workflow for simulation of agronomic models at a global scale 15 5 H Raynal
Preliminary coupling of STICS (v91) to PEcAn ecological informatics toolbox and its comparison to BASGRA 15 5 I Fer
A global optimization tool for assimilation of leaf area index into STICS crop model 15 5 M Mesbah
STICS on SIWAA A STICS Tool set deployed on the SIWAA Galaxy Web platform 12 3 P Chabrier
A new method for sensitivity analysis of models with dynamic andor spatial outputs 12 3 S Buis
1730 End of the 1st day
1730 - 19 00 Free time and Transfer to Montpellier social dinner place with public transports
1900 - 23 00 Social dinner ndash Villa mont-riant - Montpellier - 6 boulevard vieussens
Friday 7th February 2020
900 - 1000 Session 5 Environmental impact of cropping systems and soil CampN dynamics Chair I Garcia de Cortazar
Verification and long-term simulations of STICS crop model to predict and analyze growing seasons N2O fluxes of spring wheat in eastern Canada 15 5 E Pattey
Modelling decomposition and N2O emissions of mulches varying in quantity and quality 15 5 B Chaves
Modelling short and long-term nitrogen and carbon budgets of agro-ecological cropping systems with a dedicated STICS research version 15 5 N Beaudoin
1000 - 1050 short talks (presentation of posters)
STICS ability to simulate long-term soil organic matter dynamics in crop-grassland rotations 5 2 AI Graux (A Cadero)
Simulation of switchgrass biomass production in Eastern Canada with the STICS model 5 2 G Jeacutego
6
Modelling the impact of soil and climatic variability on sugarcane growth response to mineral and organic fertilisers 5 2 M Chaput
Impact of corn root growth parameters on soil moisture evapotranspiration and crop growth in STICS model 5 2 E Pattey (S Saadi)
Impacts of observed and projected climatic constraints on rainfed wheat yield under a typical Mediterranean condition 5 2 C Yang
Coupling Sentinel-2 images and STICS crop model to map soil hydraulic properties 5 2 K Lammoglia
1050 - 1110 Coffee break
1110 - 1230 Session 6 Regional and large scale simulations using STICS Chair E Pattey
Estimate demand for irrigation water and nitrogen fertilizers in Europe at different scales 15 5 PA Jayet
Regional-scale coupled modelling of water pollution by nitrate from agricultural sources the Seine-Normandy hydrosystem case study 15 5 N Gallois
Simulating innovative cropping systems aiming at producing biomass while reducing greenhouse gas emissions in the Hauts-de-France region 15 5 F Ferchaud
New crop fertilization strategies after introduction of anaerobic digesters in a territory and their consequences on carbon and nitrogen dynamics in soils case study of the Versailles plain
15 5 CLaunay
1220 - 1400 Lunch break (Agropolis International - Vanille room)
1400 - 1445 Session 7 Scenario simulations using STICS Chair M Launay
To maximize multiple ecosystem services without dis-service for water the management of cover crops has to be climate and soil specific A simulation approach using STICS model 15 5 N Meyer
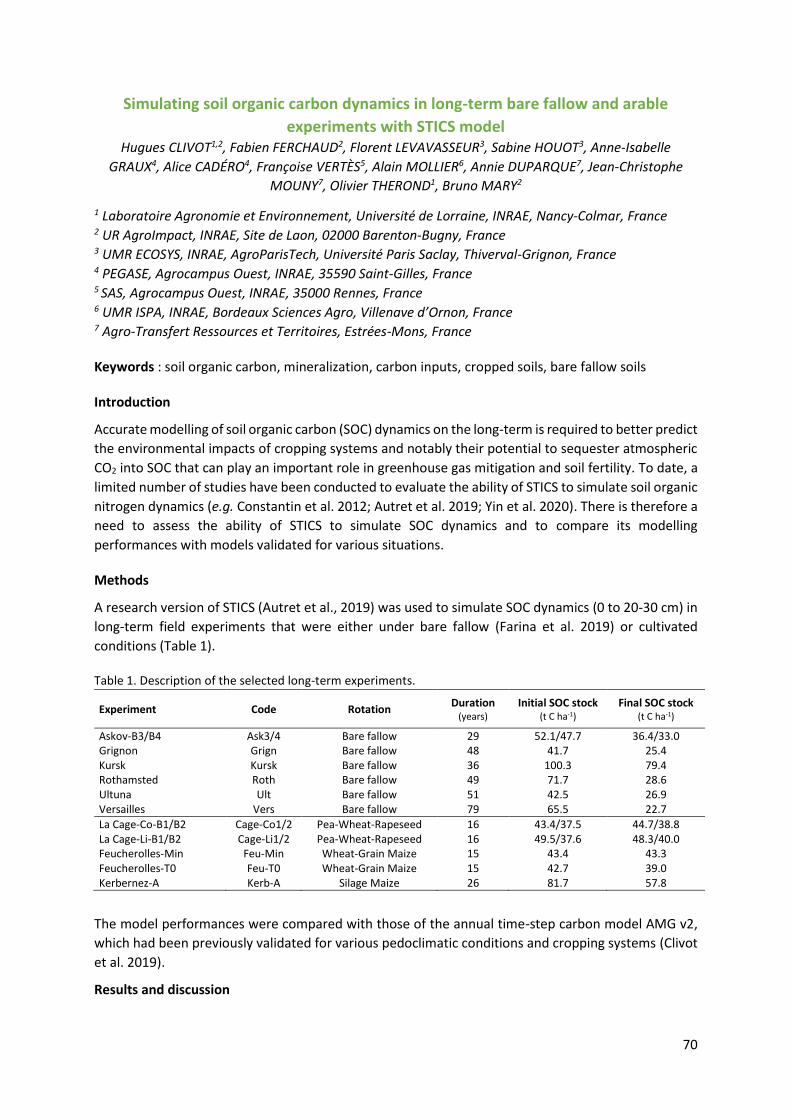
Simulating soil organic carbon dynamics in long-term bare fallow and arable experiments with STICS model 15 5 F Ferchaud (H Clivot)
Participative approach with STICS for evaluation of nitrogen management scenarios in organic farming systems 5 2 N Beaudoin
1445 - 1530 Invited conference The ldquobusinessrdquo of developing and delivering a systems model ndash the APSIM experience 30 10 PJ Thorburn
1530 - 1600 Concluding session Conclusion and General discussion on STICS team governance 15 20 STICS team head E Justes D Ripoche M Launay and S Buis
1600 - 1630 End of the Workshop with Coffee break
7
Content
Session 1 News from the last STICS workshop 9
Conceptual basis formalisations and parameterization of the STICS crop model second edition 9
The genesis of STICS v10 11
SticsRpacks a set of packages for managing Stics from R 13
Session 2 New formalisms and crop calibration for crop diagnosis 15
Development of a new formalism for the establishment of grain yield and protein for determinate
growing plants in a dedicated research version of STICS 15
Assessment of the impact of water stress on soybean yield in Canada using STICS 18
Comparison of sugarcane STICS model calibrations to simulate growth response to climate
variability 20
Use of the STICS model for simulating physiological and soil evolution in the Champagne vineyard
under different scenarios 22
Session 3 Modelling intercropping with STICS 24
How to model crop-weed competition for soil resources Connecting the STICS soil submodel to
the FLORSYS weed dynamics model 24
Improving the intercropping version of the STICS model for simulating inter-specific competition 26
Calibration and Evaluation of the STICS Intercrop Model for Two Cereal-Legume Mixtures 28
Modelling the agronomic performance of millet-cowpea intercropping under the semi-arid
environment of Senegal 30
Calibration and evaluation of the STICS soil-crop model for sorghum-cowpea intercrop in sub-
Saharan Africa 32
Session 4 Methods and new tools for modelling with STICS 33
AgGlob Workflow for simulation of agronomic models at a global scale 33
Preliminary coupling of STICS (v91) to PEcAn ecological informatics toolbox and its comparison to
BASGRA 35
A global optimization tool for assimilation of leaf area index into STICS crop model 37
STICS on SIWAA A STICS Tool set deployed on the SIWAA Galaxy Web platform 39
A new method for sensitivity analysis of models with dynamic andor spatial outputs 42
Session 5 Environmental impact of cropping systems and soil CampN dynamics 44
Verification and long-term simulations of STICS crop model to predict and analyze growing seasons
N2O fluxes of spring wheat in eastern Canada 44
Modelling decomposition and N2O emissions of mulches varying in quantity and quality 46
Modelling short and long-term nitrogen and carbon budgets of agro-ecological cropping systems
with a dedicated STICS research version 48
STICS ability to simulate long-term soil organic matter dynamics in crop-grassland rotations 50
Simulation of switchgrass biomass production in Eastern Canada with the STICS model 52
8
Modelling the impact of soil and climatic variability on sugarcane growth response to mineral and
organic fertilisers 54
Impact of corn root growth parameters on soil moisture evapotranspiration and crop growth in
STICS model 55
Impacts of observed and projected climatic constraints on rainfed wheat yield under a typical
Mediterranean condition 57
Session 6 Regional and large scale simulations using STICS 59
Estimate demand for irrigation water and nitrogen fertilizers in Europe at different scales 59
Regional-scale coupled modelling of water pollution by nitrate from agricultural sources the
Seine-Normandy hydrosystem case study 61
Simulating innovative cropping systems aiming at producing biomass while reducing greenhouse
gas emissions in the Hauts-de-France region 64
New crop fertilization strategies after introduction of anaerobic digesters in a territory and their
consequences on carbon and nitrogen dynamics in soils case study of the Versailles plain 66
Session 7 Scenario simulations using STICS 68
To maximize multiple ecosystem services without dis-service for water the management of cover
crops has to be climate and soil specific A simulation approach using STICS model 68
Simulating soil organic carbon dynamics in long-term bare fallow and arable experiments with
STICS model 70
Participative approach with STICS for evaluation of nitrogen management scenarios in organic
farming systems 72
9
Session 1 News from the last STICS workshop
Conceptual basis formalisations and parameterization of the STICS crop model
second edition Beaudoin N1 Ripoche D2 Strullu L3 Mary B1 Launay M2 Leacuteonard J1 Lecharpentier P2 Affholder
F4 Bertuzzi P2 Buis S 5 Casellas E6 Constantin J7 Dumont B8 Durand JL9 Garcia de Cortazar-
Atauri I2 Ferchaud F1 Graux AI 10 Jego G11 Le Bas C12 Levavasseur F 13 Louarn G9 Mollier A 14
Ruget F4 Justes E5
1 INRAE AgroImpact France - 2INRAE US Agroclim Avignon France - 3ASAE REIMS cedex France -4
CIRAD Montpellier France - 5 INRAE UMR EMMAH Avignon - 6 INRAE MIAT RECORD Castanet-Tolosan
France - 7 INRAE UMR AGIR Castanet-Tolosan France - 8 Universiteacute de Liegravege Gembloux Agro-Bio Tech
Belgique - 9 INRAE UR P3F Lusignan France - 10 INRAE UMR PEGASE Rennes France - 11 Agriculture et
Agroalimentaire Canada Queacutebec - 12INRAE US InfoSol Orleans France - 13 INRAE UMR ECOSYS Grignon
France - 14 INRAE UMR ISPA Bordeaux France
nicolasbeaudoininrafr
Keywords deterministic model cropping system agro-ecology environment use coupling
Introduction
Since its creation in 1996 STICS has evolved to respond to emerging issues (Beaudoin et al 2019) The
need to make the formalisms of the model accessible to a large community of users has led to the
publication of the book Conceptual basis formalizations and parameterization of the STICS crop
model under the guidance of Nadine Brisson The draft of the so-called red book was presented to
the STICS seminar in Reims in 2007 then the book was published by Quae Eds in early 2009 This book
was original because it is the only existing publication concerning an international crop model that
describes exhaustively the model formalisms and a rare synthesis of disciplines in the service of
knowledge and action on cultivated fields (Figure 1)
Figure 1 Diagram of the crossing of disciplines and scientific and technical productions allowed by STICS
The limits of the 2009 edition lie in its paper format which does not allow a concomitant update to the
evolution of the code The challenge of the new project is to reinforce the dynamics of interaction
between the evolution of the model represented by the STICS Project Team (EPS) and the pluralistic
community of users of STICS The objective of the EPS is to propose a scalable version of the book
10
giving it the status of key and up to date reference and giving to the use of the model a potentially
unlimited life
Material and methods
The design logic of the book builds on the achievements of the previous one - description of all the
formalisms of the STICS model with the interaction processes between crop soil climate and crop
management at the plot scale -detail of the construction hypotheses and equations of the model
illustrated by graphs - display of operational information
The new edition will bring novelties of substance and form It will present the new processes
over specificities of grassland hellip ) It will display intercropping processes over all the chapters devote
two chapters to helping user involvement and extending model capabilities for various applications
(Table 1) Mathematical equations will be written in an academic way and can be directly tested via R
Markdown to ensure reproducibility A dematerialized edition will be available free of charge for each
new version Besides there will be possible to print it on demand (with fees)
The project management is entrusted by the EPS to an editorial committee which is composed of 6
members On a technical level the project has been submitted to QUAE Eds who are interested in its
dynamic and innovative character The writing is organized in a modular way at the level of each
chapter which is coordinated by 2 persons It will rely on the 2009 writing and will seek new
contributors the list of which will be drawn at the chapter level The writing is planned for the first
semester 2020 for publication at the end of the year 2020
Table 1 List of planned chapters and novelties
References
Beaudoin N et al (2019) Modeacutelisation du fonctionnement des agro-eacutecosystegravemes lrsquoeacutepopeacutee STICS in une agronomie pour le XXI siegravecle Richard G Stengel P Lemaire G Cellier P Valceschini E cords Quae Eds pp 128-149
Brisson N Launay M Mary B Beaudoin N (2009) Conceptual basis formalisations and parameterization of the STICS crop model Editions QUAE INRA Versailles
11
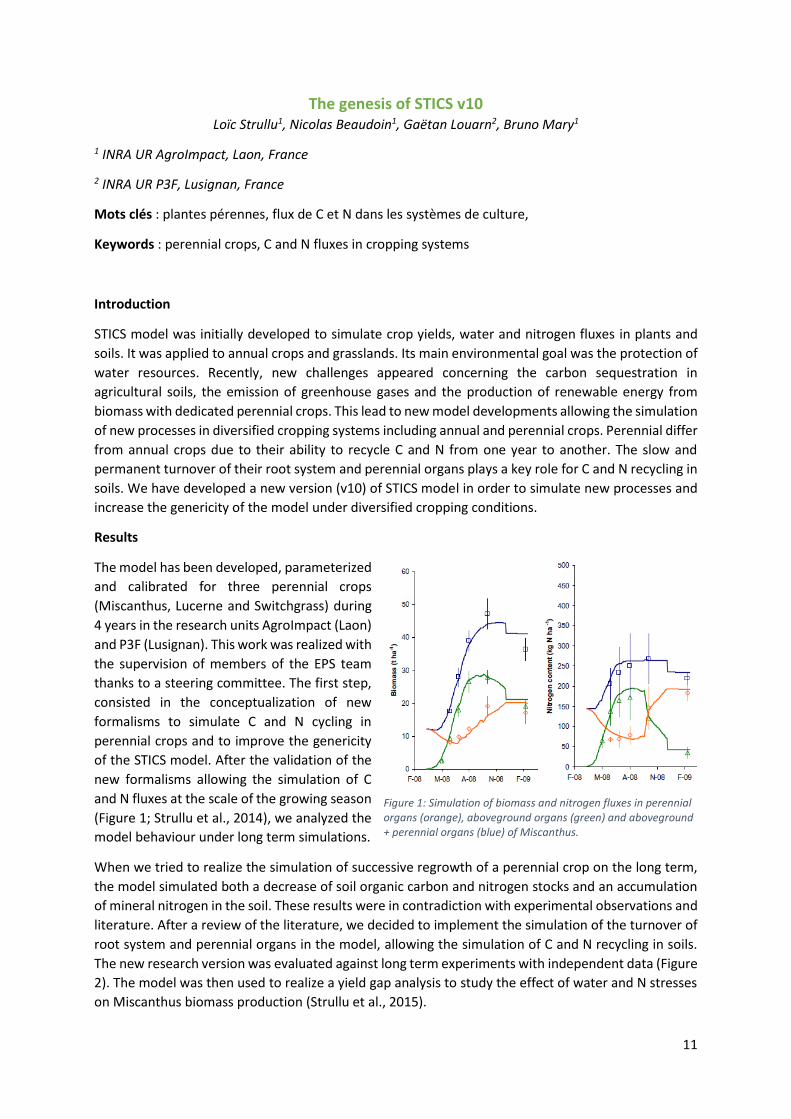
The genesis of STICS v10 Loiumlc Strullu1 Nicolas Beaudoin1 Gaeumltan Louarn2 Bruno Mary1
1 INRA UR AgroImpact Laon France
2 INRA UR P3F Lusignan France
Mots cleacutes plantes peacuterennes flux de C et N dans les systegravemes de culture
Keywords perennial crops C and N fluxes in cropping systems
Introduction
STICS model was initially developed to simulate crop yields water and nitrogen fluxes in plants and
soils It was applied to annual crops and grasslands Its main environmental goal was the protection of
water resources Recently new challenges appeared concerning the carbon sequestration in
agricultural soils the emission of greenhouse gases and the production of renewable energy from
biomass with dedicated perennial crops This lead to new model developments allowing the simulation
of new processes in diversified cropping systems including annual and perennial crops Perennial differ
from annual crops due to their ability to recycle C and N from one year to another The slow and
permanent turnover of their root system and perennial organs plays a key role for C and N recycling in
soils We have developed a new version (v10) of STICS model in order to simulate new processes and
increase the genericity of the model under diversified cropping conditions
Results
The model has been developed parameterized
and calibrated for three perennial crops
(Miscanthus Lucerne and Switchgrass) during
4 years in the research units AgroImpact (Laon)
and P3F (Lusignan) This work was realized with
the supervision of members of the EPS team
thanks to a steering committee The first step
consisted in the conceptualization of new
formalisms to simulate C and N cycling in
perennial crops and to improve the genericity
of the STICS model After the validation of the
new formalisms allowing the simulation of C
and N fluxes at the scale of the growing season
(Figure 1 Strullu et al 2014) we analyzed the
model behaviour under long term simulations
When we tried to realize the simulation of successive regrowth of a perennial crop on the long term
the model simulated both a decrease of soil organic carbon and nitrogen stocks and an accumulation
of mineral nitrogen in the soil These results were in contradiction with experimental observations and
literature After a review of the literature we decided to implement the simulation of the turnover of
root system and perennial organs in the model allowing the simulation of C and N recycling in soils
The new research version was evaluated against long term experiments with independent data (Figure
2) The model was then used to realize a yield gap analysis to study the effect of water and N stresses
on Miscanthus biomass production (Strullu et al 2015)
Figure 1 Simulation of biomass and nitrogen fluxes in perennial organs (orange) aboveground organs (green) and aboveground + perennial organs (blue) of Miscanthus
12
Figure 2 Simulation of soil organic carbon under Miscanthus on the long term at Rothamsted comparison of 3 treatments Roth without N fertilization Roth1 with 60 kg N ha-1 y-1 Roth 2 with 120 kg N ha-1 y-1
The final step of this work consisted in evaluating the genericity of the model which was applied to
other perennial crops like Switchgrass and Lucerne We improved the genericity of the formalisms
describing the C and N partitioning between organs by including structural and reserve compartments
Additional formalisms were required for simulation of Lucerne in order to take into account
specificities concerning the effect of photoperiod on biomass and N partitioning (Figure 3 Strullu et
al 2020)
Figure 3 Simulated versus observed aboveground biomass (left) and its N concentration (right) at harvest in function of growing season Sp = spring Su = Summer Au = autumn
The detail of these new formalisms applied both to annual and perennial crops on the long term will
be given in an updated version of the STICS red book (version v10) which will come out in 2020
Reacutefeacuterences bibliographiques
Strullu L Beaudoin N Garcia de Cortagravezar Atauri I Mary B 2014 Simulation of biomass and nitrogen dynamics in perennial organs and shoots of Miscanthus times giganteus using the STICS model Bioenerg Res DOI 101007s12155-014-9462-4
Strullu L Ferchaud F Yates N Shield I Beaudoin N Garcia de Cortagravezar Atauri I Besnard A Mary B 2015 Multisite yield gap analysis of Miscanthus times giganteus using the STICS model Bioenerg Res DOI 101007s12155-015-9625-y
Strullu L Beaudoin N Thieacutebeau P Julier B Mary B Ruget F Ripoche D Rakotovololona L Mary B 2020 Simulation using the STICS model of CampN dynamics in alfalfa from sowing to crop destruction European Journal of Agronomy DOI 101016jeja2019125948
13
SticsRpacks a set of packages for managing Stics from R Samuel Buis1 Patrice Lecharpentier2 Reacutemi Vezy3 Michel Giner4
1 INRA UMR EMMAH Avignon France 2 INRA US Agroclim Avignon France 3 CIRAD UMR AMAP
Montpellier France 4 CIRAD UPR AIDA Montpellier France
Keywords R model simulations parameter estimation uncertainty and sensitivity analysis
Introduction
The SticsRpacks project has been initiated end 2018 to develop tools for piloting the STICS model via the high-level language R These tools aim at - easily performing operations that are not provided in JavaSTICS eg production of various graphs
statistical processing link with databases
- automating these operations using scripts
- reducing the computation time required to perform simulations
It is composed of a set of R packages These packages are addressed to Stics users and developers and
will be used in its automatic test and performance evaluation system (Buis et al 2016) Methodological
packages are developed in a generic way to be coupled with other crop models
SticsRfiles SticsOnR and CroptimizR
First versions of the packages SticsRfiles SticsOnR and CroptimizR (Fig 1) will be released for the Stics 2020 seminar Other packages may be developed later (eg IdeSticsR)
Figure 1 Architecture of the SticsRpacks packages ApsimOnR and SQonR are external packages
functions Development of IdeSticsR package has not yet started
They will include functions for - converting XML input files (JavaStics) into text input files (Stics) replacing (getting) parameters
and option codes values in (from) XML and text files getting simulated and observed variables
values from Stics output and observation files (SticsRfiles package)
- generating Stics input files from JavaStics working directory running Stics simulations from
JavaStics or Stics input files with possible forcing of input parameters option codes and
parallelization of the simulations (SticsOnR package)
- multi-step parameter estimations with frequentist (multi-start Nelder-Meade simplex Nelder and
Mead (1965)) or bayesian (DREAM Vrugt (2016)) methods with possible simultaneous estimation
of specific and varietal parameters on multi-varietal datasets (CroptimizR package)
Development tools
IdeSticsR
R interface to IDE-Stics
SticsOnR
Simulation management
SticsRFiles
IO files management
CroptimizR
UA SA Parameter optimization
ApsimOnR SQonR hellip
14
SticsRpacks is a collaborative and opensource project Source code versioning is handled in gitHub
(httpsgithubcomSticsRPacks) A common coding style has been adopted Automatic
documentation is performed using Roxygen2 Websites are generated using pkgdown (see
httpssticsrpacksgithubioCroptimizR) User documentation is provided through function help and
vignettes available on the packages websites Automatic tests (including CRAN checks and unit tests)
are performed using testthat and Travis
Conclusion and perspectives
The development of the packages included in SticsRpacks just began Other features are already planned and future versions should include additional functions for
- downloading (uploading) USMs from (to) the IDE-Stics database (Beaudoin et al 2015) - converting (Stics input) text files into (JavaStics input) XML files - generating new USMs by combining existing climate soils plant and management files - analyzing crop models inputs and outputs (diagnosis statistical criteria graphics) including
comparison with observations - probabilistic uncertainty analysis (multiple distributions and sampling methods) and sensitivity
- other parameter estimation methods (eg evolutionary algorithm Hamiltonian MCMC) and objective function criteria likelihoods
- selection of parameters to estimate - taking into account prior information and constraints (eg inequality constraints) on
estimated parameters and output variables - evaluating the predictive performance in parameter estimation process (cross validation hellip)
In addition to Stics CroptimizR has already been coupled with ApsimX and SiriusQuality crop models Its genericity will make it possible to evaluate multiple calibration approaches on different crop models
and pool crop modelling team efforts to provide relevant methods for users of those models
References
Buis S Coucheney E Launay M Lecharpentier P Mary B et al (2016) Multicriteria evaluation of the stics soil-crop model and implementation of an automated evaluation system iCROPM International Crop Modelling Symposium Crop Modelling for Agriculture and Food Security under Global Change Mar 2016 Berlin Germany 441 p
Nelder J A and Mead R (1965) A simplex method for function minimization The Computer Journal 7 p 308-313
Vrugt J A (2016) Markov chain Monte Carlo simulation using the DREAM software package Theory concepts and MATLAB implementation Environ Model Softw 75 273-316
Beaudoin N Armas-Herrera C Le Bas C Buis S Garcia De Cortazar Atauri I Ruget F Ripoche D Launay M (2015) Creacuteation de IDE-STICS (base de donneacutees intercontinentale pour leacutevaluation de STICS) Xe seacuteminaire des utilisateurs et concepteurs du modegravele Stics Mar 2015 Rennes France France 102p
15
Session 2 New formalisms and crop calibration for crop diagnosis
Development of a new formalism for the establishment of grain yield and protein
for determinate growing plants in a dedicated research version of STICS Chlebowski Florent1 Dumont Benjamin2 Vitte Guillaume3 Meurs Reacutemi4 Rosso Pablo5 Nendel Class5
Beaudoin Nicolas1
1 INRA UR 1158 AgroImpact Site de Laon 180 rue Pierre-Gilles de Gennes 02000 Barenton-Bugny France
3 INRA UR 1158 AgroImpact Site drsquoEstreacutees-Mons 80203 Peacuteronne France
4 Centre Pilote Ceacutereacuteales et Oleacuteo-Proteacuteagineux 5030 Gembloux Belgique
5 Leibniz Centre for Agricultural Landscape Research (ZALF) 15374 Muumlncheberg Germany
Keywords grain yield grain protein formalism sinksource cereal crops
Introduction
The actual formalism of the STICS model (v91) for the prediction of grain yield for determinate
growing plants consists in calculating a daily accumulation of biomass in grains by applying a
progressive harvest index to the total biomass This formalism brings a relative robustness in the
yield prediction According to the reference time unit used it will give a higher weight to the use of
carbohydrates produced after flowering (thermal time) or to remobilization (calendar time) for grain
yield elaboration This hinders the complexity and the dynamic of the different mechanisms that
contribute to C accumulation in grain especially within climate change context (Launay et al 2010)
Material and methods
In a dedicated research version of STICS we developed a new formalism that aims to consider grains
as a sink following Launay et al (2010) The formalism to predict grain number was kept as the one
used for determinate growing plants in STICS (v91) We replaced the formalism of total yield
elaboration and the a posteriori computation of the weight of one grain by the filling of individual
grains The daily growth function of each grain proposed here corresponds to the derivative function
of grain biomass growth evolution according to thermal time (Robert et al 1999)
The lone source of water-soluble carbohydrate (WSC) is the temporal reserves which are feed by
remobilizations and the addition of neoformed carbohydrates during the reproductive phase
Although temporal reserves are not explicitly located in STICS we know that the WSC are
transported from the source to the sink through the phloem (Lemoine et al 2013) We have
therefore linked the flow of transpiration due to stoma present in the leaves and spikelets to
estimate a daily flux Knowing there is a maximal WSC concentration in phloem we then introduce a
daily limitation in the WSC availability for grains Finally the N content in grains is linked to the
Nitrogen Internal Efficiency (NIE) as mentioned by Gastal et al (2015)
Three experimental sites devoted to varying crop species (s barley w barley and w wheat) with
treatments differing by N application and irrigation in the same site-year were studied These three
experimental sites are the SOERE ACBB ldquoGrandes culturesrdquo (Estreacutees-Mons France) Gembloux
(Belgium) and Muumlnchebger (Germany) We only used simulations with good aboveground biomass
estimation to validate our formalism since in our dataset we have no measure of temporal reserves
16
Results and discussion
The comparison between model outputs shows a better prediction of grain yield and nitrogen
content with the new formalism (Table 1) Focusing on the harvest index (HI) outputs between the
actual formalism and the new one (Figure 1) shows a significant difference on either barley or wheat
crops The current formalism is not so robust since for a same year and a same site the mean HI is
underestimated and the variability of simulated HI is almost null Using the new formalism improved
both the performance of the mean prediction and a better account of the HI variability according to
crop management Especially the new formalism was able to simulate the exceptional weather
condition in 2018 with a high remobilization of neoformed carbohydrates during reproductive phase
Besides the performance of production criteria this research version is expected to better predict
the CN ratio of crop residues which strongly influences soil mineral N availability and humus
storage
Figure 1 Comparison of the observed (x axis) and the simulated (y axis) harvest index between the actual (left) formalism and the new one (right) Group of datasets from Gembloux (Gbx Belgium) Muumlncheberg (Mun Germany) and Estreacutees-Mons (SOERE France) SB WB amp WW stand for s barley w barley and w wheat respectively Numbers 13 15 18 amp 19 are the harvest year Lines represent linear regressions
Table 1 Efficiency of the model with the actual formalism and the new one on some variables during crop cycle
Aboveground biomass Aboveground N amount Grain yield Grain N amount
Actual formalism 083 049 033 015
New formalism 083 049 054 056
Acknowledgement We thank the Barley-IT project funded by the EIT Climate-KIC and the
experimenters for the datasets We thank the SPW-DGO3 (Wallonie Belgique) for its financial
support to the CePiCOP actionsrsquo and research program which provided historic records for model
evaluation
References
17
Gastal F Lemaire G Durand J-L Louarn G 2015 lsquoChapter 8 - Quantifying Crop Responses to Nitrogen and Avenues to Improve Nitrogen-Use Efficiencyrsquo In Crop Physiology (Second Edition) 161ndash206 San Diego Academic Press httpsdoiorg101016B978-0-12-417104-600008-X
Lemoine R et al 2013 lsquoSource-to-Sink Transport of Sugar and Regulation by Environmental Factorsrsquo Frontiers in Plant Science 4 httpsdoiorg103389fpls201300272
Launay M Garciacutea de Cortaacutezar-Atauri I Guillaume S Brisson N Justes E Gate P Ruget F Guerif M 2010 Evaluation des formalismes du rendement des plantes deacutetermineacutees Cas du bleacute tendre et du bleacute dur Seacuteminaire STICS 2010
Robert N Huet S Hennequet C Bouvier A 1999 lsquoMethodology for Choosing a Model for Wheat Kernel Growthrsquo Agronomie 19 (5) 405ndash17 httpsdoiorg101051agro19990507
18
Assessment of the impact of water stress on soybean yield in Canada using STICS Guillaume Jeacutego1 Reneacute Morissette1 Elizabeth Pattey2
1 Agriculture and Agri-Food Canada Quebec City Research and Development Centre Canada 2 Agriculture and Agri-Food Canada Ottawa Research and Development Centre Canada
Keywords soybean yield water stress evapotranspiration
Introduction
In Canada soybean is grown mainly in Ontario and Quebec without irrigation (Statistics Canada 2019)
Within one production region average annual yields can vary considerably from year to year (up to
about 60 variation in some regions FADQ 2019) Several biotic and abiotic factors may explain these
interannual variations but it is difficult to assess the extent to which each factor contributes to these
variations However it is likely that the intensity and temporal distribution of precipitation plays a
major role within the abiotic factors The use of long climate series (gt 30 years) is one way to better
understand the effect of climate variations on the yield of crops such as soybean Since little or no
experimental data are generally available over such a long period the use of a crop model calibrated
and validated for the region of interest is a relevant solution for this type of approach
The objectives of this work are to 1) verify the performance of the STICS model in simulating the water
balance of a soybean field (soil water stock and evapotranspiration) and 2) use the verified model to
evaluate the impact of water stress on yield losses
Materials and methods
Prior to this work 22 data sets from the Ottawa area (Canada) were used to calibrate and validate
soybean phenology growth and yield processes in the STICS model (v 90) Of these 22 datasets four
(years 1997 1999 2008 and 2016) included evapotranspiration and soil moisture measurements
These four datasets were therefore used to evaluate the modelrsquos performance in simulating two of the
main components of the water balance of an agricultural field during the growing season (AprndashOct)
cumulative evapotranspiration flux per 10-day period and temporal variation in soil moisture
Once the modelrsquos performance was verified several series of simulations over long periods (50 years)
were carried out Four sites located in Ontario (ON) and Quebec (QC) with significant climate gradients
were selected for the study London (ON) Ottawa (ON) Saint-Hubert (QC) and Quebec City (QC) from
the site with the longest growing season (212 days) to the one with the shortest season (183 days) For
each of these sites independent simulations (not successive) were carried out using the historical
climate years from 1960 to 2009 (50 years) for the three main soil types in each region Finally in order
to better assess the impact of water stress simulations were carried out with or without irrigation A
total of 1200 simulations were carried out (4 sites times 3 soils times 50 years times 2 irrigation practices)
Simulated yields for the St-Hubert site without irrigation were compared to the yields measured by La
Financiegravere Agricole du Queacutebec (FADQ) between 1995 and 2009 to verify the performance of the model
in simulating the average yield of a region and its interannual variability Then the simulation results
were analyzed by site and then by sitesoil
Results and discussion
The soil water stock (resmes variable) is generally well-simulated with a normalized root mean square
error (NRMSE) of about 15 and a very low bias (1) Soil water distribution is also well simulated
with NRMSEs between 126 and 338 The highest NRMSE was obtained for the top soil layer (0ndash
19
10 cm) For decadal evapotranspiration the modelrsquos performance was slightly worse with a NRMSE of
35 for the 4 years combined This lower performance of the model is particularly noticeable for 1999
with an overestimation of evapotranspiration (bias of 432) For the other 3 years the NRSME was
close to or less than 30 and the bias less than 20 Overall the model performance is therefore
satisfactory and it can be used to assess the impact of water stress on soybean yields
The simulated average yield over the 1995ndash2009 period at the St-Hubert site is close to the average
yield measured by the FADQ in this region (28 and 24 t ha-1 respectively) The modelrsquos slight
overestimation can be explained by its inability to take biotic factors into account However the
interannual variability seems to be well reproduced by the model with predicted yields ranging from
21 to 32 t ha-1 and from 20 to 29 t ha-1 for the measurements The comparison of treatments with
and without irrigation shows that on average water stress could reduce soybean yield by between 44
and 125 depending on the site The largest reductions are in Ottawa and St-Hubert (-85
and -125 respectively) and the smallest are in London and Quebec (approximately -44) As
expected the largest water stress yield reductions are simulated for the most sandy soils (sandy loam
yield reduction from -85 to -139) since these soils have a lower available water capacity than
loamy soils (loam clay loam and silty clay loam) It should be noted that the impact of water stress
seems very significant on the heavy clays of the St-Hubert region (-168) which are also characterized
by a relatively low available water capacity Finally the simulation results indicate that the interannual
variability of yields due to water stress would represent about 28 of the total variability related to
abiotic stresses taken into account by the model with significant spatial disparities Analysis of the
standard deviation of simulated yields over 50 years indicates that water stress could represent nearly
45 to 48 of the variability in Ottawa and St-Hubert and only 8 to 13 in Quebec and London For
these two sites temperature variations seem to be the cause of most of the interannual variability
Temperatures are often sub-optimal in Quebec City and conversely there is a more significant
frequency of days with temperatures above the optimum growth range in London especially during
the grain filling period
Conclusion
The model was able to correctly reproduce two of the main components of the water balance of a
soybean field in eastern Canada Its use with long climate series on four sites and different soil types
confirmed that water stress played a major role in the interannual variability of yields for two of the
sites studied (Ottawa and St-Hubert) For the other two sites most of the interannual variability in
yields is probably explained by temperature
References
La Financiegravere agricole du Queacutebec (FADQ) Assurance reacutecolte ndash Rendements reacuteels Accessed Nov 2019
1CIRAD UPR AIDA F-97408 Saint-Denis La Reacuteunion France mathiaschristinaciradfr 2CIRAD UPR Recyclage et Risque F-97408 Saint-Denis La Reacuteunion France 3Universiteacute de la Reacuteunion Saint-Denis La Reacuteunion France 4ASAE 2 esplanade Roland Garros Reims France
Mots cleacutes canne agrave sucre La Reunion calibration ICSM
Keywords Sugarcane Reunion island calibration ICSM
Introduction
The key role of crop models is to help understand and predict the effects and interactions between
climate soil management species facilitation and competition on crop development and yield
Several process-based sugarcane models have been developed such as DSSAT-Canegro Canesim
Mosicas or APSIM-Sugar which differ through the nature of input parameters and constituent process
algorithms Assuming that the choice of model should be questioned each time according to the
desired application we present here the calibration of a new growth model for sugar cane (STICS) This
model is particularly suitable for studies on species associations or the agrosystems response to the
supply of organic matter residues
In the present study we present and compare three different calibrations of the sugarcane crop
growth in STICS each of which can be applied to a different situation and objectives
Cane stalk conceptualized as a grain in order to simulate sugar yield (STICS v9)
ldquoSugarcane_grainrdquo
Cane stalk conceptualized as a stem in order to simulate fresh cane yield variability (STICS
v9) ldquoSugarcane_stemrdquo
Cane with perennial reserves in order to simulate multiple regrowth (STICS vX)
ldquoSugarcane_regrowthrdquo
Methods
The database used for calibration consisted in 8 trials performed in the ICSM projects These trials
described in Jones et al 2019 included 2 years of sugarcane monitoring in four countries (Reunion
South Africa Zimbabwe and USA) and followed the same measurement protocols Additionally 6 trials
performed in Reunion between 1994 and 1997 used for the initial sugarcane prototype calibration
were used
In the present study we choose to parameterized the sugarcane species using field measurements or
measurements in the literature as a priority In cases where this information was not available the
model parameters were calibrated The calibration was performed using an R package (Rgenoud) with
a genetic algorithm and a RRMSE like scored function The trials available in the ECOFI database
(Christina et al 2019) were used as a set of validation This database includes 95 trials (1988-2018)
performed with the R570 variety in Reunion Island
Results amp Discussion
21
An illustration of STICS simulations on the ICSM trials is presented in Figure 1 All three calibrations
(ldquoSugarcane_grainrdquo rdquoSugarcane_stemrdquo and ldquoSugarcane_regrowthrdquo) satisfactorily simulated the leaf
area index and carbon allocation to aerial leaf and stalk dry mass in the ECOFI trials The
ldquoSugarcane_grainrdquo was currently the only one accurately simulating sugar yield in the cane stalk but
it failed to simulate fresh cane yield which is an essential information for farmers and sugar industries
The ldquoSugarcane_stemrdquo was the most accurate calibration to simulate fresh cane yield and thus should
be applied to yield forecast studies Finally the ldquoSugarcane_regrowthsrdquo had strong potential while
simulating fresh cane yield and potentially sugar yield (still under development) Additionally the
possibility to simulate multiple regrowth with STICS vX could make it possible to assess the yield decline
with ratoon age commonly observed by farmers as the evolution of soil organic matter in function of
agricultural practices
Perspectives
The potential applications of the STICS model for sugarcane simulations will be discussed with two
focus on sugarcane legume associations and sugarcane response to organic residue applications
Reacutefeacuterences bibliographiques
Christina et al 2019 ECOFI a database of sugar and energy cane field trials ODJAR in press
Jones et al 2019 Exploring process-level genotypic and environmental effects on sugarcane yield
using a international experimental dataset Field Crop Research 244 107622
Fig 1 Example of simulations obtained with the STICS model in the ICSM project (ldquoSugarcane_stemrdquo)
22
Use of the STICS model for simulating physiological and soil evolution in the
Champagne vineyard under different scenarios Constance Demestihas1 Camille Dumortier1 Seacutebastien Debuisson1 Intildeaki Garcia de Cortazar Atauri2
1 Comiteacute Champagne 5 rue Henri Martin 51200 Epernay France 2 INRA Avignon Uniteacute de Service 1116 AGROCLIM 84914 Avignon France
Keywords vine physiological balance soil water and nitrate content Champagne vineyards
Introduction
These last few years the champagne vineyard appears as a real case study for the evolution of nitrogen
and water availability In fact among other nitrogen stress indicators the must nitrogen has been
decreasing since the 2000s The combination of restricted mineral fertilizers and herbicide use the
growing variability of spring rainfall the increasing thermal stress as well as the soil type heterogeneity
are only a few underlying factors that trigger loss of physiological balance in the vineyards The use of
crop modelling approaches in order to accurately follow the nitrogen carbon and water cycles within
the vine and the soil especially for future scenarios appears necessary The first part of the study
consists in validating the STICS model parameterization for vine (Garcia de Cortaacutezar-Atauri 2006)
under the Champagne vineyard conditions The second part formalizes the use of the STICS model for
the Champagne industry
Materials and Methods
The STICS model v9 was used in this study Two dataset were mobilized for this study The first dataset
was obtained using the ldquoreacuteseau vigueurrdquo which is a network of 6 plots representing champagnersquos
vineyards variability in terms of soil climate and viticultural practices A large set of physiological and
soil measures are operated since 2017 The second is a historical database on the experimental station
of the Comiteacute Champagne in Plumecoq which provides leaf water potential and leaf area data
The validation and parameter optimization processes were operated using the EvalR and Optimistics
tools of the STICS interface in a specific non-interchangeable order first on soil and then on physiology
parameters mostly water in fruits The simulations were validated at each step with observed data
using mostly the root mean square error
Results and perspectives
Optimization of 5 parameters and validation of the model in the Champagne vineyards
Observed and simulated leaf water potential at Plumecoq showed at first a very high RMSE as the
subsoil chalk not considered by the model positively impacted the vine water status We therefore
modelized this chalk by adding two hypothetical horizons with a wilting point at 25 and a field
capacity at 40 We then optimized under this chalk subsoil context 4 soil parameters pebbles
(cailloux) soil humidity at field capacity (HCCF) initial root density (densinitial) and the depth of root
obstruction (obstarac) enabling to reach lower RMSE for leaf water potential and leaf area
The next step consisted in optimizing the harvest date thus the yield simulation through water
status in fruits with two parameters H2Ograinmax (maximum water content in berries at harvest)
drawn out of brix degrees values at harvest and deshydbase (phenological rate of evolution of fruit
water) which was optimized on Pinot Noir variety using the observed harvest dates The harvest
dates RMSE decreased a lot the leaf area index appeared very well simulated with an RMSE of 066
but the yield simulation remained unsatisfactory (RMSE of 125) impacting the aboveground nitrogen
content as well (RMSE of 2349) (fig1)
23
Figure 1 Comparison of simulated and observed data for leaf area (lai) aboveground biomass (masec) yield (mafruit) and
aboveground nitrogen content (qnplante) on the ldquoreacuteseau vigueurrdquo database in 2018 and 2019 on 42 unit simulation model
(USM)
The use of the STICS model in Champagne
Predictive climate scenarios for 2019 were created from the 15th of June and onwards in a given type
of soil (fig 2) Decadal mean climatic data (lsquo2019 preacutevirsquo) was compared to past climatically ldquoextremerdquo
vintages (1997 2002 2016 and 2018) in order to see the range of values the nitrate content in soil
could reach as well as the period of nitrate retention in the first 30 cm during autumn a crucial timing
for vine reserve storage
The use of the STICS model in the champagne vineyards is not to predict yields or harvest dates but
rather to foresee the evolution of some important soil and vine indicators impacting the vine
physiological balance yearly and through hypothetical future scenarios The perspective of a web
intranet portal is explored by the Comiteacute Champagne providing information about leaf area
phenology soil water and nitrate status using Champagnersquos meteorological station network and soil
typology
Figure 2 Nitrates dynamic simulated by the STICS model in kgha within the first 30 cm of soil
References
Garcia De Cortaacutezar-Atauri I 2006 Adaptation du modegravele STICS agrave la vigne (Vitis Vinifera L)
Utilisation dans le cadre drsquoune eacutetude drsquoimpact du changement climatique agrave lrsquoeacutechelle de la
How to model crop-weed competition for soil resources
Connecting the STICS soil submodel to the FLORSYS weed dynamics model Nathalie Colbach1 Nicolas Beaudoin2 Seacutebastien Guyot1 Jean Villerd1 Delphine Moreau1
Keywords weed competition nitrogen water cropping system multicriteria evaluation crop
diversification
Introduction
Weeds are harmful for crop production but essential for biodiversity Process-based weed dynamics
models are crucial to synthesize knowledge on weed dynamics and crop-weed interactions apply this
knowledge to cropping-system design and transfer it to stakeholders Such models can also help to
analyse the effects of crop diversification (longer rotation with more species cover crops crop
mixtures) which crucial for agroecological crop production Indeed the processes driving crop-weed
interactions are the same for crop-crop interactions in crop mixtures and crop rotations Plant-plant
competition for soil resources plays a key role in these interactions This paper illustrates how we
connected the soil submodel of STICS (Brisson et al 2009) to provide soil-resource inputs for the weed
dynamics model FLORSYS and then how we used the resulting model complex for simulations
Connecting the STICS soil submodel to the weed dynamics model FLORSYS
FLORSYS (Colbach et al 2014 Colbach et al in revision) is a virtual field for which the user enters a list
of cultural operations lasting for several years (crop succession including cover crops and crop
mixtures all management techniques) together with daily weather soil properties and a regional
weed species pool (Figure 1) These inputs drive the biophysical processes in the field at a daily time
step with a 3D individual-based representation of the canopy FLORSYS focuses on processes leading
to (1) plant emergence and establishment of crop and weed species with diverse ecological
requirements (which allows for crops sown in different seasons and in mixtures where timing
determines the fate of a species) (2) the functioning of heterogeneous crop-weed canopies including
diverse plant ages morphologies and shade responses (as in crop mixtures) (3) carryover effects in
terms of eg weed seed bank soil organic matter or water content on future cropping seasons (which
is crucial for crop rotations) The detailed biophysical model outputs are aggregated into indicators of
crop production and weed (dis)services to easily compare cropping systems Figure 1 illustrates how
this model was connected to the STICS soil submodel The source code of the two models remains
sufficiently separate to allow easily connecting future versions of STICS to FLORSYS
Evaluation and design of multi-performant cropping systems with simulations
First we simulated virtual farm-field networks based on farm surveys from different regions and
stakeholders to identify weed-suppressive crop ideotypes and cropping-system types that reconcile
low yield loss with low herbicide use The simulations showed that compared to crop species with a
high yield loss due to weeds low-loss crops present a larger plant width per unit biomass in unshaded
conditions thinner leaves to increase leaf area chiefly from flowering onwards and etiolate when
25
shaded by neighbour plants with taller plants per unit plant biomass and even thinner larger leaves
Three winning cropping-system types were identified maize monocultures and 2 types with diverse
rotations (different species both winter and summer crops intercropping temporary grassland)
andor crop mixtures combined with well-reasoned tillage (stale seed bed occasional ploughing)
FLORSYS was also used to assess cropping systems designed by scientists or farmers in workshops
Farmers appreciated the models ability to (1) predict weed (dis)services over several years
(2) determine probabilities of success or failure of innovative strategies as a function of past field
history and weather scenarios (3) identify biophysical explanations of cropping system performance
(4) fine-tune cropping systems to local conditions The workshops led to major take-home messages
on agroecological weed management for farmers eg assess crops at the rotation scale weather and
inadequate crop management can cancel out the effects of beneficial techniques weed floras do not
disappear but changehellip
Figure 3 Connecting the STICS soil submodel to the 3D individual-based FLORSYS weed dynamics model
A Each day d STICS provides water potential nitrogen availability and temperature for each soil layer
l These drive seed and plant processes in FLORSYS together with weather and cropping-system inputs
FLORSYS returns canopy information to STICS to calculate soil variables for the next day B In FLORSYS
soil temperature and water potential drive seed germination and pre-emergent growth soil
temperature drives root-system growth Available nitrogen is distributed inside soil voxels (3D pixels)
in each soil layer and extracted by the roots inside each voxel
Conclusion
This study showed how a STICS submodel was connected to a 3D individual-based multiannual weed
dynamics model The resulting model complex can simulate contrasting cropping systems with
different soils weather scenarios and weed floras This is essential to establish rules for weed
management depending on the production situation and cropping system
FundingINRA CoSAC (ANR-15-CE18-0007) EU H2020 ReMIX (N 727217) and IWMPRAISE (N 727321) Casdar RAID funded by the French Ministry in charge of Agriculture and Food
References
Brisson N Launay M Mary B amp Beaudoin N (2009) Conceptual basis formalisations and parameterization of the STICS crop model eacuteditions Quae
Colbach N Biju-Duval L Gardarin A Granger S Guyot S H M Meacuteziegravere D Munier-Jolain N M amp Petit S (2014) The role of models for multicriteria evaluation and multiobjective design of cropping systems for managing weeds Weed Research 54541ndash555
Colbach N Colas F Cordeau S Maillot T Moreau D Queyrel W amp Villerd J (in revision) The FLORSYS crop-weed canopy model as a tool to optimise crop diversification European Journal of Agronomy
Tdl
Ndl
H2Odl
Management
opertions
Year 1
hellip
Year N
Weather
Soil
texture
FLORSYS
Soil submodel
LAId
Nuptakedl
Root biomass amp lengthdl
Plant residuesd
A
Soil layer l
B
Soil surface
Tdl
N dv
H2Odl
Above-ground plant part cylinder
Root system
2D view
26
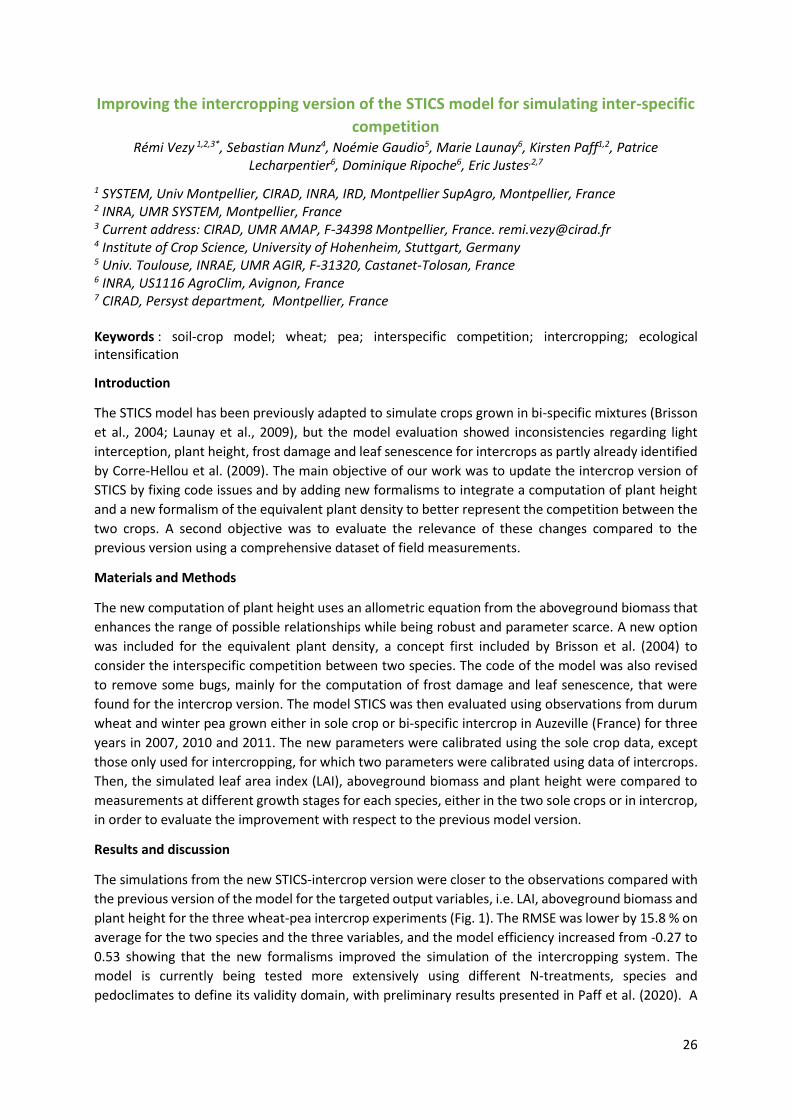
Improving the intercropping version of the STICS model for simulating inter-specific
competition Reacutemi Vezy 123 Sebastian Munz4 Noeacutemie Gaudio5 Marie Launay6 Kirsten Paff12 Patrice
Lecharpentier6 Dominique Ripoche6 Eric Justes27
1 SYSTEM Univ Montpellier CIRAD INRA IRD Montpellier SupAgro Montpellier France 2 INRA UMR SYSTEM Montpellier France 3 Current address CIRAD UMR AMAP F-34398 Montpellier France remivezyciradfr 4 Institute of Crop Science University of Hohenheim Stuttgart Germany 5 Univ Toulouse INRAE UMR AGIR F-31320 Castanet-Tolosan France 6 INRA US1116 AgroClim Avignon France 7 CIRAD Persyst department Montpellier France Keywords soil-crop model wheat pea interspecific competition intercropping ecological intensification
Introduction
The STICS model has been previously adapted to simulate crops grown in bi-specific mixtures (Brisson
et al 2004 Launay et al 2009) but the model evaluation showed inconsistencies regarding light
interception plant height frost damage and leaf senescence for intercrops as partly already identified
by Corre-Hellou et al (2009) The main objective of our work was to update the intercrop version of
STICS by fixing code issues and by adding new formalisms to integrate a computation of plant height
and a new formalism of the equivalent plant density to better represent the competition between the
two crops A second objective was to evaluate the relevance of these changes compared to the
previous version using a comprehensive dataset of field measurements
Materials and Methods
The new computation of plant height uses an allometric equation from the aboveground biomass that
enhances the range of possible relationships while being robust and parameter scarce A new option
was included for the equivalent plant density a concept first included by Brisson et al (2004) to
consider the interspecific competition between two species The code of the model was also revised
to remove some bugs mainly for the computation of frost damage and leaf senescence that were
found for the intercrop version The model STICS was then evaluated using observations from durum
wheat and winter pea grown either in sole crop or bi-specific intercrop in Auzeville (France) for three
years in 2007 2010 and 2011 The new parameters were calibrated using the sole crop data except
those only used for intercropping for which two parameters were calibrated using data of intercrops
Then the simulated leaf area index (LAI) aboveground biomass and plant height were compared to
measurements at different growth stages for each species either in the two sole crops or in intercrop
in order to evaluate the improvement with respect to the previous model version
Results and discussion
The simulations from the new STICS-intercrop version were closer to the observations compared with
the previous version of the model for the targeted output variables ie LAI aboveground biomass and
plant height for the three wheat-pea intercrop experiments (Fig 1) The RMSE was lower by 158 on
average for the two species and the three variables and the model efficiency increased from -027 to
053 showing that the new formalisms improved the simulation of the intercropping system The
model is currently being tested more extensively using different N-treatments species and
pedoclimates to define its validity domain with preliminary results presented in Paff et al (2020) A
27
new R package that uses the STICS intercrop version was designed and used to perform simulations
and analysis (Vezy et al 2019) See the SticsRPacks project for more information (Buis et al 2020)
Conclusion
New formalisms were implemented in the STICS-intercrop version to model bi-specific intercrops with
a relatively simple conceptual approach simulating competition for light capture between two
intercropped species The new version successfully simulated LAI aboveground biomass and plant
height for both wheat and pea grown either in sole- or in intercropping
Acknowledgements
This work was funded by the ReMIX project a EUs Horizon 2020 Program
Figure 4 Simulated (lines) and observed (symbols) leaf area index (LAI) aboveground biomass and plant height for pea (red) and wheat (blue) grown in mixture simulated with the previous (straight) and new (dotted) STICS-intercrop version
References
Brisson N Bussiegravere F Ozier-Lafontaine H Tournebize R and Sinoquet H 2004 Adaptation of the crop model STICS to intercropping Theoretical basis and parameterisation Agronomie 24(6-7) 409-421
Buis S Lecharpentier P Vezy R and Giner M 2020 SticsRpacks a set of packages for managing Stics from R STICS model workshop - side-event of ICROPM Montpellier
Corre-Hellou G Faure M Launay M Brisson N and Crozat Y 2009 Adaptation of the STICS intercrop model to simulate crop growth and N accumulation in peandashbarley intercrops Field Crops Research 113(1) 72-81
Launay M et al 2009 Exploring options for managing strategies for peandashbarley intercropping using a modeling approach European Journal of Agronomy 31(2) 85-98
Paff K et al 2020 Calibration and Evaluation of the STICS Intercrop Model for Two Cereal-Legume Mixtures ICROPM 3-5 February 2020 Montpellier
Vezy R 2019 VEZYsticRs Parameter optimization (Version 110) Zenodo httpdoiorg105281zenodo3233968
28
Calibration and Evaluation of the STICS Intercrop Model for Two Cereal-Legume
1INRA UMR SYSTEM F-34398 Montpellier France email kirstenpaffinrafr 2SYSTEM Univ Montpellier CIRAD INRA IRD Montpellier SupAgro Montpellier France
3Institute of Crop Science University of Hohenheim 70599 Stuttgart Germany 4 CIRAD UMR AMAP F-34398 Montpellier France 5 INRA UMR AGIR 31326 Castanet-Tolosan France 6 CIRAD PERSYST Department 34398 Montpellier France
Mots cleacutes Intensification eacutecologique modegravele de culture Pois Orge Bleacute dur
Introduction
STICS is a soil-crop model capable of simulating crops in succession (Brisson et al 2003) Intercropping occurs when multiple species are grown simultaneously on the same field There has been a growing interest in adapting this traditional technique for modern agriculture as a way of ecological intensification especially for combining leguminous and cereal crops in order to reduce N inputs and potential environmental damage through N losses Intercropping adds complexity to the system by adding inter-species competition Crop models are useful tools for analyzing complex systems as they allow the user far more control over individual variables than is possible in field experiments A first version of the STICS intercrop model was created by Brisson et al (2004) and was recently improved by Vezy et al (2020) The aim of this study was to calibrate and evaluate this improved STICS-Intercrop model by simulating a winter and a spring intercrop mixture durum wheat-winter pea and barley-spring pea
Materials and Methods
The data set used for modelling comprised of four years of wheat (Triticum turgidum L) and pea (Pisum sativum L) field data from Auzeville France with multiple levels of nitrogen fertilizer and four years of barley (Hordeum vulgare L) and pea field data from Angers France (Corre-Hellou 2005) which in some years included two levels of nitrogen fertilizer and two different plant densities of the intercrops The sole crop trials were used for calibration and the intercrop trials for evaluation except for a subset of intercrop data that was used to calibrate the parameters unique to the intercrop model The assumption was that parameters common to both sole and intercropping such as plant-soil interactions and phenology would be the same for both The optimization method used for calibration was based on Wallach et al (2011) The parameters were broken down into 15 groups (16 for pea to include nitrogen fixation) for calibration each corresponding to a different process
Results and Discussion
The root mean square error (RMSE) for shoot biomass was 192 tha for winter pea and 137 tha for durum wheat The RMSE for grain yield was 184 tha for spring pea and 115 tha for barley Overall the model captured the dominancy of one species quite well however the accuracy has to be increased The phenology and height were correctly simulated Some of the discrepancies could be due to biological stresses that STICS does not capture The modelling efficiency is likely to improve because the model calibration process is still ongoing especially for the pea-wheat simulations Conclusions
The intercrop version of the STICS model was recently improved An automatic calibration was performed in this study using two different crop mixtures several years and multiple nitrogen
29
treatments to assess the capacity of the model to simulate these complex systems The model performed reasonably well considering the wide range of conditions on which it was calibrated STICS intercrop could be a useful tool for better understanding the processes and their interaction for this management practice
Acknowledgments
This work was funded by the ReMIX project a Research and Innovation project from the EUs Horizon
2020 Program Special thanks to Nadine Brisson for beginning the work on the STICS intercrop model
We also thank Marie Launay Dominique Ripoche and Patrice Lecharpentier for their work on the
model
(a) (b)
Figure 1 Simulated versus observed in season total aboveground biomass for wheat (a) and pea (b)
grown in intercrop with each other at Auzeville France
Reacutefeacuterences bibliographiques
Brisson N Bussiere F Ozier-Lafontaine H Tournebize R Sinoquet H (2004) Adaptation of the crop model STICS to intercropping Theoretical basis and parameterisation Agronomie 24(6-7) 409-421
Brisson N et al (2003) An overview of the crop model STICS European Journal of Agronomy 18(3-4) 309-332
Corre-Hellou G 2005 Acquisition de lrsquoazote dans des associations pois-orge (Pisum sativum LndashHordeum vulgare L) en relation avec le fonctionnement du peuplement PhD thesis Universiteacute drsquoAngers
Vezy R et al (2020) Implementation of new formalisms in STICS for intercropping modeling iCROPM Montpellier France
Wallach D et al (2011) A package of parameter estimation methods and implementation for the STICS crop-soil model Environmental Modelling amp Software 26(4) 386-394
30
Modelling the agronomic performance of millet-cowpea intercropping under the
semi-arid environment of Senegal Yolande SENGHOR123deg Franccedilois AFFHOLDER3 George Anicet Manga1 Mbaye Diop2 Alpha Bocar
Seacuteneacutegal 3CIRAD AIDA Montpelier France 4SODAGRI Dakar Seacuteneacutegal
Keywords Cropping system pearl millet cowpea model performance variability
Introduction
In the Sahel particularity in Senegal pearl millet ([Pennisetum glaucum (L) R Br] is one of the major
cereals constituting the bases of the populationrsquos subsistence However its production faces several
constraints leading to extreleley low yields (Affholder et al 2013) including the low nutrient content
of the soil especially nitrogen (Badiane 1993) Added to this is the high inter-annual variability of
climate the high cost of inputs and the low an inter_annually variable price of grain making
conventional crop intensification risky and poorly profitable economically The intercropping pearl
millet with cowpea is expected to promote better management of arable land thanks to a land
equivalent ratio (LER) greater than 1 ie the by improving the yield of the associated crops as
compared to sum of the yields of sole crops using the same amount of land (Obulbiga et al 2015)
Given the complexity of the variability of the responses of these intercrop depending on the soil and
climate contexts the use of modeling is a less costly and less time-consuming method than
experimentation which makes it possible to understand how the intercrop works and to test scenarios
of the intercrop in order to improve its functioning A fundamental aim of the experiment was to
simulate different scenarios in the context of climate change in order to obtain optimal production of
pearl millet while improving the physico-chemical conditions of the soil through the use of different
sources of nitrogen (chemical fertilizers intercropping system and mulching) Specifically this involves
studying the effect of fertilization mulching and association (and density of cowpea seedlings) on the
development and yield of pearl millet and cowpeas to assess the effect of the combination of different
nitrogen sources on soil physicochemical properties and crop yields to study the agronomic
performance (LER) of the intercropping pearl millet-cowpea and its inter annual variation according
to the combination of the different nitrogen sources and at the end of calibration validate the StiCs
model This is a work of which only the experimental part is today completed and in this
communication we only present the methodology of our project and the very first data analyzes that
we were able to carry out with the StiCs model
Material and methods
The trial was conducted at the National Center for Agronomic Research of Bambey Senegal during
the wintering 2018 and 2019 The experiment was set-up as a complete random block design with
a factorial structure in strictly rainy conditions and with additional irrigation
The factors studied were fertilization cropping system sowing density and mulching Pearl millet
souna 3 cowpea Baye Ngagne and 58-74f were used The data from these experiments will be used
to calibrate the StiCs model first also using the literature to configure the characteristics of the species
in our study Then we will evaluate the model by comparing the observed dynamics to those simulated
so as to verify what gives us the model to understand and predict the dynamics and finally perform
virtual simulations in a context of climate variability in order to evaluate the performance of these
systems in the future
First results
31
The literature review and the data from the 2018 experiments allowed a first calibration of the thermal
constants of the Stics model to reproduce the phenology and LAI of cowpea and millet in pure culture
Conclusion and continuation of the work The data obtained during these two years will allow us to
assess the agronomic performance of the associated mil-cowpea crops in different contrasting
fertilization situations and to calibrate the model
References
Affholder F Poeydebat C Corbeels M Scopel E Tittonell P 2013 The yield gap of major food
crops in family agriculture in the tropics Assessment and analysis through field surveys and modelling
Field Crops Res 143 106-118
Aminata Niane Badiane 1993 The organic status of sandy soil in the Center-North area of Senegal
Agricultural sciences National Polytechnic Institute of Lorraine pp224
Obulbiga MF Bougouma V and Sanon HO 2015 Improvement of the forage supply by the dual-use
cereal-legume crop association in the northern Sudanian zone of Burkina Faso International Journal
of Biological and Chimical Sciences vol 9 ndeg31431-1439
32
Calibration and evaluation of the STICS soil-crop model for sorghum-cowpea
intercrop in sub-Saharan Africa Traoreacute Amadou1 Gatien Faconnier2 Affholder Franccedilois2 Benjamin Sultan3 1 IER Bamako (Mali) 2 Cirad Monpellier (France) 3 IRD Monpellier (France) Introduction
Intercropping is an entry point for sustainable agricultural intensification particularly for the variable
rainfall conditions that prevail across sub-Saharan Africa However deriving relevant
recommendations for intercropping management requires field experiments The time cost and
technical skills required to study the temporal production of intercropping systems using field
experiments is likely to limit the number and duration of multi-years trials (Lobell et al 2009) To
address such limitations crop simulation models have been used to assess the agronomic and
environmental performances of cropping systems under diverse climatic conditions including
hypothetical future climate (Boote et al 1996) Intercropping has not been modelled extensively and
models that simulate these cropping systems such as STICS have not often been evaluated for tropical
conditions and for species grown by farmers in sub-saharan Africa The objective of this study was to
evaluate the performance of STICS model adapted for West African conditions to simulate the growth
and productivity of sorghum-cowpea cropping systems
Material and method
We used the STICS soil-crop model and data from field experiments conducted at the NTarla
Agronomic Station in Mali in 2017 and 2018 Two varieties of sorghum (local and improved) with
different photoperiod sensitivity were grown as sole crop or intercropped with cowpea Two sowing
dates and two levels of mineral fertilization were also investigated Model simulations were evaluated
using observed data for phenology leaf area index (LAI) biomass yield and soil moisture The
performance of the model was evaluated using root mean square error (RMSE) and model efficiency
(EF)
Results
So far the calibration has been performed for sole crops only After calibration the model satisfactorily
simulated sorghum phenology (RMSE = 338 days for flowering and 341 for maturity) Cowpea
phenology was less well simulated (RMSE = 1327 days for flowering and 930 for maturity) Model
simulation were satisfactory for soil moisture (RMSE = 14 EF = 072) and aboveground plant biomass
(RMSE = 39 EF = 83) With current calibration the model underestimated the leaf area index with
RMSE of 49 and EF of 046
Conclusion
Our work provides a first calibration and evaluation of the sole crops involved in the sorghum cowpea
intercropping under rainfed conditions in southern Mali The next step of the work will be to calibrate
the intercropping treatments
Keywords Crop model Biomass Leaf area index Water use efficiency References Boote K J Jones J W and Pickering N B (1996) lsquoPotential Uses and Limitations of Crop Modelsrsquo Agronomy Journal 88(September) pp 704ndash716 doi 102134agronj199600021962008800050005x
Lobell D B Cassman K G and Field C B (2009) lsquoCrop Yield Gaps Their Importance Magnitudes and Causesrsquo Annual Review of Environment and Resources 34(1) pp 179ndash204 doi 101146annurevenviron041008093740
33
Session 4 Methods and new tools for modelling with STICS
AgGlob Workflow for simulation of agronomic models at a global scale Raynal Heacutelegravene1 Ancelet Estelle1 Le Bas Christine2 Bertuzzi Patrick3 Cahuzac Eric4 Casellas Eric1 Chabrier Patrick1 Constantin Julie5 Pomeon Thomas4 Toutain Benoicirct6
1thinspUR 875 MIAT MIA INRA Castanet Tolosan France heleneraynalinrafr 2thinspUS 1106 INFOSOL EA INRA Orleacuteans France 3thinspUS 1116 Agroclim EA INRA Avignon France 4thinspUS 0685 ODR SAE2 INRA Castanet Tolosan France 5thinspUMR 1248 AGIR EA INRA Castanet Tolosan France
Keywords Crop modeling Computational modeling Parallel computing Global simulation
Introduction Simulation of biophysical models over large areas is used in different contexts linked to global agronomy issues (Muumlller et al 2017) It is useful for analyzing crop performances at a regional scale (Shelia et al 2019) for estimating vulnerability of crop production to climate change (Elliot et al 2014 Montella et al 2015) One of approaches is Global Gridded Biophysical Models (GGBMs) It consists to use a crop model developed at field scale and to run it on different sites in order to take into account the heterogeneity of soils climates and farming practices over the area The sites are organized according to a spatial grid with a fine resolution (some km-2) It is possible to run these massive simulations thanks to the development of clusters It is also possible because more and more data are available to characterize soil climate and farming practices at fine resolution Nevertheless many difficulties remain They concerned i) the coordination of the actors involved in the process of production of results ii) the heterogeneity of data formats that makes tricky to reuse them iii) the design and the realization of the campaign of simulations iv) the validation of simulation results by automated tests v) the reproducibility of results and traceability vi) methods and visualization tools suitable to the mass of results to analyze To overcome these problems we propose the AgGlob framework based on a workflow developed on a Galaxy platform instance (httpsgalaxyprojectorg) Materials and Methods A workflow consists in a sequence of treatments where each step is dependent on occurrence of the previous step The first treatments concern the access to data stored in external databases and their processing in order to make them compatible to the crop model For this step we have developed basic bricks of the workflow - ldquoClimate datardquo tool access to datasets composed of daily observations of temperature radiation rain and PET These data are provided under conditions by SICLIMA database (INRA climate series provider) The SAFRAN grid is used (Meteo France standard with a resolution of 8km) Queries and post-processing are automated - ldquoSoil datardquo tool access to BDGSF (French Soil Geographic Database) maintained by Infosol (INRA provider) An SQL query requests the data It puts the data into the format expected by the crop model - ldquoLand userdquo and ldquoFarming practicesrdquo tool All the information concerning soil land use in France and farming practices come from the national surveys ldquoFrench Land Parcel identification systemrdquo and ldquoEnquecirctes pratiques agricolesrdquo The information are stored in ODR database (INRA provider) and aggregated at the grid scale The objective is to have for each cell of the grid the most representative i) soils ii) rotations and iv)farming practices All these layers of information are combined based on the conceptual work done in INRA study Evaluation Franccedilaise des Ecosystegravemes et des Services Ecosysteacutemiques The results is a table where each line corresponds to a point to simulate with all the information required for simulation (crop rotation sowing date hellip) on a concise form
34
The second step of the workflow consists in preparing the campaign of simulations with the bricks - ldquoSimulation Campaignrdquo tool The previous table is transformed into a text file The user can download and modify it in order to design a new simulation campaign (scenario) The tool includes algorithms for testing the validity Then this text file is sent to the parallelization service of RECORD simulation platform (Bergez et al 2014) embedded in the tool - ldquoCrop simulationrdquo tool The model used is STICS encapsulated in RECORD (Bergez et al 2014) It runs the campaign simulation on the cluster The third step concerns the post-processing of simulation results with automated checks of simulation results and the production of indicators Results and Discussion AgGlob is available on an INRA Galaxy instance It is connected to a distant cluster (MesoLR) where the simulation jobs are run It includes a formalization of GGBMs campaign simulation that we consider as a standard reusable in other projects A campaign of simulations generates large amount of results Some consistency checks have been integrated in order to help the user in detecting problems The workflow can be plugged on other Galaxy instances Conclusion AgGlob is an interesting framework for GGBMs simulation It helps in coordinating the actors involved because the different steps of processing are clearly identified and formalized It also offers a solution for the integration and aggregation of data necessary for simulation by using automated processing algorithm It is enough generic to be easily extend to other crop models and to other data It is also an implementation of the FAIR principles in the domain of GGBMs work therefore it enhances the reproducibility and traceability of results References
Shelia V Hansen J Sharda V Porter C Aggarwal P Wilkerson C Hoogenboom G (2019) A multi-scale and multi-model gridded framework for forecasting crop production risk analysis and climate change impact studies Environ Model Softw 115 144-154
Muumlller C Elliott J Chryssanthacopoulos J et al (2017) Global gridded crop model evaluation benchmarking skills deficiencies and implications Geosci Model Dev 10 1403ndash1422 httpsdoiorg105194gmd-10-1403-2017
Bergez JE Raynal H Launay M Beaudoin N Casellas E Caubel J Chabrier P Coucheney E Dury J Garcia de Cortazar-Atauri I Justes E Mary B Ripoche R Ruget F (2014) Evolution of the STICS crop model to tackle new environmental issues New formalisms and integration in the modelling and simulation platform RECORD Environ Model Softw 62 370-384
Elliott J Kelly D Chryssanthacopoulos J Glotter M Jhunjhnuwala K Best N Wilde M Foster I (2014) The parallel system for integrating impact models and sectors (pSIMS) Environ Model Softw 62 509-516 httpsdoiorg101016jenvsoft201404008
Montella R Kelly D Xiong W Brizius A Elliott J Madduri R Maheshwari K Porter C Vilter P Wilde M Zhang M Foster I (2015) FACE-IT A science gateway for food security research Concurrency Computat Pract Exper 27 4423ndash 4436 doi 101002cpe3540
35
Preliminary coupling of STICS (v91) to PEcAn ecological informatics toolbox and its
comparison to BASGRA Istem Fer1
1 Finnish Meteorological Institute Helsinki Finland
1Agriculture et Agroalimentaire Canada Centre de recherche et de deacuteveloppement de Charlottetown
Canada 2Agriculture et Agroalimentaire Canada Centre de recherche et de deacuteveloppement drsquoOttawa Canada 3Agriculture et Agroalimentaire Canada Centre de recherche et de deacuteveloppement de Queacutebec Canada
Keywords Global optimization assimilation of LAI STICS Earth observation
Introduction
The assimilation of leaf area index (LAI) derived from Earth observation (EO) data is an effective approach to improve yield predictions Assimilation can be done by re-initializing some input parameters such as seeding date seeding density and soil moisture at field capacity which are not readily available (Jeacutego et al 2015) The performance of assimilation techniques are however affected by the method used for optimization and its ability to find a global solution Thus there is a need to develop a user-friendly global optimization tool for crop modeling applications
Material and methods
We introduce a
new global
optimization
package (global
optimization for
calibration and
assimilation
GOCA) under
which various
optimization
approaches
embedded in
MATLAB global
optimization
toolbox are
integrated with the
STICS crop model
The package is
compiled with
MATLAB compiler
which makes it an standalone package for users with no MATLAB GOCA loads information related to
simulation units (eg name of climate soil and observation files) from a spread sheet which can be
modified by users The spread sheet also contains information related to optimization bounds for
variables Furthermore GOCA allows users to select the optimization techniques with related settings
The approaches included in the package are Patternsearch Particle Swarm Simulated Annealing and
Surrogate
Results
Figure 1 a view of GOCA optimization package
38
To examine the performance of different
optimization techniques a study was conducted
in a small experimental farm in Ottawa (ON
Canada) planted with soybean corn and spring
wheat during 1999 to 2010 The simulation units
were obtained by overlaying the field boundaries
to soil map EO data were acquired from various
sources 3 to 9 images for 1999 to 2008 from
multi-spectral images (Landsat or SPOT) and
airborne hyperspectral images (CASI) 13 images
for 2010 from multi-spectral Formosat-2 LAI was
retrieved from MTVI2 (Haboudane et al 2004)
and EVI2 (Huete 2002) derived from the EO data
(Liu et al 2012) The optimization setting were set
at default values and the maximum iteration were
set at 20 iterations for techniques that allowed for
such settings We compared different optimization techniques with the simplex approach in JavaSTICS
(Table 1) All methods embedded in the GOCA package outperformed the Simplex approach embedded
in JavaSTICS in both yield and LAI prediction
Surrogate Simulated Annealing and Particle Swarm approaches are stochastic approach whereas
Patternsearch and simplex are deterministic While the run time of Patternsearch was the same as
Simplex it provided better performance Among stochastic approaches Particle Swarm outperformed
others with reasonable running time (eg 7 minutes per simulation unit) The performance of Particle
Swarm approach also outperformed others in predicting seeding date seeding density and soil
moisture at field capacity
References
Jeacutego G Pattey E Mesbah M Liu J Duchesne I 2015 Int J Appl Earth Obs Geoinf 41 11-22
Haboudane D Miller J R Pattey E Zarco-Tejada PJ Strachan IB 2004 Rem Sens Environ 90(3) 337-352
Huete A Didan K Miura T Rodriguez E P Gao X amp Ferreira L G 2002 Rem Sens Environ 83 195ndash213
Liu J Pattey E Jeacutego G 2012 Rem Sens Environ 123 347ndash358 Wallach D Buis S Lecharpentier P Bourges J Clastre P Launay M Bergez JE Guerif M
Soudais J Justes E 2011 Environmental Modelling and Software 26 386-394 Vrugt J a Braak C Ter Clark MP Hyman JM Robinson B a 2008 Water Resources Research
44 1ndash15
Tabel 1 Performance of different optimization methods
Optimization Technique
Run time1 per simulation (second)
Yield LAI
ME RMSE ME RMSE
Simplex (JavaSTICS) 25 seconds -1297 2675 1097 5225 Surrogate 25 seconds -008 2305 -591 5230 Simulated Annealing 7 hours -225 2417 141 4603 Particle Swarm 8 minutes 751 2074 135 4161 Patternsearch 25 seconds -603 1892 158 4162 1The conputer CPU information for these runs was Intelreg Coretrade i7-6600U CPU 260 GHz
Figure 2 Information on soil texture crops and field locations LAI extracted from Formosat-2 images in 2010 are also illustrated for 3 fields
39
STICS on SIWAA A STICS Tool set deployed on the SIWAA Galaxy Web platform Patrick Chabrier1 Estelle Ancelet1
1 INRA UR 875 MIAT 31326 Castanet Tolosan France
Keywords Virtual Research Environment Crop Simulation Model Simulation Workflow
Introduction
In many cases of virtual scientific experiments or studies collaborative development of workflows of
simulations on appropriate computing resources is essential Like the FACE-IT [1] framework did
propose his Web portal to support the AGMIP [2] Project the SIWAA [7] framework is a new Galaxy
Web Platform that intent to support the AgGlob [6] Project
In this paper we outline some of the main requirements the SIWAA platform aims to address describe
the architecture present the early Stics [4] tool set outline the integration process and propose future
direction for the involved teams and users
Requirements
We propose her the two main requirements we address in priority
access to computational resources Even if either academic or commercial computing resources are
available many users do not have enough skills or time to implement efficient virtual experiment on a
high performance computer And This difficulty is increased when the members of a project do not
have access at the same computing resources and for the same periodicity Therefore the access to
computational resource should be given and permanent
sharing active pipeline of tools As soon as researcher collaborate to develop a virtual experiment
chaining the execution of softwares they can face many difficulties like complex installation
procedures personal workspace heterogeneity versioning of data and softwares persistency and
serialisation of the pipeline One of the solution is to centralize the deployment of the softwares on a
central system accessible by the web
Architecture and Services
SIWAA is fully based on the Galaxy Web platform [3] providing a simple uniform and extensible
workflow authoring and execution interface that enable to develop workflows of simulation in
collaborative way The design of the deployment of Galaxy we have achieved is in two parts On one
side the Web server is running on a simple Linux Virtual Machine hosted by the INRA services at
Toulouse and at the other side we have configured the system to run computing Jobs on the High
Performance Computing Center MESOLR [8]
In order to gives to the authors of the tools a complete access control we do provide a tool access
management system based on the concepts of groups and roles already available And according to
their economics resources users can also use specific computing account that they can decide to by at
MESOLR Furthermore we can enable the users to parametrize by them self the computing
resources they want to get from the High Performance Computing Center
The tool delivery process we decide to adopt oblige the authors of tools to package each tool and
publish them on our own Toolshed service also provided by Galaxy Nevertheless in order to be
efficient and flexible we allow two kind of packaging Either you can package the classic way by
providing scripts where component dependencies are solved by the CONDA [11] packaging system or
40
you can package by providing a command line referencing a Docker [9] container that will be executed
by Singularity [10] on the HPC
A Stics tool set
In order to validate the operational capability of the SIWAA platform according to the GEOC project
founded by the INRA we decide to focus on the development of suite of tools enabling some use cases
of the Stics Models
OptimizeStics90 enables to optimize a set of Stics parameters according to situations and
observations based on on SticsRPacks [5] embedded inside a Docker container is parallelized
SimulateStics850 amp SimulateStics91 simulate one or many Stics Workspaces in parallel with
or without a plan based on simple scripts calling the Stics simulatior embedded inside a
Docker Container
ConvertStics850 amp ConvertStics850 convert Stics Xml Workspaces to Stics Workspaces
runnable by the Stics Command Line Interface
MorrisGrid amp MorrisGridIndices provide a Morris experimental plan and compute the result
of a sensitivity analysis based on the SticsRPacks
WaterStatus and WaterStatusAtFlowering provide graphical outputs convenient for the
OPERATE[13] project implemented with R Scripts
Conclusion
SIWAA is a new infrastructure designed to facilitate the sharing of active virtual experiment and the
access to a HPC system By providing a first tool set dedicated to the Stics model we have demonstrate
our capability of feeding the system with promising applications We will now be facing new goals like
hosting new simulators and factorizing companion tools and data usages and this in order to
contribute to the animation of a SIWAA user community
References
1 Montella R Kelly D Xiong W Brizius A Elliott J Madduri R amp Zhang M (2015) FACE‐IT A
science gateway for food security research Concurrency and Computation Practice and
Experience 27(16) 4423-4436
2 Rosenzweig C Jones J W Hatfield J L Ruane A C Boote K J Thorburn P amp Asseng S
(2013) The agricultural model intercomparison and improvement project (AgMIP) protocols
and pilot studies Agricultural and Forest Meteorology 170 166-182
3 Madduri R Chard K Chard R Lacinski L Rodriguez A Sulakhe D amp Foster I (2015) The
Globus Galaxies platform delivering science gateways as a service Concurrency and
Computation Practice and Experience 27(16) 4344-4360
4 Brisson N Mary B Ripoche D Jeuffroy M H Ruget F Nicoullaud B amp Richard G (1998)
STICS a generic model for the simulation of crops and their water and nitrogen balances I
Theory and parameterization applied to wheat and corn
5 Buis S Vezy R Lecharpentier R(2019) SticsRPacks httpsgithubcomSticsRPacks
41
6 HRaynal E Ancelet C Le Bas P Bertuzzi E Cahuzac E Casellas P Chabrier T Pomeacuteon HRaynal
B Toutain AgGlob Calcul et workflow pour la simulation informatique de modegraveles
agronomiques agrave lrsquoeacutechelle de la France Journeacutees JCAD (Calcul et donneacutees) 2019 91011 oct
7 Chabrier P Ancelet E(2019) SIWAA Simulation Worflows Agroecosystems Analyses
httpssiwaatoulouseinrafr
8 httpsmeso-lrumontpellierfr
9 httpswwwdockercom
10 httpssingularitylblgov
11 httpsdocscondaio
12 Chabrier P Latrille E Giacomoni F (2019-2020) GEOC Galaxy Extra-omique Community
13 Bancal Dresch Launay M (2019-2020) OPERATE Simulations de strateacutegies drsquoadaptation des
cultures de bleacute en contexte de CC
42
A new method for sensitivity analysis of models with dynamic andor spatial
1 INRA UMR 1114 EMMAH 84914 Avignon France samuelbuisinrafr 2 University of Guyane 228-UMR-Espace dev Cayenne France 3 INRA UMR MISTEA 34060 Montpellier France
Introduction Global Sensitivity Analysis (GSA) is recognized as a powerful tool for measuring the impact of models inputs on simulated outputs under prescribed inputsrsquo variability Although many simulation models among which crop models produce temporal andor spatial data extracting relevant information from GSA of such outputs is still challenging This requires the use of Multivariate Sensitivity Analysis methods (MSA) that are often based on a dimension reduction principle model outputs are projected onto predefined or data-driven orthogonal bases such as polynomial or eigenvectors (Lamboni et al 2011) They are however so far limited by the selection of the associated bases which is constrained by orthogonality requirements Indeed these bases do not always allow extracting relevant and interpretable information on structural properties of multivariate outputs More applicable MSA methods are thus expected to be developed (Wei et al 2015) In this work we propose a new MSA method combining GSA and clustering Cluster-based GSA Clustering methods have been designed to identify groups of similar objects in multivariate data sets They may thus be particularly adapted to capture the variability of behaviors of modelsrsquo temporal andor spatial outputs However while binary clustering has been extensively used in scalar sensitivity analysis to assess the importance of factors leading to a region of interest (Raguet and Marrel 2018) there is still a lack of quantitative sensitivity analysis methods taking benefit of a clustering of multivariate outputs with any number of clusters The main idea of the proposed method is to apply clustering to model outputs simulated on a numerical design-of-experiment generated using a given GSA method and to compute standard GSA indices (eg Sobolrsquo indices) not on the models outputs but on new variables indicating the membership of each output to the different clusters (see Fig 1) We propose to use a fuzzy clustering method the new variables are thus the so-called membership functions (MF valued in [0 1]) that quantify the degree of membership of any model simulated output to each cluster The computation of sensitivity indices on either the MF or MF differences allows discussing which parameters influence the membership to a given cluster or drive the output from one cluster to another A generalized sensitivity index (Lamboni et al 2011) is also introduced to quantify the overall contribution of the parameters wrt any change of clusters
43
Figure 1 Workflow of the Cluster-based GSA X represents the vector of model inputs that varies in
the sensitivity analysis Y(t) the (temporal in this case) output simulated by the model K is the number of clusters i the index in the design-of-experiment
Applications The method has been applied using Sobolrsquo and FAST GSA methods to (i) a dedicated toy model producing temporal signals with one or two maxima in response to five
parameters (ii) the Cantis model (Garnier et al 2003) simulating the transformations of carbon and nitrogen
in soils (10 parameters varying) (iii) the Stics crop model (Coucheney et al 2015) on the Multi-Model Ideotyping Agmip 2019
exercise (27 parameters varying) Results have shown that the model behaviors can be efficiently reported by the newly proposed method Conclusions The proposed method is particularly adapted to models with dynamic andor spatial outputs that produce distinguishable sets of responses ie when clustering of these outputs lead to well separated and interpretable clusters In this case it is particularly powerful for identifying the model inputs that drive these different behaviors The method is generic wrt clustering and GSA method used Keywords
Sensitivity analysis multivariate outputs generalized sensitivity indices References Coucheney E Buis S Launay M Constantin J Mary B de Cortaacutezar-Atauri I G Leacuteonard J (2015) Accuracy robustness and behavior of the STICS soilndashcrop model for plant water and nitrogen outputs evaluation over a wide range of agro-environmental conditions in France Environmental Modelling amp Software 64 177-190 Garnier P Neel C Aita C Recous S Lafolie F Mary B (2003) Modelling carbon and nitrogen dynamics in a bare soil with and without straw incorporation European Journal of Soil Science 54(3) 555-568 Lamboni M Monod H Makowski D (2011) Multivariate sensitivity analysis to measure global contribution of input factors in dynamic models Reliability Engineering amp System Safety 96(4) 450-459 Raguet H Marrel A (2018) Target and Conditional Sensitivity Analysis with Emphasis on Dependence Measures arXiv preprint arXiv180110047 Wei P Lu Z Song J (2015) Variable importance analysis a comprehensive review Reliability Engineering amp System Safety 142 399ndash432
44
Session 5 Environmental impact of cropping systems and soil CampN
dynamics
Verification and long-term simulations of STICS crop model to predict and analyze
growing seasons N2O fluxes of spring wheat in eastern Canada Elizabeth Pattey1 Guillaume Jeacutego2Joeumll Leacuteonard3
1 Agriculture and Agri-Food Canada Ottawa ON Canada
2 Agriculture and Agri-Food Canada Quebec QC Canada
3Institut National de la Recherche Agronomique Barenton-Bugny France
Keywords greenhouse gas emissions nitrogen fertilization rainfed crop
Introduction
Capturing the variability of nitrous oxide (N2O) fluxes during the growing season in response to
synthetic fertilizer application and climate variations is quite challenging for process-based models
Indeed nitrous oxide fluxes are very sporadic and heterogeneous This variability is not well captured
yet in the inventories based on emission coefficients Verifying process-based model prediction of N2O
emissions is a top priority if we want to reduce the uncertainty in our regional and global estimates
and if we want to make sound assessments of beneficial management practices over space and time
Material and Methods
The STICS crop model can simulate the soilndashcrop system with a daily time step by individual year (ie
with annual reinitialization) or linked over multiple years to account for crop rotation (ie no annual
reinitialization) The daily N budget takes into account mineralization denitrification nitrification NH3
volatilization and crop N uptake Recently new nitrification and denitrification formalisms (Bessou et
al 2010) were added to STICS crop model to estimate N2O emissions based on experimental results
collected mostly from western Europe Denitrification and nitrification are assumed to occur in the
biologically active layer (ie 30 cm in the present study) The N2O predictions of STICS were evaluated
against field-scale fluxes measured using micrometeorological towers equipped with a tunable diode
laser to measure fast-response N2O gradients The N2O fluxes were measured in spring wheat (Triticum
aestivum L) fields (Ottawa ON Canada) during 5 growing seasons between 2001 and 2014 The
experimental fields were tiled drained and had homogeneous soil properties (silty clay loam and clay
loam soil textures) Different mineral N fertilization rates (40-80 kg N ha-1) and forms (urea ammonium
nitrate) were applied The study focused on growing season N2O emissions following mineral
fertilization which were divided between the vegetative and reproductive stages In humid climate
regions such as eastern Canada nitrous oxide emissions are mostly driven by denitrification and to a
lesser extent by nitrification After completing the model performance verification with annual
reinitialization long-term simulations (1953-2012) were performed at Ottawa and Quebec City for
three N fertilization rates (100 80 and 60 of the recommended N rate) and on two contrasted
soil textures (sandy loam and clay loam in Ottawa sandy loam and silty clay in Quebec City) Simulation
results were analyzed to evaluate the impact of climate variability on N2O fluxes
45
Results
Overall the STICS model predictions were in the same range than the observations for each growing
season except for 2014 resulting in a normalized root mean square error of 254 for all years and
115 when 2014 was excluded Model predictions were usually smaller than measured values for the
vegetative stage when denitrification was dominant (mean error of -026 kg N ha-1) During the
reproductive stage the predictions were closer to the observations (mean error of 006 kg N ha-1) The
best results were obtained in 2005 when a dry spell occurred during the vegetative stage Although
the temporal dynamic of N2O fluxes was not always well captured by the model the satisfactory results
obtained for cumulative emissions over the entire growing season allowed to perform long term
simulations over 60 years using the STICS model
As expected the long-term simulation results showed that N2O fluxes were greater on more clayed soil
and for the higher N fertilization rates The N2O fluxes of the recommended N fertilization treatments
were 15 to 32 greater than those of the treatments with 60 of the recommended N rate The N2O
fluxes were also greater in Quebec City (47oN) than in Ottawa (45oN) as a result of the more humid
climate favorable to denitrification processes In Ottawa the fluxes during the vegetative stage were
mainly controlled by the N fertilization rate On the other hand the fluxes during the reproductive
stage were not affected by fertilization rate but a strong linear relationship was found with cumulative
precipitation (R2 ranging from 048 to 065) These results could be explained by the fact that in the
spring during the vegetative stage soil moisture was usually high and soil nitrate was then the main
factor controlling soil N processes and N2O fluxes In summer during the reproductive stage soil
moisture was much more variable and became the main factor controlling soil N processes and N2O
fluxes Weaker similar results were found in Quebec City for the sandy loam soil (R2 ranging from 023
to 028) However on the silty clay soil texture no clear relationship between precipitation and N2O
fluxes was found most likely because soil water retention was greater for this texture in response to
the elevated precipitation Further analyzes are planned to evaluate the effect of growing degree-days
and crop growth on N2O fluxes
This study showed that the recent improvement of the STICS crop model allowed to simulate quite
accurately the cumulative N2O fluxes during the growing season under variable climate conditions of
eastern Canada Accurate simulation of soil moisture during the reproductive stage and soil mineral N
content during the vegetative stage were found to be critical for obtaining accurate predictions The
next phase of the project will be to evaluate the model performance over the entire year from spring
crop seeding until the next spring crop seeding thus including winter with snow cover and the high
N2O emission period following snow melt and spring thaw
References
Bessou C Mary B Leacuteonard J Roussel M Greacutehan E Gabrielle B 2010 - Modelling soil compaction
impacts on N2O emissions in arable fields European Journal of Soil Science 61(3) 348-363
46
Modelling decomposition and N2O emissions of mulches varying in quantity and
1 Federal University of Santa Maria Santa Maria Brazil 2 FARE laboratory INRAE Universiteacute de Reims Champagne Ardenne Reims France 3 AgroImpact INRAE Laon France
Conservation agriculture promotes permanent soil cover with plants or crop residues This practice is
already widely adopted in the subtropical part of Brazil and worldwide (field crops perennial or semi-
perennial crops) The decomposition of crop residues left on soil surface is a complex process driven
primarily by chemical composition (or quality) of residues environmental conditions and soil-residue
contact Changing the quality of residues results in changes in the rate of decomposition and
mineralization of nutrients The amount and morphology of residues determines mulch thickness
which influences how soil surface moisture and temperature are in turn affected All these changes
also affect nitrous oxide (N2O) emissions from nitrification and denitrification which are strongly
affected by inorganic N labile C and soil water status Field experiments to evaluate the whole
spectrum of mulch scenarios would require considerable time and resources Simulation models such
as STICS have the potential to help in the evaluation of this whole range of possible scenarios as they
allow to explicitly describe the link between mulch characteristics crop residues decomposition and
N2O fluxes However remaining gaps in the detailed knowledge of how mulches decompose still limit
the predictive use of models Recent experimental results had for example challenged the widely used
hypothesis of a double compartment mulch decomposition model in which a decomposing layer of
limited thickness in contact with the soil is feeded by an upper non decomposing layer In this context
the objective of the present study is to use specific in situ experiments with mulches varying both in
thickness and quality to evaluate and improve the ability of the STICS model to simulate the
decomposition and N2O emissions of crop residues left at the soil surface This should help for residue
management in no-till systems in southern Brazil
Experimental data and simulation methodology
The dataset used comes from two field experimental studies carried out in Santa Maria Brazil
(29deg42rsquo44rdquo S 53deg42rsquo74rdquo W about 90 m elevation) The local climate is of humid subtropical type
(Koumlppen Cfa) The mean annual temperature is 161 degC and average annual precipitation is 1660 mm
The soil is a Typic Paleudalf with 110 g kg-1 clay 260 g kg-1 silt and 630 g kg-1 sand in the 0-10 cm layer
The first study (Pinheiro et al 2019 Dietrich et al 2019) followed N2O and NH3 emissions during a
sugarcane growth cycle on treatments with different straw quantities (0 4 8 and 12 t DM ha-1)
returned to the soil surface and two N fertilizer rates (0 and 100 kg N ha-1 as urea) Mulch
decomposition soil moisture soil temperature and soil inorganic N over 0-10 cm depth were
measured several times during the experiment The second study (Schmatz et al submitted 2019)
followed over one year the decomposition and N2O emissions of mulches of vetch and wheat added
on a bare soil at different rates (3 6 and 9 t DM ha-1) Soil surface moisture and temperature were daily
monitored during all the experimental period using sensors Mulch decomposition and soil inorganic
N were measured several times during the experiment A step-by-step approach was defined for the
simulation exercise which was conducted using the STICS model v91 Simulation results were first
evaluated for the bare soil treatment to check for correct simulation of soil temperature soil water
47
content basal soil mineralization and N2O emissions Then the different mulches were simulated and
mulch decomposition rates were evaluated for different hypothesis regarding the thickness of the
mulch decomposing layer The effect of the different quantity and quality of mulch on soil water
content C and N dynamics and N2O emissions were then analyzed Only the results from the second
experiment are presented here
First results
Small changes to the STICS general parameterization of soil evaporation were necessary to improve
soil water dynamics simulation in the 0-5 cm and 5-10 cm layers for the bare soil An increase in basal
soil mineralization and a decrease of the potential nitrification rates improved a lot the simulated CO2
fluxes and soil mineral nitrogen dynamics both without and with the mulch Changes in the order of
magnitude of CO2 fluxes with different mulch amounts and nature were particularly well reproduced
The first simulation results also indicated that over the range of mulch amounts considered much
better results were obtained by considering that the whole mulch layer is decomposing and not only
the lower part of it in better contact with the soil Finally introduction of a double component
denitrification potential defined as the sum of a constant soil contribution and a variable component
depending on residue decomposition rate and composition allowed to reproduce well the order of
magnitude and dynamics of N2O fluxes (Figure 1)
Figure 1 Observed and simulated dynamics of N2O emissions for the bare soil and two different mulches of 6 tonha (vetch and wheat)
Acknowledgements
This study was financed in part by Coordenaccedilatildeo de Aperfeiccediloamento de Pessoal de Niacutevel Superior - Brasil (CAPES)
ndash Finance Code 001
References
Dietrich G Recous S Pinheiro P-L Weiler D-A Schu A-L Rambo M-R-L Giacomini S-J 2019 ndash Gradient of decomposition in sugarcane mulches of various thicknesses Soil Tillage Res 192 66-75
Nicolardot B Recous S Mary B 2001 ndash Simulation of C and N mineralization during crop residue decomposition a simple dynamic model based on the CN ratio of the residues Plant and Soil 228(1) 83-103
Pinheiro P-L Recous S Dietrich G Weiler D-A Schu A-L Bazzo H-L-S Giacomini S-J 2019 ndash N2O emission increases with mulch mass in a fertilized sugarcane cropping system Biol Fert Soils 55 511-523
Schmatz R Recous S Weiler D Pilecco G Schu A Giovelli R Giacomini SJ How the mass and quality of wheat
and vetch mulches affect drivers of soil N2O emissions Submitted Geoderma 2019
48
Modelling short and long-term nitrogen and carbon budgets of agro-ecological
cropping systems with a dedicated STICS research version Beaudoin N1 Strullu L1 Autret B1 Yin X1 Chleacutebowski F1 Louarn G2 Ferchaud F1 Ripoche D3
Lecharpentier P3 Leacuteonard J 1 Mary B 1
1 INRA AgroImpact Site de Laon 180 rue Pierre-Gilles de Gennes 02000 Barenton-Bugny France 2 INRA UR P3F 86600 Lusignan France 3INRA US Agroclim Domaine Saint Paul Site Agroparc 84914 Avignon Cedex 9 France
nicolasbeaudoininrafr
Keywords cropping system conventional farming organic farming long-term perennial organs
Introduction
Coupled studies of carbon (C) nitrogen (N) and water cycles address several issues increasing carbon
storage in soils (integrating C and N stoichiometry constraints) reducing greenhouse gas (GHG)
emissions and ensuring aquifers refill despite increasing soil water deficits But the performances of
agro-ecological systems facing these issues must be evaluated Conducting assessments using a
deterministic model raises the question of its ability to predict N mineralizationimmobilization
turnover due to residues decomposition particularly dead roots materials
The STICS model has already been used to simulate multi-services catch crops (CC) long-term impacts
However the actual standard version (91) cannot simulate perennial species within rotations
including also annual crops while a dedicated research version of the model can do it It takes into
account the symmetry between C and N plant compartments including perennial reserves the daily
dynamics of the root system and its turnover (and associated C and N fluxes) as well as specificities of
perennial crops For this study we used a specific release of this research version (number 1610) but
it is still under development and will be merged in a future STICS standard version
This abstract describes the performances of this research version applied to four different cropping
systems at different time scales particularly with conventional (CONV) and organic (OF) cropping
systems The assumption made to extend STICS to organic farming was that its formalisms are still valid
if weeds pests and diseases are sufficiently well controlled (Autret et al in press)
Results and discussion
In an OF field context where alfalfa is partially used as green manure the prediction of the soil mineral
nitrogen (SMN) stock by continuous simulations without any calibration was successful (Figure 1) The
model could simulate the development and growth of alfalfa from seedling to destruction with a
unique corpus of formalisms and parameters (Strullu et al 2020)
The model was used to simulate long-term (1977-2015) datasets obtained with seven undisturbed
lysimeters monitored by INRA in CONV systems at Fagniegraveres (France) It predicted satisfactorily soil
organic nitrogen (SON) stocks after three soil parameters have been calibrated against two other
lysimeters (Figure 2) Crop yields exports and drained water quantities were also well predicted (Yin
et al 2020) Leaching was underestimated by 37 in cropped lysimeters but not in the bare fallow
lysimeter However the simulation of the nitrate leaching reduction allowed by CC was correct
49
Figure 1 Observed and simulated SMN (kg N haminus1 in 0-150 cm) during cropping and after alfalfa destruction in 3 OF fields at Villotran (red) La NeuvilleOudeuil (orange) and Rubempreacute (blue triangles) (Strullu et al 2020)
Figure 2 Observed and simulated evolution of SON stocks (0-25 cm) in Fagniegraveres lysimeters Treatments Bare soil with and without catch crop (CC) Vertical bars indicate the variability between three lysimeters (Yin et al 2020)
STICS was applied to two long-term experiments including OF DOK trial (Switzerland) 1977-2016 and
Foulum experiment (Denmark) 1997-2017 After calibration of two soil parameters using each CONV
treatment the model gave correct predictions of yields exportations and N surplus in OF treatments
(Autret et al 2019) SMN was underestimated by 41 but few data were available for testing The
observed decrease of SON was very well reproduced by the model This decrease was consistent with
the fact that the N surplus was negative or close to zero depending on the treatment (Figure 3)
In the three long-term trials (Fagniegraveres DOC Foulum) underestimation of either nitrate leaching
which is known to be linked with SMN or SMN itself was almost equal to simulated nitrogen stock in
deep dead roots The model does not simulate yet deep roots decaying below active biological layer
(usually below 30 cm) This lack is being a science front
This version has already been used in projects of 4permil SOC storage (INRA-DEP) and alfalfa production
(Variluz - CASDAR) It was also used in studies of leaching in the Seine basin OF systems co-design and
C storage with grasslands in respectively Gallois et al Beaudoin et al Cadeacutero et al (this conference)
Figure 3 Simulated N surplus and its components (SON variations and NO3 leaching losses or NH3 N2 or N2O emissions) on 4 treatments of each long-term trial of DOK (Thervil Switzerland left) and Organic (Foulum Denmark right) Autret et al (in press)
References
Autret B Mary B Strullu L Chlebowski F Maumlder P Olesen JO Beaudoin N (in press) Long-term trends in crop yield nitrogen losses and GHG balance of organic cropping systems STOTEN
Strullu L Beaudoin N Thieacutebeau P Julier B Mary B Ruget F Ripoche D L Rakotovololona L Louarn G (2020) Simulation using the STICS model of CampN dynamics in alfalfa from sowing to crop destruction EJA 112 125948
Yin X Beaudoin N Ferchaud F Mary B Strullu L Chleacutebowski F Clivot H Herre C Duval J Louarn G (2020) Long term modelling of soil N mineralization and N fate using STICS in a 34ndashyear crop rotation experiment Geoderma 357
50
STICS ability to simulate long-term soil organic matter dynamics in crop-grassland
rotations Cadero A1 F Ferchaud2 N Beaudoin2 F Chlebowski2 B Mary2 F Vertegraves3 Graux A-I1
1 PEGASE Agrocampus Ouest INRA 35590 Saint-Gilles France 2 AgroImpact INRA Site de Laon
02000 Barenton-Bugny France 3 SAS Agrocampus Ouest INRA 35000 Rennes France
Corresponding author anne-isabellegrauxinrafr
Keywords soil organic carbon grasslands long-term datasets France
Introduction
Grasslands ability to mitigate climate change by storing carbon in soils is well recognised but difficult
to quantify as it depends on many environmental and agronomical factors Modelling crop-grassland
rotations can help quantifying the evolution of soil organic carbon (SOC) for a diversity of soils
climates crops and managements but it requires that models are sufficiently robust and accurate in
their prediction of SOC This study aimed to assess the STICS model ability to simulate long-term SOC
dynamics in crop-grassland rotations It is part of the French CarSolEl project
Material and methods
STICS was tested against data from a 27-year experiment located at Kerbernez in western Brittany
(France) and including nine crop-grassland rotations Rotations A and B were silage maize monocrops
Rotations C D and E were silage maize-Italian ryegrass rotations with Italian ryegrass being established
respectively for 6 18 and 12 months between two-silage maize Rotations I and J were respectively
permanent and temporary perennial ryegrass grasslands established between two silage maize
Rotations Dd and Ed were only differing from respectively D and E by their rotation head Crops were
established on a 1m-depth loamy sand and slightly acidic soil differing somewhat between rotations
by the initial SOC stock (80-85 t C ha-1 in 0-25 cm) Rotation A received only mineral N fertiliser All
other rotations also received bovine then pig liquid manure Both Italian and perennial ryegrass were
only cut The experimental area was cut in half in 1992 We used a research version of the STICS model
(release 2485) able to simulate rotations including grasses and other perennial crops (Autret et al
2019 Strullu et al 2020) The model was run continuously from 1978 to 2004 Available observed data
were crop DM yields crop N contents SON and SOC stocks at different dates STICS was evaluated
using common indicators for validation of biophysical models A score was attributed to each
simulation unit using a method derived from Kersebaum et al (2015) and based on the information
source the number of repetitions and the observed factors that the model does not account for (eg
weeds) This first evaluation included a revised parametrisation of perennial ryegrass
Results and discussion
STICS well predicted the evolution of SOC stocks in rotation A (Figure 1 Table 1) However it
overpredicted final SOC for rotation B and silage maize-Italian ryegrass rotations This could be partly
due to an overestimation of the humified carbon from pig slurry inputs STICS prediction of SOC under
temporary (rotation J) and permanent (rotation I) grasslands was acceptable with final SOC conversely
slightly underpredicted Silage maize yields were globally overpredicted It is partly explained by the
fact that the model did not account for the observed detrimental effect of Solanum nigrum presence
on silage maize yields (results not shown) Model prediction agreement with observations of Italian
and perennial ryegrass yields was either good (rotations D and Dd) fair or poor (other rotations)
51
(results not shown) STICS prediction of the N content in silage maize and harvested grass was
respectively good and from fair to poor (results not shown)
Figure 1 Comparison of simulated (blue lines) and observed (points) SOC dynamics over 27 years at Kerbernez
site for nine crop-grassland rotations
Table 1 Evaluation statistics (root mean square error (RMSE) relative RMSE (RRMSE) part of systematic error
(pRMSEs) Nash-Sutcliffe model efficiency (EF) and Willmott index (d)) of STICS performance of predicted SOC
Rotation RMSE (kg C ha-1) RRMSE () pRMSEs EF d
A 2147 32 075 092 098 B 6598 85 094 -069 079 C 7423 92 089 -282 065 D 2076 27 030 036 087
Dd 3255 41 085 -064 081 E 5401 67 050 -316 063
Ed 4286 55 069 -304 068 I 5074 65 079 -456 025 J 4783 61 065 -280 018
Conclusions and perspectives
Further investigations are required to confirm these first results STICS ability to simulate SOC dynamics
in crop-grassland rotations will be assessed against data from two other long-term experimental sites
of the INRA SOERE ACBB If required a calibration of the sensitive grassland root and shoot parameters
will be done to improve the model prediction of SOC together with other soil and plant variables
Scoring each simulation unit will help selecting data to be used for model calibration and evaluation
The performances of STICS will also be compared with those of four other models
References
Autret B Mary B Strullu L Chlebowski F Maumlder P Mayer J Olesen J E Beaudoin N 2019 - Long-term modelling of crop
yield nitrogen losses and GHG balance in organic cropping systems Science of the Total Environment 134597
Kersebaum KC Boote KJ Jorgenson JS Nendel C Bindi M Fruumlhauf C Gaiser T Hoogenboom G Kollas C Olesen JE
Roumltter RP Ruget F Thorburn PJ Trnka M Wegehenkel M 2015 - Analysis and classification of data sets for
calibration and validation of agro-ecosystem models Environmental Modelling amp Software 72 402-417
Strullu L Beaudoin N Thieacutebeau P Julier B Mary B Ruget F Ripoche D Rakotovololona L Louarn G 2020 - Simulation
using the STICS model of CampN dynamics in alfalfa from sowing to crop destruction European Journal of Agronomy
112 125-948
52
Simulation of switchgrass biomass production in Eastern Canada with the STICS
model Guillaume Jeacutego1Reneacute Morissette1 Fabien Ferchaud2
1 Agriculture and Agri-Food Canada Quebec ON Canada 2 INRA UR 1158 AgroImpact Site de Laon 02000 Barenton-Bugny France
Switchgrass (Panicum virgatum L) is a herbaceous perennial grass that is native to the semiarid prairies
of central North America In Canada switchgrass is at the northern limit of its range Cold winter
temperatures in combination with a short growing season are not favourable for the northward
expansion of this crop (Delaquis 2013) In these conditions the establishment of this crop remains a
challenge because it competes very poorly against weeds and takes at least 2 years to reach its full
potential Once well established switchgrass can produce a large amount of biomass (10 t DM haminus1)
and remain productive for more than 10 years (Martel and Perron 2008) under Eastern Canadian agro-
climatic conditions However according to Delaquis (2013) it is planted on only 1500 ha of cropland
in Eastern Canada mostly in Ontario and Quebec In order to expand this area without competing with
other crops its plantation on marginal lands with low soil quality is being considered
The objective of this study is to evaluate the yield potential of switchgrass in southern Quebec using
the STICS crop model First the model performance in predicting above-ground biomass was evaluated
using field data and then the model was used to evaluate the yield potential of switchgrass on low
quality soils (low thickness low organic matter content andor high stone content)
Material and Methods
Three data sets were collected near Sherbrooke in Southern Quebec Canada (45deg 24prime N 71deg 54prime W)
The same cultivar (Cave-In-Rock) was used for the three experiments (table 1)
Table 1 Experimental setup used to evaluate the model performance
Experiment Year of plantation
Years of measurements
Soil type Soil organic matter
content ()
Number of measurements
Above-ground biomass
Leaf area index
1 2009 2015 2016 2017 2018
Loam 38 18 18
2 2009 2018 Silty Loam 48 4 4
3 2017 2018 Silty Loam 48 4 4
In all experiments 60 kg ha-1 of mineral nitrogen (N) were applied in spring before the beginning of
plant growth Weather data (temperature precipitation solar radiation wind speed and air moisture)
were collected by a weather station close to the experimental sites (lt 5km) Soil properties were
estimated using the Canadian soil database STICS was run continuously from the year of plantation to
2018 The crop growth parameters defined by Drochon et al (2017) were used to run a research
version of STICS (including new formalisms to simulate perennial crops) Only one parameter (durvief
= 150) was calibrated by minimizing the difference between predicted and measured Leaf Area Index
(LAI) of experiment 1 in 2015 The normalized root mean square error (NRMSE) normalized mean error
(NME) and model efficiency (EF) were used to evaluate the model performance
53
After the model performance evaluation four sets of simulations were run with altered soil properties
The soil properties of experiments 1 and 2 were altered as follow a) reduced soil depth (05 m instead
of 1 m) b) reduced soil organic matter (OM) content (19 and 24 instead of 38 and 48 for soils 1
and 2 respectively) c) high stone content (15 instead of 0) and d) combination of these three
factors Simulations for these altered soils were run using the same crop management and climate
data (2009-2018) as those used to evaluate model performance Variations in annual yield predictions
were calculated by comparing the yields of these simulations with altered soil properties to the yield
of the reference simulation with actual soil properties measured in experiments 1 and 2
Results
Overall the STICS model performance in simulating the above-ground biomass (AGB) and LAI of
switchgrass in Southern Quebec was good with NRMSE of 25 and 21 and EF of 065 and 087 for ABG
and LAI respectively Bias was also small with NME of +11 and -8 for AGB and LAI respectively Model
predictions tend to slightly overestimate biomass during spring and summer but the harvested
biomass in fall (116 t DM ha-1 on average) was generally very well predicted with a NRMSE of 13 and
a NME of 5 These good performances allow us to run the simulations with altered soil properties
The largest simulated yield decrease ( -12 on average) occurred when the soil depth was reduced by
half The decrease of soil OM content and increase of stone content had less impact on average yield
with reductions of 8 and 4 respectively As expected the combination of these three factors (reduced
soil depth and OM content and increased stone content) had more impact on average yield with a
decrease of 26 This yield decrease with altered soil properties was also generally associated with
greater inter-annual yield variability Despite these yield reductions the average annual yield of
switchgrass remained close to the average yield reported in this region (10 t DM ha-1) with average
annual yield ranging from 91 to 112 t DM ha-1 when one soil property is altered and close to 86 t DM
ha-1 when the three factors are combined
These simulation results suggest that switchgrass production on marginal lands with poor soil quality
in Southern Quebec is possible without decreasing too largely the yield potential Experimental data
of switchgrass cropped on marginal lands are currently being collected and will be used to verify the
model performance in predicting potential yield under these conditions
References
Delaquis E (2013) Genetic and environmental factors affecting switchgrass performance and quality
in Quebec MSc thesis Department of Plant Science McGill University MacDonald Campus
Sainte-Anne-de-Bellevue QC Canada 104 pp
Drochon S Strullu L Zapater M Mary B Ferchaud F (2017) Parameacutetrage de la version de recherche
plantes peacuterennes du modegravele STICS pour une culture eacutenergeacutetique peacuterenne le switchgrass
(Panicum virgatum) In XIegrave seacuteminaire des utilisateurs de STICS p 80-81 La Rochelle France
Martel H and Perron M-H 2008 Compilation des essais de panic eacuterigeacute reacutealiseacutes au Queacutebec
Publication EVC 026 Centre de reacutefeacuterence en agriculture et agroalimentaire du Queacutebec Quebec
City QC Canada 195 pp
54
Modelling the impact of soil and climatic variability on sugarcane growth response
to mineral and organic fertilisers
55
Impact of corn root growth parameters on soil moisture evapotranspiration and
crop growth in STICS model Sameh Saadi1 Elizabeth Pattey1 Guillaume Jeacutego 2 and Catherine Champagne1
1 Ottawa Research and Development Centre Agriculture and Agri-Food Canada 960 Carling Avenue Ottawa ON K1A 0C6 Canada 2 Quebec Research and Development Centre Agriculture and Agri-Food Canada 2560 Hochelaga Boulevard Quebec City QC G1V 2J3 Canada
Keywords Zea mays L eastern Canada LAI biomass rainfall shortage
Introduction
Most of the grain corn production (Zea mays L) in Canada is located in the Mixedwood Plains ecozone extending between Windsor (ON) and Quebec city (QC) The STICS crop model (Brisson et al 1998) was adapted for corn grown in eastern Canada (Jeacutego et al 2011) and its performance using earth observation (EO) derived leaf area index (LAI) assimilated to reinitialize management practices and soil moisture at field capacity was evaluated over a small region (Jeacutego et al 2015) STICS was also used to refine nitrogen application rate recommendations over the ecozone (Mesbah et al2017) Previous studies (eg Jeacutego et al 2017) showed that accurate simulation of water balance in particular soil moisture and evapotranspiration was critical for accurate simulation of environmental outputs in eastern Canada Our project aims at improving soil moisture initialization for the regional use of STICS using EO derived descriptors The first step consists in revisiting the adjustment of root and soil parameters to improve soil moisture profile and evapotranspiration predictions during water stress periods and explore how to handle the extreme precipitation anomalies during the growing season as was observed in 2017
Methodology
Soil moisture profiles were measured using time domain reflectometry evapotranspiration (ET) measured using an eddy covariance flux tower and destructive sampling of LAI and shoot biomass of a corn crop planted in a 27-ha experimental field near Ottawa Canada(45o 18rsquo N 75o 45rsquo W) were acquired over two years with contrasting weather conditions in 2017 and 2018 The growing season of 2017 was exceptionally wet with 1223 mm cumulative precipitation and 2802 Crop Heat Units (CHU) from April to November Whereas an intense drought period occurred in 2018 during a critical corn development stage with only 783 mm cumulative precipitation and 2133 CHU from April to November Actual management practices of the experimental field were implemented in the simulations of both years Corn was planted on 30 May 2017 and on 14 May 2018 at a plant density of 8 plants m-2 Soil moisture at field capacity and wilting point were derived from pedotransfer functions (Saxton et al 1986) using soil texture Soil organic N content was set at 015 and the cumulative soil evaporation above which evaporation rate is decreased q0 was set at 3 mm We used the corn cultivar adapted for the northern part of the ecozone (Jeacutego et al 2011) Since a large proportion of fields in eastern Canada including this experimental field are tile drained and because previous studies showed that soil moisture rarely exceeds field capacity the macroporosity was not activated in these simulations Fig1 summarizes the impact of parameter adjustments in the STICS model for 2018
Results and discussion
Predicted and measured ET in the 2018 growing season (Fig1a) were in good agreement except over the drought period This issue was observed in past growing seasons when water shortages occurred (data not shown) Evaporation was well predicted after the crop harvest however in the spring predictions were overestimated Soil moisture was relatively well predicted for the different soil layers in 2018 (Figure 1c) However from late July until harvest the dry-down estimates of the upper top soil layers were too close to field capacity following rainfalls The default parameter values tended to overestimate the LAI and biomass predictions in 2018 (Fig1e and 1f) To ameliorate this some root
56
growth parameters were adjusted i) decrease the maximum rate of root length production per plant to better simulate the impact of water stress on the crop development in 2018 and ii) increase root density in upper soil layers compared to subsoil root density to better simulate soil drying periods The overall results of predicted ET in 2018 were improved and RMSE decreased from 104 to 083 while the overestimation of spring evaporation remained (Fig1b) The new set of parameter values allowed the model to better predict the soil moisture dry-down following a rainfall The moisture in
Fig 1 Impact of STICS parameters adjustment on aampb) evapotranspiration campd) soil moisture e) LAI and f) shoot biomass in 2018 growing season
the upper soil layers remained close to field capacity (Fig1d) Predicted LAI were improved in 2018 (Fig1e) with RMSE decreasing from 084 to 050 As the predicted biomass is closely related to the LAI the shoot dry biomass prediction over time (Fig1f) showed a better fit although the maximum biomass predicted was still overestimated Using the new set of parameter values in 2017 increased the discrepancies between measured and predicted soil moisture (results not shown) compared to the default values The observed soil moisture was close to saturation due to the frequent rainfalls This trend could not be predicted by the model since soil macroporosity was deactivated Therefore activating the macroporosity should be considered during exceptionally wet seasons to account for soil moisture above field capacity
References
Brisson N Mary B Ripoche D Jeuffroy MH Ruget F Gate P Devienne-Barret F Antonioletti R Durr C Nicoullaud B Richard G Beaudoin N Recous S Tayot X Plenet D Cellier P Machet JM Meynard JM et Deleacutecolle R 1998 - STICS a generic model for the simulation of crops and their water and nitrogen balance I Theory and parametrization applied to wheat and corn Agronomie 18 311-346
Jeacutego G Pattey E Chantigny M Leacuteonard J 2017 Simulation of N2O emissions in cold humid continental climate Seacuteminaire
STICS 2017 17-19 October 2017 La Rochelle France
Jeacutego G Pattey E Bourgeois G Tremblay N and Drury CF 2011 - Evaluation of the STICS crop growth model with corn cultivar parameters calibrated for Eastern Canada Agronomy for Sustainable Development 31(3) pp 557-570
Jeacutego G Pattey E Mesbah M Liu J Duchesne I 2015 Impact of the spatial resolution of climatic data and soil physical
properties on regional corn yield predictions using the STICS crop model Int J Appl Earth Obs Geoinf 41 11-22
Mesbah M Pattey E Jeacutego G 2017 - A model-based methodology to derive optimum nitrogen rates for rainfed crops ndash a case study for corn using STICS in Canada Computers and Electronics in Agriculture 142 572-584
Saxton K E Rawls W Romberger J S amp Papendick R I 1986 - Estimating generalized soil-water characteristics from texture 1 Soil Science Society of America Journal 50(4) 1031-1036
57
Impacts of observed and projected climatic constraints on rainfed wheat yield
under a typical Mediterranean condition Yang Chenyao1 Fraga Helder1 Ieperen Wim van2 Trindade Henrique1 Santos Joatildeo A1
1Universidade de Traacutes-os-Montes e Alto Douro (UTAD) Centre for the Research and Technology of Agro-environmental and Biological
Sciences (CITAB) 5000-801 Vila Real Portugal
2Wageningen University amp Research (WUR) Horticulture and Product Physiology (HPP) 6700 AA Wageningen Netherlands
E-mail cyangutadpt
Introduction
Under Mediterranean climates rainfed wheat grain yield is often constrained by late season
occurrence of enhanced water deficits and high temperature events that is primarily overlapped with
the anthesis and grain filling periods (Asseng et al 2011 Moriondo et al 2011) This vulnerable aspect
is expected to be exacerbated with projected warming and drying trend for Mediterranean basin
(Mariotti et al 2015) Our aims are to evaluate the yield impacts of these climatic constraints in the
past in a typical Mediterranean region and their likely variations under projected climates as well as
how adaptations could help mitigate these impacts
Materials and Methods
The study was performed for the Alentejo region in southern Portugal over baseline (1986ndash2015)
future short- (2021ndash2050) and long-term (2051ndash2080) periods STICS model was chosen to simulate
wheat crop growth and yield formation which was successfully calibrated using 5-year field data at
one representative site (Beja) The model was further operated at regional scale by coupling with high-
resolution climate and soil datasets and running with common practices at a harmonized resolution
(~125 km) Calibrated STICS proved to be able to well reproduce baseline regional yield statistics and
measured potential yields at experiment stations In future periods simulations were only conducted
at Beja where climate projections under RCP45 and RCP85 were retrieved from 10-member bias-
adjusted regional climate model ensemble from EURO-CORDEX (Jacob et al 2014) Tested adaptation
options are sowing date adjustment using early-flowering cultivars and supplemental irrigation during
sensitive period
Results and Discussion
As an illustrative example the mean climatic water deficit and high-temperature events during three
wheat growing periods over baseline are shown at Beja which are clearly more pronounced in the last
phase (April-June) (Fig 1a) In baseline terminal water stress appears to be the main limiting factor
for the potentially attainable yield causing 40ndash70 yield gaps between actual and potential yield
across the region In future periods projected enhancement of water deficits and more frequent hot
days in AprilndashJune (Fig 1b) are likely to considerably reduce actual yields (Fig 1c) Early flowering
cultivars help advance the anthesis onset and grain filling which reduce the risks of exposure to the
terminal drought amp heat stresses whereas early sowing benefits can be inhibited with slowed
vernalization fulfilment (Yang et al 2019)
58
Figure 1 An illustrative example of observed and projected climatic constraints during wheat growing season at one representative site (Beja) of Alentejo region in southern Portugal (a) Mean and standard deviation (error bar) of cumulative climatic water deficit (precipitation minus potential evapotranspiration mm) and of hot days (daily maximum temperature above 30degC) during three wheat growing periods over baseline along with their (b) projected range of mean changes during short- (2021ndash2050) and long-term (2051ndash2080) future periods under RCP45 and 85 among 10 bias-adjusted regional climate model projections (c) Projected likely range of variations () during 2021ndash2050 and 2051ndash2080 relative to the simulated median baseline (1986ndash2015) yield
Conclusions
The detrimental effects of climatic water deficits and hot days occurring during wheat grain filling can
represent the major cause of gaps between actual and potential yield in Alentejo region which are
likely to be widened under future climate Combination of using early-flowering cultivars with no or
less vernalization requirement and supplemental irrigation can help reduce the yield gaps being a
promising adaptation strategy for rainfed wheat cropping system under Mediterranean climate
Acknowledgments
This study was supported by the Clim4Vitis project-ldquoClimate change impact mitigation for European viticulture knowledge transfer for an
integrated approachrdquo funded by European Unionrsquos Horizon 2020 Research and Innovation Programme under grant agreement nordm 810176
This work was also supported by National Funds by FCT-Portuguese Foundation for Science and Technology under the project
UIDAGR040332019
References
Stocker T Qin D Plattner G-K Alexander L Allen S Bindoff N et al Technical summary Climate Change 2013 The Physical Science Basis Contribution of Working Group I to the Fifth Assessment Report of the Intergovernmental Panel on Climate Change Cambridge Cambridge University Press 2013 p 33ndash115
Asseng S Foster I and Turner NC 2011 The impact of temperature variability on wheat yields Global Change Biol 17(2) 997-1012
Jacob D et al 2014 EURO-CORDEX new high-resolution climate change projections for European impact research Regional Environmental Change 14(2) 563-578
Mariotti A Pan Y Zeng N and Alessandri A 2015 Long-term climate change in the Mediterranean region in the midst of decadal variability Clim Dynam 44(5) 1437-1456
Moriondo M Giannakopoulos C and Bindi M 2011 Climate change impact assessment the role of climate extremes in crop yield simulation Climatic Change 104(3) 679-701
Yang C Fraga H van Ieperen W Trindade H and Santos JA 2019 Effects of climate change and adaptation options on winter wheat yield under rainfed Mediterranean conditions in southern Portugal Climatic Change 154(1) 159-178
59
Session 6 Regional and large scale simulations using STICS
Estimate demand for irrigation water and nitrogen fertilizers in Europe at different
scales Ines Chiadmi1 Pierre Humblot1 Pierre-Alain Jayet1
1 UMR INRA-Agro Paris Tech Economie Publique Grignon France
Keywords yield function irrigation water nitrogen fertilizers climate change agro-economic model
European Union
Introduction
The demand for prospective analysis of agricultural activities and their impacts in terms of
environmental externalities brings to light the need for quantitative models enabling them to be
evaluated in contexts that have not yet been observed Estimating what the environmental impacts of
demand for inputs could be in a context of global change affecting this same demand is the example
of the analysis of feedbacks that we are called upon to process An illustration of the problem is given
by the effects of climate change on agriculture and the greenhouse gas emissions to which it
contributes and which play a large part in climate change In addition to climate change there is also
the economic regulation of nitrogen pollution which could affect agricultural activity just as
significantly Finally the modification of the precipitation regime and the economic pressure on the
water available for irrigation are likely to affect even more an agricultural system at the heart of
complex relationships with its environment We propose to show our contribution in the modeling of
these processes from an economic perspective
The key data problem and the choice of models
More often than with regard to physical data the elements available in economic databases are
insufficiently present for the study of environmental impacts in relation to agricultural activities This
is particularly the case for consumed inputs which escape the market for example with regard to part
of the irrigation water This is also the case for nitrogen fertilizers for which we observe the
consumption in value of synthetic fertilizers but whose distribution by crop or chemical composition
is poorly known The observation is both biased by the lack of information on quantities and even more
so on prices Another major obstacle is the difficulty of accessing data when it exists as is the case with
the Farm Accounting Information Network (FADN) The use of bioeconomic models helps to overcome
this problem
The coupling of an economic model of agricultural supply with a crop model (in this case AROPAj and
STICS respectively) makes it possible to deal with the problem of the choice of activities at the
decisional level which is that of the agricultural holding while the crop model allows the economic
model to deal more realistically and in the absence of economic data the problem of decision at the
plot scale The heart of the association of models is based on the selection of crop yield functions The
method initiated for the nitrogen input by Godard et al 2008 and completed by Leclerc et al 2013
has been extended to irrigation water by Humblot et al 2017 It has been refined in the context of a
study carried out on behalf of the JRC-Seville in 2019 Finally combined with a spatial econometric
model the AROPAj-STICS coupling makes it possible to assess the spatial distribution of agricultural
production consumption of inputs and pollution associated (Jayet et al 2018)
Spatial distribution of input demand
60
The STICS model is used to produce yield functions for 9 crops (durum wheat soft wheat
barley corn rapeseed sunflower soybean potato sugar beet) and for all farms representative
of the 130 regions of the European Union and represented in AROPAj The economic data are
the yields and prices estimated from the European FADN (2008-2012)
A first simulation carried out for 2012 with AROPAj is used to illustrate the demand for
filtered irrigation water by estimating a variable irrigation load from the FADN (fig 1) A
second simulation is carried out without filtering the water demand so that one can estimate
what would be a demand for irrigation water if the irrigation system existed (fig 2) The color
scheme used in the two figures corresponds to different value ranges (m3 ha) It should be
emphasized that these estimates relate to hectares of UAA AROPAj given that the model
represents part of the total agricultural UAA
Fig 1 Demand for irrigation on FADN-2012 basis Fig 2 Demand for potential irrigation (2012)
References
Godard C Roger-Estrade J Jayet P A Brisson N amp Le Bas C (2008) Use of available information
at a European level to construct crop nitrogen response curves for the regions of the EU
Agricultural Systems 97(1ndash2) 68ndash82 httpsdoiorg101016jagsy200712002
Humblot P Jayet P-A amp Petsakos A (2017) Farm-level bio-economic modeling of water and
nitrogen use Calibrating yield response functions with limited data Agricultural Systems 151
47ndash60 httpsdoiorg101016jagsy201611006
Jayet PA Barberis D Humblot P Lungarska A (2018) Spatialisation de la demande en eau agricole
en France par lrsquointeacutegration de lrsquoeau drsquoirrigation dans un modegravele bioeacuteconomique Revue
Internationale de Geacuteomatique 28(4)485-503 doi 103166rig201800064
Leclegravere D Jayet P-A amp de Noblet-Ducoudreacute N (2013) Farm-level Autonomous Adaptation of
European Agricultural Supply to Climate Change Ecological Economics 87 1ndash14
httpsdoiorg101016jecolecon201211010
61
Regional-scale coupled modelling of water pollution by nitrate from agricultural
sources the Seine-Normandy hydrosystem case study
Nicolas Gallois1 Pascal Viennot1 Thomas Puech2 Nicolas Beaudoin3 Paul Passy4 Florent Chlebowski3 Christine Le Bas5 Bruno Mary3 Gilles Billen6 Josette Garnier6 Marie Silvestre4 Vincent Thieu6
1 MINES ParisTech PSL Universiteacute Centre de Geacuteosciences ARMINES 35 rue Saint-Honoreacute F-77305 Fontainebleau France 2 INRA SAD Uniteacute Aster 662 avenue Louis Buffet F-88500 Mirecourt France 3 INRA UR 1158 Agro-Impact site de Laon Pocircle du Griffon F-02000 Barenton-Bugny France 4 FIRE CNRS UMR 7619 METIS 4 place Jussieu F-75005 Paris France 5 INRA-US Infosol 2163 avenue de la Pomme de Pin F-45075 Orleacuteans France 6 Sorbonne Universiteacute UMR 7619 METIS 4 place Jussieu F-75005 Paris France
Agricultural lands represent nearly 70 of the surface area of the Seine-Normandy basin The
multiplicity and diffuse nature of the hydro-physico-chemical processes involved in the transfer of
agricultural-source nitrogen (N) make the characterization of their impacts on the quality of the basin
water resources a challenging and complex issue In this context an original interdisciplinary modelling
platform has been developed (Gallois and Viennot 2018)
Material and method
The platform deals with the main processes affecting water quality along the aquatic continuum by
linking the STICS MODCOU and RIVERSTRAHLER models (Ledoux et al 1984 Billen et al 1994 Brisson
et al 2009)
Figure 1 Diagram of the integrated modelling platform of the Seine-Normandy basin Water flows in blue N flows in red
Over the simulated domain (100000 km2 approximately) model interactions (cf Figure 1) are set in
order to
Generate water and N flows below the sub-root zone using the STICS v10 code STICS inputs
resulted from the spatio-temporal evolutions of agricultural practices describing over 4500 cropping
systems since 1970 (ARSEINE v343 database INRA Aster) (Puech et al 2018) as well as climate data
62
(SAFRAN Meacuteteacuteo-France) and soils characteristics (BDGSF INRA InfoSol) A dedicated software allowed
their integration and the STICS distribution over the territory (Gallois and Viennot 2018)
Synchronously model nitrate and water flows transiting through sub-surface unsaturated and
saturated compartments of the regional hydrosystem using the MODCOU hydrogeological model
Model N transfer and transformations across the 36 000 km-long river system via the
RIVERSTRAHLER model computing geographical distributions of N-concentrations in the network
Results and implementation
The platforms ability to reproduce the agro-hydrosystem behavior was assessed at three levels
Indirect validation of STICS water drainage and N-leaching flows The development of a
Quality Assurance Protocol (QAP) (Beaudoin et al 2018) combining sensitivity analysis and agronomic
expertise of STICS inputs and outputs allowed to evaluate the reliability and consistency of STICS
simulations at the macro-regional scale
Direct validation on nitrate concentration rates in aquifer system The aquiferous nitrate
content was predicted with a maximum absolute bias less than 10 mgNO3 L-1 at 580 control points (cf
Figure 2)
Direct validation of nitrogen supply dynamics in the river system Simulated river
concentrations were compared with available observations at the gauging station scale (cf Figures 2a
2b 2c)
Figure 2 Average biases (1995-2016) between simulated aquiferous nitrate concentrations and measured data at the scale
of instrumented boreholes Three examples of synchronous time evolutions between observed and simulated concentrations
in rivers (2010-2016 mgN-NO3 L-1) at stations located at the (a) Seine (b) Oise and (c) Orne river outlets are also displayed
Relying on these performances the platform allowed a complete assessment of N-related transfer and
transformation processes along the soil-hydrosystem continuum over 50 years (Passy et al 2018) It
also permitted to study the sensitivity of groundwater to two contrasting foresight agriculture
scenarios over 2017-2050 period (conventional and agro-ecological - Puech et al 2018)
Bibliographical references
63
Beaudoin N et al (2018) laquo Evaluation of a spatialized agronomic model in predicting yield and N leaching at the scale of the Seine-Normandie basin raquo Environmental Science and Pollution Research
25 p 23529‑23558 doi 101007s11356-016-7478-3
Billen G Garnier J et Hanset P (1994) laquo Modelling phytoplankton development in whole drainage
networks The Riverstrahler model applied to the Seine river system raquo Hydrobiologia 289 p 119‑
137
Brisson N et al (2009) Conceptual basis formalisations and parametrization of the STICS crop model Eacutediteacute par Quae Update Sciences and Technologies
Gallois N et Viennot P (2018) Modeacutelisation de la pollution diffuse drsquoorigine agricole des grands aquifegraveres du bassin Seine-Normandie Actualisation des modeacutelisations coupleacutees STICS-MODCOU ndash Modeacutelisation de sceacutenarios agricoles sous changement climatique ARMINES technical report 268p
Ledoux E Girard G et Villeneuve J P (1984) laquo Proposition drsquoun modegravele coupleacute pour la simulation conjointe des eacutecoulements de surface et des eacutecoulements souterrains sur un bassin hydrologique raquo
La Houille Blanche p 101‑110
Puech T Schott C et Mignolet C (2018) Evolution des bases de donneacutees pour caracteacuteriser les dynamiques des systegravemes de culture sur le bassin Seine-Normandie INRA technical report 219p
64
Simulating innovative cropping systems aiming at producing biomass while
reducing greenhouse gas emissions in the Hauts-de-France region Ferchaud Fabien1 Drochon Simon1 Chlebowski Florent1 Gourdet Claire2 Boissy Joachim2 Leclegravere
Margot3 Loyce Chantal3 and Strullu Loiumlc4
1 INRAE UR 1158 AgroImpact Site de Laon 02000 Barenton-Bugny France 2 Agro-Transfert Ressources et Territoires 2 chausseacutee Brunehaut 80200 Estreacutees-Mons France 3 UMR Agronomie INRAE AgroParisTech Universiteacute Paris-Saclay 78850 Thiverval-Grignon France 4 ASAE 2 Esplanade Roland Garros ndash BP 235 51686 Reims Cedex France
Keywords cropping systems biomass production evaluation GHG balance
Introduction
Biorefineries which use renewable biological resources for the production of bio-based products and
biofuels are a cornerstone of the bioeconomy However creating a biorefinery in a territory requires
increasing local biomass production without affecting too much food production and with limited
environmental impacts It raises the need for developing innovating cropping systems able to fulfill
these criteria We aimed at evaluating ex ante these cropping systems using the STICS model
Material and methods
The geographical context of this work was the Hauts-de-France region and more precisely the area (50
km radius) around Venette (Oise) We focused on two soil types a deep loamy (DL) soil representing
the most widely spread soil type in the study area and a sandy loam (SL) representing soil types with
lower potential agricultural production Soil characteristics were obtained using local references
First reference cropping systems representative of the region were defined using agricultural surveys
and local expert knowledge 6 for DL and 5 for SL These cropping systems were two to five year annual
crop rotations including grain cereals (wheat barley maize) sugar beet rapeseed spring pea potato
and mustard as a catch crop (CC) In a second step innovative cropping systems were designed during
dedicated workshops involving researchers and local experts The following target was assigned to
these cropping systems reducing greenhouse gases (GHG) emissions by 50 increasing total biomass
production by 5 and decreasing food production by no more than 20 One cropping system was
designed for the deep loamy soil combining two cropping systems within a same plot (1) a ten-year
In addition to energy production the development of anaerobic digestion in a territory can have many
indirect effects The characteristics of the exogenous organic matters (EOM) spread on soils are
changed after anaerobic digestion (Moumlller amp Muumlller 2012) More generally the development of
anaerobic digestion may affect the supply of available EOMs and even the cropping systems
mobilisation of crop residues that only return to the soil after digestion modification of crop
successions to introduce cover crops for energy supply (CCESs) in substitution for catch crops etc
Depending on the chosen anaerobic digestion scenarios these indirect effects will lead to changes in
the carbon storage and nitrogen dynamics (Askri 2015 Nicholson et al 2017)
The objectives of the study were to simulate the consequences of anaerobic digestion development
on carbon (C) and nitrogen (N) flows at the plot scale The case study was the Versailles plain a territory
with very little livestock and mainly field crops This territory has been previously characterized soil
types crop successions EOM used climate The considered initial soil organic carbon content was low
(no past application of EOM considered)
The consequences of anaerobic digestion development on C and N flows at the plot scale were
simulated with the STICS crop model (Brisson et al 2009) with a focus on (i) organic C stocks in soils
(ii) N uptake by plants (iii) leached N fluxes (iv) N fluxes volatilized as NH3 or emitted as N2O The STICS
model was coupled with a model for predicting the characteristics of digestates developed as part of
the MethaPolSol project (Bareha 2018) Thus the characteristics of the digestate spread were
produced from a mixture of animal manures and CCESs In addition the decomposition submodule for
exogenous organic matter in STICS has been modified by subdividing the organic residue initially only
describe with one decomposable pool (Nicolardot et al 2001) into two fractions a fast decomposable
fraction and a slow decomposable fraction that is directly incorporated into soil humus (Levavasseur
et al subm)
Four series of simulations were carried out (1) crop successions with mineral fertilization (2) crop
successions with the EOMs actually used (3) crop successions with substitution of fertilizers by
digestates of bio-waste or livestock effluents (4) crop successions with implantation of CCESs where
possible and substitution of fertilizers by digestates mixing livestock effluents and CCESs The scenarios
were simulated over 30 years with the following criteria limitation to 170 kg Nha provided with EOMs
per crop mineral N supplementation to achieve constant yields and decrease in the mineral N dose as
soil nitrogen supply increases with the increase of organic matter stocks in soils All scenarios were
constructed to simulate yields similar to those obtained with mineral fertilizers
The simulation results showed that soil C stocks were stable for successions receiving only mineral
fertilizers (scenario 1) they increased in all scenarios receiving EOMs (current or digested scenarios 2
67
to 4) with intensities depending on the humic potential of EOMs used and the quantities supplied The
introduction of CCESs in the digestate scenario (4) increased C storage thanks to a higher return of root
and digestate C EOM use increased the substitution of mineral fertilizers over time due to the mineral
N contents of EOMs particularly in the digestates and the increase in organic matter stocks in soils
that generated increasing mineralized N flows The CCESs tended to reduce these savings Because of
this increasing mineralized N flows and the limited N uptake in summer and autumn in the simulated
crop successions (especially with wheat) N losses from leaching and N2O emissions increased over
time in all scenarios receiving EOMs (2 to 4) By acting as catch crops CCESs significantly reduced N
leaching (scenario 4) Ammonia volatilization was one of the main causes of N losses from crop systems
fertilized with digestates (up to 20 of ammonia N input scenarios 3 and 4)
A plot-based greenhouse gas balance including C storage direct and indirect N2O emissions and
emissions from fertilizer manufacturing completed this work
References
Askri A (2015) Methanization digestates valorization in agriculture impacts on carbon and nitrogen biogeochemical cycles Retrieved from httpsinisiaeaorgsearchsearchaspxorig_q=RN49053137
Bareha Y (2018) Modeacutelisation des processus de transformation de lrsquoazote en digestion anaeacuterobie application agrave lrsquooptimisation de la valorisation des digestats Retrieved from httpstelarchives-ouvertesfrtel-02115249
Brisson N Launay M Mary B amp Beaudoin N (2009) Conceptual basis formalisations and parametrization of the STICS crop model (Quae Ed) Versailles
Levavasseur F Mary B Houot S subm b Simulation of the C and N dynamics in a long-term experiment with organic amendments amendment application using the STICS model Submitted in Computers and Electronics in Agriculture
Moumlller K amp Muumlller T (2012 June) Effects of anaerobic digestion on digestate nutrient availability and crop growth A review Engineering in Life Sciences Vol 12 pp 242ndash257 httpsdoiorg101002elsc201100085
Nicholson F Bhogal A Cardenas L Chadwick D Misselbrook T Rollett A hellip Williams J (2017) Nitrogen losses to the environment following food-based digestate and compost applications to agricultural land Environmental Pollution 228 504ndash516 httpsdoiorg101016JENVPOL201705023
Nicolardot B Recous S Mary B 2001 Simulation of C and N mineralisation during crop residue decomposition A simple dynamic model based on the CN ratio of the residues Plant Soil 228 83ndash103
68
Session 7 Scenario simulations using STICS
To maximize multiple ecosystem services without dis-service for water the
management of cover crops has to be climate and soil specific A simulation
approach using STICS model
Nicolas Meyera Jacques-Eric Bergeza Julie Constantina Eric Justes ab a INRA UMR AGIR Universiteacute de Toulouse INRA INPT INP-EI PURPAN Castanet-Tolosan France E-mail nicolasmeyerinrafr b CIRAD PERSYT Department 34980 Montpellier France
Keywords STICS model simulation study cover crop management next cash crop water nitrogen
Introduction Cover crops provide multiple ecosystem services such as reducing nitrate leaching producing ldquogreen manurerdquo effect improving soil physical properties increasing carbon storage in the soil and controlling pests diseases and weeds (Justes et al 2017) Cover crops increase evapotranspiration by increasing cover transpiration and decrease soil evaporation and then they reduce water drainage in temperate climates (Meyer et al 2019) However the equilibrium of these processes and ecosystem services provided depends on cover crop management climate and soil type No consensus exists on the impact of cover crops on soil water availability for the next cash crop Dynamic soil-crop models can be a powerful tool to estimate water fluxes that are difficult to measure in field experiments such as drainage evaporation and transpiration They can also be used over long climatic series for evaluating their variability versus weather and a wide range of management practices (Bergez et al 2010) We hypothesis that the cover crop management must take into account soil and climate context to maximize the multiple ecosystem services and in the same time reduce the negative impact of cover crops on soil water balance and on the next cash crop Our goal was to analyse by simulation the best cover crop managements according to soils and climates in the Adour-Garonne catchment
Materials and Methods We performed a multi-simulations approach with the STICS soil-crop model (Brisson et al 2003) The soil and climate diversity of Adour-Garonne catchment (southwestern France) was represented by an east west transect using five specific locations We tested one bare soil management as control and three different cover crop species with several management sowing (four dates) termination (four dates) residues management (2 types) We then tested two following cash crops for evaluating the following effect on sunflower (rainfed) and maize (irrigated) The STICS model cover crop parameters were calibrated by Constantin et al (2015) for Italian rye grass and white mustard Tribouillois et al (2016) for vetch and Meyer et al (2020) for Ethiopian mustard-crimson clover bispecific mixture
Results and discussion Our simulation results confirm that cover crops already reduce water drainage and increase actual evapotranspiration in comparison to bare soil They also decrease nitrate leaching and for some cases (non leguminous species and late termination date) reduce soil nitrogen availability for the next cash crops However cover crops would never induce a water or nitrogen stress of the succeeding cash crop likely to lead to lower yields in case of early termination (at least one month before sowing) In some cases simulated water and nitrogen stress were simulated in particular with a termination cover crop the day before the cash crop sowing and for year where no drainage would occur due to very low winter and spring rainfalls Moreover our study presents the interactions between various cover crop managements climate and soil contexts cover crops species and dates of sowing or termination The use of legumes as sole cover crop or in mixture with crucifer can even increase yields but their use must be reasoned in relation to the issue of nitrate leaching in areas with high drainage level The figure illustrate for one site (at
69
Toulouse-Auzeville) the results obtained by crossing all factors This indicate the importance of optimising together the type of species used and the dates of sowing and termination for providing a high level of compromise in ecosystemic services
Figure 45 Bilan des diffeacuterents itineacuteraires techniques des CIMS en comparaison avec un sol nu sur le site AUZ Les variables drsquointeacuterecircts sont la biomasse des CIMS agrave la destruction les diffeacuterences drsquoETR de drainage et de lixiviation durant lrsquointerculture et les stocks drsquoeau et drsquoazote au semis de la culture principale suivante S repreacutesente les dates de semis (S1 = 5 aoucirct S2 = 20 aoucirct S3 = 5 septembre S4 = 20 septembre) D repreacutesente les dates de destruction (D1 = 15 novembre D2 = 15 deacutecembre D3 = 15 mars D4 = 15 avril) Les lettres M et L repreacutesentent respectivement des reacutesidus laisseacutes en mulch apregraves destruction et des reacutesidus enfouis par un travail du sol Les eacutetoiles rouges et vertes indiquent les gestions de CIMS pouvant conduire agrave des reacuteductions ou des hausses de rendements de la culture principale suivante
Conclusion The impact of cover crop mixture on the water balance must therefore be investigated in new field experiments or by simulation in order to optimise the date of destruction with regard to the different services targeted by this type of plant cover in order to propose locally optimised management rules
References Bergez J-E Colbach N Crespo O Garcia F Gary C Jeuffroy M-H Justes E Loyce C Munier-Jolain N Sadok W (2010)
Designing crop management systems by simulation European Journal of Agronomy 32 3ndash9 Brisson N Brisson N Gary C Justes E Roche R Mary B Ripoche D Zimmer D Sierra G Bertuzzi P Burger P Bussiegravere
F Cabidoche YM Cellier P Debaeke P Gaudillegravere JP Heacutenault C Maraux F Seguin B Sinoquet H (2003) An overview of the crop model STICS European Journal of Agronomy 18 309-322
Constantin J Le bas C Justes E (2015) Large-scale assessment of optimal emergence and destruction dates for cover crops to reduce nitrate leaching in temperate conditions using the STICS soil-crop model EJA 69 75ndash87
Meyer N Bergez J-E Constantin J Justes E (2019) Cover crops reduce water drainage in temperate climates A meta-analysis Agronomy for Sustainable Development 393
Meyer et al (under revision) Cover crops reduce drainage but not always soil water content due to interactions between rainfall distribution and management Agricultural Water Management
Tribouillois H Cohan J-P Justes E (2016) Cover crop mixtures including legume produce ecosystem services of nitrate capture and green manuring assessment combining experimentation and modelling Plant and Soil 401 347-364
70
Simulating soil organic carbon dynamics in long-term bare fallow and arable
experiments with STICS model Hugues CLIVOT12 Fabien FERCHAUD2 Florent LEVAVASSEUR3 Sabine HOUOT3 Anne-Isabelle
GRAUX4 Alice CADEacuteRO4 Franccediloise VERTEgraveS5 Alain MOLLIER6 Annie DUPARQUE7 Jean-Christophe
MOUNY7 Olivier THEROND1 Bruno MARY2
1 Laboratoire Agronomie et Environnement Universiteacute de Lorraine INRAE Nancy-Colmar France 2 UR AgroImpact INRAE Site de Laon 02000 Barenton-Bugny France 3 UMR ECOSYS INRAE AgroParisTech Universiteacute Paris Saclay Thiverval-Grignon France 4 PEGASE Agrocampus Ouest INRAE 35590 Saint-Gilles France 5 SAS Agrocampus Ouest INRAE 35000 Rennes France
6 UMR ISPA INRAE Bordeaux Sciences Agro Villenave drsquoOrnon France 7 Agro-Transfert Ressources et Territoires Estreacutees-Mons France
The model performances were compared with those of the annual time-step carbon model AMG v2
which had been previously validated for various pedoclimatic conditions and cropping systems (Clivot
et al 2019)
Results and discussion
71
Results show that STICS could predict satisfactorily final C stocks after a long-term monitoring of SOC
in bare fallow and cultivated systems (Fig 1) The diversity of experiments suggests that STICS was able
to simulate well both decomposition and mineralization derived from native soil organic matter and
from fresh organic residues that are incorporated into humified organic matter
Figure 1 Differences between final and initial observed SOC stocks vs simulated with STICS and AMG models for bare fallow (BF) and cultivated soils in long-term experiments RRMSE = relative root mean square error and MD = mean difference for final SOC stocks
The performances of STICS in simulating SOC are comparable to those of AMG model (mean RRMSE of
63 and 43 for final SOC stocks simulated with STICS and AMG respectively) for which C inputs
into soil require measured crop yields to be calculated while STICS provides the advantage of
simulating crop growth and residues returned to the soil
Further studies will be needed to assess the model ability to simulate SOC dynamics in other systems
such as grasslands or cropping systems including perennial species
References
Autret B Mary B Strullu L et al (2019) Long-term modelling of crop yield nitrogen losses and GHG balance in organic cropping
systems Sci Total Environ 134597 httpsdoiorg101016jscitotenv2019134597
Clivot H Mouny J-C Duparque A et al (2019) Modeling soil organic carbon evolution in long-term arable experiments with
AMG model Environ Model Softw 11899ndash113 httpsdoiorg101016jenvsoft201904004
Constantin J Beaudoin N Launay M et al (2012) Long-term nitrogen dynamics in various catch crop scenarios Test and
simulations with STICS model in a temperate climate Agric Ecosyst Environ 14736ndash46
httpsdoiorg101016jagee201106006
Farina R Ehrhardt F Bellocchi G et al (2019) Multi-metric evaluation of an ensemble of biogeochemical models for the
estimation of organic carbon content in long-term bare fallow soils In Food Security and Climate Change Conference 4 per
1000 initiative new tangible global challenges for the soil
Yin X Beaudoin N Ferchaud F et al (2020) Long-term modelling of soil N mineralization and N fate using STICS in a 34-year
Participative approach with STICS for evaluation of nitrogen management scenarios
in organic farming systems Beaudoin N 1 Rakotovololona L 1 Chleacutebowski F1 Favreliegravere E 2 Ronceux A 2
1 INRA AgroImpact 180 rue Pierre-Gilles de Gennes 02000 Barenton-Bugny France 2 Agro-Transfert Ressources et Territoire 80200 Estreacutees-Mons France nicolasbeaudoininrafr
Keywords Legume Multicriteria optimization Participatory research Numerical experiment
Introduction
Organic farming (OF) is considered as a prototype of sustainable agriculture However its
environmental performances linked to carbon (C) and nitrogen (N) cycles seems perfectible
(Mondelaers et al 2009 Sautereau et al 2016) The N factor also plays a key role in production
interacting with weeds (Casagrande et al 2009) Deterministic dynamic modelling if realistic should
help to optimize OF systems Recently applications of the STICS research version (v1680) in OF relied
on the following hypothesis (H1) if weeds pests and diseases are quite well controlled an agro-
environmental model can reproduce satisfactorily aboveground biomass and water-CN budgets The
H1 hypothesis has been validated in on-farm situations on an annual scale (Beaudoin et al 2018) and
on long-term trials (Autret et al 2019) In addition the participative approach well known in OF could
help to take into account biotic factors (Desclaux et al 2012) The second hypothesis was combining
deterministic modelling and agricultural stakeholders would be relevant to optimise OF systems (H2)
The work carried out during Rakotovololonas thesis (2018) was based on a numerical experiment to
test scenarios co-designed by researchers farmers and agricultural advisors from real situations
Material and methods
Rakotovololonas thesis (2018) was based on a monitoring network of organic fields in Hauts-de-France
(France) From a preliminary diagnosis two themes were prioritized by the workshop (1) the fallow
cropping management after harvest of grain legume and (2) the fallow cropping management
afteralfalfa ploughing Different N management practices eventually combined were proposed by
farmers For each risky situation studied three benchmarks represented by a plot-year couple were
chosen The same combinations of modalities were applied to each benchmark The simulations are
replicated on real climate series with a duration of 4 to 6 years over the period 2000 - 2017 A scenario
is a combination of management modalities for a given plot simulated with sequence over real years
(called A) then the two years of interest (called Brdquo) under a given climate series
Results and discussion
The predictions of STICS are first tested on the data acquired in A years in chained simulations of a
duration of 2 to 3 years The predictions of the total aboveground biomass the amount of N in the
aerial part the soil water stock and the soil mineral nitrogen (SMN) stock are sufficient with
efficiencies of 093 055 063 and 064 respectively In addition simulations of SMN dynamics before
during and after alfalfa cropping have been successfully tested by Strullu et al (2020)
Predictions for B years are then discussed with farmers The variables of interest are at the same time
emissions) The SMN stock evolution appears sensitive to the fallow period management scenario
intersecting the length of the period and the type of multiservice catch crop with the addition of
climate hazards (Figure 1) Likewise N mineralization were very sensitive to the alfalfa ploughing
scenarios according to the period of destruction and the fate of the last cut it statistically significantly
varied between 382 and 580 kg N ha-1 for two years (data not shown) The N losses were rather high
73
but less sensitive to the scenarios with NO3 leaching being between 55-69 and N2O emissions being
between 32-45 kg N ha-1 both for two years However the final SMN remained high and variable
from 75 to 175 kg N ha-1 so it would be better to investigate these impacts over a longer period
Figure 1 Average SMN dynamics (kg N ha-1) for fall management scenarios in OF with short (left) and long (right) fallow period in plot p36 for B years Scenario color code bare soil = red mustard catch crop = green vetch-barley mixed catch crop = yellow pure vetch catch crop = blue Colored areas = mean plusmn standard deviation of climatic years
This approach coupled in a dynamic and educational way the use of a model to quantify
biogeochemical flows of interest and expert knowledge of farmers and advisers to design alternative
scenarios It allowed some shifts in N management practices after alfalfa in our network This coupling
could be enriched with other tools such as OdERA-Systegravemes which indicates weeds risk at the scale
of a rotation (httpwwwagro-transfert-rtorgoutilsodera-systemes-2) Integrating STICS into a
user-friendly interface would ultimately enable supporting modelling to design cropping systems
inorganic farming
Acknowledgments
The partnership of farmers and advisers in Agribio project The financial support of AESN and INRA
Literature references
Autret B Mary B Strullu L Chlebowski F Maumlder P Olesen JO Beaudoin N (2019) Long-term trends in crop yield nitrogen losses and GHG balance of organic cropping systems STOTEN
Beaudoin N Rakotovololona L Chleacutebowski F Lengrand A Ronceux A Favreliegravere E Mary B (2018) Yield Gap Analysis of Organic Cereals Based on Field Network Monitoring and the STICS Model XVe congress of ESA Geneva 27-31 August
Casagrande M David C Valantin-Morison M Makowski D Jeuffroy M-H 2009 Factors limiting the grain protein content of organic winter wheat in south-eastern France a mixed-model approach Agronomy for Sustainable Development 29 (4) 565-574
Desclaux D Ceccarelli S Colley M Navazio J Trouche G Aguirre S Weltzien E Lanccedilon J 2012 Chapter 6- Centralized or decentralized breeding the potentials of participatory approaches for low-input and organic agriculture In Organic Crop Breeding - Edith T Lammerts van Bueren and James R Myers- Wiley-Blackwell
Mondelaers K Aertsens J VanHuylenbroeck G (2009) A meta-analysis of the difference in environmental impacts between organic and conventional farming British Food Journal 111 1098-1119
Rakotovololona L (2018) Quantification expeacuterimentale et modeacutelisation de la production des flux deau et dazote en systegravemes de culture biologiques Thegravese de doctorat de linstitut des sciences et industries du vivant et de lenvironnement 171 p +annexes
Sautereau N Benoit M et Saviny I (2016) Quantifier et chiffrer eacuteconomiquement les externaliteacutes de lrsquoagriculture biologique Synthegravese du rapport au MAFF ITAB et INRA 20 pp
Strullu L Beaudoin N Thieacutebeau P Julier B Mary B Ruget F Ripoche D L Rakotovololona L Louarn G (2020) Simulation using the STICS model of CampN dynamics in alfalfa from sowing to crop destruction EJA 112 125948
2
XIIth Stics users seminar
Book of abstracts
Montpellier
6-7 January 2020
Scientific committee
Franccedilois Affholder - CIRADAIDA
Eric Justes - CIRADPERSYST
EPS Stics Team
Gatien Falconnier - CIRADAIDA
Guillaume Jeacutego ndash AFFC
Organization committee
Franccedilois Affholder - CIRADAIDA
Michel Giner - CIRADAIDA
Brigitte Giudicelli - CIRADAIDA
Anne-Laure Fruteau de Laclos - CIRADAIDA
Remi Vezy - CIRADAMAP
Krishna Naudin - CIRADAIDA
3
EDITORIAL
The STICS team is happy to invite you to the 12th Stics users seminar
This seminar is a side-session of the iCROPM symposium that gathers eminent crop modelers from all around the globe The iCROPM will focus on advances in crop modelling in general with a great diversity of models and views on crop modelling This seminar will focus more specifically on the Stics model and on the scientists community familiar to or interested in the way the model (i) conceptualizes and simulates cropping systems (ii) has evolves over the past years to account for an increasing range of cropping systems properties It offers a unique opportunity to take advantage of the great diversity of the views and expertise of the scientists coming to Montpellier this week
We chose to host the seminar at the Agropolis campus in Montpellier at the French agricultural research and international cooperation organization CIRAD that works for the sustainable development of tropical and Mediterranean regions It is not mere coincidence - it underlies our will to strengthen the ability of the Stics model to deal with issues at stake in tropical environments This is also reflected in the program and the list of participants
We truly hope you will enjoy this Stics2020 seminar and that it will offer you the opportunity to connect and exchange with new people on your favorite topic as well as on other challenges you want to undertake for the future
900 - 915 Welcome speeches 15 JP Laclau (CIRAD) + P Cellier (INRAE) + STICS team head
915 - 1040 Session 1 News from the last STICS workshop
News and propects for the STICS team and network 20 5 E Justes D Ripoche M Launay and S Buis
The Red Book of STICS towards version 2 2 - N Beaudoin
The genesis of STICS v10 and new formalisms implemented in the next standard version 20 5 L Strullu
SticsRpacks a set of packages for managing Stics from R 15 5 S Buis S amp P Lecharpentier
1040 - 11 00 Coffee break
1110 - 1230 Session 2 New formalisms and crop calibration for crop diagnosis Chair G
Falconnier
Development of a new formalism for the establishment of grain yield and protein for determinate growing plants in a dedicated research version of STICS 15 5 N Beaudoin or B Dumont
Assessment of the impact of water stress on soybean yield in Canada using STICS 15 5 G Jeacutego
Comparison of sugarcane STICS model calibrations to simulate growth response to climate variability 15 5 M Christina
Use of the STICS model for simulating physiological and soil evolution in the Champagne vineyard under different scenarios 15 5 C Demestihas
1230 - 1400 Lunch break (Agropolis International - Vanille room)
1400 - 1530 Session 3 Modelling intercropping with STICS Chair G Louarn
How to model crop-weed competition for soil resources Connecting the STICS soil submodel to the FLORSYS weed dynamics model 15 5 N Colbach
Improving the intercropping version of the STICS model for simulating inter-specific competition 15 5 R Vezy
Calibration and Evaluation of the STICS Intercrop Model for Two Cereal-Legume Mixtures 15 5 K Paff
5
Modelling the agronomic performance of millet-cowpea intercropping under the semi-arid environment of Senegal 12 3 Y Senghor
Calibration of STICS soil-crop model for sorghum crop mixed with cowpea bean to evaluate the performance of this crop-system in sub-Saharan Africa 12 3 A Traoreacute
1530 - 16 00 Coffee break
1600 - 1730 Session 4 Methods and new tools for modelling with STICS Chair F Affholder
AgGlob Workflow for simulation of agronomic models at a global scale 15 5 H Raynal
Preliminary coupling of STICS (v91) to PEcAn ecological informatics toolbox and its comparison to BASGRA 15 5 I Fer
A global optimization tool for assimilation of leaf area index into STICS crop model 15 5 M Mesbah
STICS on SIWAA A STICS Tool set deployed on the SIWAA Galaxy Web platform 12 3 P Chabrier
A new method for sensitivity analysis of models with dynamic andor spatial outputs 12 3 S Buis
1730 End of the 1st day
1730 - 19 00 Free time and Transfer to Montpellier social dinner place with public transports
1900 - 23 00 Social dinner ndash Villa mont-riant - Montpellier - 6 boulevard vieussens
Friday 7th February 2020
900 - 1000 Session 5 Environmental impact of cropping systems and soil CampN dynamics Chair I Garcia de Cortazar
Verification and long-term simulations of STICS crop model to predict and analyze growing seasons N2O fluxes of spring wheat in eastern Canada 15 5 E Pattey
Modelling decomposition and N2O emissions of mulches varying in quantity and quality 15 5 B Chaves
Modelling short and long-term nitrogen and carbon budgets of agro-ecological cropping systems with a dedicated STICS research version 15 5 N Beaudoin
1000 - 1050 short talks (presentation of posters)
STICS ability to simulate long-term soil organic matter dynamics in crop-grassland rotations 5 2 AI Graux (A Cadero)
Simulation of switchgrass biomass production in Eastern Canada with the STICS model 5 2 G Jeacutego
6
Modelling the impact of soil and climatic variability on sugarcane growth response to mineral and organic fertilisers 5 2 M Chaput
Impact of corn root growth parameters on soil moisture evapotranspiration and crop growth in STICS model 5 2 E Pattey (S Saadi)
Impacts of observed and projected climatic constraints on rainfed wheat yield under a typical Mediterranean condition 5 2 C Yang
Coupling Sentinel-2 images and STICS crop model to map soil hydraulic properties 5 2 K Lammoglia
1050 - 1110 Coffee break
1110 - 1230 Session 6 Regional and large scale simulations using STICS Chair E Pattey
Estimate demand for irrigation water and nitrogen fertilizers in Europe at different scales 15 5 PA Jayet
Regional-scale coupled modelling of water pollution by nitrate from agricultural sources the Seine-Normandy hydrosystem case study 15 5 N Gallois
Simulating innovative cropping systems aiming at producing biomass while reducing greenhouse gas emissions in the Hauts-de-France region 15 5 F Ferchaud
New crop fertilization strategies after introduction of anaerobic digesters in a territory and their consequences on carbon and nitrogen dynamics in soils case study of the Versailles plain
15 5 CLaunay
1220 - 1400 Lunch break (Agropolis International - Vanille room)
1400 - 1445 Session 7 Scenario simulations using STICS Chair M Launay
To maximize multiple ecosystem services without dis-service for water the management of cover crops has to be climate and soil specific A simulation approach using STICS model 15 5 N Meyer
Simulating soil organic carbon dynamics in long-term bare fallow and arable experiments with STICS model 15 5 F Ferchaud (H Clivot)
Participative approach with STICS for evaluation of nitrogen management scenarios in organic farming systems 5 2 N Beaudoin
1445 - 1530 Invited conference The ldquobusinessrdquo of developing and delivering a systems model ndash the APSIM experience 30 10 PJ Thorburn
1530 - 1600 Concluding session Conclusion and General discussion on STICS team governance 15 20 STICS team head E Justes D Ripoche M Launay and S Buis
1600 - 1630 End of the Workshop with Coffee break
7
Content
Session 1 News from the last STICS workshop 9
Conceptual basis formalisations and parameterization of the STICS crop model second edition 9
The genesis of STICS v10 11
SticsRpacks a set of packages for managing Stics from R 13
Session 2 New formalisms and crop calibration for crop diagnosis 15
Development of a new formalism for the establishment of grain yield and protein for determinate
growing plants in a dedicated research version of STICS 15
Assessment of the impact of water stress on soybean yield in Canada using STICS 18
Comparison of sugarcane STICS model calibrations to simulate growth response to climate
variability 20
Use of the STICS model for simulating physiological and soil evolution in the Champagne vineyard
under different scenarios 22
Session 3 Modelling intercropping with STICS 24
How to model crop-weed competition for soil resources Connecting the STICS soil submodel to
the FLORSYS weed dynamics model 24
Improving the intercropping version of the STICS model for simulating inter-specific competition 26
Calibration and Evaluation of the STICS Intercrop Model for Two Cereal-Legume Mixtures 28
Modelling the agronomic performance of millet-cowpea intercropping under the semi-arid
environment of Senegal 30
Calibration and evaluation of the STICS soil-crop model for sorghum-cowpea intercrop in sub-
Saharan Africa 32
Session 4 Methods and new tools for modelling with STICS 33
AgGlob Workflow for simulation of agronomic models at a global scale 33
Preliminary coupling of STICS (v91) to PEcAn ecological informatics toolbox and its comparison to
BASGRA 35
A global optimization tool for assimilation of leaf area index into STICS crop model 37
STICS on SIWAA A STICS Tool set deployed on the SIWAA Galaxy Web platform 39
A new method for sensitivity analysis of models with dynamic andor spatial outputs 42
Session 5 Environmental impact of cropping systems and soil CampN dynamics 44
Verification and long-term simulations of STICS crop model to predict and analyze growing seasons
N2O fluxes of spring wheat in eastern Canada 44
Modelling decomposition and N2O emissions of mulches varying in quantity and quality 46
Modelling short and long-term nitrogen and carbon budgets of agro-ecological cropping systems
with a dedicated STICS research version 48
STICS ability to simulate long-term soil organic matter dynamics in crop-grassland rotations 50
Simulation of switchgrass biomass production in Eastern Canada with the STICS model 52
8
Modelling the impact of soil and climatic variability on sugarcane growth response to mineral and
organic fertilisers 54
Impact of corn root growth parameters on soil moisture evapotranspiration and crop growth in
STICS model 55
Impacts of observed and projected climatic constraints on rainfed wheat yield under a typical
Mediterranean condition 57
Session 6 Regional and large scale simulations using STICS 59
Estimate demand for irrigation water and nitrogen fertilizers in Europe at different scales 59
Regional-scale coupled modelling of water pollution by nitrate from agricultural sources the
Seine-Normandy hydrosystem case study 61
Simulating innovative cropping systems aiming at producing biomass while reducing greenhouse
gas emissions in the Hauts-de-France region 64
New crop fertilization strategies after introduction of anaerobic digesters in a territory and their
consequences on carbon and nitrogen dynamics in soils case study of the Versailles plain 66
Session 7 Scenario simulations using STICS 68
To maximize multiple ecosystem services without dis-service for water the management of cover
crops has to be climate and soil specific A simulation approach using STICS model 68
Simulating soil organic carbon dynamics in long-term bare fallow and arable experiments with
STICS model 70
Participative approach with STICS for evaluation of nitrogen management scenarios in organic
farming systems 72
9
Session 1 News from the last STICS workshop
Conceptual basis formalisations and parameterization of the STICS crop model
second edition Beaudoin N1 Ripoche D2 Strullu L3 Mary B1 Launay M2 Leacuteonard J1 Lecharpentier P2 Affholder
F4 Bertuzzi P2 Buis S 5 Casellas E6 Constantin J7 Dumont B8 Durand JL9 Garcia de Cortazar-
Atauri I2 Ferchaud F1 Graux AI 10 Jego G11 Le Bas C12 Levavasseur F 13 Louarn G9 Mollier A 14
Ruget F4 Justes E5
1 INRAE AgroImpact France - 2INRAE US Agroclim Avignon France - 3ASAE REIMS cedex France -4
CIRAD Montpellier France - 5 INRAE UMR EMMAH Avignon - 6 INRAE MIAT RECORD Castanet-Tolosan
France - 7 INRAE UMR AGIR Castanet-Tolosan France - 8 Universiteacute de Liegravege Gembloux Agro-Bio Tech
Belgique - 9 INRAE UR P3F Lusignan France - 10 INRAE UMR PEGASE Rennes France - 11 Agriculture et
Agroalimentaire Canada Queacutebec - 12INRAE US InfoSol Orleans France - 13 INRAE UMR ECOSYS Grignon
France - 14 INRAE UMR ISPA Bordeaux France
nicolasbeaudoininrafr
Keywords deterministic model cropping system agro-ecology environment use coupling
Introduction
Since its creation in 1996 STICS has evolved to respond to emerging issues (Beaudoin et al 2019) The
need to make the formalisms of the model accessible to a large community of users has led to the
publication of the book Conceptual basis formalizations and parameterization of the STICS crop
model under the guidance of Nadine Brisson The draft of the so-called red book was presented to
the STICS seminar in Reims in 2007 then the book was published by Quae Eds in early 2009 This book
was original because it is the only existing publication concerning an international crop model that
describes exhaustively the model formalisms and a rare synthesis of disciplines in the service of
knowledge and action on cultivated fields (Figure 1)
Figure 1 Diagram of the crossing of disciplines and scientific and technical productions allowed by STICS
The limits of the 2009 edition lie in its paper format which does not allow a concomitant update to the
evolution of the code The challenge of the new project is to reinforce the dynamics of interaction
between the evolution of the model represented by the STICS Project Team (EPS) and the pluralistic
community of users of STICS The objective of the EPS is to propose a scalable version of the book
10
giving it the status of key and up to date reference and giving to the use of the model a potentially
unlimited life
Material and methods
The design logic of the book builds on the achievements of the previous one - description of all the
formalisms of the STICS model with the interaction processes between crop soil climate and crop
management at the plot scale -detail of the construction hypotheses and equations of the model
illustrated by graphs - display of operational information
The new edition will bring novelties of substance and form It will present the new processes
over specificities of grassland hellip ) It will display intercropping processes over all the chapters devote
two chapters to helping user involvement and extending model capabilities for various applications
(Table 1) Mathematical equations will be written in an academic way and can be directly tested via R
Markdown to ensure reproducibility A dematerialized edition will be available free of charge for each
new version Besides there will be possible to print it on demand (with fees)
The project management is entrusted by the EPS to an editorial committee which is composed of 6
members On a technical level the project has been submitted to QUAE Eds who are interested in its
dynamic and innovative character The writing is organized in a modular way at the level of each
chapter which is coordinated by 2 persons It will rely on the 2009 writing and will seek new
contributors the list of which will be drawn at the chapter level The writing is planned for the first
semester 2020 for publication at the end of the year 2020
Table 1 List of planned chapters and novelties
References
Beaudoin N et al (2019) Modeacutelisation du fonctionnement des agro-eacutecosystegravemes lrsquoeacutepopeacutee STICS in une agronomie pour le XXI siegravecle Richard G Stengel P Lemaire G Cellier P Valceschini E cords Quae Eds pp 128-149
Brisson N Launay M Mary B Beaudoin N (2009) Conceptual basis formalisations and parameterization of the STICS crop model Editions QUAE INRA Versailles
11
The genesis of STICS v10 Loiumlc Strullu1 Nicolas Beaudoin1 Gaeumltan Louarn2 Bruno Mary1
1 INRA UR AgroImpact Laon France
2 INRA UR P3F Lusignan France
Mots cleacutes plantes peacuterennes flux de C et N dans les systegravemes de culture
Keywords perennial crops C and N fluxes in cropping systems
Introduction
STICS model was initially developed to simulate crop yields water and nitrogen fluxes in plants and
soils It was applied to annual crops and grasslands Its main environmental goal was the protection of
water resources Recently new challenges appeared concerning the carbon sequestration in
agricultural soils the emission of greenhouse gases and the production of renewable energy from
biomass with dedicated perennial crops This lead to new model developments allowing the simulation
of new processes in diversified cropping systems including annual and perennial crops Perennial differ
from annual crops due to their ability to recycle C and N from one year to another The slow and
permanent turnover of their root system and perennial organs plays a key role for C and N recycling in
soils We have developed a new version (v10) of STICS model in order to simulate new processes and
increase the genericity of the model under diversified cropping conditions
Results
The model has been developed parameterized
and calibrated for three perennial crops
(Miscanthus Lucerne and Switchgrass) during
4 years in the research units AgroImpact (Laon)
and P3F (Lusignan) This work was realized with
the supervision of members of the EPS team
thanks to a steering committee The first step
consisted in the conceptualization of new
formalisms to simulate C and N cycling in
perennial crops and to improve the genericity
of the STICS model After the validation of the
new formalisms allowing the simulation of C
and N fluxes at the scale of the growing season
(Figure 1 Strullu et al 2014) we analyzed the
model behaviour under long term simulations
When we tried to realize the simulation of successive regrowth of a perennial crop on the long term
the model simulated both a decrease of soil organic carbon and nitrogen stocks and an accumulation
of mineral nitrogen in the soil These results were in contradiction with experimental observations and
literature After a review of the literature we decided to implement the simulation of the turnover of
root system and perennial organs in the model allowing the simulation of C and N recycling in soils
The new research version was evaluated against long term experiments with independent data (Figure
2) The model was then used to realize a yield gap analysis to study the effect of water and N stresses
on Miscanthus biomass production (Strullu et al 2015)
Figure 1 Simulation of biomass and nitrogen fluxes in perennial organs (orange) aboveground organs (green) and aboveground + perennial organs (blue) of Miscanthus
12
Figure 2 Simulation of soil organic carbon under Miscanthus on the long term at Rothamsted comparison of 3 treatments Roth without N fertilization Roth1 with 60 kg N ha-1 y-1 Roth 2 with 120 kg N ha-1 y-1
The final step of this work consisted in evaluating the genericity of the model which was applied to
other perennial crops like Switchgrass and Lucerne We improved the genericity of the formalisms
describing the C and N partitioning between organs by including structural and reserve compartments
Additional formalisms were required for simulation of Lucerne in order to take into account
specificities concerning the effect of photoperiod on biomass and N partitioning (Figure 3 Strullu et
al 2020)
Figure 3 Simulated versus observed aboveground biomass (left) and its N concentration (right) at harvest in function of growing season Sp = spring Su = Summer Au = autumn
The detail of these new formalisms applied both to annual and perennial crops on the long term will
be given in an updated version of the STICS red book (version v10) which will come out in 2020
Reacutefeacuterences bibliographiques
Strullu L Beaudoin N Garcia de Cortagravezar Atauri I Mary B 2014 Simulation of biomass and nitrogen dynamics in perennial organs and shoots of Miscanthus times giganteus using the STICS model Bioenerg Res DOI 101007s12155-014-9462-4
Strullu L Ferchaud F Yates N Shield I Beaudoin N Garcia de Cortagravezar Atauri I Besnard A Mary B 2015 Multisite yield gap analysis of Miscanthus times giganteus using the STICS model Bioenerg Res DOI 101007s12155-015-9625-y
Strullu L Beaudoin N Thieacutebeau P Julier B Mary B Ruget F Ripoche D Rakotovololona L Mary B 2020 Simulation using the STICS model of CampN dynamics in alfalfa from sowing to crop destruction European Journal of Agronomy DOI 101016jeja2019125948
13
SticsRpacks a set of packages for managing Stics from R Samuel Buis1 Patrice Lecharpentier2 Reacutemi Vezy3 Michel Giner4
1 INRA UMR EMMAH Avignon France 2 INRA US Agroclim Avignon France 3 CIRAD UMR AMAP
Montpellier France 4 CIRAD UPR AIDA Montpellier France
Keywords R model simulations parameter estimation uncertainty and sensitivity analysis
Introduction
The SticsRpacks project has been initiated end 2018 to develop tools for piloting the STICS model via the high-level language R These tools aim at - easily performing operations that are not provided in JavaSTICS eg production of various graphs
statistical processing link with databases
- automating these operations using scripts
- reducing the computation time required to perform simulations
It is composed of a set of R packages These packages are addressed to Stics users and developers and
will be used in its automatic test and performance evaluation system (Buis et al 2016) Methodological
packages are developed in a generic way to be coupled with other crop models
SticsRfiles SticsOnR and CroptimizR
First versions of the packages SticsRfiles SticsOnR and CroptimizR (Fig 1) will be released for the Stics 2020 seminar Other packages may be developed later (eg IdeSticsR)
Figure 1 Architecture of the SticsRpacks packages ApsimOnR and SQonR are external packages
functions Development of IdeSticsR package has not yet started
They will include functions for - converting XML input files (JavaStics) into text input files (Stics) replacing (getting) parameters
and option codes values in (from) XML and text files getting simulated and observed variables
values from Stics output and observation files (SticsRfiles package)
- generating Stics input files from JavaStics working directory running Stics simulations from
JavaStics or Stics input files with possible forcing of input parameters option codes and
parallelization of the simulations (SticsOnR package)
- multi-step parameter estimations with frequentist (multi-start Nelder-Meade simplex Nelder and
Mead (1965)) or bayesian (DREAM Vrugt (2016)) methods with possible simultaneous estimation
of specific and varietal parameters on multi-varietal datasets (CroptimizR package)
Development tools
IdeSticsR
R interface to IDE-Stics
SticsOnR
Simulation management
SticsRFiles
IO files management
CroptimizR
UA SA Parameter optimization
ApsimOnR SQonR hellip
14
SticsRpacks is a collaborative and opensource project Source code versioning is handled in gitHub
(httpsgithubcomSticsRPacks) A common coding style has been adopted Automatic
documentation is performed using Roxygen2 Websites are generated using pkgdown (see
httpssticsrpacksgithubioCroptimizR) User documentation is provided through function help and
vignettes available on the packages websites Automatic tests (including CRAN checks and unit tests)
are performed using testthat and Travis
Conclusion and perspectives
The development of the packages included in SticsRpacks just began Other features are already planned and future versions should include additional functions for
- downloading (uploading) USMs from (to) the IDE-Stics database (Beaudoin et al 2015) - converting (Stics input) text files into (JavaStics input) XML files - generating new USMs by combining existing climate soils plant and management files - analyzing crop models inputs and outputs (diagnosis statistical criteria graphics) including
comparison with observations - probabilistic uncertainty analysis (multiple distributions and sampling methods) and sensitivity
- other parameter estimation methods (eg evolutionary algorithm Hamiltonian MCMC) and objective function criteria likelihoods
- selection of parameters to estimate - taking into account prior information and constraints (eg inequality constraints) on
estimated parameters and output variables - evaluating the predictive performance in parameter estimation process (cross validation hellip)
In addition to Stics CroptimizR has already been coupled with ApsimX and SiriusQuality crop models Its genericity will make it possible to evaluate multiple calibration approaches on different crop models
and pool crop modelling team efforts to provide relevant methods for users of those models
References
Buis S Coucheney E Launay M Lecharpentier P Mary B et al (2016) Multicriteria evaluation of the stics soil-crop model and implementation of an automated evaluation system iCROPM International Crop Modelling Symposium Crop Modelling for Agriculture and Food Security under Global Change Mar 2016 Berlin Germany 441 p
Nelder J A and Mead R (1965) A simplex method for function minimization The Computer Journal 7 p 308-313
Vrugt J A (2016) Markov chain Monte Carlo simulation using the DREAM software package Theory concepts and MATLAB implementation Environ Model Softw 75 273-316
Beaudoin N Armas-Herrera C Le Bas C Buis S Garcia De Cortazar Atauri I Ruget F Ripoche D Launay M (2015) Creacuteation de IDE-STICS (base de donneacutees intercontinentale pour leacutevaluation de STICS) Xe seacuteminaire des utilisateurs et concepteurs du modegravele Stics Mar 2015 Rennes France France 102p
15
Session 2 New formalisms and crop calibration for crop diagnosis
Development of a new formalism for the establishment of grain yield and protein
for determinate growing plants in a dedicated research version of STICS Chlebowski Florent1 Dumont Benjamin2 Vitte Guillaume3 Meurs Reacutemi4 Rosso Pablo5 Nendel Class5
Beaudoin Nicolas1
1 INRA UR 1158 AgroImpact Site de Laon 180 rue Pierre-Gilles de Gennes 02000 Barenton-Bugny France
3 INRA UR 1158 AgroImpact Site drsquoEstreacutees-Mons 80203 Peacuteronne France
4 Centre Pilote Ceacutereacuteales et Oleacuteo-Proteacuteagineux 5030 Gembloux Belgique
5 Leibniz Centre for Agricultural Landscape Research (ZALF) 15374 Muumlncheberg Germany
Keywords grain yield grain protein formalism sinksource cereal crops
Introduction
The actual formalism of the STICS model (v91) for the prediction of grain yield for determinate
growing plants consists in calculating a daily accumulation of biomass in grains by applying a
progressive harvest index to the total biomass This formalism brings a relative robustness in the
yield prediction According to the reference time unit used it will give a higher weight to the use of
carbohydrates produced after flowering (thermal time) or to remobilization (calendar time) for grain
yield elaboration This hinders the complexity and the dynamic of the different mechanisms that
contribute to C accumulation in grain especially within climate change context (Launay et al 2010)
Material and methods
In a dedicated research version of STICS we developed a new formalism that aims to consider grains
as a sink following Launay et al (2010) The formalism to predict grain number was kept as the one
used for determinate growing plants in STICS (v91) We replaced the formalism of total yield
elaboration and the a posteriori computation of the weight of one grain by the filling of individual
grains The daily growth function of each grain proposed here corresponds to the derivative function
of grain biomass growth evolution according to thermal time (Robert et al 1999)
The lone source of water-soluble carbohydrate (WSC) is the temporal reserves which are feed by
remobilizations and the addition of neoformed carbohydrates during the reproductive phase
Although temporal reserves are not explicitly located in STICS we know that the WSC are
transported from the source to the sink through the phloem (Lemoine et al 2013) We have
therefore linked the flow of transpiration due to stoma present in the leaves and spikelets to
estimate a daily flux Knowing there is a maximal WSC concentration in phloem we then introduce a
daily limitation in the WSC availability for grains Finally the N content in grains is linked to the
Nitrogen Internal Efficiency (NIE) as mentioned by Gastal et al (2015)
Three experimental sites devoted to varying crop species (s barley w barley and w wheat) with
treatments differing by N application and irrigation in the same site-year were studied These three
experimental sites are the SOERE ACBB ldquoGrandes culturesrdquo (Estreacutees-Mons France) Gembloux
(Belgium) and Muumlnchebger (Germany) We only used simulations with good aboveground biomass
estimation to validate our formalism since in our dataset we have no measure of temporal reserves
16
Results and discussion
The comparison between model outputs shows a better prediction of grain yield and nitrogen
content with the new formalism (Table 1) Focusing on the harvest index (HI) outputs between the
actual formalism and the new one (Figure 1) shows a significant difference on either barley or wheat
crops The current formalism is not so robust since for a same year and a same site the mean HI is
underestimated and the variability of simulated HI is almost null Using the new formalism improved
both the performance of the mean prediction and a better account of the HI variability according to
crop management Especially the new formalism was able to simulate the exceptional weather
condition in 2018 with a high remobilization of neoformed carbohydrates during reproductive phase
Besides the performance of production criteria this research version is expected to better predict
the CN ratio of crop residues which strongly influences soil mineral N availability and humus
storage
Figure 1 Comparison of the observed (x axis) and the simulated (y axis) harvest index between the actual (left) formalism and the new one (right) Group of datasets from Gembloux (Gbx Belgium) Muumlncheberg (Mun Germany) and Estreacutees-Mons (SOERE France) SB WB amp WW stand for s barley w barley and w wheat respectively Numbers 13 15 18 amp 19 are the harvest year Lines represent linear regressions
Table 1 Efficiency of the model with the actual formalism and the new one on some variables during crop cycle
Aboveground biomass Aboveground N amount Grain yield Grain N amount
Actual formalism 083 049 033 015
New formalism 083 049 054 056
Acknowledgement We thank the Barley-IT project funded by the EIT Climate-KIC and the
experimenters for the datasets We thank the SPW-DGO3 (Wallonie Belgique) for its financial
support to the CePiCOP actionsrsquo and research program which provided historic records for model
evaluation
References
17
Gastal F Lemaire G Durand J-L Louarn G 2015 lsquoChapter 8 - Quantifying Crop Responses to Nitrogen and Avenues to Improve Nitrogen-Use Efficiencyrsquo In Crop Physiology (Second Edition) 161ndash206 San Diego Academic Press httpsdoiorg101016B978-0-12-417104-600008-X
Lemoine R et al 2013 lsquoSource-to-Sink Transport of Sugar and Regulation by Environmental Factorsrsquo Frontiers in Plant Science 4 httpsdoiorg103389fpls201300272
Launay M Garciacutea de Cortaacutezar-Atauri I Guillaume S Brisson N Justes E Gate P Ruget F Guerif M 2010 Evaluation des formalismes du rendement des plantes deacutetermineacutees Cas du bleacute tendre et du bleacute dur Seacuteminaire STICS 2010
Robert N Huet S Hennequet C Bouvier A 1999 lsquoMethodology for Choosing a Model for Wheat Kernel Growthrsquo Agronomie 19 (5) 405ndash17 httpsdoiorg101051agro19990507
18
Assessment of the impact of water stress on soybean yield in Canada using STICS Guillaume Jeacutego1 Reneacute Morissette1 Elizabeth Pattey2
1 Agriculture and Agri-Food Canada Quebec City Research and Development Centre Canada 2 Agriculture and Agri-Food Canada Ottawa Research and Development Centre Canada
Keywords soybean yield water stress evapotranspiration
Introduction
In Canada soybean is grown mainly in Ontario and Quebec without irrigation (Statistics Canada 2019)
Within one production region average annual yields can vary considerably from year to year (up to
about 60 variation in some regions FADQ 2019) Several biotic and abiotic factors may explain these
interannual variations but it is difficult to assess the extent to which each factor contributes to these
variations However it is likely that the intensity and temporal distribution of precipitation plays a
major role within the abiotic factors The use of long climate series (gt 30 years) is one way to better
understand the effect of climate variations on the yield of crops such as soybean Since little or no
experimental data are generally available over such a long period the use of a crop model calibrated
and validated for the region of interest is a relevant solution for this type of approach
The objectives of this work are to 1) verify the performance of the STICS model in simulating the water
balance of a soybean field (soil water stock and evapotranspiration) and 2) use the verified model to
evaluate the impact of water stress on yield losses
Materials and methods
Prior to this work 22 data sets from the Ottawa area (Canada) were used to calibrate and validate
soybean phenology growth and yield processes in the STICS model (v 90) Of these 22 datasets four
(years 1997 1999 2008 and 2016) included evapotranspiration and soil moisture measurements
These four datasets were therefore used to evaluate the modelrsquos performance in simulating two of the
main components of the water balance of an agricultural field during the growing season (AprndashOct)
cumulative evapotranspiration flux per 10-day period and temporal variation in soil moisture
Once the modelrsquos performance was verified several series of simulations over long periods (50 years)
were carried out Four sites located in Ontario (ON) and Quebec (QC) with significant climate gradients
were selected for the study London (ON) Ottawa (ON) Saint-Hubert (QC) and Quebec City (QC) from
the site with the longest growing season (212 days) to the one with the shortest season (183 days) For
each of these sites independent simulations (not successive) were carried out using the historical
climate years from 1960 to 2009 (50 years) for the three main soil types in each region Finally in order
to better assess the impact of water stress simulations were carried out with or without irrigation A
total of 1200 simulations were carried out (4 sites times 3 soils times 50 years times 2 irrigation practices)
Simulated yields for the St-Hubert site without irrigation were compared to the yields measured by La
Financiegravere Agricole du Queacutebec (FADQ) between 1995 and 2009 to verify the performance of the model
in simulating the average yield of a region and its interannual variability Then the simulation results
were analyzed by site and then by sitesoil
Results and discussion
The soil water stock (resmes variable) is generally well-simulated with a normalized root mean square
error (NRMSE) of about 15 and a very low bias (1) Soil water distribution is also well simulated
with NRMSEs between 126 and 338 The highest NRMSE was obtained for the top soil layer (0ndash
19
10 cm) For decadal evapotranspiration the modelrsquos performance was slightly worse with a NRMSE of
35 for the 4 years combined This lower performance of the model is particularly noticeable for 1999
with an overestimation of evapotranspiration (bias of 432) For the other 3 years the NRSME was
close to or less than 30 and the bias less than 20 Overall the model performance is therefore
satisfactory and it can be used to assess the impact of water stress on soybean yields
The simulated average yield over the 1995ndash2009 period at the St-Hubert site is close to the average
yield measured by the FADQ in this region (28 and 24 t ha-1 respectively) The modelrsquos slight
overestimation can be explained by its inability to take biotic factors into account However the
interannual variability seems to be well reproduced by the model with predicted yields ranging from
21 to 32 t ha-1 and from 20 to 29 t ha-1 for the measurements The comparison of treatments with
and without irrigation shows that on average water stress could reduce soybean yield by between 44
and 125 depending on the site The largest reductions are in Ottawa and St-Hubert (-85
and -125 respectively) and the smallest are in London and Quebec (approximately -44) As
expected the largest water stress yield reductions are simulated for the most sandy soils (sandy loam
yield reduction from -85 to -139) since these soils have a lower available water capacity than
loamy soils (loam clay loam and silty clay loam) It should be noted that the impact of water stress
seems very significant on the heavy clays of the St-Hubert region (-168) which are also characterized
by a relatively low available water capacity Finally the simulation results indicate that the interannual
variability of yields due to water stress would represent about 28 of the total variability related to
abiotic stresses taken into account by the model with significant spatial disparities Analysis of the
standard deviation of simulated yields over 50 years indicates that water stress could represent nearly
45 to 48 of the variability in Ottawa and St-Hubert and only 8 to 13 in Quebec and London For
these two sites temperature variations seem to be the cause of most of the interannual variability
Temperatures are often sub-optimal in Quebec City and conversely there is a more significant
frequency of days with temperatures above the optimum growth range in London especially during
the grain filling period
Conclusion
The model was able to correctly reproduce two of the main components of the water balance of a
soybean field in eastern Canada Its use with long climate series on four sites and different soil types
confirmed that water stress played a major role in the interannual variability of yields for two of the
sites studied (Ottawa and St-Hubert) For the other two sites most of the interannual variability in
yields is probably explained by temperature
References
La Financiegravere agricole du Queacutebec (FADQ) Assurance reacutecolte ndash Rendements reacuteels Accessed Nov 2019
1CIRAD UPR AIDA F-97408 Saint-Denis La Reacuteunion France mathiaschristinaciradfr 2CIRAD UPR Recyclage et Risque F-97408 Saint-Denis La Reacuteunion France 3Universiteacute de la Reacuteunion Saint-Denis La Reacuteunion France 4ASAE 2 esplanade Roland Garros Reims France
Mots cleacutes canne agrave sucre La Reunion calibration ICSM
Keywords Sugarcane Reunion island calibration ICSM
Introduction
The key role of crop models is to help understand and predict the effects and interactions between
climate soil management species facilitation and competition on crop development and yield
Several process-based sugarcane models have been developed such as DSSAT-Canegro Canesim
Mosicas or APSIM-Sugar which differ through the nature of input parameters and constituent process
algorithms Assuming that the choice of model should be questioned each time according to the
desired application we present here the calibration of a new growth model for sugar cane (STICS) This
model is particularly suitable for studies on species associations or the agrosystems response to the
supply of organic matter residues
In the present study we present and compare three different calibrations of the sugarcane crop
growth in STICS each of which can be applied to a different situation and objectives
Cane stalk conceptualized as a grain in order to simulate sugar yield (STICS v9)
ldquoSugarcane_grainrdquo
Cane stalk conceptualized as a stem in order to simulate fresh cane yield variability (STICS
v9) ldquoSugarcane_stemrdquo
Cane with perennial reserves in order to simulate multiple regrowth (STICS vX)
ldquoSugarcane_regrowthrdquo
Methods
The database used for calibration consisted in 8 trials performed in the ICSM projects These trials
described in Jones et al 2019 included 2 years of sugarcane monitoring in four countries (Reunion
South Africa Zimbabwe and USA) and followed the same measurement protocols Additionally 6 trials
performed in Reunion between 1994 and 1997 used for the initial sugarcane prototype calibration
were used
In the present study we choose to parameterized the sugarcane species using field measurements or
measurements in the literature as a priority In cases where this information was not available the
model parameters were calibrated The calibration was performed using an R package (Rgenoud) with
a genetic algorithm and a RRMSE like scored function The trials available in the ECOFI database
(Christina et al 2019) were used as a set of validation This database includes 95 trials (1988-2018)
performed with the R570 variety in Reunion Island
Results amp Discussion
21
An illustration of STICS simulations on the ICSM trials is presented in Figure 1 All three calibrations
(ldquoSugarcane_grainrdquo rdquoSugarcane_stemrdquo and ldquoSugarcane_regrowthrdquo) satisfactorily simulated the leaf
area index and carbon allocation to aerial leaf and stalk dry mass in the ECOFI trials The
ldquoSugarcane_grainrdquo was currently the only one accurately simulating sugar yield in the cane stalk but
it failed to simulate fresh cane yield which is an essential information for farmers and sugar industries
The ldquoSugarcane_stemrdquo was the most accurate calibration to simulate fresh cane yield and thus should
be applied to yield forecast studies Finally the ldquoSugarcane_regrowthsrdquo had strong potential while
simulating fresh cane yield and potentially sugar yield (still under development) Additionally the
possibility to simulate multiple regrowth with STICS vX could make it possible to assess the yield decline
with ratoon age commonly observed by farmers as the evolution of soil organic matter in function of
agricultural practices
Perspectives
The potential applications of the STICS model for sugarcane simulations will be discussed with two
focus on sugarcane legume associations and sugarcane response to organic residue applications
Reacutefeacuterences bibliographiques
Christina et al 2019 ECOFI a database of sugar and energy cane field trials ODJAR in press
Jones et al 2019 Exploring process-level genotypic and environmental effects on sugarcane yield
using a international experimental dataset Field Crop Research 244 107622
Fig 1 Example of simulations obtained with the STICS model in the ICSM project (ldquoSugarcane_stemrdquo)
22
Use of the STICS model for simulating physiological and soil evolution in the
Champagne vineyard under different scenarios Constance Demestihas1 Camille Dumortier1 Seacutebastien Debuisson1 Intildeaki Garcia de Cortazar Atauri2
1 Comiteacute Champagne 5 rue Henri Martin 51200 Epernay France 2 INRA Avignon Uniteacute de Service 1116 AGROCLIM 84914 Avignon France
Keywords vine physiological balance soil water and nitrate content Champagne vineyards
Introduction
These last few years the champagne vineyard appears as a real case study for the evolution of nitrogen
and water availability In fact among other nitrogen stress indicators the must nitrogen has been
decreasing since the 2000s The combination of restricted mineral fertilizers and herbicide use the
growing variability of spring rainfall the increasing thermal stress as well as the soil type heterogeneity
are only a few underlying factors that trigger loss of physiological balance in the vineyards The use of
crop modelling approaches in order to accurately follow the nitrogen carbon and water cycles within
the vine and the soil especially for future scenarios appears necessary The first part of the study
consists in validating the STICS model parameterization for vine (Garcia de Cortaacutezar-Atauri 2006)
under the Champagne vineyard conditions The second part formalizes the use of the STICS model for
the Champagne industry
Materials and Methods
The STICS model v9 was used in this study Two dataset were mobilized for this study The first dataset
was obtained using the ldquoreacuteseau vigueurrdquo which is a network of 6 plots representing champagnersquos
vineyards variability in terms of soil climate and viticultural practices A large set of physiological and
soil measures are operated since 2017 The second is a historical database on the experimental station
of the Comiteacute Champagne in Plumecoq which provides leaf water potential and leaf area data
The validation and parameter optimization processes were operated using the EvalR and Optimistics
tools of the STICS interface in a specific non-interchangeable order first on soil and then on physiology
parameters mostly water in fruits The simulations were validated at each step with observed data
using mostly the root mean square error
Results and perspectives
Optimization of 5 parameters and validation of the model in the Champagne vineyards
Observed and simulated leaf water potential at Plumecoq showed at first a very high RMSE as the
subsoil chalk not considered by the model positively impacted the vine water status We therefore
modelized this chalk by adding two hypothetical horizons with a wilting point at 25 and a field
capacity at 40 We then optimized under this chalk subsoil context 4 soil parameters pebbles
(cailloux) soil humidity at field capacity (HCCF) initial root density (densinitial) and the depth of root
obstruction (obstarac) enabling to reach lower RMSE for leaf water potential and leaf area
The next step consisted in optimizing the harvest date thus the yield simulation through water
status in fruits with two parameters H2Ograinmax (maximum water content in berries at harvest)
drawn out of brix degrees values at harvest and deshydbase (phenological rate of evolution of fruit
water) which was optimized on Pinot Noir variety using the observed harvest dates The harvest
dates RMSE decreased a lot the leaf area index appeared very well simulated with an RMSE of 066
but the yield simulation remained unsatisfactory (RMSE of 125) impacting the aboveground nitrogen
content as well (RMSE of 2349) (fig1)
23
Figure 1 Comparison of simulated and observed data for leaf area (lai) aboveground biomass (masec) yield (mafruit) and
aboveground nitrogen content (qnplante) on the ldquoreacuteseau vigueurrdquo database in 2018 and 2019 on 42 unit simulation model
(USM)
The use of the STICS model in Champagne
Predictive climate scenarios for 2019 were created from the 15th of June and onwards in a given type
of soil (fig 2) Decadal mean climatic data (lsquo2019 preacutevirsquo) was compared to past climatically ldquoextremerdquo
vintages (1997 2002 2016 and 2018) in order to see the range of values the nitrate content in soil
could reach as well as the period of nitrate retention in the first 30 cm during autumn a crucial timing
for vine reserve storage
The use of the STICS model in the champagne vineyards is not to predict yields or harvest dates but
rather to foresee the evolution of some important soil and vine indicators impacting the vine
physiological balance yearly and through hypothetical future scenarios The perspective of a web
intranet portal is explored by the Comiteacute Champagne providing information about leaf area
phenology soil water and nitrate status using Champagnersquos meteorological station network and soil
typology
Figure 2 Nitrates dynamic simulated by the STICS model in kgha within the first 30 cm of soil
References
Garcia De Cortaacutezar-Atauri I 2006 Adaptation du modegravele STICS agrave la vigne (Vitis Vinifera L)
Utilisation dans le cadre drsquoune eacutetude drsquoimpact du changement climatique agrave lrsquoeacutechelle de la
How to model crop-weed competition for soil resources
Connecting the STICS soil submodel to the FLORSYS weed dynamics model Nathalie Colbach1 Nicolas Beaudoin2 Seacutebastien Guyot1 Jean Villerd1 Delphine Moreau1
Keywords weed competition nitrogen water cropping system multicriteria evaluation crop
diversification
Introduction
Weeds are harmful for crop production but essential for biodiversity Process-based weed dynamics
models are crucial to synthesize knowledge on weed dynamics and crop-weed interactions apply this
knowledge to cropping-system design and transfer it to stakeholders Such models can also help to
analyse the effects of crop diversification (longer rotation with more species cover crops crop
mixtures) which crucial for agroecological crop production Indeed the processes driving crop-weed
interactions are the same for crop-crop interactions in crop mixtures and crop rotations Plant-plant
competition for soil resources plays a key role in these interactions This paper illustrates how we
connected the soil submodel of STICS (Brisson et al 2009) to provide soil-resource inputs for the weed
dynamics model FLORSYS and then how we used the resulting model complex for simulations
Connecting the STICS soil submodel to the weed dynamics model FLORSYS
FLORSYS (Colbach et al 2014 Colbach et al in revision) is a virtual field for which the user enters a list
of cultural operations lasting for several years (crop succession including cover crops and crop
mixtures all management techniques) together with daily weather soil properties and a regional
weed species pool (Figure 1) These inputs drive the biophysical processes in the field at a daily time
step with a 3D individual-based representation of the canopy FLORSYS focuses on processes leading
to (1) plant emergence and establishment of crop and weed species with diverse ecological
requirements (which allows for crops sown in different seasons and in mixtures where timing
determines the fate of a species) (2) the functioning of heterogeneous crop-weed canopies including
diverse plant ages morphologies and shade responses (as in crop mixtures) (3) carryover effects in
terms of eg weed seed bank soil organic matter or water content on future cropping seasons (which
is crucial for crop rotations) The detailed biophysical model outputs are aggregated into indicators of
crop production and weed (dis)services to easily compare cropping systems Figure 1 illustrates how
this model was connected to the STICS soil submodel The source code of the two models remains
sufficiently separate to allow easily connecting future versions of STICS to FLORSYS
Evaluation and design of multi-performant cropping systems with simulations
First we simulated virtual farm-field networks based on farm surveys from different regions and
stakeholders to identify weed-suppressive crop ideotypes and cropping-system types that reconcile
low yield loss with low herbicide use The simulations showed that compared to crop species with a
high yield loss due to weeds low-loss crops present a larger plant width per unit biomass in unshaded
conditions thinner leaves to increase leaf area chiefly from flowering onwards and etiolate when
25
shaded by neighbour plants with taller plants per unit plant biomass and even thinner larger leaves
Three winning cropping-system types were identified maize monocultures and 2 types with diverse
rotations (different species both winter and summer crops intercropping temporary grassland)
andor crop mixtures combined with well-reasoned tillage (stale seed bed occasional ploughing)
FLORSYS was also used to assess cropping systems designed by scientists or farmers in workshops
Farmers appreciated the models ability to (1) predict weed (dis)services over several years
(2) determine probabilities of success or failure of innovative strategies as a function of past field
history and weather scenarios (3) identify biophysical explanations of cropping system performance
(4) fine-tune cropping systems to local conditions The workshops led to major take-home messages
on agroecological weed management for farmers eg assess crops at the rotation scale weather and
inadequate crop management can cancel out the effects of beneficial techniques weed floras do not
disappear but changehellip
Figure 3 Connecting the STICS soil submodel to the 3D individual-based FLORSYS weed dynamics model
A Each day d STICS provides water potential nitrogen availability and temperature for each soil layer
l These drive seed and plant processes in FLORSYS together with weather and cropping-system inputs
FLORSYS returns canopy information to STICS to calculate soil variables for the next day B In FLORSYS
soil temperature and water potential drive seed germination and pre-emergent growth soil
temperature drives root-system growth Available nitrogen is distributed inside soil voxels (3D pixels)
in each soil layer and extracted by the roots inside each voxel
Conclusion
This study showed how a STICS submodel was connected to a 3D individual-based multiannual weed
dynamics model The resulting model complex can simulate contrasting cropping systems with
different soils weather scenarios and weed floras This is essential to establish rules for weed
management depending on the production situation and cropping system
FundingINRA CoSAC (ANR-15-CE18-0007) EU H2020 ReMIX (N 727217) and IWMPRAISE (N 727321) Casdar RAID funded by the French Ministry in charge of Agriculture and Food
References
Brisson N Launay M Mary B amp Beaudoin N (2009) Conceptual basis formalisations and parameterization of the STICS crop model eacuteditions Quae
Colbach N Biju-Duval L Gardarin A Granger S Guyot S H M Meacuteziegravere D Munier-Jolain N M amp Petit S (2014) The role of models for multicriteria evaluation and multiobjective design of cropping systems for managing weeds Weed Research 54541ndash555
Colbach N Colas F Cordeau S Maillot T Moreau D Queyrel W amp Villerd J (in revision) The FLORSYS crop-weed canopy model as a tool to optimise crop diversification European Journal of Agronomy
Tdl
Ndl
H2Odl
Management
opertions
Year 1
hellip
Year N
Weather
Soil
texture
FLORSYS
Soil submodel
LAId
Nuptakedl
Root biomass amp lengthdl
Plant residuesd
A
Soil layer l
B
Soil surface
Tdl
N dv
H2Odl
Above-ground plant part cylinder
Root system
2D view
26
Improving the intercropping version of the STICS model for simulating inter-specific
competition Reacutemi Vezy 123 Sebastian Munz4 Noeacutemie Gaudio5 Marie Launay6 Kirsten Paff12 Patrice
Lecharpentier6 Dominique Ripoche6 Eric Justes27
1 SYSTEM Univ Montpellier CIRAD INRA IRD Montpellier SupAgro Montpellier France 2 INRA UMR SYSTEM Montpellier France 3 Current address CIRAD UMR AMAP F-34398 Montpellier France remivezyciradfr 4 Institute of Crop Science University of Hohenheim Stuttgart Germany 5 Univ Toulouse INRAE UMR AGIR F-31320 Castanet-Tolosan France 6 INRA US1116 AgroClim Avignon France 7 CIRAD Persyst department Montpellier France Keywords soil-crop model wheat pea interspecific competition intercropping ecological intensification
Introduction
The STICS model has been previously adapted to simulate crops grown in bi-specific mixtures (Brisson
et al 2004 Launay et al 2009) but the model evaluation showed inconsistencies regarding light
interception plant height frost damage and leaf senescence for intercrops as partly already identified
by Corre-Hellou et al (2009) The main objective of our work was to update the intercrop version of
STICS by fixing code issues and by adding new formalisms to integrate a computation of plant height
and a new formalism of the equivalent plant density to better represent the competition between the
two crops A second objective was to evaluate the relevance of these changes compared to the
previous version using a comprehensive dataset of field measurements
Materials and Methods
The new computation of plant height uses an allometric equation from the aboveground biomass that
enhances the range of possible relationships while being robust and parameter scarce A new option
was included for the equivalent plant density a concept first included by Brisson et al (2004) to
consider the interspecific competition between two species The code of the model was also revised
to remove some bugs mainly for the computation of frost damage and leaf senescence that were
found for the intercrop version The model STICS was then evaluated using observations from durum
wheat and winter pea grown either in sole crop or bi-specific intercrop in Auzeville (France) for three
years in 2007 2010 and 2011 The new parameters were calibrated using the sole crop data except
those only used for intercropping for which two parameters were calibrated using data of intercrops
Then the simulated leaf area index (LAI) aboveground biomass and plant height were compared to
measurements at different growth stages for each species either in the two sole crops or in intercrop
in order to evaluate the improvement with respect to the previous model version
Results and discussion
The simulations from the new STICS-intercrop version were closer to the observations compared with
the previous version of the model for the targeted output variables ie LAI aboveground biomass and
plant height for the three wheat-pea intercrop experiments (Fig 1) The RMSE was lower by 158 on
average for the two species and the three variables and the model efficiency increased from -027 to
053 showing that the new formalisms improved the simulation of the intercropping system The
model is currently being tested more extensively using different N-treatments species and
pedoclimates to define its validity domain with preliminary results presented in Paff et al (2020) A
27
new R package that uses the STICS intercrop version was designed and used to perform simulations
and analysis (Vezy et al 2019) See the SticsRPacks project for more information (Buis et al 2020)
Conclusion
New formalisms were implemented in the STICS-intercrop version to model bi-specific intercrops with
a relatively simple conceptual approach simulating competition for light capture between two
intercropped species The new version successfully simulated LAI aboveground biomass and plant
height for both wheat and pea grown either in sole- or in intercropping
Acknowledgements
This work was funded by the ReMIX project a EUs Horizon 2020 Program
Figure 4 Simulated (lines) and observed (symbols) leaf area index (LAI) aboveground biomass and plant height for pea (red) and wheat (blue) grown in mixture simulated with the previous (straight) and new (dotted) STICS-intercrop version
References
Brisson N Bussiegravere F Ozier-Lafontaine H Tournebize R and Sinoquet H 2004 Adaptation of the crop model STICS to intercropping Theoretical basis and parameterisation Agronomie 24(6-7) 409-421
Buis S Lecharpentier P Vezy R and Giner M 2020 SticsRpacks a set of packages for managing Stics from R STICS model workshop - side-event of ICROPM Montpellier
Corre-Hellou G Faure M Launay M Brisson N and Crozat Y 2009 Adaptation of the STICS intercrop model to simulate crop growth and N accumulation in peandashbarley intercrops Field Crops Research 113(1) 72-81
Launay M et al 2009 Exploring options for managing strategies for peandashbarley intercropping using a modeling approach European Journal of Agronomy 31(2) 85-98
Paff K et al 2020 Calibration and Evaluation of the STICS Intercrop Model for Two Cereal-Legume Mixtures ICROPM 3-5 February 2020 Montpellier
Vezy R 2019 VEZYsticRs Parameter optimization (Version 110) Zenodo httpdoiorg105281zenodo3233968
28
Calibration and Evaluation of the STICS Intercrop Model for Two Cereal-Legume
1INRA UMR SYSTEM F-34398 Montpellier France email kirstenpaffinrafr 2SYSTEM Univ Montpellier CIRAD INRA IRD Montpellier SupAgro Montpellier France
3Institute of Crop Science University of Hohenheim 70599 Stuttgart Germany 4 CIRAD UMR AMAP F-34398 Montpellier France 5 INRA UMR AGIR 31326 Castanet-Tolosan France 6 CIRAD PERSYST Department 34398 Montpellier France
Mots cleacutes Intensification eacutecologique modegravele de culture Pois Orge Bleacute dur
Introduction
STICS is a soil-crop model capable of simulating crops in succession (Brisson et al 2003) Intercropping occurs when multiple species are grown simultaneously on the same field There has been a growing interest in adapting this traditional technique for modern agriculture as a way of ecological intensification especially for combining leguminous and cereal crops in order to reduce N inputs and potential environmental damage through N losses Intercropping adds complexity to the system by adding inter-species competition Crop models are useful tools for analyzing complex systems as they allow the user far more control over individual variables than is possible in field experiments A first version of the STICS intercrop model was created by Brisson et al (2004) and was recently improved by Vezy et al (2020) The aim of this study was to calibrate and evaluate this improved STICS-Intercrop model by simulating a winter and a spring intercrop mixture durum wheat-winter pea and barley-spring pea
Materials and Methods
The data set used for modelling comprised of four years of wheat (Triticum turgidum L) and pea (Pisum sativum L) field data from Auzeville France with multiple levels of nitrogen fertilizer and four years of barley (Hordeum vulgare L) and pea field data from Angers France (Corre-Hellou 2005) which in some years included two levels of nitrogen fertilizer and two different plant densities of the intercrops The sole crop trials were used for calibration and the intercrop trials for evaluation except for a subset of intercrop data that was used to calibrate the parameters unique to the intercrop model The assumption was that parameters common to both sole and intercropping such as plant-soil interactions and phenology would be the same for both The optimization method used for calibration was based on Wallach et al (2011) The parameters were broken down into 15 groups (16 for pea to include nitrogen fixation) for calibration each corresponding to a different process
Results and Discussion
The root mean square error (RMSE) for shoot biomass was 192 tha for winter pea and 137 tha for durum wheat The RMSE for grain yield was 184 tha for spring pea and 115 tha for barley Overall the model captured the dominancy of one species quite well however the accuracy has to be increased The phenology and height were correctly simulated Some of the discrepancies could be due to biological stresses that STICS does not capture The modelling efficiency is likely to improve because the model calibration process is still ongoing especially for the pea-wheat simulations Conclusions
The intercrop version of the STICS model was recently improved An automatic calibration was performed in this study using two different crop mixtures several years and multiple nitrogen
29
treatments to assess the capacity of the model to simulate these complex systems The model performed reasonably well considering the wide range of conditions on which it was calibrated STICS intercrop could be a useful tool for better understanding the processes and their interaction for this management practice
Acknowledgments
This work was funded by the ReMIX project a Research and Innovation project from the EUs Horizon
2020 Program Special thanks to Nadine Brisson for beginning the work on the STICS intercrop model
We also thank Marie Launay Dominique Ripoche and Patrice Lecharpentier for their work on the
model
(a) (b)
Figure 1 Simulated versus observed in season total aboveground biomass for wheat (a) and pea (b)
grown in intercrop with each other at Auzeville France
Reacutefeacuterences bibliographiques
Brisson N Bussiere F Ozier-Lafontaine H Tournebize R Sinoquet H (2004) Adaptation of the crop model STICS to intercropping Theoretical basis and parameterisation Agronomie 24(6-7) 409-421
Brisson N et al (2003) An overview of the crop model STICS European Journal of Agronomy 18(3-4) 309-332
Corre-Hellou G 2005 Acquisition de lrsquoazote dans des associations pois-orge (Pisum sativum LndashHordeum vulgare L) en relation avec le fonctionnement du peuplement PhD thesis Universiteacute drsquoAngers
Vezy R et al (2020) Implementation of new formalisms in STICS for intercropping modeling iCROPM Montpellier France
Wallach D et al (2011) A package of parameter estimation methods and implementation for the STICS crop-soil model Environmental Modelling amp Software 26(4) 386-394
30
Modelling the agronomic performance of millet-cowpea intercropping under the
semi-arid environment of Senegal Yolande SENGHOR123deg Franccedilois AFFHOLDER3 George Anicet Manga1 Mbaye Diop2 Alpha Bocar
Seacuteneacutegal 3CIRAD AIDA Montpelier France 4SODAGRI Dakar Seacuteneacutegal
Keywords Cropping system pearl millet cowpea model performance variability
Introduction
In the Sahel particularity in Senegal pearl millet ([Pennisetum glaucum (L) R Br] is one of the major
cereals constituting the bases of the populationrsquos subsistence However its production faces several
constraints leading to extreleley low yields (Affholder et al 2013) including the low nutrient content
of the soil especially nitrogen (Badiane 1993) Added to this is the high inter-annual variability of
climate the high cost of inputs and the low an inter_annually variable price of grain making
conventional crop intensification risky and poorly profitable economically The intercropping pearl
millet with cowpea is expected to promote better management of arable land thanks to a land
equivalent ratio (LER) greater than 1 ie the by improving the yield of the associated crops as
compared to sum of the yields of sole crops using the same amount of land (Obulbiga et al 2015)
Given the complexity of the variability of the responses of these intercrop depending on the soil and
climate contexts the use of modeling is a less costly and less time-consuming method than
experimentation which makes it possible to understand how the intercrop works and to test scenarios
of the intercrop in order to improve its functioning A fundamental aim of the experiment was to
simulate different scenarios in the context of climate change in order to obtain optimal production of
pearl millet while improving the physico-chemical conditions of the soil through the use of different
sources of nitrogen (chemical fertilizers intercropping system and mulching) Specifically this involves
studying the effect of fertilization mulching and association (and density of cowpea seedlings) on the
development and yield of pearl millet and cowpeas to assess the effect of the combination of different
nitrogen sources on soil physicochemical properties and crop yields to study the agronomic
performance (LER) of the intercropping pearl millet-cowpea and its inter annual variation according
to the combination of the different nitrogen sources and at the end of calibration validate the StiCs
model This is a work of which only the experimental part is today completed and in this
communication we only present the methodology of our project and the very first data analyzes that
we were able to carry out with the StiCs model
Material and methods
The trial was conducted at the National Center for Agronomic Research of Bambey Senegal during
the wintering 2018 and 2019 The experiment was set-up as a complete random block design with
a factorial structure in strictly rainy conditions and with additional irrigation
The factors studied were fertilization cropping system sowing density and mulching Pearl millet
souna 3 cowpea Baye Ngagne and 58-74f were used The data from these experiments will be used
to calibrate the StiCs model first also using the literature to configure the characteristics of the species
in our study Then we will evaluate the model by comparing the observed dynamics to those simulated
so as to verify what gives us the model to understand and predict the dynamics and finally perform
virtual simulations in a context of climate variability in order to evaluate the performance of these
systems in the future
First results
31
The literature review and the data from the 2018 experiments allowed a first calibration of the thermal
constants of the Stics model to reproduce the phenology and LAI of cowpea and millet in pure culture
Conclusion and continuation of the work The data obtained during these two years will allow us to
assess the agronomic performance of the associated mil-cowpea crops in different contrasting
fertilization situations and to calibrate the model
References
Affholder F Poeydebat C Corbeels M Scopel E Tittonell P 2013 The yield gap of major food
crops in family agriculture in the tropics Assessment and analysis through field surveys and modelling
Field Crops Res 143 106-118
Aminata Niane Badiane 1993 The organic status of sandy soil in the Center-North area of Senegal
Agricultural sciences National Polytechnic Institute of Lorraine pp224
Obulbiga MF Bougouma V and Sanon HO 2015 Improvement of the forage supply by the dual-use
cereal-legume crop association in the northern Sudanian zone of Burkina Faso International Journal
of Biological and Chimical Sciences vol 9 ndeg31431-1439
32
Calibration and evaluation of the STICS soil-crop model for sorghum-cowpea
intercrop in sub-Saharan Africa Traoreacute Amadou1 Gatien Faconnier2 Affholder Franccedilois2 Benjamin Sultan3 1 IER Bamako (Mali) 2 Cirad Monpellier (France) 3 IRD Monpellier (France) Introduction
Intercropping is an entry point for sustainable agricultural intensification particularly for the variable
rainfall conditions that prevail across sub-Saharan Africa However deriving relevant
recommendations for intercropping management requires field experiments The time cost and
technical skills required to study the temporal production of intercropping systems using field
experiments is likely to limit the number and duration of multi-years trials (Lobell et al 2009) To
address such limitations crop simulation models have been used to assess the agronomic and
environmental performances of cropping systems under diverse climatic conditions including
hypothetical future climate (Boote et al 1996) Intercropping has not been modelled extensively and
models that simulate these cropping systems such as STICS have not often been evaluated for tropical
conditions and for species grown by farmers in sub-saharan Africa The objective of this study was to
evaluate the performance of STICS model adapted for West African conditions to simulate the growth
and productivity of sorghum-cowpea cropping systems
Material and method
We used the STICS soil-crop model and data from field experiments conducted at the NTarla
Agronomic Station in Mali in 2017 and 2018 Two varieties of sorghum (local and improved) with
different photoperiod sensitivity were grown as sole crop or intercropped with cowpea Two sowing
dates and two levels of mineral fertilization were also investigated Model simulations were evaluated
using observed data for phenology leaf area index (LAI) biomass yield and soil moisture The
performance of the model was evaluated using root mean square error (RMSE) and model efficiency
(EF)
Results
So far the calibration has been performed for sole crops only After calibration the model satisfactorily
simulated sorghum phenology (RMSE = 338 days for flowering and 341 for maturity) Cowpea
phenology was less well simulated (RMSE = 1327 days for flowering and 930 for maturity) Model
simulation were satisfactory for soil moisture (RMSE = 14 EF = 072) and aboveground plant biomass
(RMSE = 39 EF = 83) With current calibration the model underestimated the leaf area index with
RMSE of 49 and EF of 046
Conclusion
Our work provides a first calibration and evaluation of the sole crops involved in the sorghum cowpea
intercropping under rainfed conditions in southern Mali The next step of the work will be to calibrate
the intercropping treatments
Keywords Crop model Biomass Leaf area index Water use efficiency References Boote K J Jones J W and Pickering N B (1996) lsquoPotential Uses and Limitations of Crop Modelsrsquo Agronomy Journal 88(September) pp 704ndash716 doi 102134agronj199600021962008800050005x
Lobell D B Cassman K G and Field C B (2009) lsquoCrop Yield Gaps Their Importance Magnitudes and Causesrsquo Annual Review of Environment and Resources 34(1) pp 179ndash204 doi 101146annurevenviron041008093740
33
Session 4 Methods and new tools for modelling with STICS
AgGlob Workflow for simulation of agronomic models at a global scale Raynal Heacutelegravene1 Ancelet Estelle1 Le Bas Christine2 Bertuzzi Patrick3 Cahuzac Eric4 Casellas Eric1 Chabrier Patrick1 Constantin Julie5 Pomeon Thomas4 Toutain Benoicirct6
1thinspUR 875 MIAT MIA INRA Castanet Tolosan France heleneraynalinrafr 2thinspUS 1106 INFOSOL EA INRA Orleacuteans France 3thinspUS 1116 Agroclim EA INRA Avignon France 4thinspUS 0685 ODR SAE2 INRA Castanet Tolosan France 5thinspUMR 1248 AGIR EA INRA Castanet Tolosan France
Keywords Crop modeling Computational modeling Parallel computing Global simulation
Introduction Simulation of biophysical models over large areas is used in different contexts linked to global agronomy issues (Muumlller et al 2017) It is useful for analyzing crop performances at a regional scale (Shelia et al 2019) for estimating vulnerability of crop production to climate change (Elliot et al 2014 Montella et al 2015) One of approaches is Global Gridded Biophysical Models (GGBMs) It consists to use a crop model developed at field scale and to run it on different sites in order to take into account the heterogeneity of soils climates and farming practices over the area The sites are organized according to a spatial grid with a fine resolution (some km-2) It is possible to run these massive simulations thanks to the development of clusters It is also possible because more and more data are available to characterize soil climate and farming practices at fine resolution Nevertheless many difficulties remain They concerned i) the coordination of the actors involved in the process of production of results ii) the heterogeneity of data formats that makes tricky to reuse them iii) the design and the realization of the campaign of simulations iv) the validation of simulation results by automated tests v) the reproducibility of results and traceability vi) methods and visualization tools suitable to the mass of results to analyze To overcome these problems we propose the AgGlob framework based on a workflow developed on a Galaxy platform instance (httpsgalaxyprojectorg) Materials and Methods A workflow consists in a sequence of treatments where each step is dependent on occurrence of the previous step The first treatments concern the access to data stored in external databases and their processing in order to make them compatible to the crop model For this step we have developed basic bricks of the workflow - ldquoClimate datardquo tool access to datasets composed of daily observations of temperature radiation rain and PET These data are provided under conditions by SICLIMA database (INRA climate series provider) The SAFRAN grid is used (Meteo France standard with a resolution of 8km) Queries and post-processing are automated - ldquoSoil datardquo tool access to BDGSF (French Soil Geographic Database) maintained by Infosol (INRA provider) An SQL query requests the data It puts the data into the format expected by the crop model - ldquoLand userdquo and ldquoFarming practicesrdquo tool All the information concerning soil land use in France and farming practices come from the national surveys ldquoFrench Land Parcel identification systemrdquo and ldquoEnquecirctes pratiques agricolesrdquo The information are stored in ODR database (INRA provider) and aggregated at the grid scale The objective is to have for each cell of the grid the most representative i) soils ii) rotations and iv)farming practices All these layers of information are combined based on the conceptual work done in INRA study Evaluation Franccedilaise des Ecosystegravemes et des Services Ecosysteacutemiques The results is a table where each line corresponds to a point to simulate with all the information required for simulation (crop rotation sowing date hellip) on a concise form
34
The second step of the workflow consists in preparing the campaign of simulations with the bricks - ldquoSimulation Campaignrdquo tool The previous table is transformed into a text file The user can download and modify it in order to design a new simulation campaign (scenario) The tool includes algorithms for testing the validity Then this text file is sent to the parallelization service of RECORD simulation platform (Bergez et al 2014) embedded in the tool - ldquoCrop simulationrdquo tool The model used is STICS encapsulated in RECORD (Bergez et al 2014) It runs the campaign simulation on the cluster The third step concerns the post-processing of simulation results with automated checks of simulation results and the production of indicators Results and Discussion AgGlob is available on an INRA Galaxy instance It is connected to a distant cluster (MesoLR) where the simulation jobs are run It includes a formalization of GGBMs campaign simulation that we consider as a standard reusable in other projects A campaign of simulations generates large amount of results Some consistency checks have been integrated in order to help the user in detecting problems The workflow can be plugged on other Galaxy instances Conclusion AgGlob is an interesting framework for GGBMs simulation It helps in coordinating the actors involved because the different steps of processing are clearly identified and formalized It also offers a solution for the integration and aggregation of data necessary for simulation by using automated processing algorithm It is enough generic to be easily extend to other crop models and to other data It is also an implementation of the FAIR principles in the domain of GGBMs work therefore it enhances the reproducibility and traceability of results References
Shelia V Hansen J Sharda V Porter C Aggarwal P Wilkerson C Hoogenboom G (2019) A multi-scale and multi-model gridded framework for forecasting crop production risk analysis and climate change impact studies Environ Model Softw 115 144-154
Muumlller C Elliott J Chryssanthacopoulos J et al (2017) Global gridded crop model evaluation benchmarking skills deficiencies and implications Geosci Model Dev 10 1403ndash1422 httpsdoiorg105194gmd-10-1403-2017
Bergez JE Raynal H Launay M Beaudoin N Casellas E Caubel J Chabrier P Coucheney E Dury J Garcia de Cortazar-Atauri I Justes E Mary B Ripoche R Ruget F (2014) Evolution of the STICS crop model to tackle new environmental issues New formalisms and integration in the modelling and simulation platform RECORD Environ Model Softw 62 370-384
Elliott J Kelly D Chryssanthacopoulos J Glotter M Jhunjhnuwala K Best N Wilde M Foster I (2014) The parallel system for integrating impact models and sectors (pSIMS) Environ Model Softw 62 509-516 httpsdoiorg101016jenvsoft201404008
Montella R Kelly D Xiong W Brizius A Elliott J Madduri R Maheshwari K Porter C Vilter P Wilde M Zhang M Foster I (2015) FACE-IT A science gateway for food security research Concurrency Computat Pract Exper 27 4423ndash 4436 doi 101002cpe3540
35
Preliminary coupling of STICS (v91) to PEcAn ecological informatics toolbox and its
comparison to BASGRA Istem Fer1
1 Finnish Meteorological Institute Helsinki Finland
1Agriculture et Agroalimentaire Canada Centre de recherche et de deacuteveloppement de Charlottetown
Canada 2Agriculture et Agroalimentaire Canada Centre de recherche et de deacuteveloppement drsquoOttawa Canada 3Agriculture et Agroalimentaire Canada Centre de recherche et de deacuteveloppement de Queacutebec Canada
Keywords Global optimization assimilation of LAI STICS Earth observation
Introduction
The assimilation of leaf area index (LAI) derived from Earth observation (EO) data is an effective approach to improve yield predictions Assimilation can be done by re-initializing some input parameters such as seeding date seeding density and soil moisture at field capacity which are not readily available (Jeacutego et al 2015) The performance of assimilation techniques are however affected by the method used for optimization and its ability to find a global solution Thus there is a need to develop a user-friendly global optimization tool for crop modeling applications
Material and methods
We introduce a
new global
optimization
package (global
optimization for
calibration and
assimilation
GOCA) under
which various
optimization
approaches
embedded in
MATLAB global
optimization
toolbox are
integrated with the
STICS crop model
The package is
compiled with
MATLAB compiler
which makes it an standalone package for users with no MATLAB GOCA loads information related to
simulation units (eg name of climate soil and observation files) from a spread sheet which can be
modified by users The spread sheet also contains information related to optimization bounds for
variables Furthermore GOCA allows users to select the optimization techniques with related settings
The approaches included in the package are Patternsearch Particle Swarm Simulated Annealing and
Surrogate
Results
Figure 1 a view of GOCA optimization package
38
To examine the performance of different
optimization techniques a study was conducted
in a small experimental farm in Ottawa (ON
Canada) planted with soybean corn and spring
wheat during 1999 to 2010 The simulation units
were obtained by overlaying the field boundaries
to soil map EO data were acquired from various
sources 3 to 9 images for 1999 to 2008 from
multi-spectral images (Landsat or SPOT) and
airborne hyperspectral images (CASI) 13 images
for 2010 from multi-spectral Formosat-2 LAI was
retrieved from MTVI2 (Haboudane et al 2004)
and EVI2 (Huete 2002) derived from the EO data
(Liu et al 2012) The optimization setting were set
at default values and the maximum iteration were
set at 20 iterations for techniques that allowed for
such settings We compared different optimization techniques with the simplex approach in JavaSTICS
(Table 1) All methods embedded in the GOCA package outperformed the Simplex approach embedded
in JavaSTICS in both yield and LAI prediction
Surrogate Simulated Annealing and Particle Swarm approaches are stochastic approach whereas
Patternsearch and simplex are deterministic While the run time of Patternsearch was the same as
Simplex it provided better performance Among stochastic approaches Particle Swarm outperformed
others with reasonable running time (eg 7 minutes per simulation unit) The performance of Particle
Swarm approach also outperformed others in predicting seeding date seeding density and soil
moisture at field capacity
References
Jeacutego G Pattey E Mesbah M Liu J Duchesne I 2015 Int J Appl Earth Obs Geoinf 41 11-22
Haboudane D Miller J R Pattey E Zarco-Tejada PJ Strachan IB 2004 Rem Sens Environ 90(3) 337-352
Huete A Didan K Miura T Rodriguez E P Gao X amp Ferreira L G 2002 Rem Sens Environ 83 195ndash213
Liu J Pattey E Jeacutego G 2012 Rem Sens Environ 123 347ndash358 Wallach D Buis S Lecharpentier P Bourges J Clastre P Launay M Bergez JE Guerif M
Soudais J Justes E 2011 Environmental Modelling and Software 26 386-394 Vrugt J a Braak C Ter Clark MP Hyman JM Robinson B a 2008 Water Resources Research
44 1ndash15
Tabel 1 Performance of different optimization methods
Optimization Technique
Run time1 per simulation (second)
Yield LAI
ME RMSE ME RMSE
Simplex (JavaSTICS) 25 seconds -1297 2675 1097 5225 Surrogate 25 seconds -008 2305 -591 5230 Simulated Annealing 7 hours -225 2417 141 4603 Particle Swarm 8 minutes 751 2074 135 4161 Patternsearch 25 seconds -603 1892 158 4162 1The conputer CPU information for these runs was Intelreg Coretrade i7-6600U CPU 260 GHz
Figure 2 Information on soil texture crops and field locations LAI extracted from Formosat-2 images in 2010 are also illustrated for 3 fields
39
STICS on SIWAA A STICS Tool set deployed on the SIWAA Galaxy Web platform Patrick Chabrier1 Estelle Ancelet1
1 INRA UR 875 MIAT 31326 Castanet Tolosan France
Keywords Virtual Research Environment Crop Simulation Model Simulation Workflow
Introduction
In many cases of virtual scientific experiments or studies collaborative development of workflows of
simulations on appropriate computing resources is essential Like the FACE-IT [1] framework did
propose his Web portal to support the AGMIP [2] Project the SIWAA [7] framework is a new Galaxy
Web Platform that intent to support the AgGlob [6] Project
In this paper we outline some of the main requirements the SIWAA platform aims to address describe
the architecture present the early Stics [4] tool set outline the integration process and propose future
direction for the involved teams and users
Requirements
We propose her the two main requirements we address in priority
access to computational resources Even if either academic or commercial computing resources are
available many users do not have enough skills or time to implement efficient virtual experiment on a
high performance computer And This difficulty is increased when the members of a project do not
have access at the same computing resources and for the same periodicity Therefore the access to
computational resource should be given and permanent
sharing active pipeline of tools As soon as researcher collaborate to develop a virtual experiment
chaining the execution of softwares they can face many difficulties like complex installation
procedures personal workspace heterogeneity versioning of data and softwares persistency and
serialisation of the pipeline One of the solution is to centralize the deployment of the softwares on a
central system accessible by the web
Architecture and Services
SIWAA is fully based on the Galaxy Web platform [3] providing a simple uniform and extensible
workflow authoring and execution interface that enable to develop workflows of simulation in
collaborative way The design of the deployment of Galaxy we have achieved is in two parts On one
side the Web server is running on a simple Linux Virtual Machine hosted by the INRA services at
Toulouse and at the other side we have configured the system to run computing Jobs on the High
Performance Computing Center MESOLR [8]
In order to gives to the authors of the tools a complete access control we do provide a tool access
management system based on the concepts of groups and roles already available And according to
their economics resources users can also use specific computing account that they can decide to by at
MESOLR Furthermore we can enable the users to parametrize by them self the computing
resources they want to get from the High Performance Computing Center
The tool delivery process we decide to adopt oblige the authors of tools to package each tool and
publish them on our own Toolshed service also provided by Galaxy Nevertheless in order to be
efficient and flexible we allow two kind of packaging Either you can package the classic way by
providing scripts where component dependencies are solved by the CONDA [11] packaging system or
40
you can package by providing a command line referencing a Docker [9] container that will be executed
by Singularity [10] on the HPC
A Stics tool set
In order to validate the operational capability of the SIWAA platform according to the GEOC project
founded by the INRA we decide to focus on the development of suite of tools enabling some use cases
of the Stics Models
OptimizeStics90 enables to optimize a set of Stics parameters according to situations and
observations based on on SticsRPacks [5] embedded inside a Docker container is parallelized
SimulateStics850 amp SimulateStics91 simulate one or many Stics Workspaces in parallel with
or without a plan based on simple scripts calling the Stics simulatior embedded inside a
Docker Container
ConvertStics850 amp ConvertStics850 convert Stics Xml Workspaces to Stics Workspaces
runnable by the Stics Command Line Interface
MorrisGrid amp MorrisGridIndices provide a Morris experimental plan and compute the result
of a sensitivity analysis based on the SticsRPacks
WaterStatus and WaterStatusAtFlowering provide graphical outputs convenient for the
OPERATE[13] project implemented with R Scripts
Conclusion
SIWAA is a new infrastructure designed to facilitate the sharing of active virtual experiment and the
access to a HPC system By providing a first tool set dedicated to the Stics model we have demonstrate
our capability of feeding the system with promising applications We will now be facing new goals like
hosting new simulators and factorizing companion tools and data usages and this in order to
contribute to the animation of a SIWAA user community
References
1 Montella R Kelly D Xiong W Brizius A Elliott J Madduri R amp Zhang M (2015) FACE‐IT A
science gateway for food security research Concurrency and Computation Practice and
Experience 27(16) 4423-4436
2 Rosenzweig C Jones J W Hatfield J L Ruane A C Boote K J Thorburn P amp Asseng S
(2013) The agricultural model intercomparison and improvement project (AgMIP) protocols
and pilot studies Agricultural and Forest Meteorology 170 166-182
3 Madduri R Chard K Chard R Lacinski L Rodriguez A Sulakhe D amp Foster I (2015) The
Globus Galaxies platform delivering science gateways as a service Concurrency and
Computation Practice and Experience 27(16) 4344-4360
4 Brisson N Mary B Ripoche D Jeuffroy M H Ruget F Nicoullaud B amp Richard G (1998)
STICS a generic model for the simulation of crops and their water and nitrogen balances I
Theory and parameterization applied to wheat and corn
5 Buis S Vezy R Lecharpentier R(2019) SticsRPacks httpsgithubcomSticsRPacks
41
6 HRaynal E Ancelet C Le Bas P Bertuzzi E Cahuzac E Casellas P Chabrier T Pomeacuteon HRaynal
B Toutain AgGlob Calcul et workflow pour la simulation informatique de modegraveles
agronomiques agrave lrsquoeacutechelle de la France Journeacutees JCAD (Calcul et donneacutees) 2019 91011 oct
7 Chabrier P Ancelet E(2019) SIWAA Simulation Worflows Agroecosystems Analyses
httpssiwaatoulouseinrafr
8 httpsmeso-lrumontpellierfr
9 httpswwwdockercom
10 httpssingularitylblgov
11 httpsdocscondaio
12 Chabrier P Latrille E Giacomoni F (2019-2020) GEOC Galaxy Extra-omique Community
13 Bancal Dresch Launay M (2019-2020) OPERATE Simulations de strateacutegies drsquoadaptation des
cultures de bleacute en contexte de CC
42
A new method for sensitivity analysis of models with dynamic andor spatial
1 INRA UMR 1114 EMMAH 84914 Avignon France samuelbuisinrafr 2 University of Guyane 228-UMR-Espace dev Cayenne France 3 INRA UMR MISTEA 34060 Montpellier France
Introduction Global Sensitivity Analysis (GSA) is recognized as a powerful tool for measuring the impact of models inputs on simulated outputs under prescribed inputsrsquo variability Although many simulation models among which crop models produce temporal andor spatial data extracting relevant information from GSA of such outputs is still challenging This requires the use of Multivariate Sensitivity Analysis methods (MSA) that are often based on a dimension reduction principle model outputs are projected onto predefined or data-driven orthogonal bases such as polynomial or eigenvectors (Lamboni et al 2011) They are however so far limited by the selection of the associated bases which is constrained by orthogonality requirements Indeed these bases do not always allow extracting relevant and interpretable information on structural properties of multivariate outputs More applicable MSA methods are thus expected to be developed (Wei et al 2015) In this work we propose a new MSA method combining GSA and clustering Cluster-based GSA Clustering methods have been designed to identify groups of similar objects in multivariate data sets They may thus be particularly adapted to capture the variability of behaviors of modelsrsquo temporal andor spatial outputs However while binary clustering has been extensively used in scalar sensitivity analysis to assess the importance of factors leading to a region of interest (Raguet and Marrel 2018) there is still a lack of quantitative sensitivity analysis methods taking benefit of a clustering of multivariate outputs with any number of clusters The main idea of the proposed method is to apply clustering to model outputs simulated on a numerical design-of-experiment generated using a given GSA method and to compute standard GSA indices (eg Sobolrsquo indices) not on the models outputs but on new variables indicating the membership of each output to the different clusters (see Fig 1) We propose to use a fuzzy clustering method the new variables are thus the so-called membership functions (MF valued in [0 1]) that quantify the degree of membership of any model simulated output to each cluster The computation of sensitivity indices on either the MF or MF differences allows discussing which parameters influence the membership to a given cluster or drive the output from one cluster to another A generalized sensitivity index (Lamboni et al 2011) is also introduced to quantify the overall contribution of the parameters wrt any change of clusters
43
Figure 1 Workflow of the Cluster-based GSA X represents the vector of model inputs that varies in
the sensitivity analysis Y(t) the (temporal in this case) output simulated by the model K is the number of clusters i the index in the design-of-experiment
Applications The method has been applied using Sobolrsquo and FAST GSA methods to (i) a dedicated toy model producing temporal signals with one or two maxima in response to five
parameters (ii) the Cantis model (Garnier et al 2003) simulating the transformations of carbon and nitrogen
in soils (10 parameters varying) (iii) the Stics crop model (Coucheney et al 2015) on the Multi-Model Ideotyping Agmip 2019
exercise (27 parameters varying) Results have shown that the model behaviors can be efficiently reported by the newly proposed method Conclusions The proposed method is particularly adapted to models with dynamic andor spatial outputs that produce distinguishable sets of responses ie when clustering of these outputs lead to well separated and interpretable clusters In this case it is particularly powerful for identifying the model inputs that drive these different behaviors The method is generic wrt clustering and GSA method used Keywords
Sensitivity analysis multivariate outputs generalized sensitivity indices References Coucheney E Buis S Launay M Constantin J Mary B de Cortaacutezar-Atauri I G Leacuteonard J (2015) Accuracy robustness and behavior of the STICS soilndashcrop model for plant water and nitrogen outputs evaluation over a wide range of agro-environmental conditions in France Environmental Modelling amp Software 64 177-190 Garnier P Neel C Aita C Recous S Lafolie F Mary B (2003) Modelling carbon and nitrogen dynamics in a bare soil with and without straw incorporation European Journal of Soil Science 54(3) 555-568 Lamboni M Monod H Makowski D (2011) Multivariate sensitivity analysis to measure global contribution of input factors in dynamic models Reliability Engineering amp System Safety 96(4) 450-459 Raguet H Marrel A (2018) Target and Conditional Sensitivity Analysis with Emphasis on Dependence Measures arXiv preprint arXiv180110047 Wei P Lu Z Song J (2015) Variable importance analysis a comprehensive review Reliability Engineering amp System Safety 142 399ndash432
44
Session 5 Environmental impact of cropping systems and soil CampN
dynamics
Verification and long-term simulations of STICS crop model to predict and analyze
growing seasons N2O fluxes of spring wheat in eastern Canada Elizabeth Pattey1 Guillaume Jeacutego2Joeumll Leacuteonard3
1 Agriculture and Agri-Food Canada Ottawa ON Canada
2 Agriculture and Agri-Food Canada Quebec QC Canada
3Institut National de la Recherche Agronomique Barenton-Bugny France
Keywords greenhouse gas emissions nitrogen fertilization rainfed crop
Introduction
Capturing the variability of nitrous oxide (N2O) fluxes during the growing season in response to
synthetic fertilizer application and climate variations is quite challenging for process-based models
Indeed nitrous oxide fluxes are very sporadic and heterogeneous This variability is not well captured
yet in the inventories based on emission coefficients Verifying process-based model prediction of N2O
emissions is a top priority if we want to reduce the uncertainty in our regional and global estimates
and if we want to make sound assessments of beneficial management practices over space and time
Material and Methods
The STICS crop model can simulate the soilndashcrop system with a daily time step by individual year (ie
with annual reinitialization) or linked over multiple years to account for crop rotation (ie no annual
reinitialization) The daily N budget takes into account mineralization denitrification nitrification NH3
volatilization and crop N uptake Recently new nitrification and denitrification formalisms (Bessou et
al 2010) were added to STICS crop model to estimate N2O emissions based on experimental results
collected mostly from western Europe Denitrification and nitrification are assumed to occur in the
biologically active layer (ie 30 cm in the present study) The N2O predictions of STICS were evaluated
against field-scale fluxes measured using micrometeorological towers equipped with a tunable diode
laser to measure fast-response N2O gradients The N2O fluxes were measured in spring wheat (Triticum
aestivum L) fields (Ottawa ON Canada) during 5 growing seasons between 2001 and 2014 The
experimental fields were tiled drained and had homogeneous soil properties (silty clay loam and clay
loam soil textures) Different mineral N fertilization rates (40-80 kg N ha-1) and forms (urea ammonium
nitrate) were applied The study focused on growing season N2O emissions following mineral
fertilization which were divided between the vegetative and reproductive stages In humid climate
regions such as eastern Canada nitrous oxide emissions are mostly driven by denitrification and to a
lesser extent by nitrification After completing the model performance verification with annual
reinitialization long-term simulations (1953-2012) were performed at Ottawa and Quebec City for
three N fertilization rates (100 80 and 60 of the recommended N rate) and on two contrasted
soil textures (sandy loam and clay loam in Ottawa sandy loam and silty clay in Quebec City) Simulation
results were analyzed to evaluate the impact of climate variability on N2O fluxes
45
Results
Overall the STICS model predictions were in the same range than the observations for each growing
season except for 2014 resulting in a normalized root mean square error of 254 for all years and
115 when 2014 was excluded Model predictions were usually smaller than measured values for the
vegetative stage when denitrification was dominant (mean error of -026 kg N ha-1) During the
reproductive stage the predictions were closer to the observations (mean error of 006 kg N ha-1) The
best results were obtained in 2005 when a dry spell occurred during the vegetative stage Although
the temporal dynamic of N2O fluxes was not always well captured by the model the satisfactory results
obtained for cumulative emissions over the entire growing season allowed to perform long term
simulations over 60 years using the STICS model
As expected the long-term simulation results showed that N2O fluxes were greater on more clayed soil
and for the higher N fertilization rates The N2O fluxes of the recommended N fertilization treatments
were 15 to 32 greater than those of the treatments with 60 of the recommended N rate The N2O
fluxes were also greater in Quebec City (47oN) than in Ottawa (45oN) as a result of the more humid
climate favorable to denitrification processes In Ottawa the fluxes during the vegetative stage were
mainly controlled by the N fertilization rate On the other hand the fluxes during the reproductive
stage were not affected by fertilization rate but a strong linear relationship was found with cumulative
precipitation (R2 ranging from 048 to 065) These results could be explained by the fact that in the
spring during the vegetative stage soil moisture was usually high and soil nitrate was then the main
factor controlling soil N processes and N2O fluxes In summer during the reproductive stage soil
moisture was much more variable and became the main factor controlling soil N processes and N2O
fluxes Weaker similar results were found in Quebec City for the sandy loam soil (R2 ranging from 023
to 028) However on the silty clay soil texture no clear relationship between precipitation and N2O
fluxes was found most likely because soil water retention was greater for this texture in response to
the elevated precipitation Further analyzes are planned to evaluate the effect of growing degree-days
and crop growth on N2O fluxes
This study showed that the recent improvement of the STICS crop model allowed to simulate quite
accurately the cumulative N2O fluxes during the growing season under variable climate conditions of
eastern Canada Accurate simulation of soil moisture during the reproductive stage and soil mineral N
content during the vegetative stage were found to be critical for obtaining accurate predictions The
next phase of the project will be to evaluate the model performance over the entire year from spring
crop seeding until the next spring crop seeding thus including winter with snow cover and the high
N2O emission period following snow melt and spring thaw
References
Bessou C Mary B Leacuteonard J Roussel M Greacutehan E Gabrielle B 2010 - Modelling soil compaction
impacts on N2O emissions in arable fields European Journal of Soil Science 61(3) 348-363
46
Modelling decomposition and N2O emissions of mulches varying in quantity and
1 Federal University of Santa Maria Santa Maria Brazil 2 FARE laboratory INRAE Universiteacute de Reims Champagne Ardenne Reims France 3 AgroImpact INRAE Laon France
Conservation agriculture promotes permanent soil cover with plants or crop residues This practice is
already widely adopted in the subtropical part of Brazil and worldwide (field crops perennial or semi-
perennial crops) The decomposition of crop residues left on soil surface is a complex process driven
primarily by chemical composition (or quality) of residues environmental conditions and soil-residue
contact Changing the quality of residues results in changes in the rate of decomposition and
mineralization of nutrients The amount and morphology of residues determines mulch thickness
which influences how soil surface moisture and temperature are in turn affected All these changes
also affect nitrous oxide (N2O) emissions from nitrification and denitrification which are strongly
affected by inorganic N labile C and soil water status Field experiments to evaluate the whole
spectrum of mulch scenarios would require considerable time and resources Simulation models such
as STICS have the potential to help in the evaluation of this whole range of possible scenarios as they
allow to explicitly describe the link between mulch characteristics crop residues decomposition and
N2O fluxes However remaining gaps in the detailed knowledge of how mulches decompose still limit
the predictive use of models Recent experimental results had for example challenged the widely used
hypothesis of a double compartment mulch decomposition model in which a decomposing layer of
limited thickness in contact with the soil is feeded by an upper non decomposing layer In this context
the objective of the present study is to use specific in situ experiments with mulches varying both in
thickness and quality to evaluate and improve the ability of the STICS model to simulate the
decomposition and N2O emissions of crop residues left at the soil surface This should help for residue
management in no-till systems in southern Brazil
Experimental data and simulation methodology
The dataset used comes from two field experimental studies carried out in Santa Maria Brazil
(29deg42rsquo44rdquo S 53deg42rsquo74rdquo W about 90 m elevation) The local climate is of humid subtropical type
(Koumlppen Cfa) The mean annual temperature is 161 degC and average annual precipitation is 1660 mm
The soil is a Typic Paleudalf with 110 g kg-1 clay 260 g kg-1 silt and 630 g kg-1 sand in the 0-10 cm layer
The first study (Pinheiro et al 2019 Dietrich et al 2019) followed N2O and NH3 emissions during a
sugarcane growth cycle on treatments with different straw quantities (0 4 8 and 12 t DM ha-1)
returned to the soil surface and two N fertilizer rates (0 and 100 kg N ha-1 as urea) Mulch
decomposition soil moisture soil temperature and soil inorganic N over 0-10 cm depth were
measured several times during the experiment The second study (Schmatz et al submitted 2019)
followed over one year the decomposition and N2O emissions of mulches of vetch and wheat added
on a bare soil at different rates (3 6 and 9 t DM ha-1) Soil surface moisture and temperature were daily
monitored during all the experimental period using sensors Mulch decomposition and soil inorganic
N were measured several times during the experiment A step-by-step approach was defined for the
simulation exercise which was conducted using the STICS model v91 Simulation results were first
evaluated for the bare soil treatment to check for correct simulation of soil temperature soil water
47
content basal soil mineralization and N2O emissions Then the different mulches were simulated and
mulch decomposition rates were evaluated for different hypothesis regarding the thickness of the
mulch decomposing layer The effect of the different quantity and quality of mulch on soil water
content C and N dynamics and N2O emissions were then analyzed Only the results from the second
experiment are presented here
First results
Small changes to the STICS general parameterization of soil evaporation were necessary to improve
soil water dynamics simulation in the 0-5 cm and 5-10 cm layers for the bare soil An increase in basal
soil mineralization and a decrease of the potential nitrification rates improved a lot the simulated CO2
fluxes and soil mineral nitrogen dynamics both without and with the mulch Changes in the order of
magnitude of CO2 fluxes with different mulch amounts and nature were particularly well reproduced
The first simulation results also indicated that over the range of mulch amounts considered much
better results were obtained by considering that the whole mulch layer is decomposing and not only
the lower part of it in better contact with the soil Finally introduction of a double component
denitrification potential defined as the sum of a constant soil contribution and a variable component
depending on residue decomposition rate and composition allowed to reproduce well the order of
magnitude and dynamics of N2O fluxes (Figure 1)
Figure 1 Observed and simulated dynamics of N2O emissions for the bare soil and two different mulches of 6 tonha (vetch and wheat)
Acknowledgements
This study was financed in part by Coordenaccedilatildeo de Aperfeiccediloamento de Pessoal de Niacutevel Superior - Brasil (CAPES)
ndash Finance Code 001
References
Dietrich G Recous S Pinheiro P-L Weiler D-A Schu A-L Rambo M-R-L Giacomini S-J 2019 ndash Gradient of decomposition in sugarcane mulches of various thicknesses Soil Tillage Res 192 66-75
Nicolardot B Recous S Mary B 2001 ndash Simulation of C and N mineralization during crop residue decomposition a simple dynamic model based on the CN ratio of the residues Plant and Soil 228(1) 83-103
Pinheiro P-L Recous S Dietrich G Weiler D-A Schu A-L Bazzo H-L-S Giacomini S-J 2019 ndash N2O emission increases with mulch mass in a fertilized sugarcane cropping system Biol Fert Soils 55 511-523
Schmatz R Recous S Weiler D Pilecco G Schu A Giovelli R Giacomini SJ How the mass and quality of wheat
and vetch mulches affect drivers of soil N2O emissions Submitted Geoderma 2019
48
Modelling short and long-term nitrogen and carbon budgets of agro-ecological
cropping systems with a dedicated STICS research version Beaudoin N1 Strullu L1 Autret B1 Yin X1 Chleacutebowski F1 Louarn G2 Ferchaud F1 Ripoche D3
Lecharpentier P3 Leacuteonard J 1 Mary B 1
1 INRA AgroImpact Site de Laon 180 rue Pierre-Gilles de Gennes 02000 Barenton-Bugny France 2 INRA UR P3F 86600 Lusignan France 3INRA US Agroclim Domaine Saint Paul Site Agroparc 84914 Avignon Cedex 9 France
nicolasbeaudoininrafr
Keywords cropping system conventional farming organic farming long-term perennial organs
Introduction
Coupled studies of carbon (C) nitrogen (N) and water cycles address several issues increasing carbon
storage in soils (integrating C and N stoichiometry constraints) reducing greenhouse gas (GHG)
emissions and ensuring aquifers refill despite increasing soil water deficits But the performances of
agro-ecological systems facing these issues must be evaluated Conducting assessments using a
deterministic model raises the question of its ability to predict N mineralizationimmobilization
turnover due to residues decomposition particularly dead roots materials
The STICS model has already been used to simulate multi-services catch crops (CC) long-term impacts
However the actual standard version (91) cannot simulate perennial species within rotations
including also annual crops while a dedicated research version of the model can do it It takes into
account the symmetry between C and N plant compartments including perennial reserves the daily
dynamics of the root system and its turnover (and associated C and N fluxes) as well as specificities of
perennial crops For this study we used a specific release of this research version (number 1610) but
it is still under development and will be merged in a future STICS standard version
This abstract describes the performances of this research version applied to four different cropping
systems at different time scales particularly with conventional (CONV) and organic (OF) cropping
systems The assumption made to extend STICS to organic farming was that its formalisms are still valid
if weeds pests and diseases are sufficiently well controlled (Autret et al in press)
Results and discussion
In an OF field context where alfalfa is partially used as green manure the prediction of the soil mineral
nitrogen (SMN) stock by continuous simulations without any calibration was successful (Figure 1) The
model could simulate the development and growth of alfalfa from seedling to destruction with a
unique corpus of formalisms and parameters (Strullu et al 2020)
The model was used to simulate long-term (1977-2015) datasets obtained with seven undisturbed
lysimeters monitored by INRA in CONV systems at Fagniegraveres (France) It predicted satisfactorily soil
organic nitrogen (SON) stocks after three soil parameters have been calibrated against two other
lysimeters (Figure 2) Crop yields exports and drained water quantities were also well predicted (Yin
et al 2020) Leaching was underestimated by 37 in cropped lysimeters but not in the bare fallow
lysimeter However the simulation of the nitrate leaching reduction allowed by CC was correct
49
Figure 1 Observed and simulated SMN (kg N haminus1 in 0-150 cm) during cropping and after alfalfa destruction in 3 OF fields at Villotran (red) La NeuvilleOudeuil (orange) and Rubempreacute (blue triangles) (Strullu et al 2020)
Figure 2 Observed and simulated evolution of SON stocks (0-25 cm) in Fagniegraveres lysimeters Treatments Bare soil with and without catch crop (CC) Vertical bars indicate the variability between three lysimeters (Yin et al 2020)
STICS was applied to two long-term experiments including OF DOK trial (Switzerland) 1977-2016 and
Foulum experiment (Denmark) 1997-2017 After calibration of two soil parameters using each CONV
treatment the model gave correct predictions of yields exportations and N surplus in OF treatments
(Autret et al 2019) SMN was underestimated by 41 but few data were available for testing The
observed decrease of SON was very well reproduced by the model This decrease was consistent with
the fact that the N surplus was negative or close to zero depending on the treatment (Figure 3)
In the three long-term trials (Fagniegraveres DOC Foulum) underestimation of either nitrate leaching
which is known to be linked with SMN or SMN itself was almost equal to simulated nitrogen stock in
deep dead roots The model does not simulate yet deep roots decaying below active biological layer
(usually below 30 cm) This lack is being a science front
This version has already been used in projects of 4permil SOC storage (INRA-DEP) and alfalfa production
(Variluz - CASDAR) It was also used in studies of leaching in the Seine basin OF systems co-design and
C storage with grasslands in respectively Gallois et al Beaudoin et al Cadeacutero et al (this conference)
Figure 3 Simulated N surplus and its components (SON variations and NO3 leaching losses or NH3 N2 or N2O emissions) on 4 treatments of each long-term trial of DOK (Thervil Switzerland left) and Organic (Foulum Denmark right) Autret et al (in press)
References
Autret B Mary B Strullu L Chlebowski F Maumlder P Olesen JO Beaudoin N (in press) Long-term trends in crop yield nitrogen losses and GHG balance of organic cropping systems STOTEN
Strullu L Beaudoin N Thieacutebeau P Julier B Mary B Ruget F Ripoche D L Rakotovololona L Louarn G (2020) Simulation using the STICS model of CampN dynamics in alfalfa from sowing to crop destruction EJA 112 125948
Yin X Beaudoin N Ferchaud F Mary B Strullu L Chleacutebowski F Clivot H Herre C Duval J Louarn G (2020) Long term modelling of soil N mineralization and N fate using STICS in a 34ndashyear crop rotation experiment Geoderma 357
50
STICS ability to simulate long-term soil organic matter dynamics in crop-grassland
rotations Cadero A1 F Ferchaud2 N Beaudoin2 F Chlebowski2 B Mary2 F Vertegraves3 Graux A-I1
1 PEGASE Agrocampus Ouest INRA 35590 Saint-Gilles France 2 AgroImpact INRA Site de Laon
02000 Barenton-Bugny France 3 SAS Agrocampus Ouest INRA 35000 Rennes France
Corresponding author anne-isabellegrauxinrafr
Keywords soil organic carbon grasslands long-term datasets France
Introduction
Grasslands ability to mitigate climate change by storing carbon in soils is well recognised but difficult
to quantify as it depends on many environmental and agronomical factors Modelling crop-grassland
rotations can help quantifying the evolution of soil organic carbon (SOC) for a diversity of soils
climates crops and managements but it requires that models are sufficiently robust and accurate in
their prediction of SOC This study aimed to assess the STICS model ability to simulate long-term SOC
dynamics in crop-grassland rotations It is part of the French CarSolEl project
Material and methods
STICS was tested against data from a 27-year experiment located at Kerbernez in western Brittany
(France) and including nine crop-grassland rotations Rotations A and B were silage maize monocrops
Rotations C D and E were silage maize-Italian ryegrass rotations with Italian ryegrass being established
respectively for 6 18 and 12 months between two-silage maize Rotations I and J were respectively
permanent and temporary perennial ryegrass grasslands established between two silage maize
Rotations Dd and Ed were only differing from respectively D and E by their rotation head Crops were
established on a 1m-depth loamy sand and slightly acidic soil differing somewhat between rotations
by the initial SOC stock (80-85 t C ha-1 in 0-25 cm) Rotation A received only mineral N fertiliser All
other rotations also received bovine then pig liquid manure Both Italian and perennial ryegrass were
only cut The experimental area was cut in half in 1992 We used a research version of the STICS model
(release 2485) able to simulate rotations including grasses and other perennial crops (Autret et al
2019 Strullu et al 2020) The model was run continuously from 1978 to 2004 Available observed data
were crop DM yields crop N contents SON and SOC stocks at different dates STICS was evaluated
using common indicators for validation of biophysical models A score was attributed to each
simulation unit using a method derived from Kersebaum et al (2015) and based on the information
source the number of repetitions and the observed factors that the model does not account for (eg
weeds) This first evaluation included a revised parametrisation of perennial ryegrass
Results and discussion
STICS well predicted the evolution of SOC stocks in rotation A (Figure 1 Table 1) However it
overpredicted final SOC for rotation B and silage maize-Italian ryegrass rotations This could be partly
due to an overestimation of the humified carbon from pig slurry inputs STICS prediction of SOC under
temporary (rotation J) and permanent (rotation I) grasslands was acceptable with final SOC conversely
slightly underpredicted Silage maize yields were globally overpredicted It is partly explained by the
fact that the model did not account for the observed detrimental effect of Solanum nigrum presence
on silage maize yields (results not shown) Model prediction agreement with observations of Italian
and perennial ryegrass yields was either good (rotations D and Dd) fair or poor (other rotations)
51
(results not shown) STICS prediction of the N content in silage maize and harvested grass was
respectively good and from fair to poor (results not shown)
Figure 1 Comparison of simulated (blue lines) and observed (points) SOC dynamics over 27 years at Kerbernez
site for nine crop-grassland rotations
Table 1 Evaluation statistics (root mean square error (RMSE) relative RMSE (RRMSE) part of systematic error
(pRMSEs) Nash-Sutcliffe model efficiency (EF) and Willmott index (d)) of STICS performance of predicted SOC
Rotation RMSE (kg C ha-1) RRMSE () pRMSEs EF d
A 2147 32 075 092 098 B 6598 85 094 -069 079 C 7423 92 089 -282 065 D 2076 27 030 036 087
Dd 3255 41 085 -064 081 E 5401 67 050 -316 063
Ed 4286 55 069 -304 068 I 5074 65 079 -456 025 J 4783 61 065 -280 018
Conclusions and perspectives
Further investigations are required to confirm these first results STICS ability to simulate SOC dynamics
in crop-grassland rotations will be assessed against data from two other long-term experimental sites
of the INRA SOERE ACBB If required a calibration of the sensitive grassland root and shoot parameters
will be done to improve the model prediction of SOC together with other soil and plant variables
Scoring each simulation unit will help selecting data to be used for model calibration and evaluation
The performances of STICS will also be compared with those of four other models
References
Autret B Mary B Strullu L Chlebowski F Maumlder P Mayer J Olesen J E Beaudoin N 2019 - Long-term modelling of crop
yield nitrogen losses and GHG balance in organic cropping systems Science of the Total Environment 134597
Kersebaum KC Boote KJ Jorgenson JS Nendel C Bindi M Fruumlhauf C Gaiser T Hoogenboom G Kollas C Olesen JE
Roumltter RP Ruget F Thorburn PJ Trnka M Wegehenkel M 2015 - Analysis and classification of data sets for
calibration and validation of agro-ecosystem models Environmental Modelling amp Software 72 402-417
Strullu L Beaudoin N Thieacutebeau P Julier B Mary B Ruget F Ripoche D Rakotovololona L Louarn G 2020 - Simulation
using the STICS model of CampN dynamics in alfalfa from sowing to crop destruction European Journal of Agronomy
112 125-948
52
Simulation of switchgrass biomass production in Eastern Canada with the STICS
model Guillaume Jeacutego1Reneacute Morissette1 Fabien Ferchaud2
1 Agriculture and Agri-Food Canada Quebec ON Canada 2 INRA UR 1158 AgroImpact Site de Laon 02000 Barenton-Bugny France
Switchgrass (Panicum virgatum L) is a herbaceous perennial grass that is native to the semiarid prairies
of central North America In Canada switchgrass is at the northern limit of its range Cold winter
temperatures in combination with a short growing season are not favourable for the northward
expansion of this crop (Delaquis 2013) In these conditions the establishment of this crop remains a
challenge because it competes very poorly against weeds and takes at least 2 years to reach its full
potential Once well established switchgrass can produce a large amount of biomass (10 t DM haminus1)
and remain productive for more than 10 years (Martel and Perron 2008) under Eastern Canadian agro-
climatic conditions However according to Delaquis (2013) it is planted on only 1500 ha of cropland
in Eastern Canada mostly in Ontario and Quebec In order to expand this area without competing with
other crops its plantation on marginal lands with low soil quality is being considered
The objective of this study is to evaluate the yield potential of switchgrass in southern Quebec using
the STICS crop model First the model performance in predicting above-ground biomass was evaluated
using field data and then the model was used to evaluate the yield potential of switchgrass on low
quality soils (low thickness low organic matter content andor high stone content)
Material and Methods
Three data sets were collected near Sherbrooke in Southern Quebec Canada (45deg 24prime N 71deg 54prime W)
The same cultivar (Cave-In-Rock) was used for the three experiments (table 1)
Table 1 Experimental setup used to evaluate the model performance
Experiment Year of plantation
Years of measurements
Soil type Soil organic matter
content ()
Number of measurements
Above-ground biomass
Leaf area index
1 2009 2015 2016 2017 2018
Loam 38 18 18
2 2009 2018 Silty Loam 48 4 4
3 2017 2018 Silty Loam 48 4 4
In all experiments 60 kg ha-1 of mineral nitrogen (N) were applied in spring before the beginning of
plant growth Weather data (temperature precipitation solar radiation wind speed and air moisture)
were collected by a weather station close to the experimental sites (lt 5km) Soil properties were
estimated using the Canadian soil database STICS was run continuously from the year of plantation to
2018 The crop growth parameters defined by Drochon et al (2017) were used to run a research
version of STICS (including new formalisms to simulate perennial crops) Only one parameter (durvief
= 150) was calibrated by minimizing the difference between predicted and measured Leaf Area Index
(LAI) of experiment 1 in 2015 The normalized root mean square error (NRMSE) normalized mean error
(NME) and model efficiency (EF) were used to evaluate the model performance
53
After the model performance evaluation four sets of simulations were run with altered soil properties
The soil properties of experiments 1 and 2 were altered as follow a) reduced soil depth (05 m instead
of 1 m) b) reduced soil organic matter (OM) content (19 and 24 instead of 38 and 48 for soils 1
and 2 respectively) c) high stone content (15 instead of 0) and d) combination of these three
factors Simulations for these altered soils were run using the same crop management and climate
data (2009-2018) as those used to evaluate model performance Variations in annual yield predictions
were calculated by comparing the yields of these simulations with altered soil properties to the yield
of the reference simulation with actual soil properties measured in experiments 1 and 2
Results
Overall the STICS model performance in simulating the above-ground biomass (AGB) and LAI of
switchgrass in Southern Quebec was good with NRMSE of 25 and 21 and EF of 065 and 087 for ABG
and LAI respectively Bias was also small with NME of +11 and -8 for AGB and LAI respectively Model
predictions tend to slightly overestimate biomass during spring and summer but the harvested
biomass in fall (116 t DM ha-1 on average) was generally very well predicted with a NRMSE of 13 and
a NME of 5 These good performances allow us to run the simulations with altered soil properties
The largest simulated yield decrease ( -12 on average) occurred when the soil depth was reduced by
half The decrease of soil OM content and increase of stone content had less impact on average yield
with reductions of 8 and 4 respectively As expected the combination of these three factors (reduced
soil depth and OM content and increased stone content) had more impact on average yield with a
decrease of 26 This yield decrease with altered soil properties was also generally associated with
greater inter-annual yield variability Despite these yield reductions the average annual yield of
switchgrass remained close to the average yield reported in this region (10 t DM ha-1) with average
annual yield ranging from 91 to 112 t DM ha-1 when one soil property is altered and close to 86 t DM
ha-1 when the three factors are combined
These simulation results suggest that switchgrass production on marginal lands with poor soil quality
in Southern Quebec is possible without decreasing too largely the yield potential Experimental data
of switchgrass cropped on marginal lands are currently being collected and will be used to verify the
model performance in predicting potential yield under these conditions
References
Delaquis E (2013) Genetic and environmental factors affecting switchgrass performance and quality
in Quebec MSc thesis Department of Plant Science McGill University MacDonald Campus
Sainte-Anne-de-Bellevue QC Canada 104 pp
Drochon S Strullu L Zapater M Mary B Ferchaud F (2017) Parameacutetrage de la version de recherche
plantes peacuterennes du modegravele STICS pour une culture eacutenergeacutetique peacuterenne le switchgrass
(Panicum virgatum) In XIegrave seacuteminaire des utilisateurs de STICS p 80-81 La Rochelle France
Martel H and Perron M-H 2008 Compilation des essais de panic eacuterigeacute reacutealiseacutes au Queacutebec
Publication EVC 026 Centre de reacutefeacuterence en agriculture et agroalimentaire du Queacutebec Quebec
City QC Canada 195 pp
54
Modelling the impact of soil and climatic variability on sugarcane growth response
to mineral and organic fertilisers
55
Impact of corn root growth parameters on soil moisture evapotranspiration and
crop growth in STICS model Sameh Saadi1 Elizabeth Pattey1 Guillaume Jeacutego 2 and Catherine Champagne1
1 Ottawa Research and Development Centre Agriculture and Agri-Food Canada 960 Carling Avenue Ottawa ON K1A 0C6 Canada 2 Quebec Research and Development Centre Agriculture and Agri-Food Canada 2560 Hochelaga Boulevard Quebec City QC G1V 2J3 Canada
Keywords Zea mays L eastern Canada LAI biomass rainfall shortage
Introduction
Most of the grain corn production (Zea mays L) in Canada is located in the Mixedwood Plains ecozone extending between Windsor (ON) and Quebec city (QC) The STICS crop model (Brisson et al 1998) was adapted for corn grown in eastern Canada (Jeacutego et al 2011) and its performance using earth observation (EO) derived leaf area index (LAI) assimilated to reinitialize management practices and soil moisture at field capacity was evaluated over a small region (Jeacutego et al 2015) STICS was also used to refine nitrogen application rate recommendations over the ecozone (Mesbah et al2017) Previous studies (eg Jeacutego et al 2017) showed that accurate simulation of water balance in particular soil moisture and evapotranspiration was critical for accurate simulation of environmental outputs in eastern Canada Our project aims at improving soil moisture initialization for the regional use of STICS using EO derived descriptors The first step consists in revisiting the adjustment of root and soil parameters to improve soil moisture profile and evapotranspiration predictions during water stress periods and explore how to handle the extreme precipitation anomalies during the growing season as was observed in 2017
Methodology
Soil moisture profiles were measured using time domain reflectometry evapotranspiration (ET) measured using an eddy covariance flux tower and destructive sampling of LAI and shoot biomass of a corn crop planted in a 27-ha experimental field near Ottawa Canada(45o 18rsquo N 75o 45rsquo W) were acquired over two years with contrasting weather conditions in 2017 and 2018 The growing season of 2017 was exceptionally wet with 1223 mm cumulative precipitation and 2802 Crop Heat Units (CHU) from April to November Whereas an intense drought period occurred in 2018 during a critical corn development stage with only 783 mm cumulative precipitation and 2133 CHU from April to November Actual management practices of the experimental field were implemented in the simulations of both years Corn was planted on 30 May 2017 and on 14 May 2018 at a plant density of 8 plants m-2 Soil moisture at field capacity and wilting point were derived from pedotransfer functions (Saxton et al 1986) using soil texture Soil organic N content was set at 015 and the cumulative soil evaporation above which evaporation rate is decreased q0 was set at 3 mm We used the corn cultivar adapted for the northern part of the ecozone (Jeacutego et al 2011) Since a large proportion of fields in eastern Canada including this experimental field are tile drained and because previous studies showed that soil moisture rarely exceeds field capacity the macroporosity was not activated in these simulations Fig1 summarizes the impact of parameter adjustments in the STICS model for 2018
Results and discussion
Predicted and measured ET in the 2018 growing season (Fig1a) were in good agreement except over the drought period This issue was observed in past growing seasons when water shortages occurred (data not shown) Evaporation was well predicted after the crop harvest however in the spring predictions were overestimated Soil moisture was relatively well predicted for the different soil layers in 2018 (Figure 1c) However from late July until harvest the dry-down estimates of the upper top soil layers were too close to field capacity following rainfalls The default parameter values tended to overestimate the LAI and biomass predictions in 2018 (Fig1e and 1f) To ameliorate this some root
56
growth parameters were adjusted i) decrease the maximum rate of root length production per plant to better simulate the impact of water stress on the crop development in 2018 and ii) increase root density in upper soil layers compared to subsoil root density to better simulate soil drying periods The overall results of predicted ET in 2018 were improved and RMSE decreased from 104 to 083 while the overestimation of spring evaporation remained (Fig1b) The new set of parameter values allowed the model to better predict the soil moisture dry-down following a rainfall The moisture in
Fig 1 Impact of STICS parameters adjustment on aampb) evapotranspiration campd) soil moisture e) LAI and f) shoot biomass in 2018 growing season
the upper soil layers remained close to field capacity (Fig1d) Predicted LAI were improved in 2018 (Fig1e) with RMSE decreasing from 084 to 050 As the predicted biomass is closely related to the LAI the shoot dry biomass prediction over time (Fig1f) showed a better fit although the maximum biomass predicted was still overestimated Using the new set of parameter values in 2017 increased the discrepancies between measured and predicted soil moisture (results not shown) compared to the default values The observed soil moisture was close to saturation due to the frequent rainfalls This trend could not be predicted by the model since soil macroporosity was deactivated Therefore activating the macroporosity should be considered during exceptionally wet seasons to account for soil moisture above field capacity
References
Brisson N Mary B Ripoche D Jeuffroy MH Ruget F Gate P Devienne-Barret F Antonioletti R Durr C Nicoullaud B Richard G Beaudoin N Recous S Tayot X Plenet D Cellier P Machet JM Meynard JM et Deleacutecolle R 1998 - STICS a generic model for the simulation of crops and their water and nitrogen balance I Theory and parametrization applied to wheat and corn Agronomie 18 311-346
Jeacutego G Pattey E Chantigny M Leacuteonard J 2017 Simulation of N2O emissions in cold humid continental climate Seacuteminaire
STICS 2017 17-19 October 2017 La Rochelle France
Jeacutego G Pattey E Bourgeois G Tremblay N and Drury CF 2011 - Evaluation of the STICS crop growth model with corn cultivar parameters calibrated for Eastern Canada Agronomy for Sustainable Development 31(3) pp 557-570
Jeacutego G Pattey E Mesbah M Liu J Duchesne I 2015 Impact of the spatial resolution of climatic data and soil physical
properties on regional corn yield predictions using the STICS crop model Int J Appl Earth Obs Geoinf 41 11-22
Mesbah M Pattey E Jeacutego G 2017 - A model-based methodology to derive optimum nitrogen rates for rainfed crops ndash a case study for corn using STICS in Canada Computers and Electronics in Agriculture 142 572-584
Saxton K E Rawls W Romberger J S amp Papendick R I 1986 - Estimating generalized soil-water characteristics from texture 1 Soil Science Society of America Journal 50(4) 1031-1036
57
Impacts of observed and projected climatic constraints on rainfed wheat yield
under a typical Mediterranean condition Yang Chenyao1 Fraga Helder1 Ieperen Wim van2 Trindade Henrique1 Santos Joatildeo A1
1Universidade de Traacutes-os-Montes e Alto Douro (UTAD) Centre for the Research and Technology of Agro-environmental and Biological
Sciences (CITAB) 5000-801 Vila Real Portugal
2Wageningen University amp Research (WUR) Horticulture and Product Physiology (HPP) 6700 AA Wageningen Netherlands
E-mail cyangutadpt
Introduction
Under Mediterranean climates rainfed wheat grain yield is often constrained by late season
occurrence of enhanced water deficits and high temperature events that is primarily overlapped with
the anthesis and grain filling periods (Asseng et al 2011 Moriondo et al 2011) This vulnerable aspect
is expected to be exacerbated with projected warming and drying trend for Mediterranean basin
(Mariotti et al 2015) Our aims are to evaluate the yield impacts of these climatic constraints in the
past in a typical Mediterranean region and their likely variations under projected climates as well as
how adaptations could help mitigate these impacts
Materials and Methods
The study was performed for the Alentejo region in southern Portugal over baseline (1986ndash2015)
future short- (2021ndash2050) and long-term (2051ndash2080) periods STICS model was chosen to simulate
wheat crop growth and yield formation which was successfully calibrated using 5-year field data at
one representative site (Beja) The model was further operated at regional scale by coupling with high-
resolution climate and soil datasets and running with common practices at a harmonized resolution
(~125 km) Calibrated STICS proved to be able to well reproduce baseline regional yield statistics and
measured potential yields at experiment stations In future periods simulations were only conducted
at Beja where climate projections under RCP45 and RCP85 were retrieved from 10-member bias-
adjusted regional climate model ensemble from EURO-CORDEX (Jacob et al 2014) Tested adaptation
options are sowing date adjustment using early-flowering cultivars and supplemental irrigation during
sensitive period
Results and Discussion
As an illustrative example the mean climatic water deficit and high-temperature events during three
wheat growing periods over baseline are shown at Beja which are clearly more pronounced in the last
phase (April-June) (Fig 1a) In baseline terminal water stress appears to be the main limiting factor
for the potentially attainable yield causing 40ndash70 yield gaps between actual and potential yield
across the region In future periods projected enhancement of water deficits and more frequent hot
days in AprilndashJune (Fig 1b) are likely to considerably reduce actual yields (Fig 1c) Early flowering
cultivars help advance the anthesis onset and grain filling which reduce the risks of exposure to the
terminal drought amp heat stresses whereas early sowing benefits can be inhibited with slowed
vernalization fulfilment (Yang et al 2019)
58
Figure 1 An illustrative example of observed and projected climatic constraints during wheat growing season at one representative site (Beja) of Alentejo region in southern Portugal (a) Mean and standard deviation (error bar) of cumulative climatic water deficit (precipitation minus potential evapotranspiration mm) and of hot days (daily maximum temperature above 30degC) during three wheat growing periods over baseline along with their (b) projected range of mean changes during short- (2021ndash2050) and long-term (2051ndash2080) future periods under RCP45 and 85 among 10 bias-adjusted regional climate model projections (c) Projected likely range of variations () during 2021ndash2050 and 2051ndash2080 relative to the simulated median baseline (1986ndash2015) yield
Conclusions
The detrimental effects of climatic water deficits and hot days occurring during wheat grain filling can
represent the major cause of gaps between actual and potential yield in Alentejo region which are
likely to be widened under future climate Combination of using early-flowering cultivars with no or
less vernalization requirement and supplemental irrigation can help reduce the yield gaps being a
promising adaptation strategy for rainfed wheat cropping system under Mediterranean climate
Acknowledgments
This study was supported by the Clim4Vitis project-ldquoClimate change impact mitigation for European viticulture knowledge transfer for an
integrated approachrdquo funded by European Unionrsquos Horizon 2020 Research and Innovation Programme under grant agreement nordm 810176
This work was also supported by National Funds by FCT-Portuguese Foundation for Science and Technology under the project
UIDAGR040332019
References
Stocker T Qin D Plattner G-K Alexander L Allen S Bindoff N et al Technical summary Climate Change 2013 The Physical Science Basis Contribution of Working Group I to the Fifth Assessment Report of the Intergovernmental Panel on Climate Change Cambridge Cambridge University Press 2013 p 33ndash115
Asseng S Foster I and Turner NC 2011 The impact of temperature variability on wheat yields Global Change Biol 17(2) 997-1012
Jacob D et al 2014 EURO-CORDEX new high-resolution climate change projections for European impact research Regional Environmental Change 14(2) 563-578
Mariotti A Pan Y Zeng N and Alessandri A 2015 Long-term climate change in the Mediterranean region in the midst of decadal variability Clim Dynam 44(5) 1437-1456
Moriondo M Giannakopoulos C and Bindi M 2011 Climate change impact assessment the role of climate extremes in crop yield simulation Climatic Change 104(3) 679-701
Yang C Fraga H van Ieperen W Trindade H and Santos JA 2019 Effects of climate change and adaptation options on winter wheat yield under rainfed Mediterranean conditions in southern Portugal Climatic Change 154(1) 159-178
59
Session 6 Regional and large scale simulations using STICS
Estimate demand for irrigation water and nitrogen fertilizers in Europe at different
scales Ines Chiadmi1 Pierre Humblot1 Pierre-Alain Jayet1
1 UMR INRA-Agro Paris Tech Economie Publique Grignon France
Keywords yield function irrigation water nitrogen fertilizers climate change agro-economic model
European Union
Introduction
The demand for prospective analysis of agricultural activities and their impacts in terms of
environmental externalities brings to light the need for quantitative models enabling them to be
evaluated in contexts that have not yet been observed Estimating what the environmental impacts of
demand for inputs could be in a context of global change affecting this same demand is the example
of the analysis of feedbacks that we are called upon to process An illustration of the problem is given
by the effects of climate change on agriculture and the greenhouse gas emissions to which it
contributes and which play a large part in climate change In addition to climate change there is also
the economic regulation of nitrogen pollution which could affect agricultural activity just as
significantly Finally the modification of the precipitation regime and the economic pressure on the
water available for irrigation are likely to affect even more an agricultural system at the heart of
complex relationships with its environment We propose to show our contribution in the modeling of
these processes from an economic perspective
The key data problem and the choice of models
More often than with regard to physical data the elements available in economic databases are
insufficiently present for the study of environmental impacts in relation to agricultural activities This
is particularly the case for consumed inputs which escape the market for example with regard to part
of the irrigation water This is also the case for nitrogen fertilizers for which we observe the
consumption in value of synthetic fertilizers but whose distribution by crop or chemical composition
is poorly known The observation is both biased by the lack of information on quantities and even more
so on prices Another major obstacle is the difficulty of accessing data when it exists as is the case with
the Farm Accounting Information Network (FADN) The use of bioeconomic models helps to overcome
this problem
The coupling of an economic model of agricultural supply with a crop model (in this case AROPAj and
STICS respectively) makes it possible to deal with the problem of the choice of activities at the
decisional level which is that of the agricultural holding while the crop model allows the economic
model to deal more realistically and in the absence of economic data the problem of decision at the
plot scale The heart of the association of models is based on the selection of crop yield functions The
method initiated for the nitrogen input by Godard et al 2008 and completed by Leclerc et al 2013
has been extended to irrigation water by Humblot et al 2017 It has been refined in the context of a
study carried out on behalf of the JRC-Seville in 2019 Finally combined with a spatial econometric
model the AROPAj-STICS coupling makes it possible to assess the spatial distribution of agricultural
production consumption of inputs and pollution associated (Jayet et al 2018)
Spatial distribution of input demand
60
The STICS model is used to produce yield functions for 9 crops (durum wheat soft wheat
barley corn rapeseed sunflower soybean potato sugar beet) and for all farms representative
of the 130 regions of the European Union and represented in AROPAj The economic data are
the yields and prices estimated from the European FADN (2008-2012)
A first simulation carried out for 2012 with AROPAj is used to illustrate the demand for
filtered irrigation water by estimating a variable irrigation load from the FADN (fig 1) A
second simulation is carried out without filtering the water demand so that one can estimate
what would be a demand for irrigation water if the irrigation system existed (fig 2) The color
scheme used in the two figures corresponds to different value ranges (m3 ha) It should be
emphasized that these estimates relate to hectares of UAA AROPAj given that the model
represents part of the total agricultural UAA
Fig 1 Demand for irrigation on FADN-2012 basis Fig 2 Demand for potential irrigation (2012)
References
Godard C Roger-Estrade J Jayet P A Brisson N amp Le Bas C (2008) Use of available information
at a European level to construct crop nitrogen response curves for the regions of the EU
Agricultural Systems 97(1ndash2) 68ndash82 httpsdoiorg101016jagsy200712002
Humblot P Jayet P-A amp Petsakos A (2017) Farm-level bio-economic modeling of water and
nitrogen use Calibrating yield response functions with limited data Agricultural Systems 151
47ndash60 httpsdoiorg101016jagsy201611006
Jayet PA Barberis D Humblot P Lungarska A (2018) Spatialisation de la demande en eau agricole
en France par lrsquointeacutegration de lrsquoeau drsquoirrigation dans un modegravele bioeacuteconomique Revue
Internationale de Geacuteomatique 28(4)485-503 doi 103166rig201800064
Leclegravere D Jayet P-A amp de Noblet-Ducoudreacute N (2013) Farm-level Autonomous Adaptation of
European Agricultural Supply to Climate Change Ecological Economics 87 1ndash14
httpsdoiorg101016jecolecon201211010
61
Regional-scale coupled modelling of water pollution by nitrate from agricultural
sources the Seine-Normandy hydrosystem case study
Nicolas Gallois1 Pascal Viennot1 Thomas Puech2 Nicolas Beaudoin3 Paul Passy4 Florent Chlebowski3 Christine Le Bas5 Bruno Mary3 Gilles Billen6 Josette Garnier6 Marie Silvestre4 Vincent Thieu6
1 MINES ParisTech PSL Universiteacute Centre de Geacuteosciences ARMINES 35 rue Saint-Honoreacute F-77305 Fontainebleau France 2 INRA SAD Uniteacute Aster 662 avenue Louis Buffet F-88500 Mirecourt France 3 INRA UR 1158 Agro-Impact site de Laon Pocircle du Griffon F-02000 Barenton-Bugny France 4 FIRE CNRS UMR 7619 METIS 4 place Jussieu F-75005 Paris France 5 INRA-US Infosol 2163 avenue de la Pomme de Pin F-45075 Orleacuteans France 6 Sorbonne Universiteacute UMR 7619 METIS 4 place Jussieu F-75005 Paris France
Agricultural lands represent nearly 70 of the surface area of the Seine-Normandy basin The
multiplicity and diffuse nature of the hydro-physico-chemical processes involved in the transfer of
agricultural-source nitrogen (N) make the characterization of their impacts on the quality of the basin
water resources a challenging and complex issue In this context an original interdisciplinary modelling
platform has been developed (Gallois and Viennot 2018)
Material and method
The platform deals with the main processes affecting water quality along the aquatic continuum by
linking the STICS MODCOU and RIVERSTRAHLER models (Ledoux et al 1984 Billen et al 1994 Brisson
et al 2009)
Figure 1 Diagram of the integrated modelling platform of the Seine-Normandy basin Water flows in blue N flows in red
Over the simulated domain (100000 km2 approximately) model interactions (cf Figure 1) are set in
order to
Generate water and N flows below the sub-root zone using the STICS v10 code STICS inputs
resulted from the spatio-temporal evolutions of agricultural practices describing over 4500 cropping
systems since 1970 (ARSEINE v343 database INRA Aster) (Puech et al 2018) as well as climate data
62
(SAFRAN Meacuteteacuteo-France) and soils characteristics (BDGSF INRA InfoSol) A dedicated software allowed
their integration and the STICS distribution over the territory (Gallois and Viennot 2018)
Synchronously model nitrate and water flows transiting through sub-surface unsaturated and
saturated compartments of the regional hydrosystem using the MODCOU hydrogeological model
Model N transfer and transformations across the 36 000 km-long river system via the
RIVERSTRAHLER model computing geographical distributions of N-concentrations in the network
Results and implementation
The platforms ability to reproduce the agro-hydrosystem behavior was assessed at three levels
Indirect validation of STICS water drainage and N-leaching flows The development of a
Quality Assurance Protocol (QAP) (Beaudoin et al 2018) combining sensitivity analysis and agronomic
expertise of STICS inputs and outputs allowed to evaluate the reliability and consistency of STICS
simulations at the macro-regional scale
Direct validation on nitrate concentration rates in aquifer system The aquiferous nitrate
content was predicted with a maximum absolute bias less than 10 mgNO3 L-1 at 580 control points (cf
Figure 2)
Direct validation of nitrogen supply dynamics in the river system Simulated river
concentrations were compared with available observations at the gauging station scale (cf Figures 2a
2b 2c)
Figure 2 Average biases (1995-2016) between simulated aquiferous nitrate concentrations and measured data at the scale
of instrumented boreholes Three examples of synchronous time evolutions between observed and simulated concentrations
in rivers (2010-2016 mgN-NO3 L-1) at stations located at the (a) Seine (b) Oise and (c) Orne river outlets are also displayed
Relying on these performances the platform allowed a complete assessment of N-related transfer and
transformation processes along the soil-hydrosystem continuum over 50 years (Passy et al 2018) It
also permitted to study the sensitivity of groundwater to two contrasting foresight agriculture
scenarios over 2017-2050 period (conventional and agro-ecological - Puech et al 2018)
Bibliographical references
63
Beaudoin N et al (2018) laquo Evaluation of a spatialized agronomic model in predicting yield and N leaching at the scale of the Seine-Normandie basin raquo Environmental Science and Pollution Research
25 p 23529‑23558 doi 101007s11356-016-7478-3
Billen G Garnier J et Hanset P (1994) laquo Modelling phytoplankton development in whole drainage
networks The Riverstrahler model applied to the Seine river system raquo Hydrobiologia 289 p 119‑
137
Brisson N et al (2009) Conceptual basis formalisations and parametrization of the STICS crop model Eacutediteacute par Quae Update Sciences and Technologies
Gallois N et Viennot P (2018) Modeacutelisation de la pollution diffuse drsquoorigine agricole des grands aquifegraveres du bassin Seine-Normandie Actualisation des modeacutelisations coupleacutees STICS-MODCOU ndash Modeacutelisation de sceacutenarios agricoles sous changement climatique ARMINES technical report 268p
Ledoux E Girard G et Villeneuve J P (1984) laquo Proposition drsquoun modegravele coupleacute pour la simulation conjointe des eacutecoulements de surface et des eacutecoulements souterrains sur un bassin hydrologique raquo
La Houille Blanche p 101‑110
Puech T Schott C et Mignolet C (2018) Evolution des bases de donneacutees pour caracteacuteriser les dynamiques des systegravemes de culture sur le bassin Seine-Normandie INRA technical report 219p
64
Simulating innovative cropping systems aiming at producing biomass while
reducing greenhouse gas emissions in the Hauts-de-France region Ferchaud Fabien1 Drochon Simon1 Chlebowski Florent1 Gourdet Claire2 Boissy Joachim2 Leclegravere
Margot3 Loyce Chantal3 and Strullu Loiumlc4
1 INRAE UR 1158 AgroImpact Site de Laon 02000 Barenton-Bugny France 2 Agro-Transfert Ressources et Territoires 2 chausseacutee Brunehaut 80200 Estreacutees-Mons France 3 UMR Agronomie INRAE AgroParisTech Universiteacute Paris-Saclay 78850 Thiverval-Grignon France 4 ASAE 2 Esplanade Roland Garros ndash BP 235 51686 Reims Cedex France
Keywords cropping systems biomass production evaluation GHG balance
Introduction
Biorefineries which use renewable biological resources for the production of bio-based products and
biofuels are a cornerstone of the bioeconomy However creating a biorefinery in a territory requires
increasing local biomass production without affecting too much food production and with limited
environmental impacts It raises the need for developing innovating cropping systems able to fulfill
these criteria We aimed at evaluating ex ante these cropping systems using the STICS model
Material and methods
The geographical context of this work was the Hauts-de-France region and more precisely the area (50
km radius) around Venette (Oise) We focused on two soil types a deep loamy (DL) soil representing
the most widely spread soil type in the study area and a sandy loam (SL) representing soil types with
lower potential agricultural production Soil characteristics were obtained using local references
First reference cropping systems representative of the region were defined using agricultural surveys
and local expert knowledge 6 for DL and 5 for SL These cropping systems were two to five year annual
crop rotations including grain cereals (wheat barley maize) sugar beet rapeseed spring pea potato
and mustard as a catch crop (CC) In a second step innovative cropping systems were designed during
dedicated workshops involving researchers and local experts The following target was assigned to
these cropping systems reducing greenhouse gases (GHG) emissions by 50 increasing total biomass
production by 5 and decreasing food production by no more than 20 One cropping system was
designed for the deep loamy soil combining two cropping systems within a same plot (1) a ten-year
In addition to energy production the development of anaerobic digestion in a territory can have many
indirect effects The characteristics of the exogenous organic matters (EOM) spread on soils are
changed after anaerobic digestion (Moumlller amp Muumlller 2012) More generally the development of
anaerobic digestion may affect the supply of available EOMs and even the cropping systems
mobilisation of crop residues that only return to the soil after digestion modification of crop
successions to introduce cover crops for energy supply (CCESs) in substitution for catch crops etc
Depending on the chosen anaerobic digestion scenarios these indirect effects will lead to changes in
the carbon storage and nitrogen dynamics (Askri 2015 Nicholson et al 2017)
The objectives of the study were to simulate the consequences of anaerobic digestion development
on carbon (C) and nitrogen (N) flows at the plot scale The case study was the Versailles plain a territory
with very little livestock and mainly field crops This territory has been previously characterized soil
types crop successions EOM used climate The considered initial soil organic carbon content was low
(no past application of EOM considered)
The consequences of anaerobic digestion development on C and N flows at the plot scale were
simulated with the STICS crop model (Brisson et al 2009) with a focus on (i) organic C stocks in soils
(ii) N uptake by plants (iii) leached N fluxes (iv) N fluxes volatilized as NH3 or emitted as N2O The STICS
model was coupled with a model for predicting the characteristics of digestates developed as part of
the MethaPolSol project (Bareha 2018) Thus the characteristics of the digestate spread were
produced from a mixture of animal manures and CCESs In addition the decomposition submodule for
exogenous organic matter in STICS has been modified by subdividing the organic residue initially only
describe with one decomposable pool (Nicolardot et al 2001) into two fractions a fast decomposable
fraction and a slow decomposable fraction that is directly incorporated into soil humus (Levavasseur
et al subm)
Four series of simulations were carried out (1) crop successions with mineral fertilization (2) crop
successions with the EOMs actually used (3) crop successions with substitution of fertilizers by
digestates of bio-waste or livestock effluents (4) crop successions with implantation of CCESs where
possible and substitution of fertilizers by digestates mixing livestock effluents and CCESs The scenarios
were simulated over 30 years with the following criteria limitation to 170 kg Nha provided with EOMs
per crop mineral N supplementation to achieve constant yields and decrease in the mineral N dose as
soil nitrogen supply increases with the increase of organic matter stocks in soils All scenarios were
constructed to simulate yields similar to those obtained with mineral fertilizers
The simulation results showed that soil C stocks were stable for successions receiving only mineral
fertilizers (scenario 1) they increased in all scenarios receiving EOMs (current or digested scenarios 2
67
to 4) with intensities depending on the humic potential of EOMs used and the quantities supplied The
introduction of CCESs in the digestate scenario (4) increased C storage thanks to a higher return of root
and digestate C EOM use increased the substitution of mineral fertilizers over time due to the mineral
N contents of EOMs particularly in the digestates and the increase in organic matter stocks in soils
that generated increasing mineralized N flows The CCESs tended to reduce these savings Because of
this increasing mineralized N flows and the limited N uptake in summer and autumn in the simulated
crop successions (especially with wheat) N losses from leaching and N2O emissions increased over
time in all scenarios receiving EOMs (2 to 4) By acting as catch crops CCESs significantly reduced N
leaching (scenario 4) Ammonia volatilization was one of the main causes of N losses from crop systems
fertilized with digestates (up to 20 of ammonia N input scenarios 3 and 4)
A plot-based greenhouse gas balance including C storage direct and indirect N2O emissions and
emissions from fertilizer manufacturing completed this work
References
Askri A (2015) Methanization digestates valorization in agriculture impacts on carbon and nitrogen biogeochemical cycles Retrieved from httpsinisiaeaorgsearchsearchaspxorig_q=RN49053137
Bareha Y (2018) Modeacutelisation des processus de transformation de lrsquoazote en digestion anaeacuterobie application agrave lrsquooptimisation de la valorisation des digestats Retrieved from httpstelarchives-ouvertesfrtel-02115249
Brisson N Launay M Mary B amp Beaudoin N (2009) Conceptual basis formalisations and parametrization of the STICS crop model (Quae Ed) Versailles
Levavasseur F Mary B Houot S subm b Simulation of the C and N dynamics in a long-term experiment with organic amendments amendment application using the STICS model Submitted in Computers and Electronics in Agriculture
Moumlller K amp Muumlller T (2012 June) Effects of anaerobic digestion on digestate nutrient availability and crop growth A review Engineering in Life Sciences Vol 12 pp 242ndash257 httpsdoiorg101002elsc201100085
Nicholson F Bhogal A Cardenas L Chadwick D Misselbrook T Rollett A hellip Williams J (2017) Nitrogen losses to the environment following food-based digestate and compost applications to agricultural land Environmental Pollution 228 504ndash516 httpsdoiorg101016JENVPOL201705023
Nicolardot B Recous S Mary B 2001 Simulation of C and N mineralisation during crop residue decomposition A simple dynamic model based on the CN ratio of the residues Plant Soil 228 83ndash103
68
Session 7 Scenario simulations using STICS
To maximize multiple ecosystem services without dis-service for water the
management of cover crops has to be climate and soil specific A simulation
approach using STICS model
Nicolas Meyera Jacques-Eric Bergeza Julie Constantina Eric Justes ab a INRA UMR AGIR Universiteacute de Toulouse INRA INPT INP-EI PURPAN Castanet-Tolosan France E-mail nicolasmeyerinrafr b CIRAD PERSYT Department 34980 Montpellier France
Keywords STICS model simulation study cover crop management next cash crop water nitrogen
Introduction Cover crops provide multiple ecosystem services such as reducing nitrate leaching producing ldquogreen manurerdquo effect improving soil physical properties increasing carbon storage in the soil and controlling pests diseases and weeds (Justes et al 2017) Cover crops increase evapotranspiration by increasing cover transpiration and decrease soil evaporation and then they reduce water drainage in temperate climates (Meyer et al 2019) However the equilibrium of these processes and ecosystem services provided depends on cover crop management climate and soil type No consensus exists on the impact of cover crops on soil water availability for the next cash crop Dynamic soil-crop models can be a powerful tool to estimate water fluxes that are difficult to measure in field experiments such as drainage evaporation and transpiration They can also be used over long climatic series for evaluating their variability versus weather and a wide range of management practices (Bergez et al 2010) We hypothesis that the cover crop management must take into account soil and climate context to maximize the multiple ecosystem services and in the same time reduce the negative impact of cover crops on soil water balance and on the next cash crop Our goal was to analyse by simulation the best cover crop managements according to soils and climates in the Adour-Garonne catchment
Materials and Methods We performed a multi-simulations approach with the STICS soil-crop model (Brisson et al 2003) The soil and climate diversity of Adour-Garonne catchment (southwestern France) was represented by an east west transect using five specific locations We tested one bare soil management as control and three different cover crop species with several management sowing (four dates) termination (four dates) residues management (2 types) We then tested two following cash crops for evaluating the following effect on sunflower (rainfed) and maize (irrigated) The STICS model cover crop parameters were calibrated by Constantin et al (2015) for Italian rye grass and white mustard Tribouillois et al (2016) for vetch and Meyer et al (2020) for Ethiopian mustard-crimson clover bispecific mixture
Results and discussion Our simulation results confirm that cover crops already reduce water drainage and increase actual evapotranspiration in comparison to bare soil They also decrease nitrate leaching and for some cases (non leguminous species and late termination date) reduce soil nitrogen availability for the next cash crops However cover crops would never induce a water or nitrogen stress of the succeeding cash crop likely to lead to lower yields in case of early termination (at least one month before sowing) In some cases simulated water and nitrogen stress were simulated in particular with a termination cover crop the day before the cash crop sowing and for year where no drainage would occur due to very low winter and spring rainfalls Moreover our study presents the interactions between various cover crop managements climate and soil contexts cover crops species and dates of sowing or termination The use of legumes as sole cover crop or in mixture with crucifer can even increase yields but their use must be reasoned in relation to the issue of nitrate leaching in areas with high drainage level The figure illustrate for one site (at
69
Toulouse-Auzeville) the results obtained by crossing all factors This indicate the importance of optimising together the type of species used and the dates of sowing and termination for providing a high level of compromise in ecosystemic services
Figure 45 Bilan des diffeacuterents itineacuteraires techniques des CIMS en comparaison avec un sol nu sur le site AUZ Les variables drsquointeacuterecircts sont la biomasse des CIMS agrave la destruction les diffeacuterences drsquoETR de drainage et de lixiviation durant lrsquointerculture et les stocks drsquoeau et drsquoazote au semis de la culture principale suivante S repreacutesente les dates de semis (S1 = 5 aoucirct S2 = 20 aoucirct S3 = 5 septembre S4 = 20 septembre) D repreacutesente les dates de destruction (D1 = 15 novembre D2 = 15 deacutecembre D3 = 15 mars D4 = 15 avril) Les lettres M et L repreacutesentent respectivement des reacutesidus laisseacutes en mulch apregraves destruction et des reacutesidus enfouis par un travail du sol Les eacutetoiles rouges et vertes indiquent les gestions de CIMS pouvant conduire agrave des reacuteductions ou des hausses de rendements de la culture principale suivante
Conclusion The impact of cover crop mixture on the water balance must therefore be investigated in new field experiments or by simulation in order to optimise the date of destruction with regard to the different services targeted by this type of plant cover in order to propose locally optimised management rules
References Bergez J-E Colbach N Crespo O Garcia F Gary C Jeuffroy M-H Justes E Loyce C Munier-Jolain N Sadok W (2010)
Designing crop management systems by simulation European Journal of Agronomy 32 3ndash9 Brisson N Brisson N Gary C Justes E Roche R Mary B Ripoche D Zimmer D Sierra G Bertuzzi P Burger P Bussiegravere
F Cabidoche YM Cellier P Debaeke P Gaudillegravere JP Heacutenault C Maraux F Seguin B Sinoquet H (2003) An overview of the crop model STICS European Journal of Agronomy 18 309-322
Constantin J Le bas C Justes E (2015) Large-scale assessment of optimal emergence and destruction dates for cover crops to reduce nitrate leaching in temperate conditions using the STICS soil-crop model EJA 69 75ndash87
Meyer N Bergez J-E Constantin J Justes E (2019) Cover crops reduce water drainage in temperate climates A meta-analysis Agronomy for Sustainable Development 393
Meyer et al (under revision) Cover crops reduce drainage but not always soil water content due to interactions between rainfall distribution and management Agricultural Water Management
Tribouillois H Cohan J-P Justes E (2016) Cover crop mixtures including legume produce ecosystem services of nitrate capture and green manuring assessment combining experimentation and modelling Plant and Soil 401 347-364
70
Simulating soil organic carbon dynamics in long-term bare fallow and arable
experiments with STICS model Hugues CLIVOT12 Fabien FERCHAUD2 Florent LEVAVASSEUR3 Sabine HOUOT3 Anne-Isabelle
GRAUX4 Alice CADEacuteRO4 Franccediloise VERTEgraveS5 Alain MOLLIER6 Annie DUPARQUE7 Jean-Christophe
MOUNY7 Olivier THEROND1 Bruno MARY2
1 Laboratoire Agronomie et Environnement Universiteacute de Lorraine INRAE Nancy-Colmar France 2 UR AgroImpact INRAE Site de Laon 02000 Barenton-Bugny France 3 UMR ECOSYS INRAE AgroParisTech Universiteacute Paris Saclay Thiverval-Grignon France 4 PEGASE Agrocampus Ouest INRAE 35590 Saint-Gilles France 5 SAS Agrocampus Ouest INRAE 35000 Rennes France
6 UMR ISPA INRAE Bordeaux Sciences Agro Villenave drsquoOrnon France 7 Agro-Transfert Ressources et Territoires Estreacutees-Mons France
The model performances were compared with those of the annual time-step carbon model AMG v2
which had been previously validated for various pedoclimatic conditions and cropping systems (Clivot
et al 2019)
Results and discussion
71
Results show that STICS could predict satisfactorily final C stocks after a long-term monitoring of SOC
in bare fallow and cultivated systems (Fig 1) The diversity of experiments suggests that STICS was able
to simulate well both decomposition and mineralization derived from native soil organic matter and
from fresh organic residues that are incorporated into humified organic matter
Figure 1 Differences between final and initial observed SOC stocks vs simulated with STICS and AMG models for bare fallow (BF) and cultivated soils in long-term experiments RRMSE = relative root mean square error and MD = mean difference for final SOC stocks
The performances of STICS in simulating SOC are comparable to those of AMG model (mean RRMSE of
63 and 43 for final SOC stocks simulated with STICS and AMG respectively) for which C inputs
into soil require measured crop yields to be calculated while STICS provides the advantage of
simulating crop growth and residues returned to the soil
Further studies will be needed to assess the model ability to simulate SOC dynamics in other systems
such as grasslands or cropping systems including perennial species
References
Autret B Mary B Strullu L et al (2019) Long-term modelling of crop yield nitrogen losses and GHG balance in organic cropping
systems Sci Total Environ 134597 httpsdoiorg101016jscitotenv2019134597
Clivot H Mouny J-C Duparque A et al (2019) Modeling soil organic carbon evolution in long-term arable experiments with
AMG model Environ Model Softw 11899ndash113 httpsdoiorg101016jenvsoft201904004
Constantin J Beaudoin N Launay M et al (2012) Long-term nitrogen dynamics in various catch crop scenarios Test and
simulations with STICS model in a temperate climate Agric Ecosyst Environ 14736ndash46
httpsdoiorg101016jagee201106006
Farina R Ehrhardt F Bellocchi G et al (2019) Multi-metric evaluation of an ensemble of biogeochemical models for the
estimation of organic carbon content in long-term bare fallow soils In Food Security and Climate Change Conference 4 per
1000 initiative new tangible global challenges for the soil
Yin X Beaudoin N Ferchaud F et al (2020) Long-term modelling of soil N mineralization and N fate using STICS in a 34-year
Participative approach with STICS for evaluation of nitrogen management scenarios
in organic farming systems Beaudoin N 1 Rakotovololona L 1 Chleacutebowski F1 Favreliegravere E 2 Ronceux A 2
1 INRA AgroImpact 180 rue Pierre-Gilles de Gennes 02000 Barenton-Bugny France 2 Agro-Transfert Ressources et Territoire 80200 Estreacutees-Mons France nicolasbeaudoininrafr
Keywords Legume Multicriteria optimization Participatory research Numerical experiment
Introduction
Organic farming (OF) is considered as a prototype of sustainable agriculture However its
environmental performances linked to carbon (C) and nitrogen (N) cycles seems perfectible
(Mondelaers et al 2009 Sautereau et al 2016) The N factor also plays a key role in production
interacting with weeds (Casagrande et al 2009) Deterministic dynamic modelling if realistic should
help to optimize OF systems Recently applications of the STICS research version (v1680) in OF relied
on the following hypothesis (H1) if weeds pests and diseases are quite well controlled an agro-
environmental model can reproduce satisfactorily aboveground biomass and water-CN budgets The
H1 hypothesis has been validated in on-farm situations on an annual scale (Beaudoin et al 2018) and
on long-term trials (Autret et al 2019) In addition the participative approach well known in OF could
help to take into account biotic factors (Desclaux et al 2012) The second hypothesis was combining
deterministic modelling and agricultural stakeholders would be relevant to optimise OF systems (H2)
The work carried out during Rakotovololonas thesis (2018) was based on a numerical experiment to
test scenarios co-designed by researchers farmers and agricultural advisors from real situations
Material and methods
Rakotovololonas thesis (2018) was based on a monitoring network of organic fields in Hauts-de-France
(France) From a preliminary diagnosis two themes were prioritized by the workshop (1) the fallow
cropping management after harvest of grain legume and (2) the fallow cropping management
afteralfalfa ploughing Different N management practices eventually combined were proposed by
farmers For each risky situation studied three benchmarks represented by a plot-year couple were
chosen The same combinations of modalities were applied to each benchmark The simulations are
replicated on real climate series with a duration of 4 to 6 years over the period 2000 - 2017 A scenario
is a combination of management modalities for a given plot simulated with sequence over real years
(called A) then the two years of interest (called Brdquo) under a given climate series
Results and discussion
The predictions of STICS are first tested on the data acquired in A years in chained simulations of a
duration of 2 to 3 years The predictions of the total aboveground biomass the amount of N in the
aerial part the soil water stock and the soil mineral nitrogen (SMN) stock are sufficient with
efficiencies of 093 055 063 and 064 respectively In addition simulations of SMN dynamics before
during and after alfalfa cropping have been successfully tested by Strullu et al (2020)
Predictions for B years are then discussed with farmers The variables of interest are at the same time
emissions) The SMN stock evolution appears sensitive to the fallow period management scenario
intersecting the length of the period and the type of multiservice catch crop with the addition of
climate hazards (Figure 1) Likewise N mineralization were very sensitive to the alfalfa ploughing
scenarios according to the period of destruction and the fate of the last cut it statistically significantly
varied between 382 and 580 kg N ha-1 for two years (data not shown) The N losses were rather high
73
but less sensitive to the scenarios with NO3 leaching being between 55-69 and N2O emissions being
between 32-45 kg N ha-1 both for two years However the final SMN remained high and variable
from 75 to 175 kg N ha-1 so it would be better to investigate these impacts over a longer period
Figure 1 Average SMN dynamics (kg N ha-1) for fall management scenarios in OF with short (left) and long (right) fallow period in plot p36 for B years Scenario color code bare soil = red mustard catch crop = green vetch-barley mixed catch crop = yellow pure vetch catch crop = blue Colored areas = mean plusmn standard deviation of climatic years
This approach coupled in a dynamic and educational way the use of a model to quantify
biogeochemical flows of interest and expert knowledge of farmers and advisers to design alternative
scenarios It allowed some shifts in N management practices after alfalfa in our network This coupling
could be enriched with other tools such as OdERA-Systegravemes which indicates weeds risk at the scale
of a rotation (httpwwwagro-transfert-rtorgoutilsodera-systemes-2) Integrating STICS into a
user-friendly interface would ultimately enable supporting modelling to design cropping systems
inorganic farming
Acknowledgments
The partnership of farmers and advisers in Agribio project The financial support of AESN and INRA
Literature references
Autret B Mary B Strullu L Chlebowski F Maumlder P Olesen JO Beaudoin N (2019) Long-term trends in crop yield nitrogen losses and GHG balance of organic cropping systems STOTEN
Beaudoin N Rakotovololona L Chleacutebowski F Lengrand A Ronceux A Favreliegravere E Mary B (2018) Yield Gap Analysis of Organic Cereals Based on Field Network Monitoring and the STICS Model XVe congress of ESA Geneva 27-31 August
Casagrande M David C Valantin-Morison M Makowski D Jeuffroy M-H 2009 Factors limiting the grain protein content of organic winter wheat in south-eastern France a mixed-model approach Agronomy for Sustainable Development 29 (4) 565-574
Desclaux D Ceccarelli S Colley M Navazio J Trouche G Aguirre S Weltzien E Lanccedilon J 2012 Chapter 6- Centralized or decentralized breeding the potentials of participatory approaches for low-input and organic agriculture In Organic Crop Breeding - Edith T Lammerts van Bueren and James R Myers- Wiley-Blackwell
Mondelaers K Aertsens J VanHuylenbroeck G (2009) A meta-analysis of the difference in environmental impacts between organic and conventional farming British Food Journal 111 1098-1119
Rakotovololona L (2018) Quantification expeacuterimentale et modeacutelisation de la production des flux deau et dazote en systegravemes de culture biologiques Thegravese de doctorat de linstitut des sciences et industries du vivant et de lenvironnement 171 p +annexes
Sautereau N Benoit M et Saviny I (2016) Quantifier et chiffrer eacuteconomiquement les externaliteacutes de lrsquoagriculture biologique Synthegravese du rapport au MAFF ITAB et INRA 20 pp
Strullu L Beaudoin N Thieacutebeau P Julier B Mary B Ruget F Ripoche D L Rakotovololona L Louarn G (2020) Simulation using the STICS model of CampN dynamics in alfalfa from sowing to crop destruction EJA 112 125948