Assessing the Impact of RO Refractivity on the Analysis and Prediction of Typhoon Morakot (2009) with a New Data Assimilation Strategy Xingqin Fang and Ying-Hwa Kuo COSMIC Program Office, UCAR, Boulder, CO, USA April 2, 2012 1
Transcript
Assessing the Impact of RO Refractivity on the
Analysis and Prediction of Typhoon Morakot (2009)
with a New Data Assimilation Strategy
Xingqin Fang and Ying-Hwa Kuo
COSMIC Program Office, UCAR, Boulder, CO, USA
April 2, 2012
1
Outline:
1. A new data assimilation strategy for refractivity
2. Case overview of Typhoon Morakot (2009)
3. Experiments design
4. Encouraging positive results
5. Conclusions and discussions
2
Objective: To improve the performance of local operator of
refractivity for typhoon analysis and forecast
3
A new data assimilation strategy
for refractivity
4
Observation resolutions of N --- Clarify “vertical resolution”
1 & 2 specific treatment for vertical error correlation
2 & 3 specific representative errors
1. N_ar vertical resolution of retrieval
~10-50m (observation density)
2. N_ar vertical resolution of information
~100-200m near surface,
~500-1000m in troposphere,
~1000-2000m in stratosphere
3. N_mod vertical resolution
--- Vary with NWP model
5
Observational error correlation
1. Variable transformation -- n/a for N
2. Thinning via super-obs -- n/a for monotonic N
3. Non-diagonal error matrix -- n/a for ensemble
4. Cost function down-weighting -- n/a for ensemble
5. Adaptive inflation -- OK for ensemble, still developing
6. Thinning via down-sampling
-- OK for N
-- OK for both ensemble and variational
-- Simplest to implement
This deserves further investigation…
✔
6
• How to thin?
1. To exact heights.
2. Global altitude-dependent intervals.
3. Determine intervals by “observation resolution”.
Our new strategy (see Fang 2011, Ph.D. thesis)
“Assimilating RO refractivity on thinned exact heights”
• Why to exact heights?
--- Much easier to assume more accurate
height-specific observational errors.
7
Our new strategy (see Fang 2011, Ph.D. thesis)
“Assimilating RO refractivity on thinned exact heights”
• Vertical structure of errors
--- Vary significantly with altitude
--- Vary significantly with latitude
--- Neither latitudinal nor altitudinal
explicit fitting functions applicable
for error interpolation onto arbitrary
heights.
8
Thinning scheme A (for comparison)
--- 60 exact levels to 20 hPa
• Every 200m for 600-2000m
• Every 400m for 2,000-18,400m
• Every 600m for 18,400-25,000m
--- Vertical resolution of
N
~100-200m near surface,
~500-1000m in troposphere,
~1000-2000m in stratosphere
Numbers of N on
each level
9
Thinning scheme B (tested)
--- 26 exact levels to 20 hPa
• Every 800m for 800-13,600m
• Every 1200m for 13,600-23,200m
• Every 1800m for 23,200-25,000m
--- Vertical resolution of
N
~100-200m near surface,
~500-1000m in troposphere,
~1000-2000m in stratosphere
Numbers of N on
each level
10
Case overview of
Typhoon Morakot (2009)
1-day: 1504 mm (Aug.8-9)
4-day: 2874mm
Record-breaking rainfall
From August 6 to 10, 2009,
extraordinary rainfall was
brought over Taiwan by
Typhoon Morakot, breaking
50 years’ precipitation record,
causing a loss of more than
700 people and estimated
property damage exceeding
US$3.3 billion.
12
West-bounding track impinging Taiwan
00/6
00/5 00/7
00/8
00/9
13
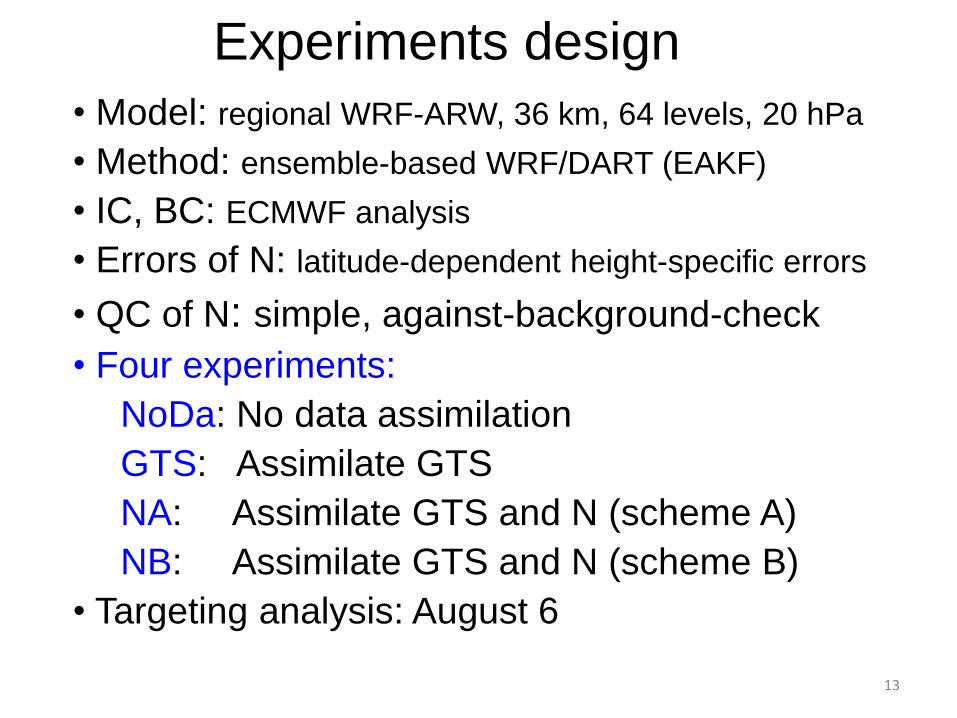
Experiments design
• Model: regional WRF-ARW, 36 km, 64 levels, 20 hPa
• Method: ensemble-based WRF/DART (EAKF)
• IC, BC: ECMWF analysis
• Errors of N: latitude-dependent height-specific errors


![Diversifying Trending Topic Discovery via Semidefinite ...yfang/IEEE-Bigdata-Fang.pdf · TwitterMonitor, a framework for online trend detection in Twitter. Weng et al. [19] use a](https://static.documents.pub/doc/80x56/5ed36ad7e450f87a2052e68e/diversifying-trending-topic-discovery-via-semideinite-yfangieee-bigdata-fangpdf.jpg)


