\
Xiong, J. W., Wan, M. P., Ng, B. F. and You, S. (2020) Quantification of viable bioaerosol emanation from an ACMV system and its impact on indoor bioaerosol pollution. Aerosol and Air Quality Research, (doi: 10.4209/aaqr.2019.05.0253)
The material cannot be used for any other purpose without further permission of the publisher and is for private use only.
There may be differences between this version and the published version. You are advised to consult the publisher’s version if you wish to cite from it.
http://eprints.gla.ac.uk/212820/
Deposited on 26 March 2020
Enlighten – Research publications by members of the University of Glasgow
http://eprints.gla.ac.uk
Quantification of Viable Bioaerosol Emanation from an ACMV 1 System and Its Impact on Indoor Bioaerosol Pollution 2
3 Jin Wen Xiong1, Man Pun Wan2 , Bing Feng Ng2, Siming You3 4
5 1 Energy Research Institute @ NTU, Nanyang Technological University, 50 Nanyang Drive, 6
637553, Singapore 7 2 School of Mechanical and Aerospace Engineering, Nanyang Technological University, 50 8
Nanyang Avenue, 639798, Singapore 9 3 School of Engineering, University of Glasgow, James Watt South Building, G12 8QQ, Glasgow 10 11 Abstract 12 13
Viable bioaerosols can deposit and multiply in air-conditioning and mechanical ventilation 14 (ACMV) systems. These bioaerosols can eventually enter indoor environments following the 15 operation of the ACMV systems, contributing to indoor bioaerosol pollution. A method to identify 16 and quantify viable bioaerosol emanation from an ACMV system and its impact on indoor 17 bioaerosol pollution is proposed in this study. The method involves surface and air sampling of 18 viable bioaerosols with analysis using a material-balance model. The proposed method was adopted 19 to investigate the contribution of viable bioaerosol emanation from an ACMV system to indoor 20 bioaerosol pollution in an air-conditioned room located in Singapore. The bioaerosol emanation 21 rates from the ACMV system were found to be 2.4 CFU s-1 for viable bacteria and 3.9 CFU s-1 for 22 viable fungi. Among various bioaerosol sources, bioaerosol emanation from the ACMV system 23 was the largest source of indoor viable bacteria and the second largest source of indoor viable fungi 24 in the air, behind the introduction of outdoor fungi through the mechanical ventilation. Potentially 25 pathogenic bioaerosol species were also found in the ACMV system, which are in the genera of 26 Staphylococcus, Moraxella and Aspergillus. Particularly, Moraxella osloensis, which is most likely 27 to be emanated from occupants, was found to accumulate in the ACMV system, indicating the 28 potential impact of the ACMV system’s hygiene on indoor bioaerosol pollution. This study could 29 contribute to the understanding of bioaerosol emanation from ACMV systems and their impact on 30 indoor bioaerosol pollution. The proposed method could be used as a tool for analysing the 31 potential sources of indoor bioaerosols and support the development of effective control measures 32 against bioaerosol emanation from ACMV systems. 33 34
35
Keywords: Indoor bioaerosol dynamics; Natural ventilation; Bacteria; Fungi 36
Corresponding author. Tel: (+65) 67906957; Fax: (+65) 67906957
E-mail address: [email protected]
NOMENCLATURE 37
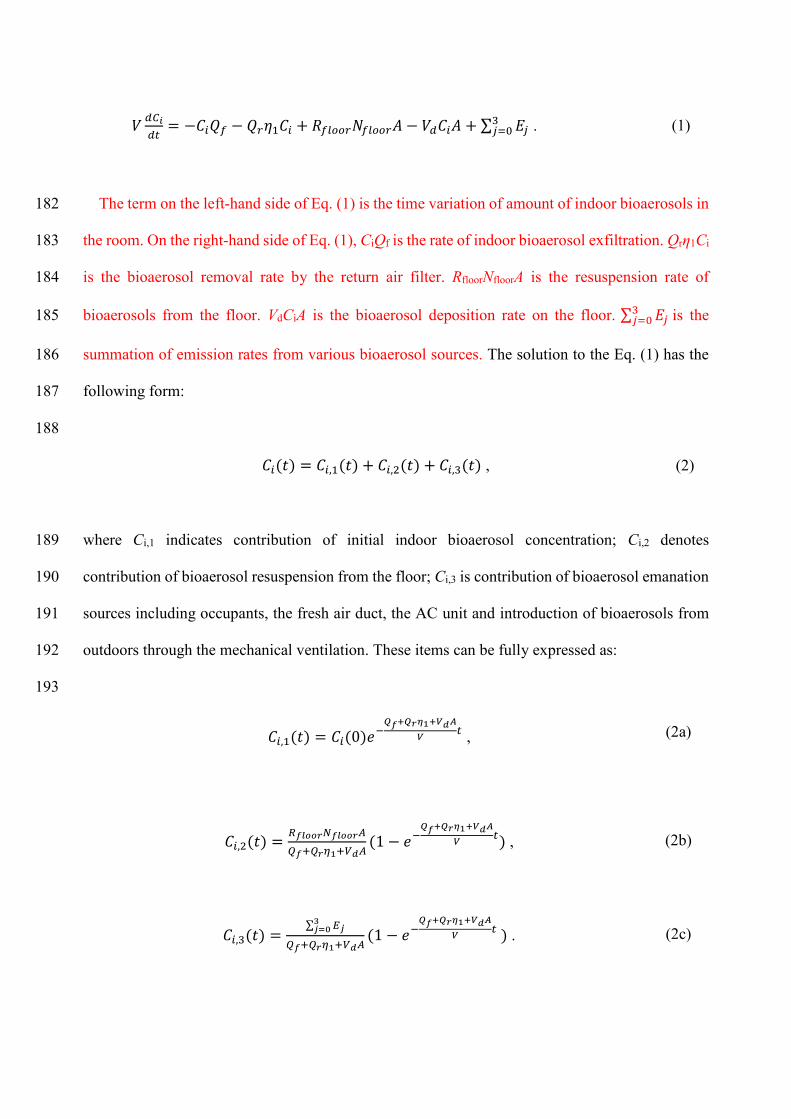
A Floor area (m2) C Bioaerosol concentration (CFU m-3) Ci Indoor bioaerosol concentration (CFU m-3) Ci,1 Contribution of initial bioaerosol concentration (CFU m-3) Ci,2 Contribution of bioaerosol resuspension from the floor (CFU m-3) Ci,3 Contribution of the potential bioaerosol emanation sources including
occupants, the fresh air duct and the AC unit and the introduction of outdoor bioaerosols through the mechanical ventilation (CFU m-3)
E0 The rate of supply of bioaerosols from outdoors through mechanical ventilation (CFU s-1)
E1 Bioaerosol emanation rate of occupants (CFU s-1) E2 Bioaerosol emanation rate of the AC unit (CFU s-1) E3 Bioaerosol emanation rate of the fresh air duct (CFU s-1) F Sampling air flow rate of the impactor (14.15 L min-1) N Bacterial or fungal loadings on surfaces (CFU m-2) Nfloor Bacterial and fungal loadings on the floor (CFU m-2) n Number of colonies on an agar plate (CFU) Rfloor Resuspension rate of bacteria and fungi from the floor (# s-1) r Ratio of the volume (100 μL) of liquid sample spread on an agar plate to the
volume (10 mL) of eluted ultra-pure water from one swab St Template area of surface sampling (0.005 m2) t Time (s) ts Sampling time for each air sample (10 minutes) Qf Fresh air flow rate (m3 s-1) Qr Return air flow rate (m3 s-1) V Volume of indoor space (m3) Vd Deposition velocity of indoor bioaerosols on the floor(m s-1) η1 Filtration efficiency of the return air filter inside the AC unit
38
39
INTRODUCTION 40
Air conditioning and mechanical ventilation (ACMV) systems are widely used to provide a 41
comfortable indoor environment (Cheong and Lau, 2003), especially in the tropical region where 42
air-conditioning is needed all year round (Aziz et al., 2017). In Singapore, ACMV systems are 43
widely adopted in buildings (Chen and Chang, 2012). In many cases, an ACMV system also serves 44
as an engineering means to control indoor air quality (Zhao and Wu, 2009; Chen et al., 2016). 45
However, whether an ACMV system is helping to control indoor air quality or is worsening indoor 46
air quality remains debatable. An increasing number of studies have shown that ACMV systems 47
can also serve as sources of indoor aerosols (Batterman and Burge, 1995; Bluyssen et al., 2003). 48
Studies indicated that cooling coils of an ACMV system could be a potential aerosol source via air-49
flow-induced particle resuspension from the surfaces of the cooling coils when they were 50
contaminated by particulate matter (Siegel and Carey, 2001; Siegel, 2002). Zhou et al. (2011) also 51
found that particle resuspension from highly contaminated air ducts led to as much indoor aerosol 52
pollution as that caused by indoor human activities, such as cleaning and playing for 60 minutes. 53
Bioaerosol, especially airborne bacteria and fungi, is an important concern for indoor 54
environments (Lal et al., 2017). Human exposure to airborne bacteria and fungi can lead to serious 55
infectious diseases (Cole and Cook, 1998; Daniels et al., 2016; Fan et al., 2017; Kim et al., 2017) 56
such as Legionnaires' disease (Berrington and Hawn, 2013), tuberculosis (TB) (Pedersen et al., 57
2016) and pneumonic plague (Hammamieh et al., 2016). In addition, some allergens such as spores 58
and hyphae (Jutel et al., 2016), which can cause serious respiratory diseases (Hargreaves et al., 59
2003; Vesper et al., 2008; Beck et al., 2012 ; Du et al., 2018), are found in indoor bioaerosols. 60
Indoor bioaerosols consist of viable and non-viable portions (Nazaroff, 2016). Although non-viable 61
bioaerosols can cause allergies when occupants are exposed to them (Kauffman and van der Heide, 62
2003), they do not multiply in the environment. The viable bioaerosols can deposit, accumulate, 63
and subsequently multiply on the surfaces of various components of an ACMV system under 64
favourable conditions, exacerbating the biological contamination of the ACMV system (Batterman 65
and Burge, 1995; Siegel and Carey, 2001; Zhao and Wu, 2006; Lu et al., 2009; Bonetta et al., 2010; 66
Chen and Chang, 2012; Schmidt et al., 2012; Wu et al., 2016). These findings indicate the potential 67
of ACMV systems to be bioaerosol emanation sources. Jo and Lee (2008) observed that switching 68
on an ACMV system could lead to an instantaneous increase in concentrations of indoor airborne 69
viable bacteria and fungi. However, little study has been conducted to quantify the bioaerosol 70
emanation rate from ACMV systems and identify the species of bioaerosols emanated from ACMV 71
systems. 72
This work experimentally investigates the emanation of viable bacteria and fungi from an 73
ACMV system and its contribution to indoor bioaerosol pollution in a tropical indoor environment, 74
where the environmental conditions are generally favourable to growth of microorganisms (Chen 75
and Chang, 2012). Both air and surface sampling methods are employed for viable bioaerosol 76
quantification and species identification. The result of this study could contribute to the 77
understanding of bioaerosol emanation from ACMV systems and their impact on indoor bioaerosol 78
pollution. The proposed method could also be used as a tool for analysing the potential sources of 79
indoor bioaerosols and support the development of effective control measures against bioaerosol 80
emanation from ACMV systems. 81
82
METHODOLOGY 83
Experimental Site 84
Experiments were conducted in a tutorial room (6.30 m [L] × 5.80 m [W] × 2.80 m [H]) located 85
at Nanyang Technological University (NTU), Singapore. A schematic diagram of the tutorial room 86
is shown in Fig. 1. The ACMV system of the room consists of a ceiling-mounted cassette-type air-87
conditioning (AC) unit (plfy-p63vam-e, MITSUBISHI ELECTRIC) and a fresh air duct. The AC 88
unit draws room return air through a grill that has a Minimum Efficiency Reporting Value 89
(MERV)-4 rating return air filter installed, which provides a minimum filtration efficiency of less 90
than 20% for particles of diameters from 0.3 to 10.0 µm according to ASHRAE Standard 52.2 91
(ASHARE, 2017). The AC unit also draws outdoor air via a 22.8-m-long fresh air duct. A fresh air 92
filter of MERV-8 rating (minimum filtration efficiency of less than 10% for particles of diameters 93
from 0.3 to 1.0 µm, and that of less than 70% for particles of diameters from 1.0 to 3.0 µm, and 94
that of 70% to 85% for particles of diameters from 3.0 to 10.0 µm according to ASHRAE Standard 95
52.2 [ASHARE, 2017]) is installed at about 3.2 m downstream of the fresh air intake. The supply 96
air flow rate of the AC unit is 1400 m3 hr-1, a constant air volume. When the tutorial room is 97
operated in ACMV mode, the indoor air temperature set point is 24°C and relative humidity (RH) 98
set point is 60%, which is set according to the recommendation from Singapore Standard 554 (SSC, 99
2016). The tutorial room can also be operated in natural ventilation mode. There is a sliding window 100
(2.5 m2) on the wall. When the room is naturally ventilated, the window is open and the AC unit is 101
switched off. 102
103
Air Sampling of Bioaerosols 104
In this study, culture-based air sampling method was used to measure concentrations of indoor 105
viable bacteria and fungi in the air. The culture-based air sampling method is widely adopted for 106
measuring indoor bioaerosol concentrations, e.g., Singapore Standard SS554 (Iyengar, 2014), 107
WHO indoor air quality guideline (Heseltine and Rosen, 2009), Occupational Safety and Health 108
Administration (OSHA) (Kim et al., 2017), the Health and Welfare Department in Canada (Kim et 109
al., 2017) and Indoor Air Quality Association (Kim et al., 2017). Many studies employed culture-110
based air sampling method to quantify bacterial and fungal concentrations for validating 111
predictions of indoor bioaerosol concentrations by mathematical formulas (Scheff et al., 2000; 112
Green et al., 2003; Hathway et al., 2011; King et al., 2013). 113
Air sampling was conducted using a 200-hole, one-stage impactor (SKC) loaded with a petri 114
dish with culture medium. A sampling flow rate of 14.15 L min-1 was provided by a sampling 115
pump. The median cut-point (D50) of the impactor at the sampling flow rate is 0.6 µm. Tryptic soy 116
agar with addition of cycloheximide was used as the culture medium for bacteria. Malt extract agar 117
with addition of chloramphenicol was used as the culture medium for fungi. Sampled bacterial agar 118
plates were incubated for 48 hours in 35oC whereas fungal agar plates were incubated for 72 hours 119
in 27oC, before colony counting. The colony counts were subsequently corrected using the method 120
suggested by Macher (1989). The bacterial and fungal concentration (C, colony forming unit [CFU] 121
per cubic meters) is calculated as C = 1000n / (F � ts), where n (CFU) is the corrected number of 122
colonies on a sampled agar plate. F = 14.15 L min-1 is the sampling air flow rate of the impactor 123
with an agar plate inside. ts = 10 min is the sampling time for each sample. Measurement 124
uncertainty of indoor bacterial and fungal concentrations using the impactor is 7.67 CFU m-3. 125
Preparation of agar plates, and incubation and colony counting of air-sampled agar plates are 126
described in Supplemental Material. We understand that CFU is not a direct reflection of bioaerosol 127
amount. However, due to the fact that the culture-based air sampling method was used in this study, 128
CFU m-3 is the representation unit of bioaerosol concentrations with this method. 129
Air sampling of indoor viable bacteria and fungi was conducted from 9:25 am to 4:35 pm in a 130
day. There was a 20-minute interval between two successive air samplings. Therefore, fifteen pairs 131
of air samples (15 air samples for bacterial cultivation and 15 air samples for fungal cultivation) 132
could be collected in a day. 133
134
Surface Sampling of Indoor Surfaces 135
Surface sampling was conducted to quantify loadings of viable bacteria and fungi on indoor 136
surfaces. Surface sampling was performed using SKC surface swab kits (SKC). A swab kit includes 137
a sterile foam swab and a 5 cm × 10 cm plastic template that defines the target sampling area. 138
During a surface sampling, the target area defined by the template was swabbed thoroughly in a 139
rolling mode using the sterile foam swab. After sampling, the foam swab was kept in the sterile 140
storage tube that came with the kit and was then transported back to the laboratory for culture-141
based analysis. To extract the surface sample from the swab kit, 10 mL of ultra-pure water was 142
added to each storage tube containing the sampled swab. The tubes were then vortex-shaken in a 143
vortex mixer (SPD Scientific) for one minute. The liquid sample eluted from the swab was then 144
transferred to a clean tube. Next, 100 μL of the liquid sample was extracted by a pipette 145
(HIRSCHMANN) and distributed on an agar plate for cultivation. Five repeats of agar plates were 146
made for each eluted liquid sample. Incubation and colony counting of surface samples shares the 147
same method as that for air sampling. Bacterial and fungal loadings on the sampled surface (N) can 148
be calculated as N = n / (r � St), where n is the number of colonies on an agar plate. r = 0.01 is the 149
ratio of volume of extracted liquid sample (100 μL) that distributed on an agar plate to the volume 150
(10 mL) of eluted ultra-pure water from one swab (volume of liquid sample in the storage tube 151
after adding 10 mL ultra-pure water) and St = 0.005 m2 is the area that the plastic template defines 152
for surface sampling. 153
154
155
156
157
Experiment Design 158
Indoor Bioaerosol Model 159
Damped areas such as rotted food or damaged furniture was not found in the tutorial room. 160
Before the experiments, air leakages of the room, such as door gaps, were sealed by tapes to 161
minimize the penetration of outdoor bioaerosols to the indoor space through the leakages. 162
Contribution of the penetration of outdoor bioaerosols through the leakages to indoor bioaerosol 163
concentration was assumed negligible. As such, introduction of outdoor bioaerosols through the 164
mechanical ventilation, bioaerosols emanated from occupants and the ACMV system, as well as 165
bioaerosol resuspension from the floor were the bioaerosol sources indoors when the room was 166
operated in the ACMV mode. When the room was operated in the ACMV mode, two assumptions 167
were made for the indoor bioaerosol dynamics in this study: 1) in the experiment, indoor 168
bioaerosols were assumed to be well mixed in the tutorial room. In a previous study, indoor aerosols 169
were assumed to be well mixed in an indoor space of a dimension of 5 m (L) × 6 m (W) × 3 m (H) 170
when the air mixing rate was 6 h-1 and duration of air mixing was 8 hours in the indoor space (Zhou 171
et al., 2011). In this study, dimensions of the tutorial room (6.30 m [L] × 5.80 m [W] × 2.80 m [H]) 172
and duration of air mixing in the experiment (7 hours) were similar to those in the previous study 173
(Zhou et al., 2011). Meanwhile, the air mixing rate of the tutorial room in the ACMV mode was 174
13.7 h-1 in this experiment, which was more than double of that of the indoor space in the previous 175
study (Zhou et al., 2011). Therefore, indoor bioaerosols, as a sub-set of aerosols, could be assumed 176
to be well mixed in the experiment in this study. 2) Coagulation could be assumed to be negligible 177
due to low concentrations of indoor bioaerosols (less than 105 to 108 m-3) (Zhou et al., 2011), which 178
can be found in the measurement results of indoor bioaerosol concentrations in the next section. 179
Then the material-balance equation of indoor bioaerosols when the room was operated in the 180
ACMV mode can be given by 181
𝑉 𝑑𝐶𝑖𝑑𝑡
= −𝐶𝑖𝑄𝑓 − 𝑄𝑟𝜂1𝐶𝑖 + 𝑅𝑓𝑙𝑜𝑜𝑟𝑁𝑓𝑙𝑜𝑜𝑟𝐴 − 𝑉𝑑𝐶𝑖𝐴 + ∑ 𝐸𝑗3𝑗=0 . (1)
The term on the left-hand side of Eq. (1) is the time variation of amount of indoor bioaerosols in 182
the room. On the right-hand side of Eq. (1), CiQf is the rate of indoor bioaerosol exfiltration. Qrη1Ci 183
is the bioaerosol removal rate by the return air filter. RfloorNfloorA is the resuspension rate of 184
bioaerosols from the floor. VdCiA is the bioaerosol deposition rate on the floor. ∑ 𝐸𝑗3𝑗=0 is the 185
summation of emission rates from various bioaerosol sources. The solution to the Eq. (1) has the 186
following form: 187
188
𝐶𝑖(𝑡) = 𝐶𝑖,1(𝑡) + 𝐶𝑖,2(𝑡) + 𝐶𝑖,3(𝑡) , (2)
where Ci,1 indicates contribution of initial indoor bioaerosol concentration; Ci,2 denotes 189
contribution of bioaerosol resuspension from the floor; Ci,3 is contribution of bioaerosol emanation 190
sources including occupants, the fresh air duct, the AC unit and introduction of bioaerosols from 191
outdoors through the mechanical ventilation. These items can be fully expressed as: 192
193
𝐶𝑖,1(𝑡) = 𝐶𝑖(0)𝑒−𝑄𝑓+𝑄𝑟𝜂1+𝑉𝑑𝐴
𝑉 𝑡 , (2a)
𝐶𝑖,2(𝑡) = 𝑅𝑓𝑙𝑜𝑜𝑟𝑁𝑓𝑙𝑜𝑜𝑟𝐴𝑄𝑓+𝑄𝑟𝜂1+𝑉𝑑𝐴
(1 − 𝑒−𝑄𝑓+𝑄𝑟𝜂1+𝑉𝑑𝐴
𝑉 𝑡) , (2b)
𝐶𝑖,3(𝑡) =∑ 𝐸𝑗
3𝑗=0
𝑄𝑓+𝑄𝑟𝜂1+𝑉𝑑𝐴(1 − 𝑒−
𝑄𝑓+𝑄𝑟𝜂1+𝑉𝑑𝐴𝑉 𝑡 ) . (2c)
The initial condition used to solve Eq. (1) is Ci = Ci(0) at t = 0, where Ci(0) is the indoor 194
bioaerosol concentration measured at the beginning of the experiment. 195
A non-linear least squares method was applied to estimate the bacterial and fungal emanation 196
rates by using the mathematical formula expressed by Eq. (2) to fit experimental results of indoor 197
bacterial and fungal concentration. In the above equations, Ci is the indoor bioaerosol 198
concentration. E0 is the rate of supply of bioaerosols from outdoors through the mechanical 199
ventilation, E1 is the bioaerosol emanation rate of human occupants, E2 is the bioaerosol emanation 200
rate of the AC unit, and E3 is the bioaerosol emanation rate of the fresh air duct. The fresh air flow 201
rate Qf can be calculated according to measurement results of air exchange rates (AER) and the 202
volume of the tutorial room (V). The return air flow rate Qr was measured to be 0.37 m3 s-1. In the 203
indoor environment of the room, the resuspension rate, the filtration efficiency of the MERV 4-204
rating return air filter and the deposition velocity of indoor bioaerosols can be estimated according 205
to aerodynamic diameters of the indoor bioaerosols (Thatcher and Layton, 1995; Lai, 2002; Zhou 206
et al., 2011). In this study, targeted indoor bioaerosols are indoor viable bacteria and fungi in the 207
air, which are the viable portion of indoor airborne bacteria and fungi. Typical ranges of 208
aerodynamic diameters of the indoor airborne bacteria and fungi are from 0.5 to 2.5 µm 209
(Wiedinmyer et al., 2004; Wiedinmyer et al., 2009) and from 2 to 4 µm (Madsen et al., 2016), 210
respectively. Due to the fact that the typical range of aerodynamic diameters of the indoor airborne 211
bacteria and fungi are larger than 0.5 μm, their deposition are mostly attributed to gravitational 212
settling on upward facing horizontal surfaces (Whyte and Derks, 2015). Therefore, their deposition 213
on and resuspension from sidewalls and the ceiling of the room can be neglected and thus the 214
deposition velocity on the floor Vd and the resuspension rate from the floor Rfloor are used in the Eq. 215
(1). In the experiment, both the deposition velocity Vd and the resuspension rate Rfloor were assumed 216
to be constant with time due to the constant supply air flow rate and a constant indoor activity 217
(sitting) in the tutorial room (Thatcher and Layton, 1995; Zhou et al., 2011). In the material-balance 218
equation, Rfloor, Vd and the filtration efficiency of the return air filter η1 are estimated according to 219
the aerodynamic diameters of the indoor bacteria and fungi and summarized in 220
Table 1. As shown in Table 1, both the resuspension rate Rfloor and the deposition velocity Vd are 221
much less than one, indicating their insignificant impact on the indoor bacterial and fungal 222
concentrations in the period of air sampling. According to the measurement results of filtration 223
efficiency of a MERV 4-rating filter in a previous study (Burroughs, 2005), which has the same 224
filter rating as the return air filter installed in the ACMV system of the tutorial room, both the 225
variation of filtration efficiency of particles within the size range of 0.5 to 2.5 µm and that within 226
the size range of 2 to 4 µm are insignificant, as shown in Table 1. Therefore, the average 227
resuspension rate Rfloor, the deposition velocity of indoor bioaerosols Vd and the filtration efficiency 228
of the return air filter η1 in Table 1 were used in the Eq. (1). They were calculated for the indoor 229
airborne bacteria and fungi respectively. A is the indoor floor area (6.30 m [L] × 5.80 m [W]). 230
Bacterial or fungal loadings on the indoor floor surface Nfloor were measured by surface sampling 231
using the method described in previous subsection. 232
233
Experimental Scenarios 234
In Eq. (1), Ej (j = 0, 1, 2, 3) are unknowns. Four experimental scenarios (Scenario 1–4, as shown 235
in Fig. 2) were designed to determine these unknowns. In each scenario, air sampling of indoor 236
viable bacteria and fungi repeated for five successive weekdays. Therefore, 75 pairs of air samples 237
were collected for each scenario. Subsequently, a non-linear least squares method was applied to 238
estimate the bacterial and fungal emanation rates, Ej (j = 0, 1, 2, 3), by using Eq. (2) to fit 239
experimental results of indoor bacterial and fungal concentrations in each scenario. Before the start 240
of each scenario, the AER of the room was measured by the tracer gas decay method using CO2 241
(99.99% purity, Air Liquide) as the tracer gas. The CO2 concentration was measured by a CO2 242
meter (CM-0212, CO2Meter) at an interval of 20 seconds. Surface sampling was conducted on the 243
first and the last day of each scenario to quantify bacterial and fungal loadings on the indoor floor 244
surface for estimating the contribution of their resuspension from the floor to indoor bioaerosol 245
pollution. When the surface sampling was conducted, nine targeted sampling areas, which were 246
evenly distributed on the floor area of the indoor space, were sampled using nine different swab 247
kits. Due to the fact that the deposition velocity of indoor airborne bacteria and fungi is several 248
magnitudes less than one, as shown in Table 1, their surface loadings on the floor can be assumed 249
to be independent of their indoor concentrations during the air sampling experiment. In addition, 250
the surface loadings are assumed to be constant during the air sampling due to the constant indoor 251
supply air flow rate and activities of occupants in the tutorial room. 252
In Scenario 1, there was no occupant in the room and a HEPA filter was inserted at connection 253
between the fresh air duct and the AC unit to prevent the introduction of outdoor bioaerosols 254
through the mechanical ventilation and the emanation of bioaerosols from the fresh air duct. Hence, 255
besides the resuspension from the floor (a common source in all scenarios), the bioaerosol 256
emanation from the AC unit was the only emission source in this scenario. When Eq. (2) was 257
applied to Scenario 1, E0 = E1 = E3 = 0. As a result, the bioaerosol emanation rate of the AC unit 258
(E2) became the only unknown. Using the solution expressed by Eq. (2) to fit the experimental data 259
from Scenario 1 through the non-linear least squares method, the emanation rates of the AC unit 260
(E2) for bacteria and fungi could be found. 261
Scenario 2 was largely similar to Scenario 1 but with addition of two occupants. Prior to Scenario 262
2, there were no occupants in the experimental room for 11 days. Applying Eq. (2) to Scenario 2, 263
and using the E2 determined from Scenario 1, E0 = E3 = 0, the bioaerosol emission from the 264
occupants (E1) was the only unknown in the equation. Using a similar fitting method for the 265
experimental results obtained in Scenario 2, E1 for bacteria and fungi could be determined. 266
In Scenario 3, the HEPA filter was moved to the fresh air intake to prevent the introduction of 267
outdoor bioaerosols through the mechanical ventilation. However, this allowed for the bioaerosols 268
emanated from the fresh air duct to enter the room. For Scenario 3, E0 = 0 in Eq. (2c). E1 and E2 269
were already determined from Scenario 1 and 2. The only unknown, the bioaerosol emanation rate 270
of the fresh air duct (E3), could be determined by fitting the experimental results obtained in 271
Scenario 3 with Eq. (2) using the non-linear least squares method. Consequently, the bioaerosol 272
emanation rate from the fresh air duct could be calculated. 273
In Scenario 4, the HEPA filter was removed. This scenario bore the closest resemblance to the 274
actual operating condition of the room under ACMV mode. After determining E1, E2 and E3 from 275
the previous scenarios, E0 (the rate of supply of bioaerosols from outdoors through mechanical 276
ventilation) became the only unknown parameter in Eq. (2c) for Scenario 4. Using a similar data 277
fitting method based on Scenario 4’s air sampling data, E0 could be quantified. 278
Table 2 summarizes the sources/sinks of indoor bioaerosols in each scenario. The contribution 279
to indoor bioaerosol levels by the occupants can be illustrated by comparing Scenarios 1 and 2. 280
Comparing Scenarios 2 and 3 and between Scenarios 3 and 4 reveal the contribution by the fresh 281
air duct and the introduction of outdoor bioaerosols through the mechanical ventilation, 282
respectively. 283
Two additional scenarios (Scenarios 5 and 6, as shown in Fig. 2) were defined to study the impact 284
of the AC unit on indoor bioaerosol levels. In Scenario 5, the AC unit was disconnected from the 285
fresh air duct, i.e., fresh air was supplied directly to the room without going through the AC unit. 286
A standing fan was used to maintain indoor air mixing and thermal comfort. The air flow rate of 287
the fan was 0.35 m3 s-1, which was similar to the return air flow rate of the AC unit (0.37 m3 s-1). 288
On this basis, the deposition velocity (Vd) and the resuspension rate (Rfloor) of indoor bioaerosols in 289
this scenario were assumed to be the same as those in the other scenarios. 290
The AC unit could impact indoor bioaerosol levels in two ways, bioaerosol emanation or removal 291
by its return air filter. In Scenarios 1 to 4, the AC unit operated with the return air filter and 292
contributed to indoor bioaerosol levels through these two mechanisms. Comparing Scenario 5 with 293
Scenario 4 reveals the net effect of the AC unit on indoor bioaerosol levels. Scenario 6 was designed 294
to further investigate the breakdown of these two mechanisms. In Scenario 6, the conditions were 295
almost the same as those in Scenario 4 except that the return air filter in the AC unit was removed. 296
The difference in indoor bioaerosol concentrations between Scenario 5 and Scenario 6 will reflect 297
the effects of bioaerosol emanation from the AC unit without the filtration effect of the return air 298
filter. 299
In the last scenario, Scenario 7, the room was naturally ventilated (the window was opened and 300
the AC unit was switched off) with the same standing fan used in Scenario 5 to provide thermal 301
comfort. Scenario 7 represented the condition of the room under natural ventilation mode. The 302
comparison between Scenario 7 and Scenario 4 reveals the relative efficacy of controlling indoor 303
bioaerosol levels between the natural ventilation mode and the ACMV mode. 304
After air sampling experiment in a day, the indoor floor area of the tutorial room was mopped 305
with clean water by a researcher to simulate the daily cleaning of the floor in the tutorial room on 306
weekdays. From Scenario 1 to Scenario 4 and in Scenario 6, which were operated under air-307
conditioning, the ACMV system was switched on at 9 am and off at 5 pm in a day. In these 308
scenarios, indoor temperature ranged from 24 to 25°C while indoor relative humidity (RH) ranged 309
from 64% to 68% during the experiment. In Scenario 5 and Scenario 7, which were not operated 310
under air-conditioning, indoor temperature ranged from 27 to 28°C while indoor RH was around 311
70% during the experiment. In Scenario 7, which was operated in the natural ventilation mode, the 312
window was opened at 9 am and closed at 5 pm in a day. Average indoor temperature and RH 313
during the experiment in each scenario are shown in Supplemental Material Table S1. The 314
experiments were conducted from June to September 2016, which was within the southwest 315
monsoon season in Singapore, to minimize the influence of climate change on the differences of 316
indoor bioaerosol concentrations between the scenarios. 317
318
Species Identification of Bioaerosols 319
In order to identify the species of the viable bacteria and fungi emanated from the ACMV system, 320
air sampling was conducted in two settings. In the first setting (Figs. 3 [a]), an impactor (sampler) 321
was placed at the end of the fresh air duct and connected with a reducer to isokinetically collect the 322
bioaerosols emanated from the fresh air duct while a HEPA filter was installed at the fresh air 323
intake to prevent the introduction of outdoor bioaerosols through the mechanical ventilation. As a 324
result, only the bioaerosols emanated from the fresh air duct was collected by the sampler. In the 325
second setting (Figs. 3[b]), the AC unit was disconnected from the fresh air duct. A chamber was 326
tightly connected to the return air grill of the AC unit and tapes were used to seal the gaps between 327
the chamber and the return air grill. Pure nitrogen gas was introduced into the chamber to free the 328
return ‘air’ from bioaerosols. Subsequently, a sampler was used together with the reducer to 329
isokinetically collect the bioaerosols in the supply air, which only carried the bioaerosols emanated 330
from the AC unit. 331
Air sampling was conducted in batches of 12 samples. After finishing a batch, the samples were 332
sent for incubation using the same method as described in the Supplemental Material. The colonies 333
on the incubated samples were then analysed based on their morphological characteristics using 334
standard taxonomic keys (Fotedar et al., 1991; Xu et al., 2008). This process continued until no 335
colony of new morphological characteristics was observed in the latest batch. This was to ensure 336
that all possible species were included. These agar plates were sent for species identification by the 337
DNA sequencing method. To briefly summarize, gDNA of the colonies was first extracted after 338
incubation and PCR reaction was subsequently performed to obtain the PCR product. The PCR 339
product is the fungal internal transcribed spacer (ITS) and bacterial 16s rRNA, which were targeted 340
for the DNA sequence analysis following the method described in (Luhung et al., 2017). 341
342
RESULTS AND DISCUSSION 343
Impacts of Bioaerosol Emanation from ACMV System on Indoor Concentration 344
Average indoor bioaerosol concentrations from the seven scenarios are shown in Fig. 4. The 345
averages are taken from all the air samples collected in five days (75 air samples for bacterial 346
cultivation and 75 samples for fungal cultivation) of air sampling experiment for each scenario. 347
The average indoor bacterial concentration in Scenario 2 was about twice that of Scenario 1, while 348
their difference in fungal concentration was statistically insignificant (p > 0.05). This suggests that 349
the occupants contributed significantly to the airborne bacterial concentration but had a minor 350
impact on the fungal concentration indoors. 351
The average bacterial and fungal concentrations in Scenario 3 were significantly (p < 0.05) 352
higher than their counterparts in Scenario 2, which indicated the fresh air duct as a possible source 353
of airborne bioaerosols. Surfaces of the fresh air duct were loaded with bacteria and fungi, which 354
could have originated from the deposition or growth of deposited microorganisms on the duct 355
surfaces (Batterman and Burge, 1995; Bluyssen et al., 2003). Subsequently, the microorganisms 356
on surfaces of the fresh air duct could be resuspended to form bioaerosols and transported indoors 357
(Zhou et al., 2011; You and Wan, 2014). 358
The difference in the average bacterial concentrations between Scenario 3 and 4 was statistically 359
insignificant (p > 0.05). However, the average fungal concentration in Scenario 4 was almost triple 360
that of Scenario 3. This suggested that the fresh air intake had minor impacts on the bacterial 361
concentration but was a major (or even the dominant) contributor to the indoor fungal 362
concentration. It is also worth noting that this significant introduction of fungi from outdoors 363
through the mechanical ventilation was observed even though there was a MERV-8 rating filter 364
installed in the fresh air duct. 365
The difference in the average bacterial concentration between Scenario 5 and Scenario 4 was 366
also statistically insignificant (p > 0.05). However, the fungal concentration in Scenario 5 was 47% 367
higher than that in Scenario 4. This indicated that the AC unit had a significant effect on removing 368
fungi but had a minor effect on removing bacteria. Both the average bacterial and fungal 369
concentrations in Scenario 6 were significantly higher than those in Scenario 5 (p < 0.05). This 370
indicated the net effect of bioaerosol emanation from the AC unit (without removal of bioaerosols 371
by the return air filter). 372
Scenario 4 (ACMV mode) had a significantly lower average fungal concentration (p < 0.05) than 373
Scenario 7 (natural ventilation mode). The average bacterial concentration in Scenario 4 was about 374
30% higher than that in Scenario 7. This indicated that the ACMV mode was effective in 375
controlling the fungal level but led to a higher bacterial level as compared to natural ventilation. 376
This was caused by the bioaerosol emanation from the ACMV system and will be further 377
investigated in subsequent sections. The measured AER in the natural ventilation mode was about 378
double of that in the ACMV mode, leading to a higher introduction of outdoor fungi through the 379
ventilation in the former. 380
381
Bioaerosol Emanation Rates 382
The average bacterial loading on the floor of the seven scenarios was calculated to be 2.6 × 10⁵ 383
CFU m-2 by averaging all the measurement results of bacterial loadings from the seven scenarios 384
(126 surface samples in total) and the average fungal loading was calculated to be 1.8 × 10⁴ CFU 385
m-2 using the same method. As shown in Supplemental Material Table S2, variation of both the 386
bacterial and fungal loadings on the floor of the seven scenarios were insignificant, which might 387
be due to the constant supply air flow rate, the constant indoor activity during the experiment and 388
the regular cleaning after every day’s experiment. Therefore, the calculated average bacterial and 389
fungal loadings on the floor of the seven scenarios are used as their floor surface loading Nfloor in 390
the Eq. (1) respectively. As an initial estimate, the rate of bioaerosol resuspension from the floor 391
(RfloorNfloorA) was calculated to be 0.024 CFU s-1 for bacteria and 0.003 CFU s-1 for fungi. 392
Using Eq. (2) to fit the experimental data from Scenario 1 through the non-linear least squares 393
method, the emanation rates of the AC unit (E2) for bacteria and fungi were found to be 0.87 CFU 394
s-1 and 2.96 CFU s-1, respectively. The experimental results of Scenario 1 and the fitted curve of 395
Eq. (2) are shown in Supplemental Material Fig. S1. 396
Using a similar fitting method for the experimental results obtained in Scenario 2 (Fig. S2, 397
Supplemental Material), E1 for bacteria and fungi were determined to be 1.11 CFU s-1 and 0.07 398
CFU s-1, respectively. Since there were two occupants in the current experimental setting, it could 399
be estimated that the contribution from each occupant to bacteria is at a rate of 0.56 CFU s-1 and 400
fungi at a rate of 0.035 CFU s-1. 401
The Bioaerosol emanation rate of the fresh air duct (E3), could be determined by fitting the 402
experimental results obtained in Scenario 3 (Fig. S3, Supplemental Material) with Eq. (2) using the 403
non-linear least squares method. Consequently, the emanation rate from the fresh air duct were 404
calculated as 1.53 CFU s-1 and 0.94 CFU s-1 for bacteria and fungi, respectively. 405
After determining E1, E2 and E3 from the previous scenarios, E0 (the rate of supply of bioaerosols 406
from outdoors through the mechanical ventilation) became the only unknown parameter in Eq. (2) 407
for Scenario 4. Using a similar data fitting method based on Scenario 4’s air sampling data (Fig. 408
S4, Supplemental Material), E0 was calculated to be 1.64 CFU s-1 for bacteria and 8.48 CFU s-1 for 409
fungi. 410
Bioaerosol emanation rates E0, E1, E2 and E3, determined by experimental data fitting method 411
described above and the bioaerosol emanation rate due to resuspension from the floor are 412
summarized in Fig. 5. The result showed that the introduction of outdoor fungi through the 413
mechanical ventilation (E0) served as the dominant source of indoor airborne fungi. The second 414
largest contributor to indoor airborne fungi was the emanation from the AC unit (E2) but the 415
emanation rate is smaller than E0 by a large margin. The combined fungal emanation rate from the 416
sources related to the ACMV system (E2 + E3) was only about half of E0. This echoed the 417
observation from air sampling data (Fig. 4 comparison between Scenario 4 & 7) that using the 418
ACMV system was an effective measure to reduce indoor airborne fungal level, compared to 419
natural ventilation. 420
Emanation rates of bacteria from the four sources (E0, E1, E2 and E3) in the current experimental 421
setting were of similar magnitude. The combined bacterial emanation rate due to ACMV-related 422
sources (E2 + E3) out-weighted the emanation rate due to the introduction of outdoor bacteria 423
through the mechanical ventilation (E0). It suggested that using the ACMV system could lead to 424
higher indoor airborne bacterial concentration compared to natural ventilation. This matches the 425
observation from air sampling data (Fig. 4, comparison between Scenario 4 & 7). The occupant 426
density in the current experimental setting was 18 m2 person-1, similar to the typical office 427
environment of 20 m2 person-1 (Kim and Haberl, 2012). However, for indoor environments with 428
higher occupant densities, e.g., classrooms (2.9 to 4 m2 person-1) or shopping malls (2.5 m2 person-429
1) (ASHRAE, 2004), bacteria emanation from occupants is expected to become the dominant 430
source for indoor airborne bacteria. 431
432
Species of Bioaerosol Emanated from the ACMV System 433
The species of bioaerosol samples collected from the fresh air duct (Figs. 3[a]) and those 434
collected from the AC unit (Figs. 3[b]) were identified using the DNA sequencing method. The 435
identified bacterial and fungal species are shown in Fig. 6 and Fig. 7 respectively. A number of 24 436
bioaerosol species from the fresh air duct and that of 39 bioaerosol species from the AC unit were 437
identified. The number of bacterial species identified in the fresh air duct is close to that identified 438
in the AC unit. In contrast, many more fungal species were identified in the AC unit than that 439
identified in the fresh air duct, as shown in Fig. 7. A possible reason is that the fresh air duct only 440
exposes to fresh air whereas the AC unit exposes to both the fresh air and the room return air. The 441
room return air could contain more fungal species that are not in the fresh air, e.g., species shed 442
from the occupants. 443
Some of the identified bacterial and fungal species are potential pathogenic species, as listed in 444
the Updated Biological Agents and Toxins List (Ministry of Health Singapore, 2017). Among the 445
identified bacterial species, three species in the Staphylococcus genera, Staphylococcus cohnii 446
sub.urealyticum, which can cause catheters and urinary tract infection in immunocompromised 447
patients (Shahandeh et al., 2015), Staphylococcus warneri, which might cause catheter-related 448
infection (Kamath et al., 1992), and Staphylococcus capitis, which might cause prosthetic joint 449
infection (Tevell et al., 2017), were found in the bioaerosol emanation from the ACMV system. A 450
potential pathogenic bacterial species, Moraxella osloensis, which populate on the skin and mucosa 451
of humans (Yamada et al., 2019), was only observed to be emanated from the AC unit, suggesting 452
its transportation from occupants through room air recirculation and accumulation in the ACMV 453
system. 454
All the potential pathogenic fungal species found in the ACMV system belong to the Aspergillus 455
genera. Aspergillus fumigatus, which was found to be emanated from the fresh air duct, is a listed 456
potential pathogenic fungal species (Ministry of Health Singapore, 2017). Despite not being listed, 457
the other two species from this genera, Aspergillus sydowii and Aspergillus versicolor, were also 458
reported to be associated with several human diseases including the building-associated pulmonary 459
diseases (Hodgson et al., 1998; Liu et al., 2017). The results of species identification indicate that 460
potential pathogens, including those emanated from occupants, could accumulate in the ACMV 461
system and subsequently being transported into the indoor space. 462
463
Mitigation of indoor bioaerosol pollution by ACMV cleaning 464
Results of the current study show that the ACMV system can be a significant source of indoor 465
bioaerosols, especially bacteria. In order to investigate the potential mitigation of indoor bioaerosol 466
pollution by better cleaning of the ACMV system, three hypothetical cases were simulated using 467
Eq. (2): 468
1. Bioaerosol emanation of the fresh air duct was removed by setting E3 = 0 (HYPO 1), simulating 469
a cleaning of the fresh air duct. For bacteria, E0 = 1.64 CFU s-1, E1 = 1.11 CFU s-1, E2 = 0.87 470
CFU s-1. For fungi, E0 = 8.48 CFU s-1, E1 = 0.07 CFU s-1, E2 = 2.96 CFU s-1. 471
2. Bioaerosol emanation of the AC unit was removed by setting E2 = 0 (HYPO 2), simulating a 472
cleaning of the AC unit. For bacteria, E0 = 1.64 CFU s-1, E1 = 1.11 CFU s-1, E3 = 1.53 CFU s-1. 473
For fungi, E0 = 8.48 CFU s-1, E1 = 0.07 CFU s-1, E3 = 0.94 CFU s-1. 474
3. Bioaerosol emanation of the ACMV system was removed by setting E2 = E3 =0 (HYPO 3), 475
simulating a cleaning of the entire ACMV system. For bacteria, E0 = 1.64 CFU s-1, E1 = 1.11 476
CFU s-1. For fungi, E0 = 8.48 CFU s-1, E1 = 0.07 CFU s-1. 477
The environmental parameters described before were used in this simulation. The AER and the 478
bioaerosol emanation rates of sources in Scenario 4 were used as inputs for the simulation. These 479
inputs are summarised in Table 1 and Table 2. The three hypothetical cases were compared to the 480
fitting of air sampling data obtained in Scenario 4 using Eq. (2), which was used as the reference 481
case in this comparison due to the fact that this scenario bore the closest resemblance to the actual 482
operating condition of the room under ACMV mode. The five-day average indoor bioaerosol 483
concentration at 9:30 am in Scenario 4 was used as the initial bioaerosol concentration C0 in the 484
simulation (132.86 CFU m-3 for bacteria and 372.20 CFU m-3 for fungi). Simulation results are 485
shown in Fig. 8. 486
Compared to the reference case (Scenario 4), daily-integrated average indoor airborne bacterial 487
concentration drops by 28% in HYPO 1, 17% in HYPO 2 and 45% in HYPO 3. Similarly, daily-488
integrated average indoor airborne fungal concentration drops by 8% in HYPO 1, 26% in HYPO 2 489
and 34% in HYPO 3. The results indicate that significant mitigation of indoor bioaerosol pollution 490
can be achieved if the hygiene of the ACMV system is improved. The air sampling results discussed 491
in earlier sections suggested that the ACMV mode leads to a higher indoor airborne bacterial 492
concentration compared to the natural ventilation mode. A major contributor to that is the bacterial 493
emanation from the ACMV system (E2 and E3). The HYPO 3 simulation results show that when 494
the bioaerosol emanation from the ACMV system is removed, the average indoor airborne bacterial 495
concentration will drop to about 50 CFU m-3, which is around 30% less than the average indoor 496
airborne bacterial concentration under natural ventilation in Scenario 7 (about 72 CFU m-3). 497
498
Limitations 499
In this study, the culture-based method is employed, and this method is limited to the 500
investigation of the viable portion of bioaerosols. However, non-viable bioaerosols can also cause 501
health problems and the investigation of the non-viable portion of bioaerosol emanation from 502
ACMV systems is needed to have a comprehensive understanding of its role as a bioaerosol source. 503
Further study should be conducted to investigate the contamination and emanation of non-viable 504
bioaerosols from ACMV systems. 505
The accuracy of the culture-based method is largely limited by colony formation. Since the 506
impactor used has 200 holes, the maximum number of colonies countable on a sampling plate is 507
200. Too long a sampling time could cause overlapping of colonies on the sampling plate whereas 508
too short a sampling time could lead to too few numbers of colonies on the sampling plate and thus 509
high level of error (Sutton, 2011). This study used a sampling time of 10 minutes which gave colony 510
counts ranging from 25 to 200 on most of the sampling plates, as recommended by Sutton (2011). 511
In the experimental room, the existence of bioaerosol sources might lead to a spatial 512
inhomogeneity of indoor bioaerosol concentrations from Scenario 1 to 4, where the experimental 513
data was used to quantify the contribution of bioaerosol sources using the indoor bioaerosol model 514
with a well-mixed assumption (Eq. [1]). From Scenario 1 to 4, the experimental room had a 515
relatively low air exchange rate (0.516-0.6 h-1) combined with a relatively high air recirculation 516
rate (around 13 h-1), suggesting that the indoor air convection could rapidly and effectively mix the 517
indoor air during the 7 hours’ experiment in a day (Nazaroff and Cass, 1986) in these scenarios. In 518
addition, bioaerosol concentration gradient due to deposition and resuspension only exits very close 519
to the indoor surfaces (Lai and Nazaroff, 2000), indicating a reasonable hypothesis that the indoor 520
bioaerosols were well mixed. 521
522
CONCLUSION 523
Bioaerosol emanation from an ACMV system and its impact on indoor bioaerosol pollution is 524
investigated experimentally in an indoor environment in tropical Singapore. Surface and air 525
sampling are conducted followed by culture-based analysis and species analysis. Bioaerosol 526
species originated from both the outdoor and indoor sources, including the potential pathogenic 527
species emanated from occupants (Moraxella osloensis), can be found in the ACMV system. This 528
indicates the role of the ACMV system in indoor bioaerosol pollution as a potential pathogen source,529
where bioaerosols can accumulate and be emanated. The dominating contributor to indoor airborne 530
fungi is the introduction of outdoor fungi through the mechanical ventilation, which is about double 531
of the contribution by the emanation from the ACMV system. This is backed by the fact that the 532
average indoor airborne fungal concentration measured during the ACMV mode is about half of 533
that measured during the natural ventilation mode. For bacteria, the emanation from the ACMV 534
system is the largest contributor to indoor airborne bacterial concentration compared to other 535
sources (the introduction of outdoor bacteria through the mechanical ventilation, the occupants’ 536
emanation and the floor resuspension). The air sampling results suggest that operating the room in 537
ACMV mode results in a higher indoor airborne bacterial concentration than that in natural 538
ventilation mode (by 30%). Bacterial emanation from the occupants is a significant source, but 539
fungal emanation from the occupants is minimal. By cleaning the ACMV system, the indoor 540
airborne fungal and bacterial concentrations can be reduced by 34% and 45%, respectively. 541
Keeping the ACMV system clean can maintain both the indoor airborne fungal and bacterial 542
concentrations lower than those using natural ventilation. 543
544
ACKNOWLEDGEMENTS 545
This work was funded by Republic of Singapore’s Ministry of Education through grant no. 546
RG190/14 and MOE2016-T2-1-063 as well as Republic of Singapore's National Research 547
Foundation through a grant to the Berkeley Education Alliance for Research in Singapore 548
(BEARS) for the Singapore-Berkeley Building Efficiency and Sustainability in the Tropics 549
(SinBerBEST) Program. 550
551
552
553
REFERENCES 554 555
ASHRAE, A. (2004). Ashrae 62.1-2010 Ventilation for Acceptable Indoor Air Quality. Atlanta, 556
GA. 557
ASHRAE, A. S. (2017). Standard 52.2-2017. Method of testing general ventilation air cleaning 558
devices for removal efficiency by particle size, in. American Society of Heating, Refrigerating, 559
and Air Conditioning Engineers, Inc. Atlanta 560
Aziz, A.A., Sumiyoshi, D. and Akashi, Y. (2017). Low Cost Humidity Controlled Air-561
Conditioning System for Building Energy Savings in Tropical Climate. Journal of Building 562
Engineering 11: 9-16. 563
Batterman, S.A. and Burge, H. (1995). Hvac Systems as Emission Sources Affecting Indoor Air 564
Quality: A Critical Review. HVAC&R Research 1: 61-78. 565
Beck, J.M., Young, V.B. and Huffnagle, G.B. (2012). The Microbiome of the Lung. Translational 566
Research 160: 258-266. 567
Berrington, W.R. and Hawn, T.R. (2013). Human Susceptibility to Legionnaires’ Disease, In 568
Legionella, Springer, pp. 541-551. 569
Bluyssen, P.M., Cox, C., Seppänen, O., de Oliveira Fernandes, E., Clausen, G., Müller, B. and 570
Roulet, C.-A. (2003). Why, When and How Do Hvac-Systems Pollute the Indoor Environment 571
and What to Do About It? The European Airless Project. Building and Environment 38: 209-572
225. 573
Bonetta, S., Bonetta, S., Mosso, S., Sampò, S. and Carraro, E. (2010). Assessment of 574
Microbiological Indoor Air Quality in an Italian Office Building Equipped with an Hvac 575
System. Environmental monitoring and assessment 161: 473-483. 576
Burroughs, H.B. (2005). Filtration and Building Security. ASHRAE journal 47: 24. 577
Chen, A., Cao, Q., Zhou, J., Yang, B., Chang, V.W.-C. and Nazaroff, W.W. (2016). Indoor and 578
Outdoor Particles in an Air-Conditioned Building During and after the 2013 Haze in 579
Singapore. Building and Environment 99: 73-81. 580
Chen, A. and Chang, V.W.-C. (2012). Human Health and Thermal Comfort of Office Workers in 581
Singapore. Building and Environment 58: 172-178. 582
Cheong, K. and Lau, H. (2003). Development and Application of an Indoor Air Quality Audit to 583
an Air-Conditioned Tertiary Institutional Building in the Tropics. Building and Environment 584
38: 605-616. 585
Cole, E.C. and Cook, C.E. (1998). Characterization of Infectious Aerosols in Health Care Facilities: 586
An Aid to Effective Engineering Controls and Preventive Strategies. American journal of 587
infection control 26: 453-464. 588
Daniels, C.C., Rogers, P.D. and Shelton, C.M. (2016). A Review of Pneumococcal Vaccines: 589
Current Polysaccharide Vaccine Recommendations and Future Protein Antigens. The Journal 590
of Pediatric Pharmacology and Therapeutics 21: 27-35. 591
Du, P., Du, R., Lu, Z., Ren, W. and Fu, P. (2018). Variation of Bacterial and Fungal Community 592
Structures in Pm2. 5 Collected During the 2014 Apec Summit Periods. Aerosol and Air Quality 593
Research 18: 444-455. 594
Fan, H., Li, X., Deng, J., Da, G., Gehin, E. and Yao, M. (2017). Time-Dependent Size-Resolved 595
Bacterial and Fungal Aerosols in Beijing Subway. Aerosol and Air Quality Research 17: 799-596
809. 597
Fotedar, R., Shriniwas, U.B. and Verma, A. (1991). Cockroaches (Blattella Germanica) as Carriers 598
of Microorganisms of Medical Importance in Hospitals. Epidemiology & Infection 107: 181-599
187. 600
Green, C.F., Scarpino, P.V. and Gibbs, S.G. (2003). Assessment and Modeling of Indoor Fungal 601
and Bacterial Bioaerosol Concentrations. Aerobiologia 19: 159-169. 602
Hammamieh, R., Muhie, S., Borschel, R., Gautam, A., Miller, S.-A., Chakraborty, N. and Jett, M. 603
(2016). Temporal Progression of Pneumonic Plague in Blood of Nonhuman Primate: A 604
Transcriptomic Analysis. PloS one 11: e0151788. 605
Hargreaves, M., Parappukkaran, S., Morawska, L., Hitchins, J., He, C. and Gilbert, D. (2003). A 606
Pilot Investigation into Associations between Indoor Airborne Fungal and Non-Biological 607
Particle Concentrations in Residential Houses in Brisbane, Australia. Science of the Total 608
Environment 312: 89-101. 609
Hathway, E., Noakes, C., Sleigh, P. and Fletcher, L. (2011). Cfd Simulation of Airborne Pathogen 610
Transport Due to Human Activities. Building and Environment 46: 2500-2511. 611
Heseltine, E. and Rosen, J. (2009). Who Guidelines for Indoor Air Quality: Dampness and Mould. 612
WHO Regional Office Europe. 613
Hodgson, M.J., Morey, P., Leung, W.-Y., Morrow, L., Miller, D., Jarvis, B.B., Robbins, H., Halsey, 614
J.F. and Storey, E. (1998). Building-Associated Pulmonary Disease from Exposure 615
Tostachybotrys Chartarum and Aspergillus Versicolor. Journal of Occupational and 616
Environmental Medicine 40: 241-249. 617
Iyengar, R.S. (2014). The Decentralized Approach to Achieve Comfortable Indoor Environments 618
in Tropical Climates Using Low-Exergy Techniques of Integrated Design, ETH Zurich. 619
Jutel, M., Agache, I., Bonini, S., Burks, A.W., Calderon, M., Canonica, W., Cox, L., Demoly, P., 620
Frew, A.J. and O'hehir, R. (2016). International Consensus on Allergen Immunotherapy Ii: 621
Mechanisms, Standardization, and Pharmacoeconomics. Journal of Allergy and Clinical 622
Immunology 137: 358-368. 623
Kamath, U., Singer, C. and Isenberg, H. (1992). Clinical Significance of Staphylococcus Warneri 624
Bacteremia. Journal of clinical microbiology 30: 261-264. 625
Kauffman, H.F. and van der Heide, S. (2003). Exposure, Sensitization, and Mechanisms of Fungus-626
Induced Asthma. Current allergy and asthma reports 3: 430-437. 627
Kim, H. and Haberl, J.S. (2012). Field-Test of the New Ashrae/Cibse/Usgbc Performance 628
Measurement Protocols: Intermediate and Advanced Level Indoor Environmental Quality 629
Protocols. ASHRAE transactions 118. 630
Kim, K.-H., Kabir, E. and Jahan, S.A. (2017). Airborne Bioaerosols and Their Impact on Human 631
Health. Journal of Environmental Sciences. 632
King, M.-F., Noakes, C., Sleigh, P. and Camargo-Valero, M. (2013). Bioaerosol Deposition in 633
Single and Two-Bed Hospital Rooms: A Numerical and Experimental Study. Building and 634
Environment 59: 436-447. 635
Lai, A. C., & Nazaroff, W. W. (2000). Modeling indoor particle deposition from turbulent flow 636
onto smooth surfaces. Journal of aerosol science, 31(4), 463-476. 637
Lai, A.C. (2002). Particle Deposition Indoors: A Review. Indoor air 12: 211-214. 638
Lal, H., Ghosh, B., Srivastava, A. and Srivastava, A. (2017). Identification and Characterization of 639
Size-Segregated Bioaerosols at Different Sites in Delhi. Aerosol and Air Quality Research 17: 640
1570-1581. 641
Liu, S., Wang, H., Su, M., Hwang, G.J., Hong, J. and Jung, J.H. (2017). New Metabolites from the 642
Sponge-Derived Fungus Aspergillus Sydowii J05b-7f-4. Natural product research 31: 1682-643
1686. 644
Lu, Z., Lu, W., Zhang, J. and Sun, D. (2009). Microorganisms and Particles in Ahu Systems: 645
Measurement and Analysis. Building and Environment 44: 694-698. 646
Luhung, I., Wu, Y., Xu, S., Yamamoto, N., Chang, V.W.-C. and Nazaroff, W.W. (2017). DNA 647
Accumulation on Ventilation System Filters in University Buildings in Singapore. PloS one 648
12: e0186295. 649
Macher, J.M. (1989). Positive-Hole Correction of Multiple-Jet Impactors for Collecting Viable 650
Microorganisms. American Industrial Hygiene Association Journal 50: 561-568. 651
Madsen, A.M., Larsen, S.T., Koponen, I.K., Kling, K.I., Barooni, A., Karottki, D.G., Tendal, K. 652
and Wolkoff, P. (2016). Generation and Characterization of Indoor Fungal Aerosols for 653
Inhalation Studies. Applied and environmental microbiology: AEM. 04063-04015. 654
Milton, D. K., Glencross, P. M., & Walters, M. D. (2000). Risk of indoor airborne infection 655
transmission estimated from carbon dioxide concentration. Indoor air, 10(4), 212-221. 656
Ministry of Health Singapore (2017), Updated Biological Agents and Toxins List, 657
https://www.moh.gov.sg/docs/librariesprovider7/news-updates 658
documents/list_of_biological_agents_and_toxins.pdf, access date: August 2017 659
Nazaroff, W. W., & Cass, G. R. (1986). Mathematical modeling of chemically reactive pollutants 660
in indoor air. Environmental Science & Technology, 20(9), 924-934. 661
Nazaroff, W.W. (2016). Indoor Bioaerosol Dynamics. Indoor Air 26: 61-78. 662
Pedersen, M.K., Andersen, A.B., Andersen, P.H., Svensson, E., Jensen, S.G. and Lillebaek, T. 663
(2016). Occupational Tuberculosis in Denmark through 21 Years Analysed by Nationwide 664
Genotyping. PloS one 11: e0153668. 665
Scheff, P.A., Paulius, V.K., Curtis, L. and Conroy, L.M. (2000). Indoor Air Quality in a Middle 666
School, Part Ii: Development of Emission Factors for Particulate Matter and Bioaerosols. 667
Applied Occupational and Environmental Hygiene 15: 835-842. 668
Schmidt, M.G., Attaway, H.H., Terzieva, S., Marshall, A., Steed, L.L., Salzberg, D., Hamoodi, 669
H.A., Khan, J.A., Feigley, C.E. and Michels, H.T. (2012). Characterization and Control of the 670
Microbial Community Affiliated with Copper or Aluminum Heat Exchangers of Hvac 671
Systems. Current microbiology 65: 141-149. 672
Shahandeh, Z., Shafi, H. and Sadighian, F. (2015). Association of Staphylococcus Cohnii 673
Subspecies Urealyticum Infection with Recurrence of Renal Staghorn Stone. Caspian journal 674
of internal medicine 6: 40. 675
Siegel, J. and Carey, V.P. (2001). Fouling of Hvac Fin and Tube Heat Exchangers, In Lawrence 676
Berkeley National Laboratory. 677
Siegel, J.A. (2002). Particulate Fouling of Hvac Heat Exchangers, University of California, 678
Berkeley. 679
Singapore Standards Council. (2016). Singapore Standard SS 554: 2016: Code of Practice for 680
Indoor Air Quality for Air-Conditioned Buildings. Building and Construction Standards 681
Committe. 682
Sutton, S. (2011). Accuracy of plate counts. Journal of validation technology, 17(3), 42-46. 683
Tevell, S., Hellmark, B., Nilsdotter-Augustinsson, Å. and Söderquist, B. (2017). Staphylococcus 684
Capitis Isolated from Prosthetic Joint Infections. European Journal of Clinical Microbiology 685
& Infectious Diseases 36: 115-122. 686
Thatcher, T.L. and Layton, D.W. (1995). Deposition, Resuspension, and Penetration of Particles 687
within a Residence. Atmospheric Environment 29: 1487-1497. 688
Vesper, S., McKinstry, C., Haugland, R., Neas, L., Hudgens, E., Heidenfelder, B. and Gallagher, 689
J. (2008). Higher Environmental Relative Moldiness Index (Ermism) Values Measured in 690
Detroit Homes of Severely Asthmatic Children. Science of the total environment 394: 192-691
196. 692
Whyte, W. and Derks, M. (2015). Airborne Particle Deposition in Cleanrooms: Deposition 693
Mechanisms. Clean Air and Containment Review 24: 4-9. 694
Wiedinmyer, C., Bowers, R.M., Fierer, N., Horanyi, E., Hannigan, M., Hallar, A.G., McCubbin, I. 695
and Baustian, K. (2009). The Contribution of Biological Particles to Observed Particulate 696
Organic Carbon at a Remote High Altitude Site. Atmospheric Environment 43: 4278-4282. 697
Wiedinmyer, C., Guenther, A., Harley, P., Hewitt, N., Geron, C., Artaxo, P., Steinbrecher, R. and 698
Rasmussen, R. (2004). Global Organic Emissions from Vegetation, In Emissions of 699
Atmospheric Trace Compounds, Springer, pp. 115-170. 700
Wu, Y., Chen, A., Luhung, I., Gall, E.T., Cao, Q., Chang, V.W.-C. and Nazaroff, W.W. (2016). 701
Bioaerosol Deposition on an Air-Conditioning Cooling Coil. Atmospheric Environment 144: 702
257-265. 703
Xu, L., Zhou, L., Zhao, J., Li, J., Li, X. and Wang, J. (2008). Fungal Endophytes from Dioscorea 704
Zingiberensis Rhizomes and Their Antibacterial Activity. Letters in Applied Microbiology 46: 705
68-72. 706
Yamada, A., Kasahara, K., Ogawa, Y., Samejima, K., Eriguchi, M., Yano, H., Mikasa, K. and 707
Tsuruya, K. (2019). Peritonitis Due to Moraxella Osloensis: A Case Report and Literature 708
Review. Journal of Infection and Chemotherapy. 709
You, S. and Wan, M.P. (2014). Particle Concentration Dynamics in the Ventilation Duct after an 710
Artificial Release: For Countering Potential Bioterrorist Attack. Journal of hazardous 711
materials 267: 183-193. 712
Zhao, B. and Wu, J. (2006). Modeling Particle Deposition from Fully Developed Turbulent Flow 713
in Ventilation Duct. Atmospheric Environment 40: 457-466. 714
Zhao, B. and Wu, J. (2009). Particulate Pollution in Ventilated Space: Analysis of Influencing 715
Factors. Journal of hazardous materials 163: 454-462. 716
Zhou, B., Zhao, B. and Tan, Z. (2011). How Particle Resuspension from Inner Surfaces of 717
Ventilation Ducts Affects Indoor Air Quality—a Modeling Analysis. Aerosol Science and 718
Technology 45: 996-1009. 719
720
721
722
Table 1. Specific parameters used in indoor bioaerosol model. 729 Bacteria Fungi Reference 0.5 -1 µm 1 – 2.5 µm 2 - 3 µm 3 - 4 µm Indoor resuspension ratea (Rfloor, 10-10 s-1) 1.22 50 50 50 (Zhou et
al., 2011) Indoor deposition velocity* (Vd, 10-5 m s-1) 1.67 9.72 9.72 36.1 (Zhou et
al., 2011) Filtration efficiency of the return air filter* (η1)
0.04 0.09 0.12 0.12 (Burroughs, 2005)
aApplicable range of aerodynamic diameter (μm) - Bacteria: 0.5 ~ 2.5 µm (Wiedinmyer et al., 2004; Wiedinmyer et al., 2009), Fungi: 2 - 4 µm (Madsen et al., 2016) .
730
731
Table 2. Details of indoor bioaerosol sources in the experimental scenarios. 732
Sources / sinks of indoor bioaerosols
AER
Introduction of outdoor bioaerosols
through ventilation
E0
Number of human
occupants
E1
AC unit Fresh air
duct
E3 Window
Emanation
E2
Filtration by RAF
η1
Scenario 1 0.516 No 0 Yes Yes No Close
Scenario 2 0.516 No 2 Yes Yes No Close
Scenario 3 0.588 No 2 Yes Yes Yes Close
Scenario 4 0.69 Yes 2 Yes Yes Yes Close
Scenario 5a 0.69 Yes 2 No No Yes Close
Scenario 6b 0.69 Yes 2 Yes No Yes Close
Scenario 7 1.63 Yes 2 No No No Open
aThe AC unit is switched OFF and disconnected from the fresh air duct bThe filter in the AC unit is taken off. RAF – return air filter, AER – air exchange rate (hr-1). Bioaerosol resuspension from the floor occurs in all scenarios.
733
734
735
736
737
738
739
740
741
742
List of Figures 743
Fig. 1. Schematic diagram of the experimental tutorial room. 744
Fig. 2. Experimental setup for the seven scenarios. 745
Figs. 3. Experimental setup for species identification. 746
Fig. 4. Average indoor bioaerosol concentrations. Error bars show the standard error of mean from 747
the five days’ samples. 748
Fig. 5. Estimated bioaerosol emanation rates of bioaerosol sources. 749
Fig. 6. Identified bacterial species emanated from the ACMV system. 750
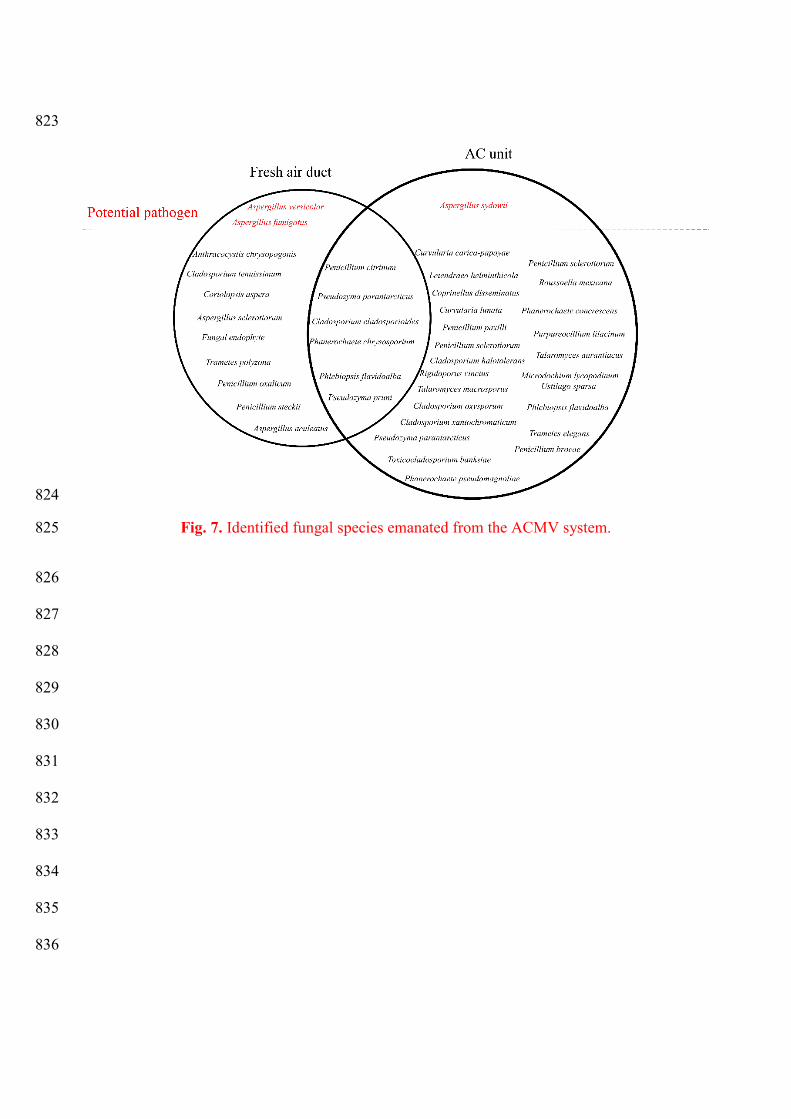
Fig. 7. Identified fungal species emanated from the ACMV system. 751
Fig. 8. Indoor bioaerosol concentrations (CFU m-3) in the three hypothetical cases and the 752
reference case (fitting of Scenario 4). 753
754
755
756
757
758
759
760
761
762
Fig. 1. Schematic diagram of the experimental tutorial room. 763
764
765
766
767
768
769
770
771
772
773
774
Scenario 1 Scenario 2
Scenario 3 Scenario 4
Scenario 5 Scenario 6
775 Scenario 7 776
Fig. 2. Experimental setup for the seven scenarios. 777
778
779
780
(a) Bioaerosol sampling in the fresh air duct (b) Bioaerosol sampling in the AC unit
Figs. 3. Experimental setup for species identification. 781
782
783
784
785
786
787
788
789
790
791
792
793
794
795
796
797
798
799
Fig. 4. Average indoor bioaerosol concentrations. Error bars show the standard error of mean 800
from the five days’ samples. 801
802
803
804
805
806
807
808
809
810
811
812
813
814
815
Fig. 5. Estimated bioaerosol emanation rates of bioaerosol sources. 816
817
818
0
1
2
3
4
5
6
7
8
9
10
Bio
aero
sol e
mis
sion
rate
s (C
FU s-1
) Bacteria
Fungi
1.640.87
2.96
1.530.94
1.11
0.07 0.024E0 E1 E2 E3
Introduction of outdoor bioaerosols through
mechanical ventilation
Occupants AC unit Fresh air duct Resuspension from the floor
8.48
0.003
823
824
Fig. 7. Identified fungal species emanated from the ACMV system. 825
826
827
828
829
830
831
832
833
834
835
836