iWorx Physiology Lab Experiment
iWorx Systems, Inc.
www.iworx.com
iWorx Systems, Inc.
62 Littleworth Road, Dover, New Hampshire 03820
(T) 800-234-1757 / 603-742-2492 (F) 603-742-2455
LabScribe2 is a trademark of iWorx Systems, Inc.
©2013 iWorx Systems, Inc.
Experiment AM-2
Skeletal Muscle, Summation
and Tetanus
Note: The lab presented here is intended for evaluation
purposes only. iWorx users should refer to the User
Area on www.iworx.com for the most current versions of
labs and LabScribe2 Software.
Experiment AM-2: Skeletal Muscle, Summation and Tetanus
Background
About 40% of the total body mass of a human is skeletal muscle. Skeletal muscle is intimately
associated with the skeletal system and, combined, these muscles and bones are responsible for
supporting and moving the body. While skeletal muscle fibers have sarcomeres and the same banded
appearance, different muscles can contract in different ways. For example, some are relatively weak
and fatigue resistant, while others are strong but fatigue quickly. These features may be explained in
terms of the biochemical properties of muscles. The muscle fibers found in most mammalian skeletal
muscles are either fast or slow twitch-types. Each type has a different myosin isoform, with different
rates of ATPase activity and cross-bridge binding. Within the group of fast-twitch fibers, there are
fibers that use glycolysis and oxidative phosphorylation. There are also fast-twitch fibers that just use
glycolysis; this group is less reliant upon oxygen and is much stronger than the fibers using
phosphorylation. However, these stronger “glycolytic” fibers breakdown glucose very inefficiently; so,
they fatigue more quickly, have diminished glucose levels, and accumulate lactic acid.
Most skeletal muscles are composed of some combination of the different twitch-type fibers.
Interestingly, a motor neuron makes only one synapse on each of their target fibers, and the muscle
fibers innervated by a motor neuron are all of the same type. Therefore, stimulation of a particular
motor neuron will create a contraction of only one muscle fiber type; this property is used by the brain
to recruit different muscle fibers into a contraction. Activity in descending tracts excites the spinal
motor neurons; but, the size of the cell bodies and the activation thresholds of these neurons are
different. motor neurons that supply weak, slow, oxidative fibers have the lowest threshold; those
innervating fast, intermediate-strength oxidative fibers have higher thresholds; and those that supply
the fast, strong, glycolytic fibers have the highest thresholds. In this way increasing the amount of
activity descending from the brain activates progressively more motor neurons, and more of the
stronger muscle fibers, into the response. This will be simulated in the following experiment by slowly
increasing the voltage applied directly to the muscle to recruit more muscle fibers into the contraction.
In addition, the amount of contraction is dependent upon stimulus frequency.
Animal Muscle-Summation-Tetanus-LS2-Background AM-2-1
Experiment AM-2: Skeletal Muscle, Summation and Tetanus
Equipment Required
PC Computer
IXTA data acquisition unit
USB cable
IXTA power supply
FT-302 Force transducer
A-BST-100 Stimulating electrodes
Ring stand and clamps
Femur clamp
Weight pan
Thread
15 cm Ruler
Amphibian Ringer's solution (See appendix)
IXTA Setup
1. Place the IXTA on the bench, close to the computer.
2. Check Figure T-1-1 in the Tutorial chapter for the location of the USB port and the power
socket on the IXTA.
3. Check Figure T-1-2 in the Tutorial chapter for a picture of the IXTA power supply.
4. Use the USB cable to connect the computer to the USB port on the rear panel of the IXTA.
5. Plug the power supply for the IXTA into the electrical outlet. Insert the plug on the end of the
power supply cable into the labeled socket on the rear of the IXTA. Use the power switch to
turn on the unit. Confirm that the red power light is on.
Start the Software
1. Click on the LabScribe shortcut on the computer’s desktop to open the program. If a shortcut is
not available, click on the Windows Start menu, move the cursor to All Programs and then to
the listing for iWorx. Select LabScribe from the iWorx submenu. The LabScribe Main window
will appear as the program opens.
2. On the Main window, pull down the Settings menu and select Load Group.
3. Locate the folder that contains the settings group, IPLMv4Complete.iwxgrp. Select this group
and click Open.
4. Pull down the Settings menu again. Select the Skeletal Muscle-Summation-Tetanus-LS2
Animal Muscle-Summation-Tetanus-LS2-Background AM-2-2
settings file from Animal Muscle.
5. After a short time, LabScribe will appear on the computer screen as configured by the Skeletal
Muscle-Summation-Tetanus-LS2 settings.
6. For your information, the settings used to configure the recording channels and the Stimulator
preferences for this experiment are programmed on the Channel and Stimulator windows of the
Preferences Dialog, which can be viewed by selecting Preferences from the Edit menu on the
LabScribe Main window.
7. Once the settings file has been loaded, click the Experiment button on the toolbar to open any
of the following documents:
� Appendix
� Background
� Labs
� Setup (opens automatically)
FT-302 and Stimulus Electrode Setup
1. Locate the following items in the iWorx kit: FT-302 force transducer (Figure AM-2-S1) and the
A-BST-100 bipolar stimulator cable (Figure AM-2-S2).
Figure AM-2-S1: The FT-302 force transducer.
Figure AM-2-S2: The A-BST-100 bipolar stimulating electrode.
Animal Muscle-Summation-Tetanus-LS2-Background AM-2-3
2. Plug the DIN8 connector of the FT-302 into the Channel A5 input (Figure AM-2-S3).
Figure AM-2-S3: The FT-302 force transducer and the A-BST-100 bipolar stimulating electrode
connected to the IXTA.
4. Plug the male double banana-female BNC adapter into the positive (red) and negative (black)
banana jacks of the IXTA stimulator. The banana plug that goes into the negative (black)
stimulator output is identified by a tab, embossed with the letters GND (ground), on that side of
the adapter.
5. Attach the BNC connector of the A-BST-100 bipolar stimulator cable to the adapter on the
stimulator outputs.
The Dissection
1. Place a frog in ice water for 15 minutes. Double pith the frog as soon as it is removed from the
ice water.
2. Remove the skin from the legs by making an incision through the skin around the entire lower
abdomen. Cut the connections between the skin and the body—especially around the base of
the pelvic girdle. Use stout forceps to pull the skin off the frog in one piece (like a pair of
pants).
3. Place the frog in a dissection tray with its dorsal side up.
Note: Moisten the exposed limbs of the frog with Ringer's solution every five minutes or so.
4. Identify the Gastrocnemius muscle on the lower leg.
Animal Muscle-Summation-Tetanus-LS2-Background AM-2-4
5. Use a glass hook to separate the Gastrocnemius muscle from the bone and other muscles of the
lower leg.
6. Use scissors to free the Achilles tendon from the connective tissue around the heel of the foot.
Double up a 24” piece of thread. Firmly tie the doubled thread around the Achilles tendon,
leaving the ends of the thread long enough to attach the muscle to the displacement transducer.
Note: Isolate as much tendon as possible, since it will be used to attach the muscle to the transducer.
7. Cut the Achilles tendon as close to the bottom of the foot as possible, so the thread is still
attached to the Gastrocnemius muscle.
8. Move the Gastrocnemius muscle away from the rest of the lower leg. Cut the tibia just below
the knee to separate the rest of the lower leg from the preparation. Rinse the preparation with
Ringer’s solution to moisten the tissue and rinse away any blood.
9. Dissect away the muscles of the upper leg and expose the femur. Use a stout pair of scissors to
cut the femur close to the pelvis. Rinse the preparation with Ringer’s solution to moisten the
tissue and rinse away any blood.
The Preparation
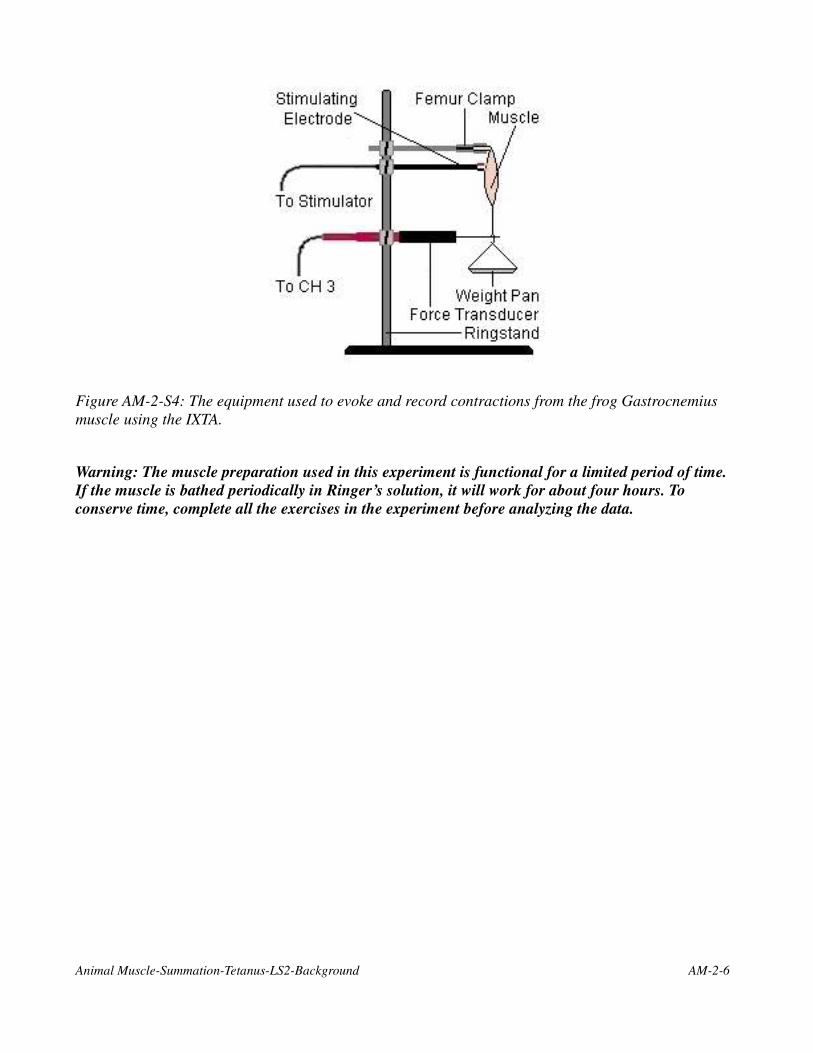
1. Use the femur clamp to mount the preparation on the ringstand (Figure AM-2-S4).
2. Attach the thread on the Achilles tendon to the hole on the end of the blade of the force
transducer.
3. Adjust the femur clamp and the force transducer so the thread from the Achilles tendon to the
hole on the end of blade is vertical.There should be no slack in the thread, but do not stretch the
muscle past its in situ length.
4. Position the stimulating electrodes so they lay against the muscle about midway between the
knee and the tendon. The two electrodes should not touch one another.
5. Place two nickels (10 g) in the weight pan.
Animal Muscle-Summation-Tetanus-LS2-Background AM-2-5
Figure AM-2-S4: The equipment used to evoke and record contractions from the frog Gastrocnemius
muscle using the IXTA.
Warning: The muscle preparation used in this experiment is functional for a limited period of time.
If the muscle is bathed periodically in Ringer’s solution, it will work for about four hours. To
conserve time, complete all the exercises in the experiment before analyzing the data.
Animal Muscle-Summation-Tetanus-LS2-Background AM-2-6
Experiment AM-2: Skeletal Muscle, Summation and Tetanus
Warning: The muscle preparation used in this experiment is functional for a limited period of time.
If the muscle is bathed periodically in Ringer’s solution, it will work for about four hours. To
conserve time, complete all the exercises in the experiment before analyzing the data.
Exercise 1: Stimulus-Response
Aim: To determine the relationship between the strength of the stimulus and the response of the muscle.
Procedure
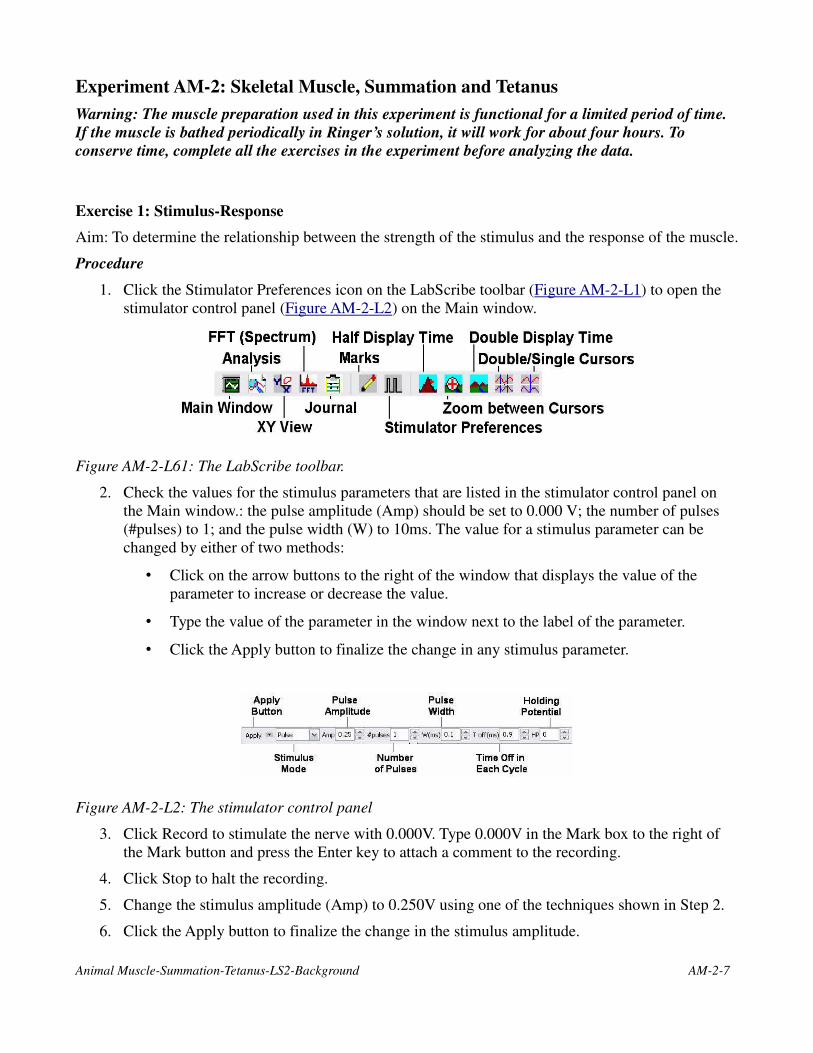
1. Click the Stimulator Preferences icon on the LabScribe toolbar (Figure AM-2-L1) to open the
stimulator control panel (Figure AM-2-L2) on the Main window.
Figure AM-2-L61: The LabScribe toolbar.
2. Check the values for the stimulus parameters that are listed in the stimulator control panel on
the Main window.: the pulse amplitude (Amp) should be set to 0.000 V; the number of pulses
(#pulses) to 1; and the pulse width (W) to 10ms. The value for a stimulus parameter can be
changed by either of two methods:
� Click on the arrow buttons to the right of the window that displays the value of the
parameter to increase or decrease the value.
� Type the value of the parameter in the window next to the label of the parameter.
� Click the Apply button to finalize the change in any stimulus parameter.
Figure AM-2-L2: The stimulator control panel
3. Click Record to stimulate the nerve with 0.000V. Type 0.000V in the Mark box to the right of
the Mark button and press the Enter key to attach a comment to the recording.
4. Click Stop to halt the recording.
5. Change the stimulus amplitude (Amp) to 0.250V using one of the techniques shown in Step 2.
6. Click the Apply button to finalize the change in the stimulus amplitude.
Animal Muscle-Summation-Tetanus-LS2-Background AM-2-7
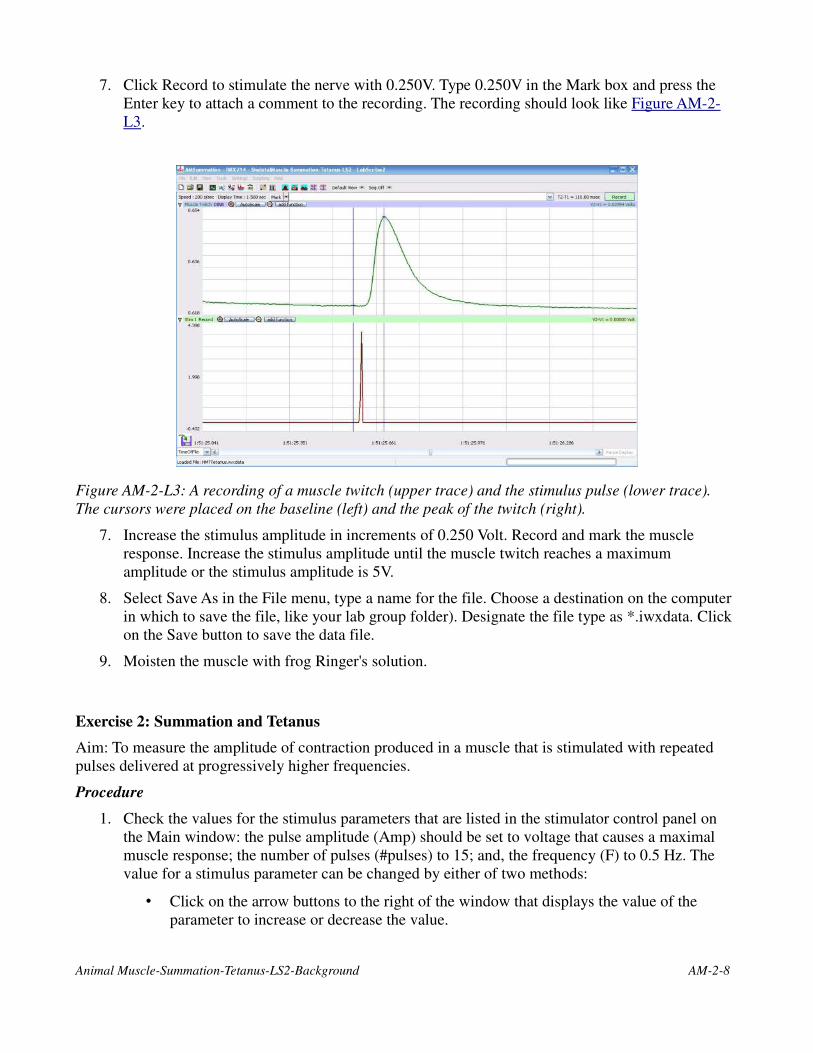
7. Click Record to stimulate the nerve with 0.250V. Type 0.250V in the Mark box and press the
Enter key to attach a comment to the recording. The recording should look like Figure AM-2-
L3.
Figure AM-2-L3: A recording of a muscle twitch (upper trace) and the stimulus pulse (lower trace).
The cursors were placed on the baseline (left) and the peak of the twitch (right).
7. Increase the stimulus amplitude in increments of 0.250 Volt. Record and mark the muscle
response. Increase the stimulus amplitude until the muscle twitch reaches a maximum
amplitude or the stimulus amplitude is 5V.
8. Select Save As in the File menu, type a name for the file. Choose a destination on the computer
in which to save the file, like your lab group folder). Designate the file type as *.iwxdata. Click
on the Save button to save the data file.
9. Moisten the muscle with frog Ringer's solution.
Exercise 2: Summation and Tetanus
Aim: To measure the amplitude of contraction produced in a muscle that is stimulated with repeated
pulses delivered at progressively higher frequencies.
Procedure
1. Check the values for the stimulus parameters that are listed in the stimulator control panel on
the Main window: the pulse amplitude (Amp) should be set to voltage that causes a maximal
muscle response; the number of pulses (#pulses) to 15; and, the frequency (F) to 0.5 Hz. The
value for a stimulus parameter can be changed by either of two methods:
� Click on the arrow buttons to the right of the window that displays the value of the
parameter to increase or decrease the value.
Animal Muscle-Summation-Tetanus-LS2-Background AM-2-8
� Type the value of the parameter in the window next to the label of the parameter.
2. Click the Apply button to finalize the change in any stimulus parameter.
3. Click Record to stimulate the nerve at 0.5 Hz. Type 0.5 Hz in the Mark box to the right of the
Mark button and press the Enter key to attach a comment to the recording.
4. Click Stop to halt the recording.
5. Change the stimulus frequency (F) to 1 Hz using one of the techniques described in Step 1.
Click the Apply button to finalize the change in the stimulus amplitude.
6. Click Record to stimulate the nerve at 1 Hz. Type 1 Hz in the Mark box and press the Enter key
to attach a comment to the recording.
7. Click Stop to halt the recording.
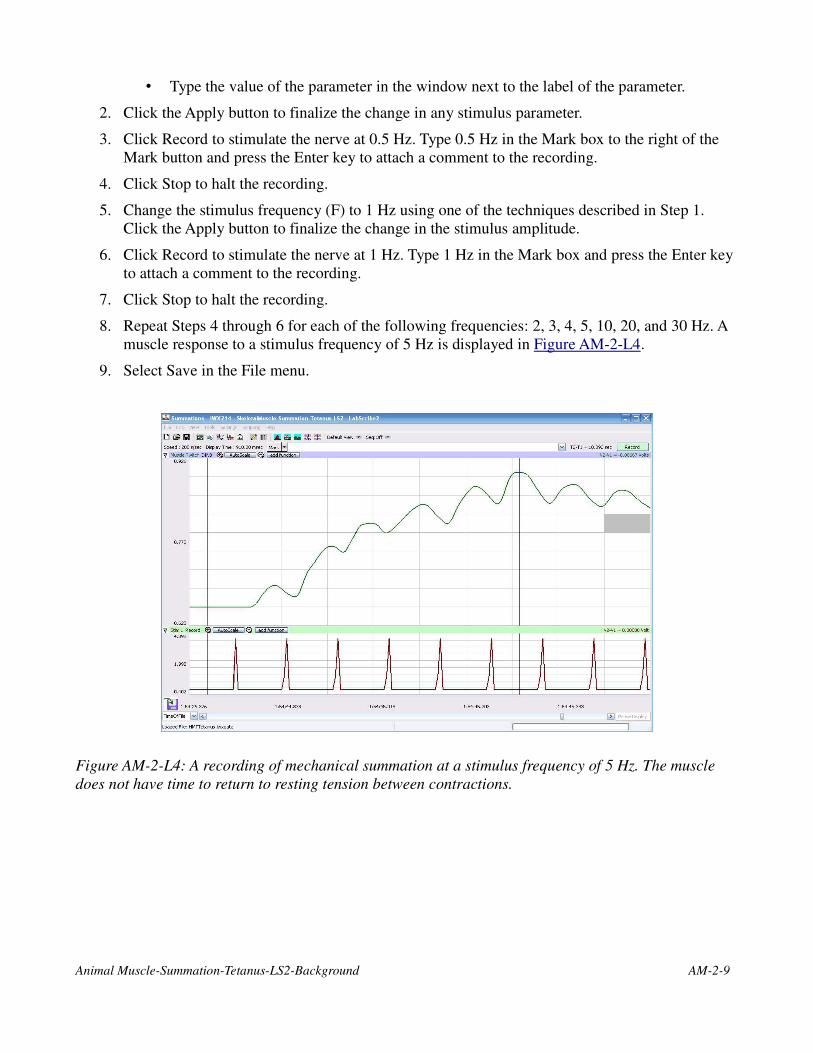
8. Repeat Steps 4 through 6 for each of the following frequencies: 2, 3, 4, 5, 10, 20, and 30 Hz. A
muscle response to a stimulus frequency of 5 Hz is displayed in Figure AM-2-L4.
9. Select Save in the File menu.
Figure AM-2-L4: A recording of mechanical summation at a stimulus frequency of 5 Hz. The muscle
does not have time to return to resting tension between contractions.
Animal Muscle-Summation-Tetanus-LS2-Background AM-2-9
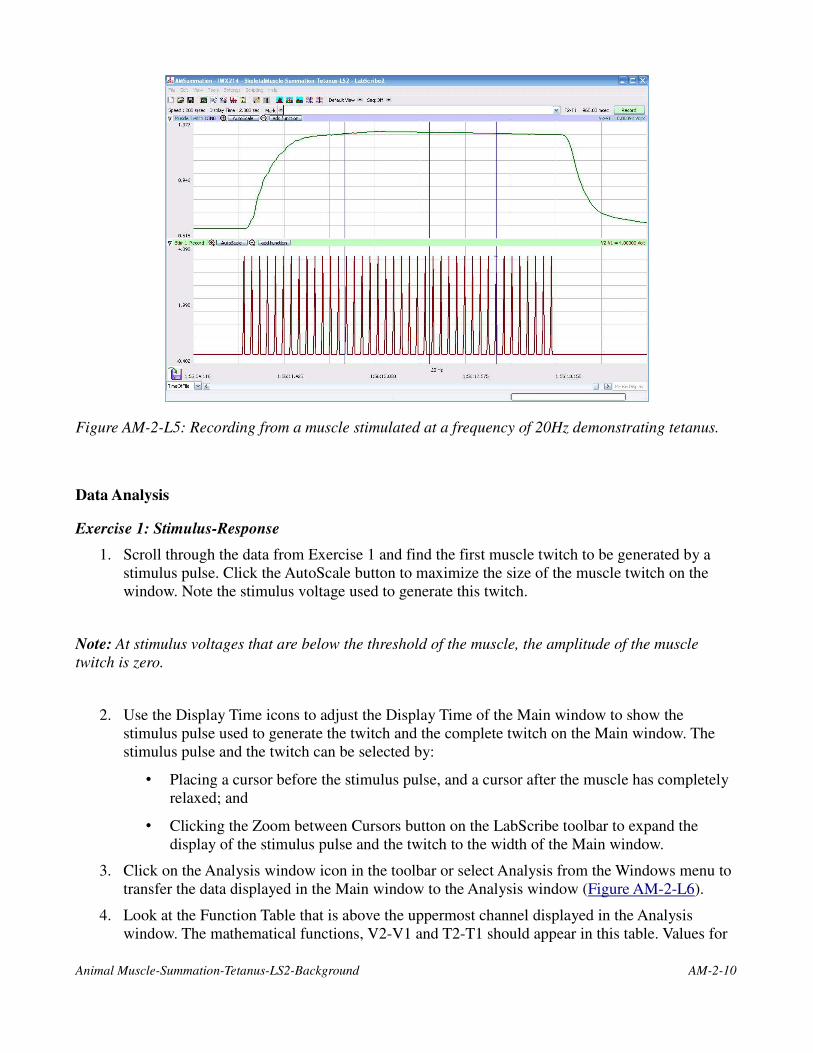
Figure AM-2-L5: Recording from a muscle stimulated at a frequency of 20Hz demonstrating tetanus.
Data Analysis
Exercise 1: Stimulus-Response
1. Scroll through the data from Exercise 1 and find the first muscle twitch to be generated by a
stimulus pulse. Click the AutoScale button to maximize the size of the muscle twitch on the
window. Note the stimulus voltage used to generate this twitch.
Note: At stimulus voltages that are below the threshold of the muscle, the amplitude of the muscle
twitch is zero.
2. Use the Display Time icons to adjust the Display Time of the Main window to show the
stimulus pulse used to generate the twitch and the complete twitch on the Main window. The
stimulus pulse and the twitch can be selected by:
� Placing a cursor before the stimulus pulse, and a cursor after the muscle has completely
relaxed; and
� Clicking the Zoom between Cursors button on the LabScribe toolbar to expand the
display of the stimulus pulse and the twitch to the width of the Main window.
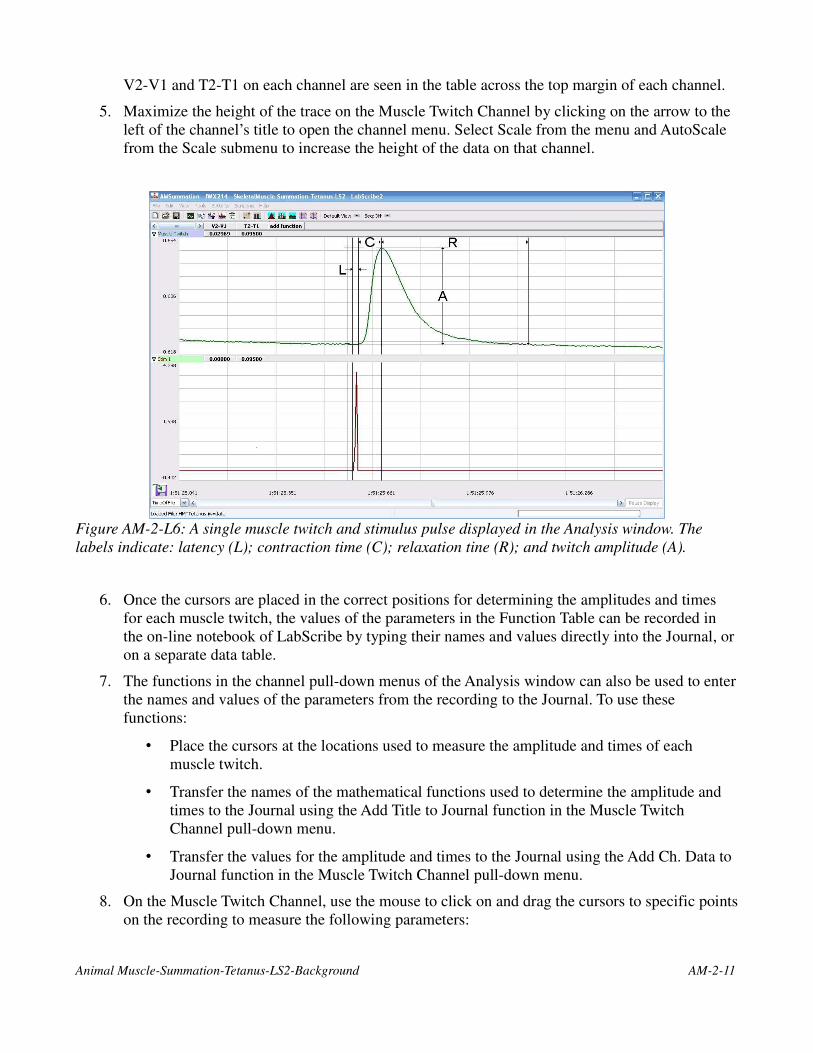
3. Click on the Analysis window icon in the toolbar or select Analysis from the Windows menu to
transfer the data displayed in the Main window to the Analysis window (Figure AM-2-L6).
4. Look at the Function Table that is above the uppermost channel displayed in the Analysis
window. The mathematical functions, V2-V1 and T2-T1 should appear in this table. Values for
Animal Muscle-Summation-Tetanus-LS2-Background AM-2-10
V2-V1 and T2-T1 on each channel are seen in the table across the top margin of each channel.
5. Maximize the height of the trace on the Muscle Twitch Channel by clicking on the arrow to the
left of the channel’s title to open the channel menu. Select Scale from the menu and AutoScale
from the Scale submenu to increase the height of the data on that channel.
Figure AM-2-L6: A single muscle twitch and stimulus pulse displayed in the Analysis window. The
labels indicate: latency (L); contraction time (C); relaxation tine (R); and twitch amplitude (A).
6. Once the cursors are placed in the correct positions for determining the amplitudes and times
for each muscle twitch, the values of the parameters in the Function Table can be recorded in
the on-line notebook of LabScribe by typing their names and values directly into the Journal, or
on a separate data table.
7. The functions in the channel pull-down menus of the Analysis window can also be used to enter
the names and values of the parameters from the recording to the Journal. To use these
functions:
� Place the cursors at the locations used to measure the amplitude and times of each
muscle twitch.
� Transfer the names of the mathematical functions used to determine the amplitude and
times to the Journal using the Add Title to Journal function in the Muscle Twitch
Channel pull-down menu.
� Transfer the values for the amplitude and times to the Journal using the Add Ch. Data to
Journal function in the Muscle Twitch Channel pull-down menu.
8. On the Muscle Twitch Channel, use the mouse to click on and drag the cursors to specific points
on the recording to measure the following parameters:
Animal Muscle-Summation-Tetanus-LS2-Background AM-2-11
� Muscle Twitch Amplitude, which is the difference between the baseline tension of the
muscle and the tension at the peak of the twitch. To measure this parameter, place one
cursor at the beginning of the twitch, and the second cursor on the peak of the twitch.
The value for the V2-V1 function on the Muscle Twitch Channel is the muscle twitch
amplitude.
� Contraction Time, which is the time between the beginning and the peak of the twitch.
To measure this parameter, keep the cursors in the same positions used to measure the
muscle twitch amplitude. The value for the T2-T1 function on the Muscle Twitch
Channel is the contraction time of the twitch.
� Relaxation Time, which is the time between the peak of the twitch and the return of the
muscle tension to the baseline level. To measure this parameter, keep the cursor on the
peak of the twitch and place the other cursor at the end of the twitch. The value for the
T2-T1 function on the Muscle Twitch Channel is the relaxation time of the twitch.
� Latency, which is the time it takes the muscle to start responding to a stimulus. Place one
cursor at the beginning of the stimulus pulse, and the other cursor at the beginning of the
muscle twitch. The value for the T2-T1 function on the Muscle Twitch Channel is the
latency of the muscle response
9. Record the values in the Journal using the one of the techniques described in Steps 7 or 8, and
on Table AM-2-L1.
10. Repeat Steps 2 through 9 to find the muscle twitch amplitude, contraction time, relaxation time,
and latency of the other muscle twitches recorded in this exercise. Record the values in the
Journal and on the table.
11. Select Save in the File menu.
12. Graph the muscle twitch amplitude and the contraction time as a function of the stimulus
amplitude.
Questions
1. How does direct electrical stimulation produce contractions of the muscle?
2. Why doesn’t the muscle respond to low stimulus voltages?
3. Why does the amplitude of the muscle response increase with increasing stimulus voltages?
4. At high stimulus voltages, the muscle response reaches a maximum amplitude. Why doesn’t the
muscle response continue to increase with increasing stimulus voltages?
Animal Muscle-Summation-Tetanus-LS2-Background AM-2-12
Table AM-2-L1: Amplitude and Times of Muscle Twitches Generated by Stimulus Pulses of
Different Amplitudes.
Muscle Twitch
Stimulus Amplitude (V)Amplitude
(mV)
Contract Time
(msec)
Relax Time
(msec)
Latency
(msec)
0.000 0 0 0 0
0.250
0.500
0.750
1.000
1.250
1.500
1.750
2.000
Exercise 2: Summation and Tetanus
1. Scroll to the beginning of the data recorded for Exercise 2. Click the AutoScale button to
maximize the size of the muscle twitches on the window.
2. Scroll through the data from Exercise 2 and find the first series of muscle twitches in which the
muscle does not have sufficient time to fully relax to the baseline tension level between
twitches (Figure AM-2-L7). This phenomenon is known as mechanical summation.
3. Use the Display Time icons to adjust the Display Time of the Main window to show all the
twitches in the series on the Main window. The twitches can also be selected by using the Zoom
between Cursors function explained in Step 1 of the data analysis section for Exercise 1.
Animal Muscle-Summation-Tetanus-LS2-Background AM-2-13
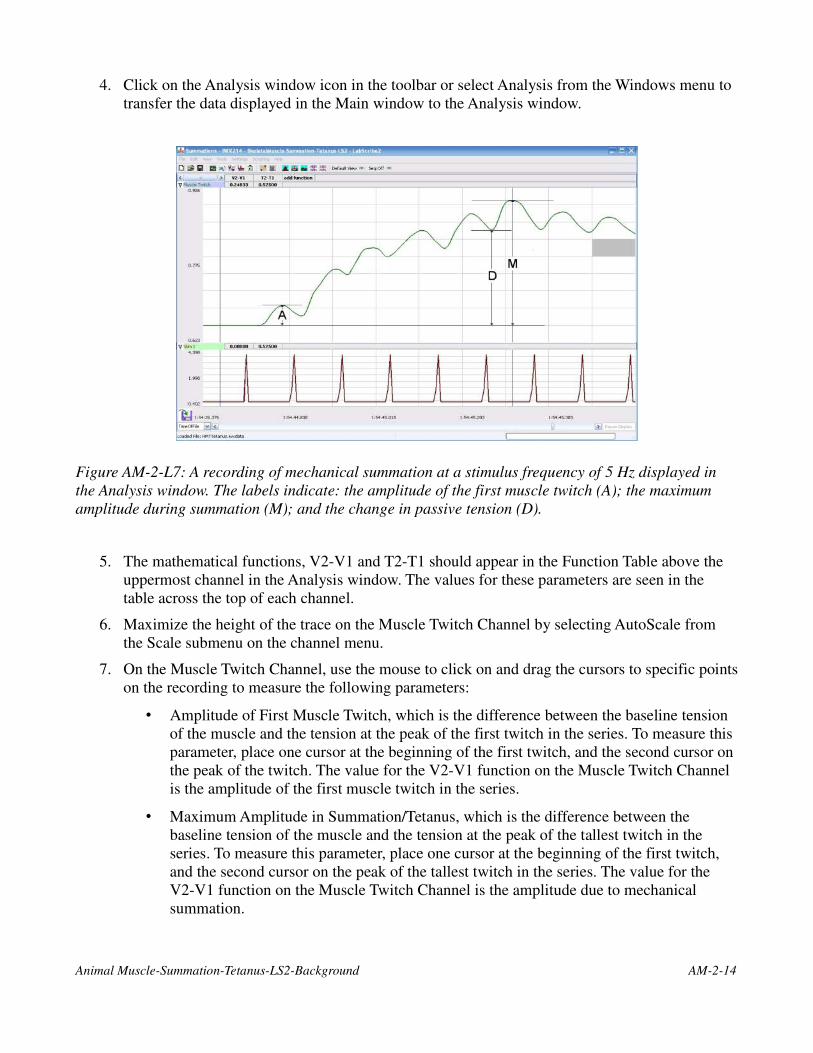
4. Click on the Analysis window icon in the toolbar or select Analysis from the Windows menu to
transfer the data displayed in the Main window to the Analysis window.
Figure AM-2-L7: A recording of mechanical summation at a stimulus frequency of 5 Hz displayed in
the Analysis window. The labels indicate: the amplitude of the first muscle twitch (A); the maximum
amplitude during summation (M); and the change in passive tension (D).
5. The mathematical functions, V2-V1 and T2-T1 should appear in the Function Table above the
uppermost channel in the Analysis window. The values for these parameters are seen in the
table across the top of each channel.
6. Maximize the height of the trace on the Muscle Twitch Channel by selecting AutoScale from
the Scale submenu on the channel menu.
7. On the Muscle Twitch Channel, use the mouse to click on and drag the cursors to specific points
on the recording to measure the following parameters:
� Amplitude of First Muscle Twitch, which is the difference between the baseline tension
of the muscle and the tension at the peak of the first twitch in the series. To measure this
parameter, place one cursor at the beginning of the first twitch, and the second cursor on
the peak of the twitch. The value for the V2-V1 function on the Muscle Twitch Channel
is the amplitude of the first muscle twitch in the series.
� Maximum Amplitude in Summation/Tetanus, which is the difference between the
baseline tension of the muscle and the tension at the peak of the tallest twitch in the
series. To measure this parameter, place one cursor at the beginning of the first twitch,
and the second cursor on the peak of the tallest twitch in the series. The value for the
V2-V1 function on the Muscle Twitch Channel is the amplitude due to mechanical
summation.
Animal Muscle-Summation-Tetanus-LS2-Background AM-2-14
� Change in Passive Tension, which is the difference between the baseline tension of the
muscle and the tension at the highest relaxation point between the twitches in the series.
To measure this parameter, place one cursor at the beginning of the first twitch, and the
second cursor on the highest relaxation point between any pair twitches in the series.
The value for the V2-V1 function on the Muscle Twitch Channel is the increase in the
passive tension in the muscle during the series of twitches.
8. Record the values in the Journal using the one of the techniques described in Steps 7 or 8 in the
data analysis section for Exercise 1, and on Table AM-2-L2.
9. Repeat Steps 2 through 9 to find the amplitude of the first twitch, maximum amplitude in
summation, and change in passive tension for each of the other series of twitches recorded in
this exercise. Record the values in the Journal and on the table.
10. Select Save in the File menu.
11. Determine the frequencies at which the following first appear:
� Mechanical summation.
� Incomplete tetanus
� Complete tetanus
Questions
1. If contraction amplitude is dependent upon the increases in concentration and persistence of
intracellular calcium, why are the contraction amplitudes of single twitches the same?
2. Tetanus requires high stimulus frequencies. What does this tell you about calcium re-uptake by
the sarcoplasmic reticulum?
3. Why is the rate of muscle relaxation much slower after tetanus than after a single twitch?
Animal Muscle-Summation-Tetanus-LS2-Background AM-2-15
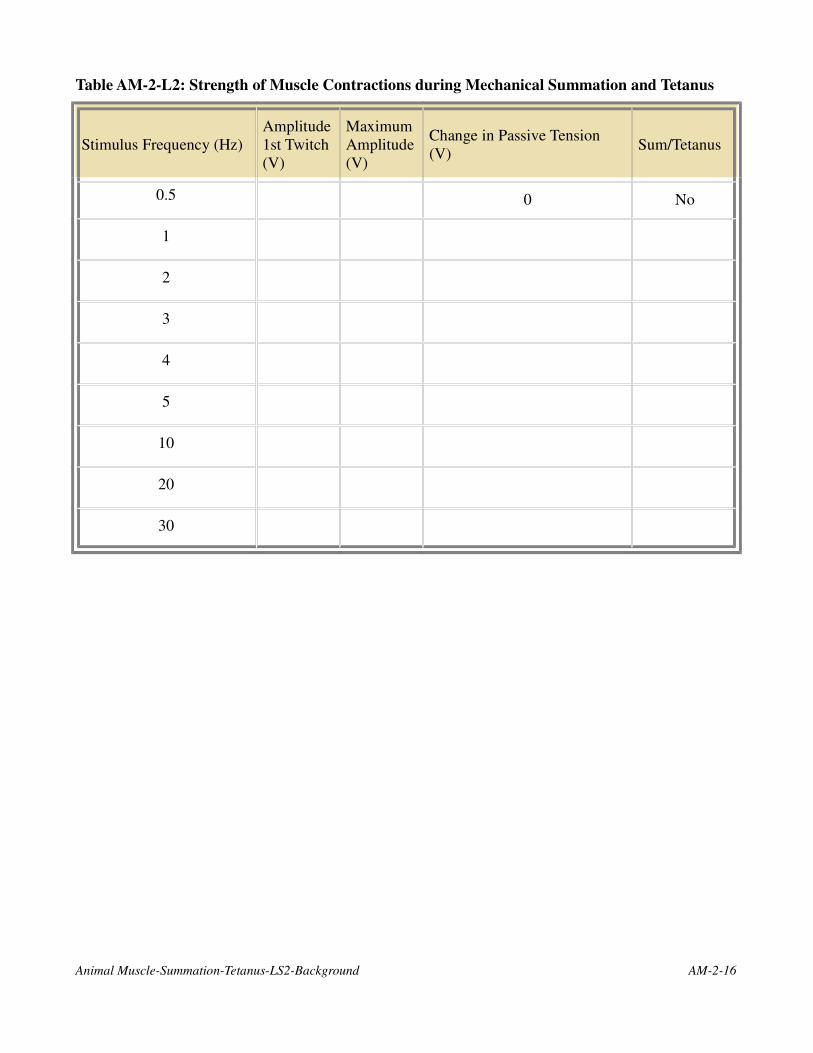
Table AM-2-L2: Strength of Muscle Contractions during Mechanical Summation and Tetanus
Stimulus Frequency (Hz)
Amplitude
1st Twitch
(V)
Maximum
Amplitude
(V)
Change in Passive Tension
(V)Sum/Tetanus
0.5 0 No
1
2
3
4
5
10
20
30
Animal Muscle-Summation-Tetanus-LS2-Background AM-2-16
Experiment AM-2: Skeletal Muscle, Summation and Tetanus
Warning: The muscle preparation used in this experiment is functional for a limited period of time.
If the muscle is bathed periodically in Ringer’s solution, it will work for about four hours. To
conserve time, complete all the exercises in the experiment before analyzing the data.
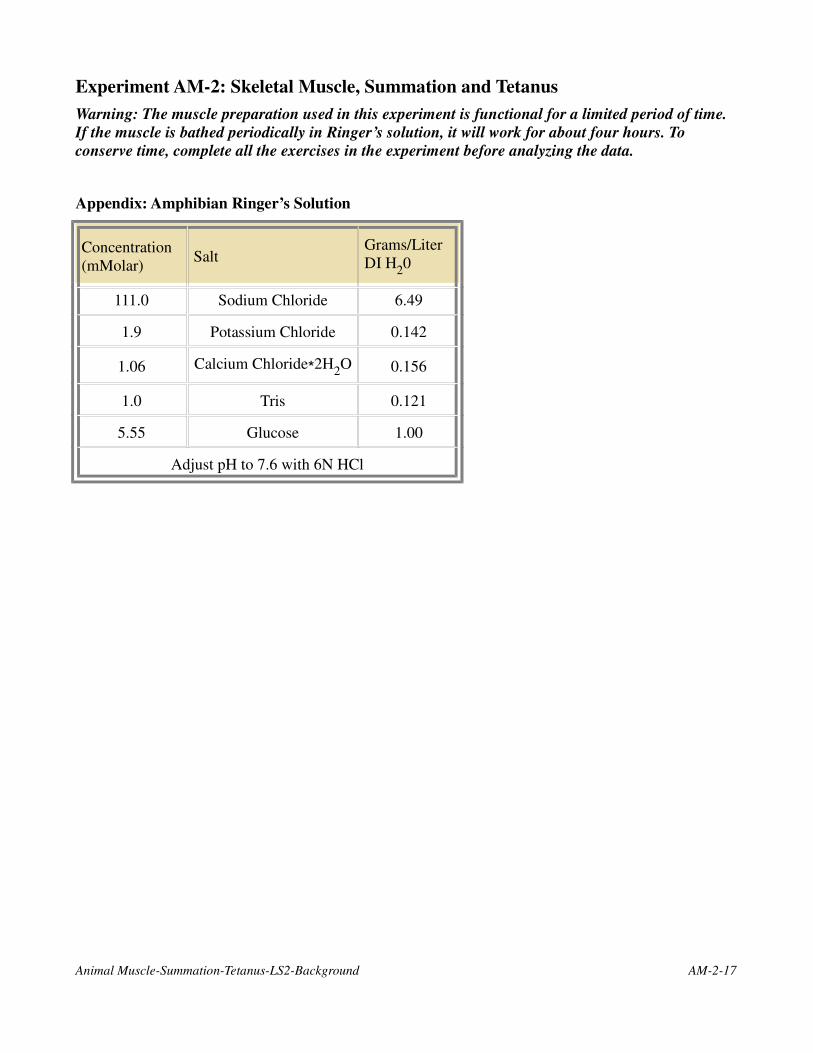
Appendix: Amphibian Ringer’s Solution
Concentration
(mMolar)Salt
Grams/Liter
DI H20
111.0 Sodium Chloride 6.49
1.9 Potassium Chloride 0.142
1.06 ∗Calcium Chloride 2H2O 0.156
1.0 Tris 0.121
5.55 Glucose 1.00
Adjust pH to 7.6 with 6N HCl
Animal Muscle-Summation-Tetanus-LS2-Background AM-2-17