XRF OF CULTURAL HERITAGE MATERIALS: ROUND-ROBIN IV - PAINT ON CANVAS C. Namowicz 1 , K. Trentelman 1 and C. McGlinchey 2 1 The Getty Conservation Institute, 1200 Getty Center Dr. Suite 700, Los Angeles CA 90049 2 The Museum of Modern Art, 11 West 53 rd Street, New York, NY 10019 ABSTRACT To establish standard working practices and further understanding of the application of X-ray fluorescence spectroscopy to works of art and cultural heritage materials, a series of round-robin tests have been conducted bi-annually since 2002. In 2008 the round-robin explored the application of XRF to the study of paintings on canvas. Thirteen samples, consisting of both modern and traditional pigments on canvas, were distributed to 25 participating institutions for analysis. The samples were designed to explore common challenges encountered in the XRF analysis of painted works, including: peak overlaps, sum peaks, layering/shielding effects, detection of low-Z pigments, and modern pigments. The results from representative samples highlighting each topic are discussed. INTRODUCTION The development of portable and relatively inexpensive X-ray fluorescence (XRF) spectrometers over the last decade has resulted in a dramatic increase in the number of instruments in use in museum laboratories. These instruments are generally designed for use by non-specialists, and thus many of the fundamental operational parameters may be hidden or inaccessible. Nonetheless, because of the often complex nature of works of art and cultural heritage materials, a thorough understanding of the interaction of X-rays with matter is necessary to insure the appropriate application and interpretation of the data. The number of academic laboratories engaging in research on fine art and cultural heritage objects has similarly increased over this time. For these researchers, understanding the complex nature, history and conservation of works of art is necessary in order to help identify relevant research questions. The workshop “Cultural Heritage and Conservation Applications” at the 2008 Denver X-ray Conference (DXC) was designed to provide a forum for museum, academic and industrial scientists to discuss the application of XRF to cultural heritage materials. Similar workshops on the application of XRF to cultural heritage materials have been held bi- annually since 2002. Along with presentations, each workshop has also included a round-robin: the round-robin focused on photographic materials in 2002 and 2004, and on copper and aluminum alloys in 2006. The 2008 DXC round-robin was devoted to paintings on canvas. The analysis of paintings represents a particular challenge in the field of conservation science; paintings are multilayered, inhomogeneous works of art, precious enough that little or no sampling may be permitted. Therefore, samples for the round-robin were designed to mimic the challenges encountered in the XRF analysis of paintings, including: false positives due to peak overlaps or sum peaks, interpretation of relative intensity changes due to shielding or layer effects, detection of low-Z materials and challenges associated with mixtures of contemporary and traditional pigments. 144 Published with permission from the Getty Conservation Institute. Advances in X-ray Analysis, Volume 52
Transcript
XRF OF CULTURAL HERITAGE MATERIALS: ROUND-ROBIN IV - PAINT ON CANVAS
C. Namowicz1, K. Trentelman1 and C. McGlinchey2
1The Getty Conservation Institute, 1200 Getty Center Dr. Suite 700, Los Angeles CA 90049
2The Museum of Modern Art, 11 West 53rd Street, New York, NY 10019 ABSTRACT To establish standard working practices and further understanding of the application of X-ray fluorescence spectroscopy to works of art and cultural heritage materials, a series of round-robin tests have been conducted bi-annually since 2002. In 2008 the round-robin explored the application of XRF to the study of paintings on canvas. Thirteen samples, consisting of both modern and traditional pigments on canvas, were distributed to 25 participating institutions for analysis. The samples were designed to explore common challenges encountered in the XRF analysis of painted works, including: peak overlaps, sum peaks, layering/shielding effects, detection of low-Z pigments, and modern pigments. The results from representative samples highlighting each topic are discussed. INTRODUCTION The development of portable and relatively inexpensive X-ray fluorescence (XRF) spectrometers over the last decade has resulted in a dramatic increase in the number of instruments in use in museum laboratories. These instruments are generally designed for use by non-specialists, and thus many of the fundamental operational parameters may be hidden or inaccessible. Nonetheless, because of the often complex nature of works of art and cultural heritage materials, a thorough understanding of the interaction of X-rays with matter is necessary to insure the appropriate application and interpretation of the data. The number of academic laboratories engaging in research on fine art and cultural heritage objects has similarly increased over this time. For these researchers, understanding the complex nature, history and conservation of works of art is necessary in order to help identify relevant research questions. The workshop “Cultural Heritage and Conservation Applications” at the 2008 Denver X-ray Conference (DXC) was designed to provide a forum for museum, academic and industrial scientists to discuss the application of XRF to cultural heritage materials.
Similar workshops on the application of XRF to cultural heritage materials have been held bi-annually since 2002. Along with presentations, each workshop has also included a round-robin: the round-robin focused on photographic materials in 2002 and 2004, and on copper and aluminum alloys in 2006. The 2008 DXC round-robin was devoted to paintings on canvas. The analysis of paintings represents a particular challenge in the field of conservation science; paintings are multilayered, inhomogeneous works of art, precious enough that little or no sampling may be permitted. Therefore, samples for the round-robin were designed to mimic the challenges encountered in the XRF analysis of paintings, including: false positives due to peak overlaps or sum peaks, interpretation of relative intensity changes due to shielding or layer effects, detection of low-Z materials and challenges associated with mixtures of contemporary and traditional pigments.
144Published with permission from the Getty Conservation Institute.Advances in X-ray Analysis, Volume 52
This document was presented at the Denver X-ray Conference (DXC) on Applications of X-ray Analysis. Sponsored by the International Centre for Diffraction Data (ICDD). This document is provided by ICDD in cooperation with the authors and presenters of the DXC for the express purpose of educating the scientific community. All copyrights for the document are retained by ICDD. Usage is restricted for the purposes of education and scientific research. DXC Website – www.dxcicdd.com
ROUND-ROBIN SAMPLES Thirteen samples (see Table 1), consisting of layers of modern (samples 1-7) and traditional (samples 8-12) pigments on cotton and linen canvas, respectively, were prepared for distribution to the round-robin participants. Samples of unpainted cotton and linen canvas (samples 0 and 13, respectively) were provided as controls. Because these samples were intended to simulate typical canvas paintings, the materials were mixed and applied using traditional artist’s methods and tools.
Unless otherwise noted, all pigments are from Kremer Pigment (New York, NY); the individual Kremer reference numbers are listed in Table 1. Cadmium yellow extra pale (CdZnS) source unknown, but found to have no detectable contaminations via XRF. Additional pigments include: chalk (CaCO3, Fisher Scientific, 99.0% ACS certified); red bole (L. Cornelissen & Son) and B-409 bronze powder (90/10 Cu/Sn alloy, United States Bronze Powders Inc.).
Samples 1-7 (with the exception of 4a and 5) were prepared by hand-grinding dry pigments with a 35% solution of polyvinyl acetate (AYAA) in ethanol/acetone (Talas, New York, NY) and applying to the cotton canvas support (Pearl Paint, New York, NY). Titanium white acrylic tube paint (Golden Artists Colors, New York, NY) was used as the ground layer in sample 4a. Sample 5 was made by dispersing dry pigment in mineral spirits then grinding with Kremer flake (lead) white/linseed oil (K46007). Samples 8-12 were prepared by hand-grinding dry pigments in acrylic medium (Golden Mediums GAC 100 multi-purpose acrylic polymer, Utrecht, Brooklyn, NY) and applying to unprimed linen canvas (type 135 medium smooth, Utrecht, Brooklyn, NY).
Table 1. Pigment layers on samples distributed in round-robin. The layers are listed in order, starting from the bottom (canvas); separate layers are indicated by │. Pigments separated by an ampersand are mixed in a single layer. Samples 4, 11 and 12 contained multiple layer structures, indicated by a, b, c.
Sample Paint Layer(s)1 1:1 barium white (K58700) & titanium white (K46200)2 1:10 barium white (K58700) & titanium white (K46200)3 10:1 barium white (K58700) & titanium white (K46200)4a titanium white│4,4’,7,7’-tetrachlorothioindigo (PR 88.73312)4b 4,4’,7,7’-tetrachlorothioindigo (PR 88.73312)5 2:1 yellow ochre (K48040) & cadmium yellow, & lead white 6 3:1 zirconium cerulean blue (K45400) & titanium white (K46200)7 5:2 titanium white (K46200) & bone black (K47100)8 lead white (K4600)│gypsum (K5832)9 zinc white (K4630)│bole│bronze paint10 gypsum│lead white (K4600) & vermilion (K4202) & orpiment (K10700)11a chalk│azurite (K10202)│ultramarine (K4501)11b chalk│azurite (K10202)│indigo (K36900)& rose madder (K37214) & alizarin (K2361)11c chalk│azurite (K10202)│Prussian blue (K4521)12a lead white (K4600)│lead-tin yellow (K1010)│lead white (K4600)12b lead white (K4600)│red lead (K4250)│lead white (K4600)
145Published with permission from the Getty Conservation Institute.Advances in X-ray Analysis, Volume 52
RESULTS OF ROUND-ROBIN The round-robin samples were designed to explore various aspects of interpreting XRF data rather than produce numerical results. Therefore, the participants were asked to indicate the elements which had been detected, and it was left to the individual to report what, if any, pigments could be surmised from the data obtained. The responses were thus divided into two categories: elements detected and interpretation. The average percentage of respondents who correctly identified the key elements present in all 11 painted samples (some samples consisted of multiple areas, for a total of 16 analyzed areas) was 65%, while the average percentage of respondents who provided correct interpretations of the results was only 40%. Because correct interpretation in many cases depended on the user having specialized knowledge regarding materials typically used in paintings, only participants from museums or other cultural heritage institutions were included in the analysis of the interpretation results. Perhaps not surprisingly, these results indicate the presence of a knowledge gap: while the determination of which elements are present may be relatively straightforward, even experienced users are not correctly extracting the maximum amount of information which is provided by the XRF data. With this in mind, this paper will discuss those factors which proved to be helpful, misleading or otherwise important for the analysis of paintings by XRF spectroscopy. LINE OVERLAPS Overlapping X-ray emission lines are a common problem in energy dispersive X-ray spectroscopy, where the resolution of the spectrometer may be insufficient to resolve peaks with identical, or nearly identical, emission energies. A commonly encountered overlap in the examination of paintings is that of Ba L lines with the Ti K lines. If Ba is present in sufficient quantities, the Ba K lines may also be detected. However, a more typical, and difficult, situation is the detection of Ba and Ti in mixtures where one of the components is present in only minor or trace amounts. XRF spectra of samples 2 and 3, consisting of mixtures of Ti and Ba in ratios of 10:1 and 1:10, respectively, are shown in Figure 1. In sample 2, the small amount of Ba did not produce detectable Ba K lines. At first glance, the low energy peaks appear to be attributable entirely to the Ti Kα and Kβ lines. However, analysis of the peak positions reveals that the Ti Kα peak appears to be shifted to slightly lower energy due to the contribution from the Ba L lines. Similarly, in the spectrum of sample 3, which is dominated by the Ba L lines, the peak of the Ba Lα and Lβ lines appears to be shifted to slightly higher energies due to contributions from Ti. In both cases, deconvolution of the peak shapes should provide a measure of the amount of each component
Figure 1. Low energy region of XRF spectra from samples 2 and 3. The position of the Ba L and Ti K X-ray emission lines are indicated by vertical lines, with the Ti Kα and Kβ lines indicated by *
4.0 4.5 5.0 5.5 6.0
Energy (keV)
Inte
nsity
(arb
. uni
*
*
Sample 2 - TiO2:BaSO4 10:1
Sample 3 - TiO2:BaSO41:10
ts)
146Published with permission from the Getty Conservation Institute.Advances in X-ray Analysis, Volume 52
present. This example illustrates the importance of careful examination of the spectra in areas where overlaps are suspected; the peak positions may provide clues as to whether or not additional components are present.
Another overlap often encountered in works of art is that of the As Kα (10.532 keV) and the Pb Lα (10.549 keV) peaks. The presence of As generally can be confirmed by the As Kβ (11.729 keV) line, unless Hg is also present, as the Hg Lβ peak (11.823 keV) overlaps with the As Kβ line. These overlaps are illustrated in the spectrum of sample 10, shown in Figure 2. Sample 10 is representative of a typical flesh tone, consisting of trace amounts of the red pigment, vermilion (HgS) and the yellow pigment, orpiment (As2S3), mixed with lead white (lead white - PbCO3·Pb(OH)2) and applied over a gypsum (CaSO4·2H2O) ground layer.
The spectrum is dominated by the Pb L lines. The Hg L lines, although small, are readily identifiable. Since both the As Kα and Kβ lines are overlapped by other lines, the only evidence that As may also be present is the slightly increased intensity of the peak at 10.5 keV. However, since, as will be discussed below, many other factors can affect the intensity of XRF peaks, this alone is insufficient evidence to determine the presence of As.
8 10 12 14 16
Energy (keV)
Inte
nsity
(arb
. uni
ts)
Pb Lℓ
Pb Lα1
Pb Lβ1,2
Hg Lα1
Hg Lβ1,2
Pb Lγ1Hg Lγ1
As Kα
As Kβ
Pb Lη
Pb Lβ4
Pb Lβ3
Figure 2. XRF spectrum from sample 10, consisting of lead white with trace amounts of vermilion (HgS) and orpiment (As2S3).
The detection of mixtures of Pb, Hg and As is of particular importance for ethnographic and natural history collections, many of which have been treated with As, Pb and Hg containing pesticides. Accurate detection of these elements is therefore vital for identifying potential health hazards for those dealing with the collections today as well as insuring the safety of repatriated Native American artifacts.1-3 XRF is an ideal method for examining these objects, as it can be employed non-invasively, thus respecting the sacred nature of many ethnographic artifacts. However, as the above example demonstrates, the presence of some heavy metals may be difficult to determine by XRF alone, emphasizing the need for careful examination of the data. SUM PEAKS Sum peaks, the result of the simultaneous arrival of two photons at the detector, occur under high count rate conditions.4, 5 Although the output of the X-ray tube can be adjusted to eliminate sum peaks, unless quantitative results are desired (which is generally not the case in the analysis of paintings), it is more desirable to provide sufficient excitation to detect minor or trace elements. However, the identification of sum peaks is important in those cases, such as for the element lead, where the sum peaks may be misinterpreted as additional element peaks. The pigment lead white is ubiquitous in traditional paintings, and can be found in many modern paintings as well as it was used until the late 1970s when the federal government banned its use in residential homes due to its toxicity.6
147Published with permission from the Getty Conservation Institute.Advances in X-ray Analysis, Volume 52
Table 2. Pb sum peaks and corresponding overlapping elements.
Energy (keV) Pb Sum Peaks Overlapping Lines 21.1 2 × Pb Lα Pd Kα 23.2 Pb Lα + Pb Lβ Cd Kα 25.2 2 × Pb Lβ Sn Kα
Table 2 lists the commonly observed Pb sum peaks and overlapping element lines. All three overlapping elements - Pd, Cd and Sn - are commonly found in works of art, and therefore it is important to be able to accurately determine whether or not they are present. For example, Cd is found only in modern pigments (such as cadmium red (CdSe) and cadmium yellow (CdS)).7 Misidentifying a Pb sum peak as Cd can therefore have significant, and erroneous, implications in the analysis of a painting that should only contain traditional materials.
Sample 12 was designed to explore Pb sum peaks and associated possible interferences; the two halves, 12a and 12b, contain the pigments lead-tin yellow (Pb2SnO4) and red lead (Pb3O4), respectively, sandwiched between layers of lead white to conceal the colored pigments. Figure
3a shows the 20-30 keV region of the XRF spectrum from sample 12b, illustrating the expected intensity ratio for the three Pb sum peaks when no other elements in this energy region are present. By contrast, the spectrum from sample 12a (Figure 3b) shows a marked increase in the intensity of the peak at 25.2 keV, indicating the presence of tin, which is also confirmed by the presence of the Sn Kβ peak at 28.6 keV. Shown in Figure 3c, the XRF spectrum of sample 5, a single layer mixture of the pigments yellow ochre (FeOOH) and cadmium yellow (CdS) in lead white, illustrates the overlap of the Pb Lα+Lβ sum peak with the Cd Kα peak. This is perhaps the most difficult of these overlaps to detect if only small amounts of Cd are present, as the intensity distribution of the three peaks remains roughly the same. Therefore, the presence of the Cd Kβ peak is vital for confirming the presence of Cd. LAYERING/SHIELDING EFFECTS Paintings typically are multilayered structures, consisting of a support (canvas), ground layer(s), paint layer(s) and top varnish layer(s).8 In addition, if the painting has been restored or conserved, layers of overpaint
20 25 30
Energy (keV)
Inte
nsity
(arb
. uni
ts)
2 × Pb Lα 2 × Pb Lβ
Pb Lα + Pb Lβ
a)
Sn Kα
Sn Kβ b)
Cd Kα
Cd Kβ c)
Figure 3. High energy region of XRF spectra from a) sample 12b, Pb only; b) sample 12a, Pb and Sn; and c) sample 5, Pb and Cd.
148Published with permission from the Getty Conservation Institute.Advances in X-ray Analysis, Volume 52
also may be present. Therefore, using XRF spectra to determine which element is present in which layer is extremely difficult unless prior knowledge of the layer structure is available. Nonetheless, careful analysis of the XRF spectra and an understanding of absorption and shielding effects can sometimes provide information regarding the relative position of certain elements within the layer structure.
ty
le layer, similar .
tant to
t
ng
a)
b)
c)
Sample 8, consisting of a layer of gypsum (CaSO4·2H2O) over a ground layer of lead white was designed to explore shielding and layering effects. Figure 4a shows an XRF spectrum taken from the front of the sample (pigment side). The Ca Kα peak is visible along with the Pb L lines, but the intensity of the Pb Lα and Lβ lines is inverted relative to that which is observed when no intervening layer is present, such as those seen in the spectrum from sample 12b (Figure 4c). This inversion is the result of the filtering effect of the lower-Z gypsum layer. Primary X-rays easily penetrate the gypsum layer to excite the underlying lead white layer, but the subsequent Pb fluorescent X-rays must also travel through the gypsum layer, which acts as a filter, attenuating the emerging X-rays. All the Pb L lines are attenuated, but the degree of attenuation is a function of the X-ray absorption of the gypsum layer, which is maximum at the Ca absorption edge (4.037 keV) and decreases with increasing energy.4, 9 The Pb Lα peak is therefore attenuated to a greater extent than the Lβ peak,
0 5 10 15 20
Energy (keV)
Inte
nsity
(arb
. uni
ts)
Pb Lα
Pb Lβ
Ca Kα
producing the observed intensiinversion.
Although it is tempting to immediately ascribe inverted intensities in the Pb L peaks to a
layering effect, a similar effect may be produced by a single-layer consisting of a mixture of small amounts of Pb in a Ca-matrix. One way to confirm whether or not the effect is due to layering is to examine the structure from the other side. For sample 8, the XRF spectrum taken from the back (canvas side) of the sample is shown in Figure 4b. In contrast to the spectrum taken from the front, the spectrum taken from the back does not show any Ca peaks, indicating that the Ca and Pb are present in separate layers; if they were present in a sing
Figure 4. XRF spectra of sample 8, gypsum over lead white from a) front and b) back. A spectrum from sample 12b, with lead white on the upper surface is shown for comparison in trace c).
spectra would be produced regardless of whether it was examined from the front or the backAlthough the intensity of the X-ray emission peaks may provide information regarding the relative position of a particular element within the layer structure of a painting, it is imporstress that such interpretations are only valid if a layered structure can be confirmed. As discussed above, this may be accomplished if the area can be examined from the both the fronand the back. However, for most paintings, this is impractical. Large areas on the back of a painting may be blocked by stretcher bars, backing boards or other framing materials, limiti
149Published with permission from the Getty Conservation Institute.Advances in X-ray Analysis, Volume 52
the areas which can be examined from both the front and the back. Additionally, layers of materials other than canvas, such as repairs, linings or labels, may also be present and would either interfere with, or unnecessarily complicate, analysis by XRF. Because of the difficulty in examining the same area of a painting from both the front and back side, the presence of a layer structure must be confirmed using another technique. Traditionally, small samples are remoand prepared as cross-sections, from which the paint stratigraphy can be directly observed. Fortunately, confocal μ
ved
for nondestructive examination of
ed using a complementary examination or
XRF offers exciting possibilities
structure can be confirmlternative technique.
w
layered paintings.10-12
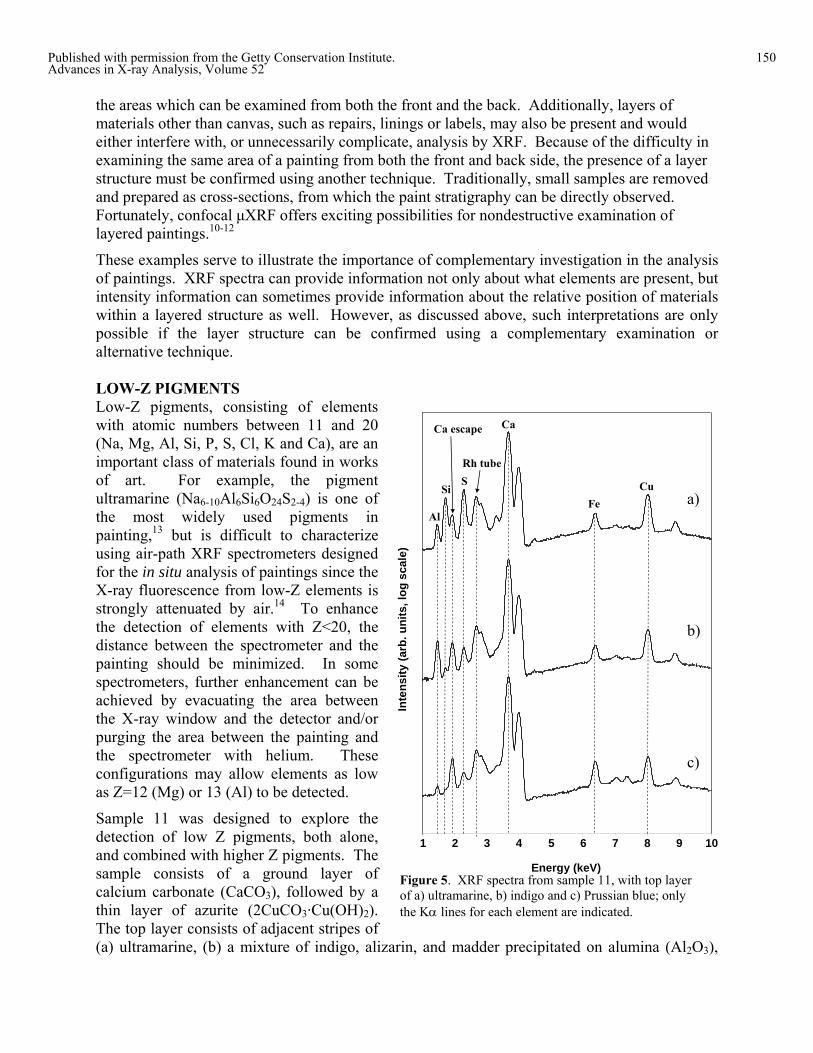
These examples serve to illustrate the importance of complementary investigation in the analysis of paintings. XRF spectra can provide information not only about what elements are present, but intensity information can sometimes provide information about the relative position of materials within a layered structure as well. However, as discussed above, such interpretations are only possible if the layer a LOW-Z PIGMENTS Low-Z pigments, consisting of elements with atomic numbers between 11 and 20 (Na, Mg, Al, Si, P, S, Cl, K and Ca), are an important class of materials found in works of art. For example, the pigment ultramarine (Na6-10Al6Si6O24S2-4) is one of the most widely used pigments in painting,13 but is difficult to characterize using air-path XRF spectrometers designed for the in situ analysis of paintings since the X-ray fluorescence from low-Z elements is strongly attenuated by air.14 To enhance the detection of elements with Z<20, the distance between the spectrometer and the painting should be minimized. In some spectrometers, further enhancement can be achieved by evacuating the area between the X-ray window and the detector and/or purging the area between the painting and the spectrometer with helium. These configurations may allow elements as loas Z=12 (Mg) or 13 (Al) to be detected.
Sample 11 was designed to explore the detection of low Z pigments, both alone, and combined with higher Z pigments. The sample consists of a ground layer of calcium carbonate (CaCO3), followed by a thin layer of azurite (2CuCO3·Cu(OH)2). The top layer consists of adjacent stripes of (a) ultramarine, (b) a mixture of indigo, alizarin, and madder precipitated on alumina (Al2O3),
Figure 5. XRF spectra from sample 11, with top layer of a) ultramarine, b) indigo and c) Prussian blue; only the Kα lines for each element are indicated.
S
Ca
Fe
Energy (keV)
1 2 3 4 5 6 7 8 9 10
Al
Si Cu
Rh tube
Ca escape
a)
b)
c)
Inte
nsity
(arb
. un
log
scal
e)
its,
150Published with permission from the Getty Conservation Institute.Advances in X-ray Analysis, Volume 52
and (c) Prussian blue (KFe[Fe(CN)6]). Azurite, ultramarine, indigo and Prussian blue all are blue pigments; alizarin and madder are organic red colorants. The XRF spectrum from each
iffraction or Raman spectroscopy.
e pigment, it may provide information about the pigment class, guiding subsequent analyses.
stripe is presented in Figure 5 (note log scale).
Copper in the azurite layer is easily detected in all three spectra. This sample was designed to replicate a situation commonly found in paintings, in which multiple pigments of similar color are applied in thin layers. In these cases, having identified one blue pigment, the presence of additional, low-Z pigments, may be overlooked. Fe is also present in all three spectra, but since only one area, area c, was painted with an iron-containing pigment (Prussian blue), the iron must be due to another source, most likely impurities in the canvas support. Prussian blue has an extremely high tinting strength,15 and very little pigment is required to achieve a deep blue color. In the spectrum from 11c (Figure 5c), although a slightly elevated level of iron is observed, without comparative spectra from unpigmented areas it would be impossible to conclude whether
be identified using analytical techniques such as X-ray
or not this was due to the presence of Prussian blue.
The spectrum of sample 11a (Figure 5a), with a top layer of ultramarine, has a slightly more intense peak for silicon than the other two samples. The spectrum from sample 11b (Figure 5b), with a violet top layer composed of indigo, rose madder precipitated on alumina, and alizarin crimson has the most intense peak for aluminum observed in series of samples. These observations are consistent with the pigments known to be present, but they are not unique characteristics; XRF spectra alone are insufficient to identify most low-Z pigments. Nevertheless, the detection of low-Z elements such as Al and Si can indicate the presence of additional pigments, which may d MODERN PIGMENTS Many modern pigments are organic compounds and thus escape detection via XRF. However, halogen based auxochromes or inorganic species like aluminum, calcium, manganese, strontium or barium may indicate that organic pigments are present and serve as an indication that further analysis by more appropriate techniques is necessary. For example, 4,4’,7,7’-tetrachlorothioindigo (pigment PR 88), is a chlorinated thioindigo derivative developed in the 1950s.16 Although the XRF spectrum of this pigment (not shown) is largely indistinguishable from the bare canvas, if an evacuated or purged environment is available, small peaks associated with S and Cl are detected. As mentioned above, although such data is insufficient to identify
0 5 10 15 20
Inte
nsity
(arb
. uni
t
Ti Kα
Ti KβV Kα
Zr Kα
Zr KβHf Lα1
Hf Lβ1
Hf Lβ2
Hf Lγ1
s)
Mo RayleighMo
Compton
Zr Lα1Mo Lα1
Energy (keV)Figure 6. XRF spectrum of sample 6, mixture of titanium white and zirconium cerulean blue.
th
151Published with permission from the Getty Conservation Institute.Advances in X-ray Analysis, Volume 52
Titanium white (TiO2), which in its pure form first gained acceptance as an artist’s pigment in the early 1930s (developed after WWI)17 is perhaps one of the most commonly used pigments unique to the twentieth century. Zirconium vanadium blue (Zr(V)SiO4), also known as zirconium cerulean blue, is a modern pigment best known as a ceramic glaze but also available as an artists’ pigment The XRF spectrum from sample 6, a single layer mixture of zirconium vanadium blue and titanium white, is shown in Figure 6. Titanium, from the titanium white is easily detected, as is zirconium. Perhaps surprisingly, peaks attributable to a somewhat unusual element - hafnium (Hf) - are also present. Hafnium is mineralogically associated with zirconium.18 The detection of vanadium is unfortunately complicated by a series of overlaps: the V Kα line overlaps the titanium Kβ line and the V Kβ line overlaps the Cr Kα line. Unlike the overlaps discussed in the first section, these overlaps are so close that the overall peak positions are not shifted. Furthermore, unless vanadium is present in sufficient amounts to create an apparent anomalous Ti Kα/Kβ ratio, it is likely to be missed. Although these examples explore similar challenges to those already discussed (low-Z pigments and line overlaps), their inclusion in the round-robin was to reflect the growing need for analysis of contemporary and modern artists’ materials19 and the specialized knowledge necessary to correctly interpret the data. CONCLUSIONS In this round-robin the analysis of paintings using X-ray fluorescence spectroscopy was explored. Many of the effects discussed here, such as interference from overlapping lines, sum peaks and difficulties associated with detecting low-Z elements are of course encountered in the analysis of any material. The samples prepared for the round robin were designed to highlight particular challenges commonly encountered in the analysis of works of art, such as the overlap of Pb, Hg and As peaks in objects treated with heavy-metal pesticides, the potential for misidentifying Pb sum peaks as indicating the presence of a modern Cd-containing pigment, the difficulty of detecting of low-Z blue pigments in the presence of a copper-based blue and the detection of unusual elements in modern pigments. The most important questions in the analysis of paintings generally revolve around the stratigraphy of the paint layers. Therefore, the ability to extract information regarding the relative position of elements within a layered structure is highly desirable. However, the correct interpretation of layering and shielding effects is difficult, and there are many factors which can affect the appearance of the spectra. If possible, the preferred method of examination is direct observation of the paint layers through the analysis of removed samples prepared as cross-sections.
Overall, the results of the round-robin revealed a discrepancy between the identification of elements present and the correct interpretation of the data. One might interpret this as the difference between the ability of the instrument and the ability of the user. Pigments containing high-Z elements were, overall, well detected by the respondents. By contrast, low-Z containing pigments, or high-Z containing pigments at low but chromatically significant concentrations, proved to be more challenging, highlighting the need for careful examination of the data and optimization of the excitation conditions. Not surprisingly, the most challenging samples proved to be those that most closely resembled works of art, consisting of mixtures of pigments in multiple layers. Although the detection of the elements contained in these samples was generally straightforward, correct interpretation of the data required an understanding of the fundamental operation of the instrument as well as knowledge of the materials and methods used to create
152Published with permission from the Getty Conservation Institute.Advances in X-ray Analysis, Volume 52
works of art. This round robin and the subsequent workshop held at the 2008 Denver X-ray Conference provided a forum for discussing these issues, thereby hopefully helping to close the gap. ACKNOWLEDGEMENTS This work would not have been possible without the round-robin participants and workshop attendees. The authors would also like to thank George Havrilla for supporting the inclusion of a cultural heritage session at DXC 2008. We would also like to thank Becca Pollak for the preparation of samples 1-7. REFERENCES (1) Nason, J. D. Collect Forum 2001, 17, 67-81. (2) Odegaard, N.; Smith, D. R.; Boyer, L. V.; Anderson, J. Collect Forum 2006, 20, 42-48. (3) Sirois, P. J.; Sansoucy, G. Collect Forum 2001, 17, 49-66. (4) Bertin, E. P. Introduction to X-ray Spectrometric Analysis; Plenum Press: New York, 1978. (5) Espen, P. J. M. v.; Janssens, K. In Handbook of X-ray Spectrometry; Grieken, R. E. v., Markowicz, A. A.,
Eds.; Marcel Dekker, Inc.: New York, 1993. (6) Warren, C. Boston History Review 1999, 73. (7) Fiedler, I.; Bayard, M. In Artists' Pigments: A Handbook of their History and Characteristics; Feller, R. L.,
Ed.; National Gallery of Art: Washington D.C., 1986. (8) Cennini, C. d. A. The Craftsman's Handbook; Dover Publications, Inc.: New York, 1960. (9) Markowicz, A. A. In Handbook of X-ray Spectrometry; Grieken, R. E. v., Markowicz, A. A., Eds.; Marcel
Dekker, Inc.: New York, 1993. (10) Dik, J.; Janssens, K.; Snickt, G. v. d.; Loeff, L. v. d.; Rickers, K.; Cotte, M. Anal. Chem. 2008, 80, 6436-
6442. (11) Woll, A. R.; Mass, J.; Bisulca, C.; Huang, R.; Bilderback, D. H.; Gruner, S.; Gao, N. Appl. Phys. A 2006,
83, 235-238. (12) Havrilla, G. J.; Patterson, B. M. Am. Lab. 2006, 38, 15-22. (13) Plesters, J. In Artists' Pigments: A Handbook of their History and Characteristics, Volume 2; Roy, A., Ed.;
National Gallery of Art: Washington D. C., 1993. (14) Jenkins, R. An Introduction to X-ray Spectrometry; Heyden & Son Ltd.: London, 1974. (15) Berrie, B. H. In Artists' Pigments: A Handbook of their History and Characteristics, Volume 3; Fitzhugh, E.
W., Ed.; National Gallery of Art: Washington D.C., 1997. (16) Herbst, W.; Hunger, K. Industrial Organic Pigments; Wiley-VCH Verlag GmbH & Co. KGaA: Weinheim,
2004. (17) Eastaugh, N.; Walsh, V.; Chaplin, T.; Siddall, R. Pigment Compendium: A Dictionary of Historical
Pigments; Elsevier Butterworth-Heinemann: Amsterdam, 2004. (18) Lide, D. R., Ed. CRC Handbook of Chemistry and Physics, 86th ed.; Taylor & Francis: Boca Raton, 2005. (19) Learner, T.; Getty Conservation Institute. Modern paints uncovered : proceedings from the modern paints
uncovered symposium; Getty Conservation Institute: Los Angeles, 2007.
153Published with permission from the Getty Conservation Institute.Advances in X-ray Analysis, Volume 52