469 Bletter & al. • A digital basemap for the Neotropical flora 53 (2) • May: 469–477 INTRODUCTION Geographic Information Systems (GIS). — Computer hardware and software for capturing, storing, displaying and analyzing geographic information have become increasingly affordable and user-friendly in recent years. The use of GIS has been brought into the mainstream of a number of biological arenas, including aquatic botany (e.g., Caloz & Collet, 1997; Seddon & al., 2000; Li & al., 2002), plant pathology (e.g., Wu & al., 2001), conservation (e.g., Olson & al., 2001; Hamann & al., 2000), and zoology (e.g., Kidd & Ritchie, 2000; Noonan, 1999). Unfortunately, plant systematics has tended to lag behind, and this has impeded not only sci- METHODS & TECHNIQUES A digital base map for studying the Neotropical flora Nat Bletter 1 , John Janovec 2 , Berry Brosi 3 & Douglas C. Daly 2 1 Plant Sciences Dept., Graduate Center, City University of New York and The New York Botanical Garden, Bronx, New York 10458, U.S.A. [email protected]2 The New York Botanical Garden, Bronx, New York 10458, U.S.A. [email protected].; [email protected] (author for cor- respondence) 3 Center for Conservation Biology, Stanford University 385 Serra Mail, Stanford, California 94305, U.S.A. bbrosi@stan- ford.edu Despite advances in Geographic Information Systems (GIS) and remote-sensing technology and software, to date most systematists and other botanists working on the Neotropical flora, particularly on the monographic series Flora Neotropica, have used hard-copy maps. These maps make it possible to see basic distribution patterns, but they are high- ly inaccurate, and the fact that the data are not compiled in digital form means that it is difficult or impossible to retrieve the metadata (i.e., the collection data and attributes of the specimen(s) associated with each point on the map), select and combine distribution datasets for various organisms, perform spatial statistics on the distributions, or overlay species dis- tributions onto maps of soils, climate, and other environmental variables. In an effort to help modernize Neotropical plant studies and make GIS more accessible to botanists, we have developed a digital base map of the Americas with multiple registered map layers that can be superimposed in any combination and can be used to easily create digital distribution maps from collection lists for dissemination and analysis. This base map, freely available to botanists and systematists, was made using ArcView® GIS. Several of the layers were derived from Environmental Systems Research Institute (ESRI) datasets (ArcWorld®, ArcAtlas®, Digital Chart of the World®). For a basic version of this system we obtained additional datasets on vegetation and soils (Woods Hole Research Center), elevation (U.S. Geological Survey), and EcoRegions (World Wildlife Fund); for our own projects, we have added layers from a number of additional sources and more appropriate in scale for Amazonia and the state of Acre, Brazil. The layers are being expanded upon as new data- sets become available, and we are actively seeking additional sets from other sources, including geographical institutes in individual Neotropical countries. This system makes it possible to carry out a number of rather elegant analyses and visua- lizations, including the following: (1) plot the distributions of species and use the overlays to easily visualize coinciden- ce of distribution patterns with geographic and environmental features; (2) map values for morphological characters onto the distribution points in order to examine character variation over the range of the species (e.g., plotting leaf size to see latitudinal or longitudinal patterns); (3) quantitatively analyze spatial statistics (e.g., examining the relationship between fruit size and rainfall); and (4) vastly increase the agility and versatility of historical biogeography techniques. Though any botanist adept at using GIS theoretically could conduct these analyses, the Americas Base Map assembles a dispara- te set of high-quality, botanically relevant environmental and geographic data in one place and provides instructions that obviate the need for deep expertise in GIS. This dramatically improves access to relevant geospatial data for botanists, especially in the developing world, and should serve to expand the use of GIS in plant biogeography. We anticipate that this multifaceted approach to mapping species distributions will facilitate the work of systematists and floristicians, and that it will help Neotropical plant geography to progress from conjecture to testable hypotheses. The Americas Base Map may be utilized by any botanist affiliated with a non-profit institution and with access to ArcView®, and it is available on CD by request. KEYWORDS: Acre, Amazonia, Americas, biogeography, Geographic Information Systems, GIS, mapping, Neotropics,
Transcript
469
Bletter amp al bull A digital basemap for the Neotropical flora53 (2) bull May 469ndash477
INTRODUCTIONGeographic Information Systems (GIS) mdash
Computer hardware and software for capturing storingdisplaying and analyzing geographic information havebecome increasingly affordable and user-friendly inrecent years The use of GIS has been brought into the
mainstream of a number of biological arenas includingaquatic botany (eg Caloz amp Collet 1997 Seddon amp al2000 Li amp al 2002) plant pathology (eg Wu amp al2001) conservation (eg Olson amp al 2001 Hamann ampal 2000) and zoology (eg Kidd amp Ritchie 2000Noonan 1999) Unfortunately plant systematics hastended to lag behind and this has impeded not only sci-
METHODS amp TECHNIQUES
A digital base map for studying the Neotropical flora
Nat Bletter1 John Janovec2 Berry Brosi3 amp Douglas C Daly2
1 Plant Sciences Dept Graduate Center City University of New York and The New York Botanical Garden Bronx NewYork 10458 USA nbletternybgorg
2 The New York Botanical Garden Bronx New York 10458 USA jjanovecnybgorg ddalynybgorg (author for cor-respondence)
3 Center for Conservation Biology Stanford University 385 Serra Mail Stanford California 94305 USA bbrosistan-fordedu
Despite advances in Geographic Information Systems (GIS) and remote-sensing technology and software to date mostsystematists and other botanists working on the Neotropical flora particularly on the monographic series FloraNeotropica have used hard-copy maps These maps make it possible to see basic distribution patterns but they are high-ly inaccurate and the fact that the data are not compiled in digital form means that it is difficult or impossible to retrievethe metadata (ie the collection data and attributes of the specimen(s) associated with each point on the map) select andcombine distribution datasets for various organisms perform spatial statistics on the distributions or overlay species dis-tributions onto maps of soils climate and other environmental variables In an effort to help modernize Neotropical plantstudies and make GIS more accessible to botanists we have developed a digital base map of the Americas with multipleregistered map layers that can be superimposed in any combination and can be used to easily create digital distributionmaps from collection lists for dissemination and analysis This base map freely available to botanists and systematistswas made using ArcViewreg GIS Several of the layers were derived from Environmental Systems Research Institute(ESRI) datasets (ArcWorldreg ArcAtlasreg Digital Chart of the Worldreg) For a basic version of this system we obtainedadditional datasets on vegetation and soils (Woods Hole Research Center) elevation (US Geological Survey) andEcoRegions (World Wildlife Fund) for our own projects we have added layers from a number of additional sources andmore appropriate in scale for Amazonia and the state of Acre Brazil The layers are being expanded upon as new data-sets become available and we are actively seeking additional sets from other sources including geographical institutes inindividual Neotropical countries This system makes it possible to carry out a number of rather elegant analyses and visua-lizations including the following (1) plot the distributions of species and use the overlays to easily visualize coinciden-ce of distribution patterns with geographic and environmental features (2) map values for morphological characters ontothe distribution points in order to examine character variation over the range of the species (eg plotting leaf size to seelatitudinal or longitudinal patterns) (3) quantitatively analyze spatial statistics (eg examining the relationship betweenfruit size and rainfall) and (4) vastly increase the agility and versatility of historical biogeography techniques Thoughany botanist adept at using GIS theoretically could conduct these analyses the Americas Base Map assembles a dispara-te set of high-quality botanically relevant environmental and geographic data in one place and provides instructions thatobviate the need for deep expertise in GIS This dramatically improves access to relevant geospatial data for botanistsespecially in the developing world and should serve to expand the use of GIS in plant biogeography We anticipate thatthis multifaceted approach to mapping species distributions will facilitate the work of systematists and floristicians andthat it will help Neotropical plant geography to progress from conjecture to testable hypotheses The Americas Base Mapmay be utilized by any botanist affiliated with a non-profit institution and with access to ArcViewreg and it is available onCD by request
KEYWORDS Acre Amazonia Americas biogeography Geographic Information Systems GIS mapping Neotropics
entific progress but also the ability of botanists to con-tribute effectively to urgent conservation efforts
Systematic and floristic work are tremendouslylabor-intensive and involve inordinate amounts of cleri-cal work and other relatively unskilled labor particular-ly for mapping species distribution points based onmuseum collections but after a number of years of sys-tematists talking and hearing about it there was still nocommon-access digital base map for systematic andfloristic work on the Neotropical flora as of mid-2002The Flora Neotropica monograph series is the centralfocus of efforts to fully document the flora of the NewWorld tropics but incredibly the distribution maps inalmost all recently published monographs were still gen-erated by hand usually by rubbing black dots showingvery rough locations on old hard-copy base maps withsome misplaced rivers Worse still these maps constitutea dead end that is it is difficult or impossible to retrievethe metadata (ie the collection data and attributes of thespecimen(s) associated with each point on the map)select and combine distribution datasets or overlayspecies distributions onto maps of soils climate andother environmental variables
The researcherrsquos efficiency and productivity can befar greater using GIS now that (s)he needs to enter spec-imen-related data only once and from there importselected fields into a number of software packages thatcan be used to generate lists of exsiccatae perform mor-phometric analyses and create keys Some packagessuch as Linnaeusreg (ETI Information Services Ltd) canperform several of these functions Significantly thesedata can also be linked to geography in a number of waysthrough GIS which allows the user to quickly producemaps in a way that permits immediate recovery of thedata behind each dot on the map and more importantlyin a way that readily lends itself to revision qualitativeand quantitative analysis hypothesis testing and integra-tion with data from other organisms Specifically regard-ing distribution maps accurate datasets can make it pos-sible to formulate and test hypotheses to explain andorpredict distributions through examining layers and(more rigorously) calculating statistics on the databehind the layers this is part of spatial modeling Suchan approach is more in line with standard scientificmethod than most previous floristic and botanical work
While any botanist with access to GIS can producedigital maps with these advantages many have beenimpeded by the lack of quality geographic and environ-mental data on which to base their maps Commercialdatasets are often prohibitively expensive and whilesome datasets are free on the Internet it can be verytime-consuming to locate data of interest download ittransform or configure it to alleviate compatibility issuesand then combine it with other datasets
These limitations to acquiring data are troublesomeenough for researchers in the developed world but areespecially daunting in the developing world where alltoo frequently lack of funds and computer infrastructureoften slower Internet access and sometimes languagebarriers can make data acquisition nearly impossible
An issue that is often overlooked is how absurdlyand unnecessarily inefficient it is for every botanist toretrieve and adapt the same geospatial datamdashldquore-invent-ing the wheelrdquo Too much time is spent on the mechanicsand too little on the actual content of the research
Advances in GIS and the increased accessibility ofGIS software during the past decade have been tightlylinked to the development of a number of biodiversityinformatics programs Systematists should be aware ofthese programs and participate in them where their geo-graphic domains overlap taking advantage of the toolsthey offer but but also contributing data whenever possi-ble Some programs are global in scope such as theGlobal Biodiversity Information Facility-GBIF(wwwgbiforg) and Lifemapper (wwwlifemapperorg)but most are national or regional efforts such asCONABIO in Mexico (wwwconabiogobmx) SPICA inColombia (wwwicnunaleducospica) BioCASE inEurope (wwwbiocaseorg) and CRIA in the state of SatildeoPaulo Brazil (wwwcriaorgbr) GBIF and BioCASE areamong the programs that integrate data from multipleinstitutions Some of the latter programs are of limitedvalue for systematists working on groups not restricted toa single region Datasets can be obtained from some ofthese regional projects but access may be restricted orlimited
There has been a resurgence of interest and activityin predictive habitat distribution modeling includingsurveys and reassessments of techniques (eg Guisan ampZimmermann 2003) Indeed much of the focus of theprograms in biodiversity informatics is on predictivemodeling for example the CRIA program in Satildeo PauloBrazil (httpwwwcriaorgbr) wants to predict ecologi-cal niches for addressing problems related to invasivespecies climate change endangered species protectionand conservation management
Some issues in predictive modeling should be of par-ticular interest to systematists including the relationshipbetween ldquorealrdquo and artefactual gaps in species distribu-tions (eg Anderson 2003) and analyses of relationshipsbetween point locations and environmental variablesassociated with those locations (Stockwell amp Peterson2003) Still given the emphasis of groups like CRIA onregional conservation as well as the lack of GIS expert-ise among systematists the latter have not yet participat-ed in biodiversity informatics programs despite theirmutual interest in species distributions
Bletter amp al bull A digital basemap for the Neotropical flora 53 (2) bull May 2004 xxndashxx
470
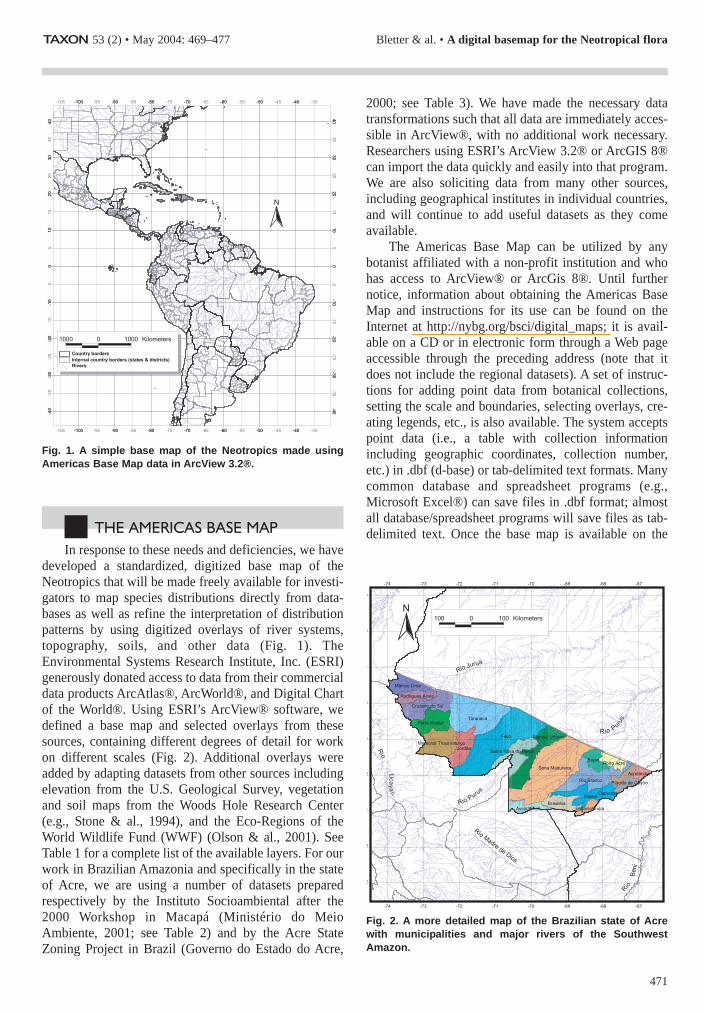
THE AMERICAS BASE MAPIn response to these needs and deficiencies we have
developed a standardized digitized base map of theNeotropics that will be made freely available for investi-gators to map species distributions directly from data-bases as well as refine the interpretation of distributionpatterns by using digitized overlays of river systemstopography soils and other data (Fig 1) TheEnvironmental Systems Research Institute Inc (ESRI)generously donated access to data from their commercialdata products ArcAtlasreg ArcWorldreg and Digital Chartof the Worldreg Using ESRIrsquos ArcViewreg software wedefined a base map and selected overlays from thesesources containing different degrees of detail for workon different scales (Fig 2) Additional overlays wereadded by adapting datasets from other sources includingelevation from the US Geological Survey vegetationand soil maps from the Woods Hole Research Center(eg Stone amp al 1994) and the Eco-Regions of theWorld Wildlife Fund (WWF) (Olson amp al 2001) SeeTable 1 for a complete list of the available layers For ourwork in Brazilian Amazonia and specifically in the stateof Acre we are using a number of datasets preparedrespectively by the Instituto Socioambiental after the2000 Workshop in Macapaacute (Ministeacuterio do MeioAmbiente 2001 see Table 2) and by the Acre StateZoning Project in Brazil (Governo do Estado do Acre
2000 see Table 3) We have made the necessary datatransformations such that all data are immediately acces-sible in ArcViewreg with no additional work necessaryResearchers using ESRIrsquos ArcView 32reg or ArcGIS 8regcan import the data quickly and easily into that programWe are also soliciting data from many other sourcesincluding geographical institutes in individual countriesand will continue to add useful datasets as they comeavailable
The Americas Base Map can be utilized by anybotanist affiliated with a non-profit institution and whohas access to ArcViewreg or ArcGis 8reg Until furthernotice information about obtaining the Americas BaseMap and instructions for its use can be found on theInternet at httpnybgorgbscidigital_maps it is avail-able on a CD or in electronic form through a Web pageaccessible through the preceding address (note that itdoes not include the regional datasets) A set of instruc-tions for adding point data from botanical collectionssetting the scale and boundaries selecting overlays cre-ating legends etc is also available The system acceptspoint data (ie a table with collection informationincluding geographic coordinates collection numberetc) in dbf (d-base) or tab-delimited text formats Manycommon database and spreadsheet programs (egMicrosoft Excelreg) can save files in dbf format almostall databasespreadsheet programs will save files as tab-delimited text Once the base map is available on the
Bletter amp al bull A digital basemap for the Neotropical flora53 (2) bull May 2004 469ndash477
Fig 1 A simple base map of the Neotropics made usingAmericas Base Map data in ArcView 32reg
Fig 2 A more detailed map of the Brazilian state of Acrewith municipalities and major rivers of the SouthwestAmazon
471
Web botanists will be able to download the specificdatasets they need and the data will be updated such thatusers will have access to the latest and most accurateinformation
APPLICATIONS IN SYSTEMATICRESEARCH
The simplest application of the GIS base maps isgenerating species distribution maps The collection dataare entered in a table that can then be easily read into theGIS application and the collection points displayed oversingle or multiple environmental or geographic layers ofthe map Once entered into a GIS application the meta-data (collector habitat description etc) can easily becalled up for any given point or set of points (Fig 3)
The correlation of a species distribution with envi-ronmental factors such as elevation or rainfall can beexamined in a qualitative fashion by simultaneously dis-playing both the species collection points and the envi-ronmental factor map layer (Fig 3) but the GIS softwarealso makes it possible to examine this quantitatively viastatistical spatial correlations of the species distributionwith these environmental factors (eg Noonan 1999)Environmental data from the Americas Base Map can bejoined to a systematistrsquos collection data to produce a
Bletter amp al bull A digital basemap for the Neotropical flora 53 (2) bull May 2004 469ndash477
472
Table 1 List of themes (data layers) currently included in the Americas Base Map with their native resolution and cover-age
Layer Data type Scaleresolution Coverage Source
Country borders Vector 125000000 N amp S America ESRIArcWorldInternal country borders Vector 125000000 N amp S America ESRIArcWorldAgriculture statistics Polygon 125000000 N amp S America ESRIArcWorldCountry statistics Polygon 125000000 N amp S America ESRIArcWorldRoads and railroads Vector 1700000 to 112000000 N amp S America ESRIArcAtlasMinor roads Vector 13000000 Neotropics ESRIArcAtlasProtected areas Polygon gt40000 hectares N amp S America ESRIArcAtlasSmall protected areas Point gt40000 hectares no N amp S America ESRIArcAtlas
boundaries recordedRivers Vector 13000000 N amp S America ESRIArcWorldDetailed Neotropical rivers Vector 11000000 Neotropics ESRIDigital Chart of the WorldMajor rivers and lakes Polygon 13000000 N amp S America ESRIArcWorldDetailed Neotropical lakes Polygon 11000000 Neotropics ESRIDigital Chart of the WorldWater bodies Polygon naa N amp S America ESRIArcAtlasWWF Ecoregions Polygon ~11000000b N amp S America World Wildlife FundVegetation types Polygon 120000000 N amp S America ESRIArcAtlasWHRC vegetation types Grid 1 km S America Woods Hole Research CenterAmazonian vegetation Polygon 15000000 Brazilian Amazonia Woods Hole Research CenterAmazonian soil types Polygon 15000000 Brazilian Amazonia Woods Hole Research CenterSoil types Polygon 15000000 to 110000000 N amp S America ESRIArcAtlasLand use Polygon 115000000 N amp S America ESRIArcAtlasClimatic regions Polygon 115000000 N amp S America ESRIArcAtlasGeology Polygon NA 12000000ndash17603200 N amp S America ESRIArcAtlas
SA 1100000ndash15000000Yearly precipitation Polygon naa N amp S America ESRIArcAtlasYearly temperature Polygon naa N amp S America ESRIArcAtlasElevation Grid 30 seconds (00083333ordm) N amp S America US Geological Survey
a Several layers in the ESRI ArcAtlas dataset do not give resolution or scale information in the documentationb The WWF states that their Ecoregions map is generally at 11000000 scale but because this map was derived from such variable data from different sources some
parts of the map may be be at a higher or lower scale
Fig 3 Distribution of Heliconia scarlatina Abalo amp G LMorales mapped on elevation showing the speciesrsquo Andeanaffinities and preference for mid-range elevations
spreadsheet or database with both collection and envi-ronmental data In this process each species collectionpoint is ldquopunched throughrdquo ie all the environmentalcharacters at that location are found and these charactersare added to the character table for the group under study(in ArcView 32 this is done through the GeoprocessingWizard as a ldquospatial joinrdquo) The resulting joined data canbe used to statistically test hypotheses about species dis-tributions across environmental gradients using multi-variate analysis or for more advanced users in spatialmodeling To date however most spatial environmentaldata in the Americas Base Map and most other generallyavailable datasets are not of high enough resolution to beuseful in this application It is possible to obtain higher-resolution datasets from regional government offices andnon-governmental organizations (NGOs) that make theseapplications possible (see next section)
Complex models of species distributions can be cre-ated using any combination of map layers This mayinvolve values such as elevation or rainfall that are builtinto the base map combined with buffers derived by theuser from additional detailed knowledge about thespecies in question For example a species may be
known to occur within a certain distance of flood zones(a buffer) within a range of average annual temperature(pre-defined) and within a certain range of ratiosbetween clay and sand in the soil and these and otherdata can be made into an hypothetical model of thespecies range As an example Randrianasolo amp al(2002) analyzed the distribution of Anacardiaceae inMadagascar using GAP analysis in which the manage-ment status of plant communities vertebrate species andvertebrate species richness is evaluated via GIS overlayof biological distribution data on a map of existing bio-logical reserves (California GAP Analysis 2002)
Systematists have at their hands a wealth of quanti-tative data that can be used to analyze the geographic dis-tribution and variation of morphological patterns of thespecies they study Traditionally this has been done inthe univariate or bivariate graphing modes of modernstatistical or graphing programs (eg Borchsenius1999)
Through the GIS framework a new set of tools andtechniques is available for displaying quantitative pat-terns of morphological variation in a geospatial frame-work Within ArcView and many other GIS programsindividual points can be displayed as different sizesshapes and colors based on their relative quantitative
Bletter amp al bull A digital basemap for the Neotropical flora53 (2) bull May 2004 469ndash477
473
Table 2 Abridged list of data layers prepared by theInstituto Socioambiental (ISA) for a synthesis of priorityactions for Amazonia (Ministeacuterio do Meio Ambiente2001)
Final version Layera prepared by
State and international boundaries ISAMunicipalities municipal seats IBGEb
Roads and rail lines ISARiver rapids ISATopographic isolines ISASeasonally flooded areas ISARivers ISAHydrological balance (precipation minus WHRCc
evapotranspiration)ldquoPhytophysiognomiesrdquo [~ vegetation types] IBGEState federal conservation units ISASuperposition of state and federal reserves ISAIndigenous territories ISAAreas altered by human activities (includes IBGE
deforestation in 1992 1994 1997)Timber exploitation IMAZONdForest fire locations MMAe EMBRAPAf
Fire risk WHRCIPAM g
Settlement projects INCRAh
Hydroelectric projects Eletrobraacutes amp ISAForest reserves ISAMineral rights ISAa most on a scale of 11000000b IBGE - Instituto Brasileiro de Geografia e Estatiacutesticac WHRC - Woods Hole Research Centerd IMAZON - Instituto do Homem e Meio Ambiente da Amazotildeniae MMA - Ministeacuterio do Meio Ambientef EMBRAPA - Empresa Brasileira de Pesquisa Agropecuaacuteriag IPAM - Instituto de Pesquisa Ambiental da Amazocircniah INCRA - Instituto Nacional de Colonizaccedilatildeo e Reforma Agraacuteria
Table 3 Abridged list of themes (data layers) preparedby the ZEE-Zoneamento Ecoloacutegico-Econocircmico doEstado do Acre (see Governo do Estado do Acre 2000)
AirportsConservation unitsDeforestation areas Disputed Areas [land] FaunaFauna collection pointsstudy sitesFloodplainsFloraRare SWAmazonian endemicsUseful plantsNew taxa New records for BrazilSW Amazonian endemics (not rare)Collection pointsIndigenous areas Indigenous communitiesMajor river basinsMajor riversMajor roadsMunicipal seats MunicipalitiesPrivate landsRiversRoadsSecondary roadsSettlement projectsVegetation 1 Vegetation 2Vegetation types and occurrence of forest resources
values In ArcView this is easily accomplished by sim-ply changing the character settings for the geographictheme such that the points are defined by a ldquoUniqueValuerdquo or graduated color
An additional set of techniques called ldquoraster dataanalysisrdquo in GIS parlance uses a regular grid of pixelsinstead of arbitrarily placed points lines or polygons(ie vector data) While raster data are more memory-intensive because the computer must store null data evenfor grid points where no data have been collected (vectordata are stored only for the locations where they havebeen collected) the simple relational geometry betweengrid cells permits faster computation and more complexanalyses Each pixel potentially contains an associatedquantitative value these values can be displayed by theGIS program as color gradients or three-dimensionalheight fields (ldquoz-valuesrdquo)
In ArcView raster analysis is accomplished throughthe add-on module Spatial Analyst This techniqueallows individual quantitative variables (ie leaf lengthfruit length etc) to be analyzed processed visualizedand presented as continuously changing gradients ratherthan solid polygons or a series of points Using process-es called interpolation and neighborhood analysis valuesare estimated for the pixels in between sample pointsThese are particularly important techniques for botanistsbecause they usually start out with specimen points thatcan have a great deal of empty space between them Theestimated values are presented as a color gradient thusdepicting morphological or environmental gradientsevenly across space instead of only at sporadic pointsThe display provides a quantitative depiction of the dis-tribution of the values thus providing a method for visu-alizing and presenting the overall variation of these val-ues in geospace Interpolation is a useful technique forexploration but care should be taken not to draw broadgeospatial conclusions from the results Rather the pat-terns are presented through interpolated maps with focuson areas where data exist
The system can also be used as a way to investigatemultivariate morphometric patterns on the map Figure 4presents a morphometric analysis of two Compsoneuraspecies (Myristicaceae) showing how the results of sta-tistical analyses can be mapped using GIS with quanti-tative values expressed as a gray-scale gradientCompsoneura mexicana (Hemsl) Janovec and C spru-cei (ADC) Warb once considered to be the samespecies are members of a species complex recentlyinvestigated by Janovec amp Harrison (2002) Principalcomponents analysis (PCA) was conducted on 17 mor-phological characters and the specimen PCA scoreswere converted to a grid and displayed through neigh-borhood statistics with relative values depicted aroundspecimen points on the map The two species are strong-
ly differentiated in the multivariate graphic display (seeFig 4 inset) Combining the PCA graphs with mappingprovides better visualization of the multivariate patternswhich can contribute to the exploration of morphologicaldata patterns
APPLICATIONS TO FLORISTICS ANDCONSERVATION IN SOUTHWEST-ERN AMAZONIA
The potential of floristic work to help guide conser-vation and development policy now hinges on harnessingGIS and linked statistical functions Hence we are devel-oping model applications of the Americas Base Mapproject for our conservation and floristic work in south-western Amazonia specifically in the state of AcreBrazil Note that while we have secured more datasetsfor Amazonia and Acre than for any other (see Tables 2amp 3) we are continuing to add data for all Neotropicalareas
Southwestern Amazonia as a whole and some dis-crete areas it contains are considered conservation prior-ities (eg Olson amp al 1996 Capobianco amp al 2001Ministeacuterio do Meio Ambiente 2001) The government ofAcre is engaged in what has become an extended stateecological-economic zoning project or ZEE (eg
Bletter amp al bull A digital basemap for the Neotropical flora 53 (2) bull May 2004 469ndash477
474
Fig 4 Map diagram of two related Compsoneura species(Myristicaceae) showing how scores from mutivariateanalysis can be mapped as attributes using GISCompsoneura mexicana and C sprucei are members of aspecies complex recently investigated by Janovec ampHarrison (2002) The scores along PC axis one (see insertgraph) have been mapped to demonstrate a multivariate dif-ferentiation of the two species in a geospatial context Atotal of 17 morphological characters was used in the princi-pal components analysis
Governo do Estado do Acre 2000) and a convecircnio (part-nership) between the New York Botanical Garden(NYBG) and the Universidade Federal do Acre has beenable to contribute directly to the creation of new protect-ed areas and the defense of existing conservation unitsthrough the ZEE The ZEE now works mostly with digi-tized thematic maps so conservation-related analysesand arguments that can interact with state agencies in thismedium will be immensely more effective than analysesand arguments without digital geographic informationand presentations
Beyond the activities of our own convecircnio and theAcre state zoning project this region is a major focus ofat least seven groups based in four countries that areactive in research development and conservationEffective coordination of these diverse activities dependson our being able to share link and overlay geo-refer-enced sets of disparate data at several different scalesand all of these projects depend on the mapping andinterpretation of species distributions
This is where the flexibility of the Americas BaseMap to absorb datasets on scales ranging from theWestern Hemisphere to areas smaller than one politicaldepartment in Peru is of fundamental importance Forexample we have acquired a number of datasets from theAcre state zoning project ZEE (Governo do Estado doAcre 2000 see Table 3) These datasets now formattedand incorporated into our expanded version of theAmericas Base Map can provide information on a land-scape scale for each location relevant to diverse studiessuch as characterization of vegetation cover quantitativeforest inventories and management of forest resources
We are also using the system to map the known dis-tributions of all the species of plants recorded fromsouthwestern Amazonia and to identify and explain bio-geographic patterns the results will determine whether(as we hypothesize) the SW Amazon is a distinct phyto-geographical unit and will help justify the conservationimportance of the region and of specific areas within itThe data collection necessary for this project theoretical-ly would involve locating and databasing the geographiccoordinates for the thousands of herbarium collectionsinvolved most of which are not databased and moreoverlack geographic coordinates on their labelsmdashan effortthat would involve tens of thousands of labor hoursThere are tools that partially automate this process(BioGeoMancer httpgeorefnhmkuedu) once thedata are already entered into the computer but theprocess of going from ancient nearly unreadable labelson undatabased herbarium sheets that reference outdatedpolitical divisions to a computer database can still beextremely labor-intensive To circumvent this obstaclewe will map species distributions outside of Acre at thelevel of municipality Coarse distribution maps can be
generated by highlighting the polygons corresponding toeach political subdivision when a species has been col-lected there
More significantly GIS and the Americas Base Mapcan aid and accelerate techniques used in historical bio-geography (eg Crisci amp al 2003) ArcViewreg stream-lines the chore of scoring the occurrence of species in aset of defined geographic areas because it is relativelyeasy to circumscribe sets of areas (by drawing polygonson the base map for each area) and generate the neces-sary matrix of taxa occurrence vs area using the Linkfunction The base map enhances the researcherrsquos versa-tility in testing biogeographic hypotheses because it isalso possible to derive sets of areas from existing layersof the map (eg Ecoregions topography precipitationregimes)
LIMITATIONS AND NEXT STEPSAs in any scientific endeavor the results obtained
using the Americas Base Map can be only as strong asthe data on which they are based Any modeling usingGIS should be appropriate to the scale of the data onwhich it is based while much of our data for geographicfeatures such as river systems and political boundariestend to have workable resolution on a regional scale thisis less true of the environmental data (eg soils and pre-cipitation) included in the Americas Base Map Forexample when we mapped the distribution of Tillandsiaparaensis Mez (Bromeliaceae) on a soils map the distri-bution points for this known white-sand habitat special-ist did not map onto sandy soils because the resolution ofthe soils dataset we currently use is inadequate for thepurpose Similarly using a hemisphere-wide precipita-tion map in modeling a tree species endemic to the OsaPeninsula in Costa Rica is unlikely to give useful results
Incompatibilities of scale constitute a major reasonwhy we are obtaining supplemental datasets and particu-larly for regional-scale sets such as those developed byWWF for the Southwest Amazonia Ecoregion (Olson ampal 2001) and for the southwestern Amazonian state ofAcre Brazil (Governo do Estado do Acre 2000) It isinevitable that the spatial resolution available for a givenset of parameters will vary greatly among regionsbecause while detailed soil data may be available forAcre they may not be for neighboring Ucayali PeruSome datasets themselves are composites and containdifferent degrees of resolution an example is the vegeta-tion map prepared by the Woods Hole Research Center(Stone amp al 1994)
Users of the Americas Base Map must also be awareof different degrees of category resolution in the datasetsas distinct from spatial resolution For example one
Bletter amp al bull A digital basemap for the Neotropical flora53 (2) bull May 2004 469ndash477
475
dataset may map ten different soil types over a verydetailed spatial grid (low category resolution and highspatial resolution) while another dataset may map 20different types but over a less detailed spatial grid (highcategory resolution but lower spatial resolution) Whilethe levels of category and spatial resolution usuallyincrease or decrease in tandem this is not always thecase
In many instances the Americas Base Map offers theadvantage of having more than one dataset available fortesting hypotheses in a given geographic area but theuser should be aware of the origin of the datasets and bewilling to critically examine the primary sources whenchoosing which data are appropriate for their analysesWe will continue to format and add new datasets butusers are encouraged to add other data to their own proj-ects as well as submit new public-domain data to theAmericas Base Map In general the resolution of datashould match the spatial resolution of the analysis when-ever possible
In evaluating data and maps for potential use in aGIS project one must be wary of the common pitfall thatdigital maps tend to be taken as ldquotruthrdquo simply becausethey are in digital format In fact the environmental datain most digital maps is estimated over large spatial areasas it would be impossible to measure a parameter such asrainfall at closely and evenly spaced intervals over theentire Western Hemisphere Ground-truthing (ie con-firming the values of digital map data in the field) is thebest method of assessing the validity of a digital map fora particular area If collection localities are accuratelyrecorded herbarium labels can be used as a quick surro-gate for ground-truthing of vegetation type elevationsoils and water proximity recorded on the label againstthese layers in the base map at the collection location Ifthese do not match well one should look more deeplyinto the sources of the maps
CONCLUSIONSThe Americas Base Map should serve to stimulate
the use of GIS in botanical investigations by putting acollection of free relevant high-quality formatted datainto the hands of botanical researchers We have alreadyseen the utility of the Base Map at the New YorkBotanical Garden where several systematists have putthe data to use in plotting specimens and conductingbasic analyses We suspect that the utility of the data willbe even greater in the developing world where the priceandor inaccessibility of relevant data are serious barriersto the use of GIS by plant scientists
While the data in the Americas Base Map is the high-est quality that is readily available users of the Base Map
are responsible for determining whether or not the char-acterspatial resolution and the accuracy of the data forthe region of interest match the needs of their analysisLimitations of the data aside it is our sincere belief thatthe Americas Base Map will stimulate botanists to puttheir data to work in the service of conservation as wellas begin to quantitatively test hypotheses on species dis-tributions We encourage the reader to utilize and con-tribute to this valuable scientific resource
ACKNOWLEDGEMENTS Partial support for development of the Americas Base Map
was provided by The Tinker Foundation and the NationalScience Foundation Graduate Research Fellowship ProgramFor datasets and advice we thank Charles Peters AmandaNeill Wayt Thomas the Instituto do Meio Ambiente do Estadodo Acre Environmental Systems Research Institute-ESRIPeter Schlesinger and the Woods Hole Research Center TomAllnutt and the World Wildlife Fund-WWF Chelsea Specht(formerly a consultant with WWF) and Daisy Gomes P daSilva and the Acre Zoneamento Ecoloacutegico-Econocircmico project
LITERATURE CITEDAnderson R P 2003 Real vs artefactual absences in species
distributions tests for Oryzomys albigularis (RodentiaMuridae) in Venezuela J Biogeogr 30 591ndash605
Borchsenius F 1999 Morphological variation in Geonomacuneata in western Ecuador Mem New York Bot Gard83 131ndash139
California GAPAnalysis 2002 wwwbiogeog ucsbeduproj-ectsgapgap_homehtml
Caloz R amp Collet C 1997 Geographic information systems(GIS) and remote sensing in aquatic botany methodolog-ical aspects Aquatic Bot 48 209ndash228
Capobianco J P R Veriacutessimo A Moreira A Sawyer DSantos I amp Pinto L P (eds) 2001 Biodiversidade na
Amazocircnia Brasileira Avaliaccedilatildeo e Accedilotildees Prioritaacuterias paraa Conservaccedilatildeo Uso Sustentaacutevel e Reparticcedilatildeo deBenefiacutecios Estaccedilatildeo Liberdade and InstitutoSocioambiental Satildeo Paulo
Crisci J V Katinas L amp Posadas P 2003 HistoricalBiogeographymdashAn Introduction Harvard Univ PressCambridge
Dinerstein E Olson D M Graham D J Webster A LPrimm S A Bookbinder M P amp Ledec G 1995 AConservation Assessment of the Terrestrial Ecoregions ofLatin America and the Caribbean The World BankWorldWildlife Fund Washington DC
Governo do Estado do Acre 2000 Programa Estadual deZoneamento Ecoloacutegico-Econocircmico do Acre vol 1Zoneamento Ecoloacutegico-Econocircmico Recursos Naturais eMeio Ambiente SECTMA Rio Branco
Guisan A amp Zimmermann N 2003 Predictive habitat dis-tribution models in ecology Ecol Mod 135 147ndash186
Bletter amp al bull A digital basemap for the Neotropical flora 53 (2) bull May 2004 469ndash477
476
Hamann A Koshy M P Namkoong G amp Ying C C2000 Genotype times environment interactions in Alnusrubra developing seed zones and seed-transfer guidelineswith spatial statistics and GIS Forest Ecol Managem136 107ndash119
Janovec J P amp Harrison J S 2002 A morphological analy-sis of the Compsoneura sprucei complex (Myristicaceae)with a new combination for the Central American speciesCompsoneura mexicana Syst Bot 27 672ndash673
Kidd D M amp Ritchie M G 2000 Inferring the patterns andcauses of geographic variation in Ephippiger ephippiger(Orthoptera Tettigoniidae) using geographic informationsystems (GIS) Biol J Linn Soc 71 269ndash295
Li W Huang B amp Li R-R 2002 Assessing the effect offisheries development on aquatic vegetation using GISAquatic Bot 73 187ndash199
Ministeacuterio do Meio Ambiente 2001 Avaliaccedilatildeo eIdentificaccedilatildeo de Accedilotildees Prioritaacuterias para a ConservaccedilatildeoUtilizaccedilatildeo Sustentaacutevel e Reparticcedilatildeo de Benefiacutecios daBiodiversidade na Amazocircnia Brasileira MMASBFBrasiacutelia
Noonan G R 1999 GIS analysis of the biogeography of bee-tles of the subgenus Anisodactylus (Insecta ColeopteraCarabidae genus Anisodactylus) J Biogeogr 261147ndash1160
Olson D Dinersten E Castro G amp Maravi E 1996Identifying gaps in botanical information for biodiversityconservation in Latin America and the Caribbean WorldWildlife Fund Washington DC
Olson D M Dinersten E Wikramanayake E DBurgess N D Powell G V N Underwood E CDrsquoAmico J A Itoua I Strand H E Morrison JC Loucks C J Allnutt T F Ricketts T H KuraY Lamoreux J F Wettengel W W Hedao P ampKassem K R 2001 Terrestrial ecoregions of the worlda new map of life on Earth BioScience 51 933ndash937
Randrianasolo A Miller J S amp Consiglio T K 2002Application of IUCN criteria and Red List categories tospecies of five Anacardiaceae genera in MadagascarBiodiv Conserv 11 1289ndash1300
Seddon S Connolly R M amp Edyvane K S 2000 Large-scale seagrass dieback in northern Spencer Gulf SouthAustralia Aquatic Bot 66 297ndash310
Stockwell D amp Townsend Peterson A 2003 Comparison ofresolution of methods used in mapping biodiversity pat-terns from point-occurrence data Ecol Indicators 3213ndash221
Stone T A Schlesinger P Woodwell G M amp HoughtonR A 1994 A map of the vegetation of South Americabased on satellite imagery Photogram Eng Rem Sens60 541ndash551
Wu B M Bruggen A H C van Subbarao K V ampPennings G G H 2001 Spatial analysis of lettucedowny mildew using geostatistics and geographic infor-mation systems Phytopathology 91 134ndash142
Bletter amp al bull A digital basemap for the Neotropical flora53 (2) bull May 2004 469ndash477
477
entific progress but also the ability of botanists to con-tribute effectively to urgent conservation efforts
Systematic and floristic work are tremendouslylabor-intensive and involve inordinate amounts of cleri-cal work and other relatively unskilled labor particular-ly for mapping species distribution points based onmuseum collections but after a number of years of sys-tematists talking and hearing about it there was still nocommon-access digital base map for systematic andfloristic work on the Neotropical flora as of mid-2002The Flora Neotropica monograph series is the centralfocus of efforts to fully document the flora of the NewWorld tropics but incredibly the distribution maps inalmost all recently published monographs were still gen-erated by hand usually by rubbing black dots showingvery rough locations on old hard-copy base maps withsome misplaced rivers Worse still these maps constitutea dead end that is it is difficult or impossible to retrievethe metadata (ie the collection data and attributes of thespecimen(s) associated with each point on the map)select and combine distribution datasets or overlayspecies distributions onto maps of soils climate andother environmental variables
The researcherrsquos efficiency and productivity can befar greater using GIS now that (s)he needs to enter spec-imen-related data only once and from there importselected fields into a number of software packages thatcan be used to generate lists of exsiccatae perform mor-phometric analyses and create keys Some packagessuch as Linnaeusreg (ETI Information Services Ltd) canperform several of these functions Significantly thesedata can also be linked to geography in a number of waysthrough GIS which allows the user to quickly producemaps in a way that permits immediate recovery of thedata behind each dot on the map and more importantlyin a way that readily lends itself to revision qualitativeand quantitative analysis hypothesis testing and integra-tion with data from other organisms Specifically regard-ing distribution maps accurate datasets can make it pos-sible to formulate and test hypotheses to explain andorpredict distributions through examining layers and(more rigorously) calculating statistics on the databehind the layers this is part of spatial modeling Suchan approach is more in line with standard scientificmethod than most previous floristic and botanical work
While any botanist with access to GIS can producedigital maps with these advantages many have beenimpeded by the lack of quality geographic and environ-mental data on which to base their maps Commercialdatasets are often prohibitively expensive and whilesome datasets are free on the Internet it can be verytime-consuming to locate data of interest download ittransform or configure it to alleviate compatibility issuesand then combine it with other datasets
These limitations to acquiring data are troublesomeenough for researchers in the developed world but areespecially daunting in the developing world where alltoo frequently lack of funds and computer infrastructureoften slower Internet access and sometimes languagebarriers can make data acquisition nearly impossible
An issue that is often overlooked is how absurdlyand unnecessarily inefficient it is for every botanist toretrieve and adapt the same geospatial datamdashldquore-invent-ing the wheelrdquo Too much time is spent on the mechanicsand too little on the actual content of the research
Advances in GIS and the increased accessibility ofGIS software during the past decade have been tightlylinked to the development of a number of biodiversityinformatics programs Systematists should be aware ofthese programs and participate in them where their geo-graphic domains overlap taking advantage of the toolsthey offer but but also contributing data whenever possi-ble Some programs are global in scope such as theGlobal Biodiversity Information Facility-GBIF(wwwgbiforg) and Lifemapper (wwwlifemapperorg)but most are national or regional efforts such asCONABIO in Mexico (wwwconabiogobmx) SPICA inColombia (wwwicnunaleducospica) BioCASE inEurope (wwwbiocaseorg) and CRIA in the state of SatildeoPaulo Brazil (wwwcriaorgbr) GBIF and BioCASE areamong the programs that integrate data from multipleinstitutions Some of the latter programs are of limitedvalue for systematists working on groups not restricted toa single region Datasets can be obtained from some ofthese regional projects but access may be restricted orlimited
There has been a resurgence of interest and activityin predictive habitat distribution modeling includingsurveys and reassessments of techniques (eg Guisan ampZimmermann 2003) Indeed much of the focus of theprograms in biodiversity informatics is on predictivemodeling for example the CRIA program in Satildeo PauloBrazil (httpwwwcriaorgbr) wants to predict ecologi-cal niches for addressing problems related to invasivespecies climate change endangered species protectionand conservation management
Some issues in predictive modeling should be of par-ticular interest to systematists including the relationshipbetween ldquorealrdquo and artefactual gaps in species distribu-tions (eg Anderson 2003) and analyses of relationshipsbetween point locations and environmental variablesassociated with those locations (Stockwell amp Peterson2003) Still given the emphasis of groups like CRIA onregional conservation as well as the lack of GIS expert-ise among systematists the latter have not yet participat-ed in biodiversity informatics programs despite theirmutual interest in species distributions
Bletter amp al bull A digital basemap for the Neotropical flora 53 (2) bull May 2004 xxndashxx
470
THE AMERICAS BASE MAPIn response to these needs and deficiencies we have
developed a standardized digitized base map of theNeotropics that will be made freely available for investi-gators to map species distributions directly from data-bases as well as refine the interpretation of distributionpatterns by using digitized overlays of river systemstopography soils and other data (Fig 1) TheEnvironmental Systems Research Institute Inc (ESRI)generously donated access to data from their commercialdata products ArcAtlasreg ArcWorldreg and Digital Chartof the Worldreg Using ESRIrsquos ArcViewreg software wedefined a base map and selected overlays from thesesources containing different degrees of detail for workon different scales (Fig 2) Additional overlays wereadded by adapting datasets from other sources includingelevation from the US Geological Survey vegetationand soil maps from the Woods Hole Research Center(eg Stone amp al 1994) and the Eco-Regions of theWorld Wildlife Fund (WWF) (Olson amp al 2001) SeeTable 1 for a complete list of the available layers For ourwork in Brazilian Amazonia and specifically in the stateof Acre we are using a number of datasets preparedrespectively by the Instituto Socioambiental after the2000 Workshop in Macapaacute (Ministeacuterio do MeioAmbiente 2001 see Table 2) and by the Acre StateZoning Project in Brazil (Governo do Estado do Acre
2000 see Table 3) We have made the necessary datatransformations such that all data are immediately acces-sible in ArcViewreg with no additional work necessaryResearchers using ESRIrsquos ArcView 32reg or ArcGIS 8regcan import the data quickly and easily into that programWe are also soliciting data from many other sourcesincluding geographical institutes in individual countriesand will continue to add useful datasets as they comeavailable
The Americas Base Map can be utilized by anybotanist affiliated with a non-profit institution and whohas access to ArcViewreg or ArcGis 8reg Until furthernotice information about obtaining the Americas BaseMap and instructions for its use can be found on theInternet at httpnybgorgbscidigital_maps it is avail-able on a CD or in electronic form through a Web pageaccessible through the preceding address (note that itdoes not include the regional datasets) A set of instruc-tions for adding point data from botanical collectionssetting the scale and boundaries selecting overlays cre-ating legends etc is also available The system acceptspoint data (ie a table with collection informationincluding geographic coordinates collection numberetc) in dbf (d-base) or tab-delimited text formats Manycommon database and spreadsheet programs (egMicrosoft Excelreg) can save files in dbf format almostall databasespreadsheet programs will save files as tab-delimited text Once the base map is available on the
Bletter amp al bull A digital basemap for the Neotropical flora53 (2) bull May 2004 469ndash477
Fig 1 A simple base map of the Neotropics made usingAmericas Base Map data in ArcView 32reg
Fig 2 A more detailed map of the Brazilian state of Acrewith municipalities and major rivers of the SouthwestAmazon
471
Web botanists will be able to download the specificdatasets they need and the data will be updated such thatusers will have access to the latest and most accurateinformation
APPLICATIONS IN SYSTEMATICRESEARCH
The simplest application of the GIS base maps isgenerating species distribution maps The collection dataare entered in a table that can then be easily read into theGIS application and the collection points displayed oversingle or multiple environmental or geographic layers ofthe map Once entered into a GIS application the meta-data (collector habitat description etc) can easily becalled up for any given point or set of points (Fig 3)
The correlation of a species distribution with envi-ronmental factors such as elevation or rainfall can beexamined in a qualitative fashion by simultaneously dis-playing both the species collection points and the envi-ronmental factor map layer (Fig 3) but the GIS softwarealso makes it possible to examine this quantitatively viastatistical spatial correlations of the species distributionwith these environmental factors (eg Noonan 1999)Environmental data from the Americas Base Map can bejoined to a systematistrsquos collection data to produce a
Bletter amp al bull A digital basemap for the Neotropical flora 53 (2) bull May 2004 469ndash477
472
Table 1 List of themes (data layers) currently included in the Americas Base Map with their native resolution and cover-age
Layer Data type Scaleresolution Coverage Source
Country borders Vector 125000000 N amp S America ESRIArcWorldInternal country borders Vector 125000000 N amp S America ESRIArcWorldAgriculture statistics Polygon 125000000 N amp S America ESRIArcWorldCountry statistics Polygon 125000000 N amp S America ESRIArcWorldRoads and railroads Vector 1700000 to 112000000 N amp S America ESRIArcAtlasMinor roads Vector 13000000 Neotropics ESRIArcAtlasProtected areas Polygon gt40000 hectares N amp S America ESRIArcAtlasSmall protected areas Point gt40000 hectares no N amp S America ESRIArcAtlas
boundaries recordedRivers Vector 13000000 N amp S America ESRIArcWorldDetailed Neotropical rivers Vector 11000000 Neotropics ESRIDigital Chart of the WorldMajor rivers and lakes Polygon 13000000 N amp S America ESRIArcWorldDetailed Neotropical lakes Polygon 11000000 Neotropics ESRIDigital Chart of the WorldWater bodies Polygon naa N amp S America ESRIArcAtlasWWF Ecoregions Polygon ~11000000b N amp S America World Wildlife FundVegetation types Polygon 120000000 N amp S America ESRIArcAtlasWHRC vegetation types Grid 1 km S America Woods Hole Research CenterAmazonian vegetation Polygon 15000000 Brazilian Amazonia Woods Hole Research CenterAmazonian soil types Polygon 15000000 Brazilian Amazonia Woods Hole Research CenterSoil types Polygon 15000000 to 110000000 N amp S America ESRIArcAtlasLand use Polygon 115000000 N amp S America ESRIArcAtlasClimatic regions Polygon 115000000 N amp S America ESRIArcAtlasGeology Polygon NA 12000000ndash17603200 N amp S America ESRIArcAtlas
SA 1100000ndash15000000Yearly precipitation Polygon naa N amp S America ESRIArcAtlasYearly temperature Polygon naa N amp S America ESRIArcAtlasElevation Grid 30 seconds (00083333ordm) N amp S America US Geological Survey
a Several layers in the ESRI ArcAtlas dataset do not give resolution or scale information in the documentationb The WWF states that their Ecoregions map is generally at 11000000 scale but because this map was derived from such variable data from different sources some
parts of the map may be be at a higher or lower scale
Fig 3 Distribution of Heliconia scarlatina Abalo amp G LMorales mapped on elevation showing the speciesrsquo Andeanaffinities and preference for mid-range elevations
spreadsheet or database with both collection and envi-ronmental data In this process each species collectionpoint is ldquopunched throughrdquo ie all the environmentalcharacters at that location are found and these charactersare added to the character table for the group under study(in ArcView 32 this is done through the GeoprocessingWizard as a ldquospatial joinrdquo) The resulting joined data canbe used to statistically test hypotheses about species dis-tributions across environmental gradients using multi-variate analysis or for more advanced users in spatialmodeling To date however most spatial environmentaldata in the Americas Base Map and most other generallyavailable datasets are not of high enough resolution to beuseful in this application It is possible to obtain higher-resolution datasets from regional government offices andnon-governmental organizations (NGOs) that make theseapplications possible (see next section)
Complex models of species distributions can be cre-ated using any combination of map layers This mayinvolve values such as elevation or rainfall that are builtinto the base map combined with buffers derived by theuser from additional detailed knowledge about thespecies in question For example a species may be
known to occur within a certain distance of flood zones(a buffer) within a range of average annual temperature(pre-defined) and within a certain range of ratiosbetween clay and sand in the soil and these and otherdata can be made into an hypothetical model of thespecies range As an example Randrianasolo amp al(2002) analyzed the distribution of Anacardiaceae inMadagascar using GAP analysis in which the manage-ment status of plant communities vertebrate species andvertebrate species richness is evaluated via GIS overlayof biological distribution data on a map of existing bio-logical reserves (California GAP Analysis 2002)
Systematists have at their hands a wealth of quanti-tative data that can be used to analyze the geographic dis-tribution and variation of morphological patterns of thespecies they study Traditionally this has been done inthe univariate or bivariate graphing modes of modernstatistical or graphing programs (eg Borchsenius1999)
Through the GIS framework a new set of tools andtechniques is available for displaying quantitative pat-terns of morphological variation in a geospatial frame-work Within ArcView and many other GIS programsindividual points can be displayed as different sizesshapes and colors based on their relative quantitative
Bletter amp al bull A digital basemap for the Neotropical flora53 (2) bull May 2004 469ndash477
473
Table 2 Abridged list of data layers prepared by theInstituto Socioambiental (ISA) for a synthesis of priorityactions for Amazonia (Ministeacuterio do Meio Ambiente2001)
Final version Layera prepared by
State and international boundaries ISAMunicipalities municipal seats IBGEb
Roads and rail lines ISARiver rapids ISATopographic isolines ISASeasonally flooded areas ISARivers ISAHydrological balance (precipation minus WHRCc
evapotranspiration)ldquoPhytophysiognomiesrdquo [~ vegetation types] IBGEState federal conservation units ISASuperposition of state and federal reserves ISAIndigenous territories ISAAreas altered by human activities (includes IBGE
deforestation in 1992 1994 1997)Timber exploitation IMAZONdForest fire locations MMAe EMBRAPAf
Fire risk WHRCIPAM g
Settlement projects INCRAh
Hydroelectric projects Eletrobraacutes amp ISAForest reserves ISAMineral rights ISAa most on a scale of 11000000b IBGE - Instituto Brasileiro de Geografia e Estatiacutesticac WHRC - Woods Hole Research Centerd IMAZON - Instituto do Homem e Meio Ambiente da Amazotildeniae MMA - Ministeacuterio do Meio Ambientef EMBRAPA - Empresa Brasileira de Pesquisa Agropecuaacuteriag IPAM - Instituto de Pesquisa Ambiental da Amazocircniah INCRA - Instituto Nacional de Colonizaccedilatildeo e Reforma Agraacuteria
Table 3 Abridged list of themes (data layers) preparedby the ZEE-Zoneamento Ecoloacutegico-Econocircmico doEstado do Acre (see Governo do Estado do Acre 2000)
AirportsConservation unitsDeforestation areas Disputed Areas [land] FaunaFauna collection pointsstudy sitesFloodplainsFloraRare SWAmazonian endemicsUseful plantsNew taxa New records for BrazilSW Amazonian endemics (not rare)Collection pointsIndigenous areas Indigenous communitiesMajor river basinsMajor riversMajor roadsMunicipal seats MunicipalitiesPrivate landsRiversRoadsSecondary roadsSettlement projectsVegetation 1 Vegetation 2Vegetation types and occurrence of forest resources
values In ArcView this is easily accomplished by sim-ply changing the character settings for the geographictheme such that the points are defined by a ldquoUniqueValuerdquo or graduated color
An additional set of techniques called ldquoraster dataanalysisrdquo in GIS parlance uses a regular grid of pixelsinstead of arbitrarily placed points lines or polygons(ie vector data) While raster data are more memory-intensive because the computer must store null data evenfor grid points where no data have been collected (vectordata are stored only for the locations where they havebeen collected) the simple relational geometry betweengrid cells permits faster computation and more complexanalyses Each pixel potentially contains an associatedquantitative value these values can be displayed by theGIS program as color gradients or three-dimensionalheight fields (ldquoz-valuesrdquo)
In ArcView raster analysis is accomplished throughthe add-on module Spatial Analyst This techniqueallows individual quantitative variables (ie leaf lengthfruit length etc) to be analyzed processed visualizedand presented as continuously changing gradients ratherthan solid polygons or a series of points Using process-es called interpolation and neighborhood analysis valuesare estimated for the pixels in between sample pointsThese are particularly important techniques for botanistsbecause they usually start out with specimen points thatcan have a great deal of empty space between them Theestimated values are presented as a color gradient thusdepicting morphological or environmental gradientsevenly across space instead of only at sporadic pointsThe display provides a quantitative depiction of the dis-tribution of the values thus providing a method for visu-alizing and presenting the overall variation of these val-ues in geospace Interpolation is a useful technique forexploration but care should be taken not to draw broadgeospatial conclusions from the results Rather the pat-terns are presented through interpolated maps with focuson areas where data exist
The system can also be used as a way to investigatemultivariate morphometric patterns on the map Figure 4presents a morphometric analysis of two Compsoneuraspecies (Myristicaceae) showing how the results of sta-tistical analyses can be mapped using GIS with quanti-tative values expressed as a gray-scale gradientCompsoneura mexicana (Hemsl) Janovec and C spru-cei (ADC) Warb once considered to be the samespecies are members of a species complex recentlyinvestigated by Janovec amp Harrison (2002) Principalcomponents analysis (PCA) was conducted on 17 mor-phological characters and the specimen PCA scoreswere converted to a grid and displayed through neigh-borhood statistics with relative values depicted aroundspecimen points on the map The two species are strong-
ly differentiated in the multivariate graphic display (seeFig 4 inset) Combining the PCA graphs with mappingprovides better visualization of the multivariate patternswhich can contribute to the exploration of morphologicaldata patterns
APPLICATIONS TO FLORISTICS ANDCONSERVATION IN SOUTHWEST-ERN AMAZONIA
The potential of floristic work to help guide conser-vation and development policy now hinges on harnessingGIS and linked statistical functions Hence we are devel-oping model applications of the Americas Base Mapproject for our conservation and floristic work in south-western Amazonia specifically in the state of AcreBrazil Note that while we have secured more datasetsfor Amazonia and Acre than for any other (see Tables 2amp 3) we are continuing to add data for all Neotropicalareas
Southwestern Amazonia as a whole and some dis-crete areas it contains are considered conservation prior-ities (eg Olson amp al 1996 Capobianco amp al 2001Ministeacuterio do Meio Ambiente 2001) The government ofAcre is engaged in what has become an extended stateecological-economic zoning project or ZEE (eg
Bletter amp al bull A digital basemap for the Neotropical flora 53 (2) bull May 2004 469ndash477
474
Fig 4 Map diagram of two related Compsoneura species(Myristicaceae) showing how scores from mutivariateanalysis can be mapped as attributes using GISCompsoneura mexicana and C sprucei are members of aspecies complex recently investigated by Janovec ampHarrison (2002) The scores along PC axis one (see insertgraph) have been mapped to demonstrate a multivariate dif-ferentiation of the two species in a geospatial context Atotal of 17 morphological characters was used in the princi-pal components analysis
Governo do Estado do Acre 2000) and a convecircnio (part-nership) between the New York Botanical Garden(NYBG) and the Universidade Federal do Acre has beenable to contribute directly to the creation of new protect-ed areas and the defense of existing conservation unitsthrough the ZEE The ZEE now works mostly with digi-tized thematic maps so conservation-related analysesand arguments that can interact with state agencies in thismedium will be immensely more effective than analysesand arguments without digital geographic informationand presentations
Beyond the activities of our own convecircnio and theAcre state zoning project this region is a major focus ofat least seven groups based in four countries that areactive in research development and conservationEffective coordination of these diverse activities dependson our being able to share link and overlay geo-refer-enced sets of disparate data at several different scalesand all of these projects depend on the mapping andinterpretation of species distributions
This is where the flexibility of the Americas BaseMap to absorb datasets on scales ranging from theWestern Hemisphere to areas smaller than one politicaldepartment in Peru is of fundamental importance Forexample we have acquired a number of datasets from theAcre state zoning project ZEE (Governo do Estado doAcre 2000 see Table 3) These datasets now formattedand incorporated into our expanded version of theAmericas Base Map can provide information on a land-scape scale for each location relevant to diverse studiessuch as characterization of vegetation cover quantitativeforest inventories and management of forest resources
We are also using the system to map the known dis-tributions of all the species of plants recorded fromsouthwestern Amazonia and to identify and explain bio-geographic patterns the results will determine whether(as we hypothesize) the SW Amazon is a distinct phyto-geographical unit and will help justify the conservationimportance of the region and of specific areas within itThe data collection necessary for this project theoretical-ly would involve locating and databasing the geographiccoordinates for the thousands of herbarium collectionsinvolved most of which are not databased and moreoverlack geographic coordinates on their labelsmdashan effortthat would involve tens of thousands of labor hoursThere are tools that partially automate this process(BioGeoMancer httpgeorefnhmkuedu) once thedata are already entered into the computer but theprocess of going from ancient nearly unreadable labelson undatabased herbarium sheets that reference outdatedpolitical divisions to a computer database can still beextremely labor-intensive To circumvent this obstaclewe will map species distributions outside of Acre at thelevel of municipality Coarse distribution maps can be
generated by highlighting the polygons corresponding toeach political subdivision when a species has been col-lected there
More significantly GIS and the Americas Base Mapcan aid and accelerate techniques used in historical bio-geography (eg Crisci amp al 2003) ArcViewreg stream-lines the chore of scoring the occurrence of species in aset of defined geographic areas because it is relativelyeasy to circumscribe sets of areas (by drawing polygonson the base map for each area) and generate the neces-sary matrix of taxa occurrence vs area using the Linkfunction The base map enhances the researcherrsquos versa-tility in testing biogeographic hypotheses because it isalso possible to derive sets of areas from existing layersof the map (eg Ecoregions topography precipitationregimes)
LIMITATIONS AND NEXT STEPSAs in any scientific endeavor the results obtained
using the Americas Base Map can be only as strong asthe data on which they are based Any modeling usingGIS should be appropriate to the scale of the data onwhich it is based while much of our data for geographicfeatures such as river systems and political boundariestend to have workable resolution on a regional scale thisis less true of the environmental data (eg soils and pre-cipitation) included in the Americas Base Map Forexample when we mapped the distribution of Tillandsiaparaensis Mez (Bromeliaceae) on a soils map the distri-bution points for this known white-sand habitat special-ist did not map onto sandy soils because the resolution ofthe soils dataset we currently use is inadequate for thepurpose Similarly using a hemisphere-wide precipita-tion map in modeling a tree species endemic to the OsaPeninsula in Costa Rica is unlikely to give useful results
Incompatibilities of scale constitute a major reasonwhy we are obtaining supplemental datasets and particu-larly for regional-scale sets such as those developed byWWF for the Southwest Amazonia Ecoregion (Olson ampal 2001) and for the southwestern Amazonian state ofAcre Brazil (Governo do Estado do Acre 2000) It isinevitable that the spatial resolution available for a givenset of parameters will vary greatly among regionsbecause while detailed soil data may be available forAcre they may not be for neighboring Ucayali PeruSome datasets themselves are composites and containdifferent degrees of resolution an example is the vegeta-tion map prepared by the Woods Hole Research Center(Stone amp al 1994)
Users of the Americas Base Map must also be awareof different degrees of category resolution in the datasetsas distinct from spatial resolution For example one
Bletter amp al bull A digital basemap for the Neotropical flora53 (2) bull May 2004 469ndash477
475
dataset may map ten different soil types over a verydetailed spatial grid (low category resolution and highspatial resolution) while another dataset may map 20different types but over a less detailed spatial grid (highcategory resolution but lower spatial resolution) Whilethe levels of category and spatial resolution usuallyincrease or decrease in tandem this is not always thecase
In many instances the Americas Base Map offers theadvantage of having more than one dataset available fortesting hypotheses in a given geographic area but theuser should be aware of the origin of the datasets and bewilling to critically examine the primary sources whenchoosing which data are appropriate for their analysesWe will continue to format and add new datasets butusers are encouraged to add other data to their own proj-ects as well as submit new public-domain data to theAmericas Base Map In general the resolution of datashould match the spatial resolution of the analysis when-ever possible
In evaluating data and maps for potential use in aGIS project one must be wary of the common pitfall thatdigital maps tend to be taken as ldquotruthrdquo simply becausethey are in digital format In fact the environmental datain most digital maps is estimated over large spatial areasas it would be impossible to measure a parameter such asrainfall at closely and evenly spaced intervals over theentire Western Hemisphere Ground-truthing (ie con-firming the values of digital map data in the field) is thebest method of assessing the validity of a digital map fora particular area If collection localities are accuratelyrecorded herbarium labels can be used as a quick surro-gate for ground-truthing of vegetation type elevationsoils and water proximity recorded on the label againstthese layers in the base map at the collection location Ifthese do not match well one should look more deeplyinto the sources of the maps
CONCLUSIONSThe Americas Base Map should serve to stimulate
the use of GIS in botanical investigations by putting acollection of free relevant high-quality formatted datainto the hands of botanical researchers We have alreadyseen the utility of the Base Map at the New YorkBotanical Garden where several systematists have putthe data to use in plotting specimens and conductingbasic analyses We suspect that the utility of the data willbe even greater in the developing world where the priceandor inaccessibility of relevant data are serious barriersto the use of GIS by plant scientists
While the data in the Americas Base Map is the high-est quality that is readily available users of the Base Map
are responsible for determining whether or not the char-acterspatial resolution and the accuracy of the data forthe region of interest match the needs of their analysisLimitations of the data aside it is our sincere belief thatthe Americas Base Map will stimulate botanists to puttheir data to work in the service of conservation as wellas begin to quantitatively test hypotheses on species dis-tributions We encourage the reader to utilize and con-tribute to this valuable scientific resource
ACKNOWLEDGEMENTS Partial support for development of the Americas Base Map
was provided by The Tinker Foundation and the NationalScience Foundation Graduate Research Fellowship ProgramFor datasets and advice we thank Charles Peters AmandaNeill Wayt Thomas the Instituto do Meio Ambiente do Estadodo Acre Environmental Systems Research Institute-ESRIPeter Schlesinger and the Woods Hole Research Center TomAllnutt and the World Wildlife Fund-WWF Chelsea Specht(formerly a consultant with WWF) and Daisy Gomes P daSilva and the Acre Zoneamento Ecoloacutegico-Econocircmico project
LITERATURE CITEDAnderson R P 2003 Real vs artefactual absences in species
distributions tests for Oryzomys albigularis (RodentiaMuridae) in Venezuela J Biogeogr 30 591ndash605
Borchsenius F 1999 Morphological variation in Geonomacuneata in western Ecuador Mem New York Bot Gard83 131ndash139
California GAPAnalysis 2002 wwwbiogeog ucsbeduproj-ectsgapgap_homehtml
Caloz R amp Collet C 1997 Geographic information systems(GIS) and remote sensing in aquatic botany methodolog-ical aspects Aquatic Bot 48 209ndash228
Capobianco J P R Veriacutessimo A Moreira A Sawyer DSantos I amp Pinto L P (eds) 2001 Biodiversidade na
Amazocircnia Brasileira Avaliaccedilatildeo e Accedilotildees Prioritaacuterias paraa Conservaccedilatildeo Uso Sustentaacutevel e Reparticcedilatildeo deBenefiacutecios Estaccedilatildeo Liberdade and InstitutoSocioambiental Satildeo Paulo
Crisci J V Katinas L amp Posadas P 2003 HistoricalBiogeographymdashAn Introduction Harvard Univ PressCambridge
Dinerstein E Olson D M Graham D J Webster A LPrimm S A Bookbinder M P amp Ledec G 1995 AConservation Assessment of the Terrestrial Ecoregions ofLatin America and the Caribbean The World BankWorldWildlife Fund Washington DC
Governo do Estado do Acre 2000 Programa Estadual deZoneamento Ecoloacutegico-Econocircmico do Acre vol 1Zoneamento Ecoloacutegico-Econocircmico Recursos Naturais eMeio Ambiente SECTMA Rio Branco
Guisan A amp Zimmermann N 2003 Predictive habitat dis-tribution models in ecology Ecol Mod 135 147ndash186
Bletter amp al bull A digital basemap for the Neotropical flora 53 (2) bull May 2004 469ndash477
476
Hamann A Koshy M P Namkoong G amp Ying C C2000 Genotype times environment interactions in Alnusrubra developing seed zones and seed-transfer guidelineswith spatial statistics and GIS Forest Ecol Managem136 107ndash119
Janovec J P amp Harrison J S 2002 A morphological analy-sis of the Compsoneura sprucei complex (Myristicaceae)with a new combination for the Central American speciesCompsoneura mexicana Syst Bot 27 672ndash673
Kidd D M amp Ritchie M G 2000 Inferring the patterns andcauses of geographic variation in Ephippiger ephippiger(Orthoptera Tettigoniidae) using geographic informationsystems (GIS) Biol J Linn Soc 71 269ndash295
Li W Huang B amp Li R-R 2002 Assessing the effect offisheries development on aquatic vegetation using GISAquatic Bot 73 187ndash199
Ministeacuterio do Meio Ambiente 2001 Avaliaccedilatildeo eIdentificaccedilatildeo de Accedilotildees Prioritaacuterias para a ConservaccedilatildeoUtilizaccedilatildeo Sustentaacutevel e Reparticcedilatildeo de Benefiacutecios daBiodiversidade na Amazocircnia Brasileira MMASBFBrasiacutelia
Noonan G R 1999 GIS analysis of the biogeography of bee-tles of the subgenus Anisodactylus (Insecta ColeopteraCarabidae genus Anisodactylus) J Biogeogr 261147ndash1160
Olson D Dinersten E Castro G amp Maravi E 1996Identifying gaps in botanical information for biodiversityconservation in Latin America and the Caribbean WorldWildlife Fund Washington DC
Olson D M Dinersten E Wikramanayake E DBurgess N D Powell G V N Underwood E CDrsquoAmico J A Itoua I Strand H E Morrison JC Loucks C J Allnutt T F Ricketts T H KuraY Lamoreux J F Wettengel W W Hedao P ampKassem K R 2001 Terrestrial ecoregions of the worlda new map of life on Earth BioScience 51 933ndash937
Randrianasolo A Miller J S amp Consiglio T K 2002Application of IUCN criteria and Red List categories tospecies of five Anacardiaceae genera in MadagascarBiodiv Conserv 11 1289ndash1300
Seddon S Connolly R M amp Edyvane K S 2000 Large-scale seagrass dieback in northern Spencer Gulf SouthAustralia Aquatic Bot 66 297ndash310
Stockwell D amp Townsend Peterson A 2003 Comparison ofresolution of methods used in mapping biodiversity pat-terns from point-occurrence data Ecol Indicators 3213ndash221
Stone T A Schlesinger P Woodwell G M amp HoughtonR A 1994 A map of the vegetation of South Americabased on satellite imagery Photogram Eng Rem Sens60 541ndash551
Wu B M Bruggen A H C van Subbarao K V ampPennings G G H 2001 Spatial analysis of lettucedowny mildew using geostatistics and geographic infor-mation systems Phytopathology 91 134ndash142
Bletter amp al bull A digital basemap for the Neotropical flora53 (2) bull May 2004 469ndash477
477
Hamann A Koshy M P Namkoong G amp Ying C C2000 Genotype times environment interactions in Alnusrubra developing seed zones and seed-transfer guidelineswith spatial statistics and GIS Forest Ecol Managem136 107ndash119
Janovec J P amp Harrison J S 2002 A morphological analy-sis of the Compsoneura sprucei complex (Myristicaceae)with a new combination for the Central American speciesCompsoneura mexicana Syst Bot 27 672ndash673
Kidd D M amp Ritchie M G 2000 Inferring the patterns andcauses of geographic variation in Ephippiger ephippiger(Orthoptera Tettigoniidae) using geographic informationsystems (GIS) Biol J Linn Soc 71 269ndash295
Li W Huang B amp Li R-R 2002 Assessing the effect offisheries development on aquatic vegetation using GISAquatic Bot 73 187ndash199
Ministeacuterio do Meio Ambiente 2001 Avaliaccedilatildeo eIdentificaccedilatildeo de Accedilotildees Prioritaacuterias para a ConservaccedilatildeoUtilizaccedilatildeo Sustentaacutevel e Reparticcedilatildeo de Benefiacutecios daBiodiversidade na Amazocircnia Brasileira MMASBFBrasiacutelia
Noonan G R 1999 GIS analysis of the biogeography of bee-tles of the subgenus Anisodactylus (Insecta ColeopteraCarabidae genus Anisodactylus) J Biogeogr 261147ndash1160
Olson D Dinersten E Castro G amp Maravi E 1996Identifying gaps in botanical information for biodiversityconservation in Latin America and the Caribbean WorldWildlife Fund Washington DC
Olson D M Dinersten E Wikramanayake E DBurgess N D Powell G V N Underwood E CDrsquoAmico J A Itoua I Strand H E Morrison JC Loucks C J Allnutt T F Ricketts T H KuraY Lamoreux J F Wettengel W W Hedao P ampKassem K R 2001 Terrestrial ecoregions of the worlda new map of life on Earth BioScience 51 933ndash937
Randrianasolo A Miller J S amp Consiglio T K 2002Application of IUCN criteria and Red List categories tospecies of five Anacardiaceae genera in MadagascarBiodiv Conserv 11 1289ndash1300
Seddon S Connolly R M amp Edyvane K S 2000 Large-scale seagrass dieback in northern Spencer Gulf SouthAustralia Aquatic Bot 66 297ndash310
Stockwell D amp Townsend Peterson A 2003 Comparison ofresolution of methods used in mapping biodiversity pat-terns from point-occurrence data Ecol Indicators 3213ndash221
Stone T A Schlesinger P Woodwell G M amp HoughtonR A 1994 A map of the vegetation of South Americabased on satellite imagery Photogram Eng Rem Sens60 541ndash551
Wu B M Bruggen A H C van Subbarao K V ampPennings G G H 2001 Spatial analysis of lettucedowny mildew using geostatistics and geographic infor-mation systems Phytopathology 91 134ndash142
Bletter amp al bull A digital basemap for the Neotropical flora53 (2) bull May 2004 469ndash477