XXIX CONFERENZA ITALIANA DI SCIENZE REGIONALI DO WE CARE ABOUT BUILT CULTURAL HERITAGE? THE EMPIRICAL EVIDENCE BASED ON THE VENETO HOUSE MARKET. Paolo ROSATO 1 , Lucia ROTARIS 2 , Margaretha BREIL 3 e Valentina ZANATTA 3 1 Fondazione Eni Enrico Mattei, Campo Santa Maria Formosa, Venezia, e Dipartimento di Ingegneria Civile ed Ambientale, Università di Trieste, Piazzale Europa 1, Trieste 2 Fondazione Eni Enrico Mattei, Campo Santa Maria Formosa, Venezia, e Dipartimento di Scienze Economiche e Statistiche, Università di Trieste, Piazzale Europa 1, Trieste 3 Fondazione Eni Enrico Mattei, Campo Santa Maria Formosa, Venezia SOMMARIO Il patrimonio storico-architettonico italiano richiede continui e costosi interventi per la sua conservazione, ma, contrariamente a quanto si constata in altri paesi, ad esempio gli Stati Uniti, la spesa pubblica destinata a questo scopo è relativamente modesta. Se, ed entro quali limiti, il costo della conservazione debba essere a carico dello stato dipende dal valore che la collettività attribuisce alle esternalità positive generate da tale patrimonio. L’obiettivo di questa ricerca è stato di stimare l’effetto che l’esistenza di edifici di particolare pregio storico- architettonico esercita sul valore immobiliare circostante. A tale scopo è stato condotto uno studio sull’insieme di ville storiche, abitazioni tipiche, borghi, siti archeologici, palazzi civici, piazze, rocche ed edifici religiosi che costituiscono il patrimonio storico-architettonico della regione Veneto. La ricerca è stata condotta utilizzando il metodo dei prezzi edonici ed i valori immobiliari pubblicati dall’osservatorio immobiliare dell’agenzia delle entrate. I risultati ottenuti hanno permesso di evidenziare da un lato che la presenza di borghi, ville storiche e siti archeologici influenza positivamente i valori immobiliari censiti e dall’altro che tale influenza è maggiore quando alla presenza di questi manufatti si associa una maggiore concentrazione di attività di tipo terziario e turistico.
Transcript
XXIX CONFERENZA ITALIANA DI SCIENZE REGIONALI
DO WE CARE ABOUT BUILT CULTURAL HERITAGE? THE EMPIRICAL EVIDENCE
BASED ON THE VENETO HOUSE MARKET.
Paolo ROSATO1, Lucia ROTARIS
2, Margaretha BREIL
3 e Valentina ZANATTA
3
1 Fondazione Eni Enrico Mattei, Campo Santa Maria Formosa, Venezia, e Dipartimento di Ingegneria Civile ed
Ambientale, Università di Trieste, Piazzale Europa 1, Trieste
2 Fondazione Eni Enrico Mattei, Campo Santa Maria Formosa, Venezia, e Dipartimento di Scienze Economiche
e Statistiche, Università di Trieste, Piazzale Europa 1, Trieste
3 Fondazione Eni Enrico Mattei, Campo Santa Maria Formosa, Venezia
SOMMARIO
Il patrimonio storico-architettonico italiano richiede continui e costosi interventi per la sua
conservazione, ma, contrariamente a quanto si constata in altri paesi, ad esempio gli Stati
Uniti, la spesa pubblica destinata a questo scopo è relativamente modesta. Se, ed entro quali
limiti, il costo della conservazione debba essere a carico dello stato dipende dal valore che la
collettività attribuisce alle esternalità positive generate da tale patrimonio. L’obiettivo di
questa ricerca è stato di stimare l’effetto che l’esistenza di edifici di particolare pregio storico-
architettonico esercita sul valore immobiliare circostante. A tale scopo è stato condotto uno
studio sull’insieme di ville storiche, abitazioni tipiche, borghi, siti archeologici, palazzi civici,
piazze, rocche ed edifici religiosi che costituiscono il patrimonio storico-architettonico della
regione Veneto. La ricerca è stata condotta utilizzando il metodo dei prezzi edonici ed i valori
immobiliari pubblicati dall’osservatorio immobiliare dell’agenzia delle entrate. I risultati
ottenuti hanno permesso di evidenziare da un lato che la presenza di borghi, ville storiche e
siti archeologici influenza positivamente i valori immobiliari censiti e dall’altro che tale
influenza è maggiore quando alla presenza di questi manufatti si associa una maggiore
concentrazione di attività di tipo terziario e turistico.
1 INTRODUCTION
Italian historical buildings require urgent and costly maintenance and restoration works, but
neither the local, nor the national public administrators can afford these expenditures.
Nevertheless the built cultural heritage represent a unique resource of the territory, as it
embodies the local social, historical, and cultural values, generates positive externalities
(Musgrave, 1959), and stimulates economic activities mainly related to tourism.
Is it possible to quantify how much we care about historical buildings and to measure this
value in monetary terms? The aim of this paper is to answer to this question via the
hedonimetric approach. Specifically, we try to verify if the proximity to historical villas,
districts, palaces, squares, fortresses, religious buildings and archeological site systematically
influence the house market equilibrium price in the Veneto region (Italy).
The paper is organized as follows: in section two a brief review of the literature is reported, in
section three the database used for the hedonimetric estimates is described, in section four the
econometric models and the results we had obtained are illustrated, and in section five some
final comments are drawn.
2 LITERATURE REVIEW
Accordingly to Throsby (2001) the value of built cultural heritage is made of several
components beside the economic one which belong to aesthetical, spiritual, social, historical,
and symbolical dimension. They are deeply connected to the environment and the landscape
where the building is located, and are extremely difficult to be measured as the market of
these kind of buildings, if and when it exists, is not characterized by perfect competition and
perfect information.
Recently the economic literature (Sirchia, 2000) has underlined the similarities existing
between cultural heritage and environment management issues in terms of diversity
conservation, resilience, stock maintenance, and intergeneration equity. Indeed, similarly to
the environmental economics principles (Pearce and Turner, 1991), the total economic value
(TEV) of built cultural heritage can be imagined as made of four elements: its direct use
value, its indirect use value (positive externalities), its option value, and its non-use value.
Different methodologies have been used in order to estimate these value components: some
are based on revealed preferences (travel cost, and hedonic price), while others are based on
stated preferences (contingent valuation, and conjoint analysis) (Navrud and Ready, 2002).
The first ones are based on real choices made in markets which are indirectly affected by the
presence of historical buildings, that is the tourism sector and the house market, while the
second ones are based on hypothetical choices that are related to the existence or the
maintenance level of historical buildings and that are collected via surveys involving samples
of the population. The methodologies more frequently applied are contingent valuation and
travel costs, and they are generally used to estimate the TEV of a specific site, monument or
building. As for the hedonic price technique, the constrains of the hypotheses1 on which this
methodology is based has limited its application. Probably its most relevant limit is that it
truly captures the value of the cultural good if the benefit falls only, or mainly, on people
living in that specific site. Indeed, according to Navrud and Ready (2002) the hedonic price
estimates explain only a part of the total value of a cultural good, although the bias decreases
as the cultural good prestige has local, rather than national or global, nature. Nevertheless
there are several studies using this technique which is by now reliable and deep-rooted. The
results reported in the literature demonstrates that the “listed”2 building condition can
influence the house market price from a minimum of - 23% (Asabere et at., 1994 ) to a
maximum of +18% (Coulson et al., 2001 ); the localization in a listed district can make the
price range from +5% to +84% accordingly to the city where the house market is referred to
(Leichenko et al., 2001); while the architectural style of the house account for a price
variation that goes from - 40% to +36% depending on the type of style considered
(Moorhouse and Smith, 1984).
Operatively the hedonic price method is characterized by two phases: (i) the definition of the
hedonic price function, where the price of the houses sampled for the study is the dependent
variable, and the characteristics of the house, of the neighbourhood, and of the city where it is
located are the independent variables, and (ii) the estimation of the parameters included in the
function, so that each parameter measures the impact of each characteristic on the house price
variable.
3 DATA BASE AND DESCRIPTIVE STATISTICS
The data base used for this study covers the house market of the Veneto region (north-eastern
part of Italy). This is one of the most populous areas of Italy, with about 4,5 millions
inhabitants and a surface of 18.379 km2. In the region there are 581 municipalities and 7
counties, Belluno is the less populated one, all the others, except for Rovigo, have a
population of about 800.000 inhabitants.
1 Each investor perfectly knows the price and the features of all the available buildings in the market, has not
spatial constrains, faces the same transaction costs as the other investors, and operates in a perfectly competitive
market. 2 building or other structure officially designated as being of special architectural, historical or cultural
significance.
Figure 1 Veneto counties and geographical characteristics
The market prices are those published by the Italian Economy Ministry in the website of the
Agenzia del Territorio3, which is the agency managing real estate tax in Italy. Specifically
they refer to the maximum and the minimum price (expressed in € per m2) registered in 2001
for a house with standard characteristics localized in the central and in the peripheral area of
each municipality in Veneto. Figure 2 represents the spatial distribution of the central
maximum values.
3 http://agenziaterritorio.it
Figure. 2 Central maximum values (€ per m2)
The costal areas (both by the sea and by the Garda lake), the north-eastern part of the region
(that is the northern part of the Belluno county), and the area surrounding Asiago, which are
typical tourism destinations, present the highest values, while the Polesine, which is the
southern part of the Veneto region characterized by agricultural and low value added
activities, and the mountain areas not involved in tourism activities have the lowest values.
Three accessibility indicators had been calculated for each municipality, assigning the value 1
if the council has a railway station (railway accessibility), is located near the motorway
(motorway accessibility), or in the vicinity of the regional road network (regional road
accessibility), and the value 0 otherwise. The accessibility level is uniform and quite high all
over the region.
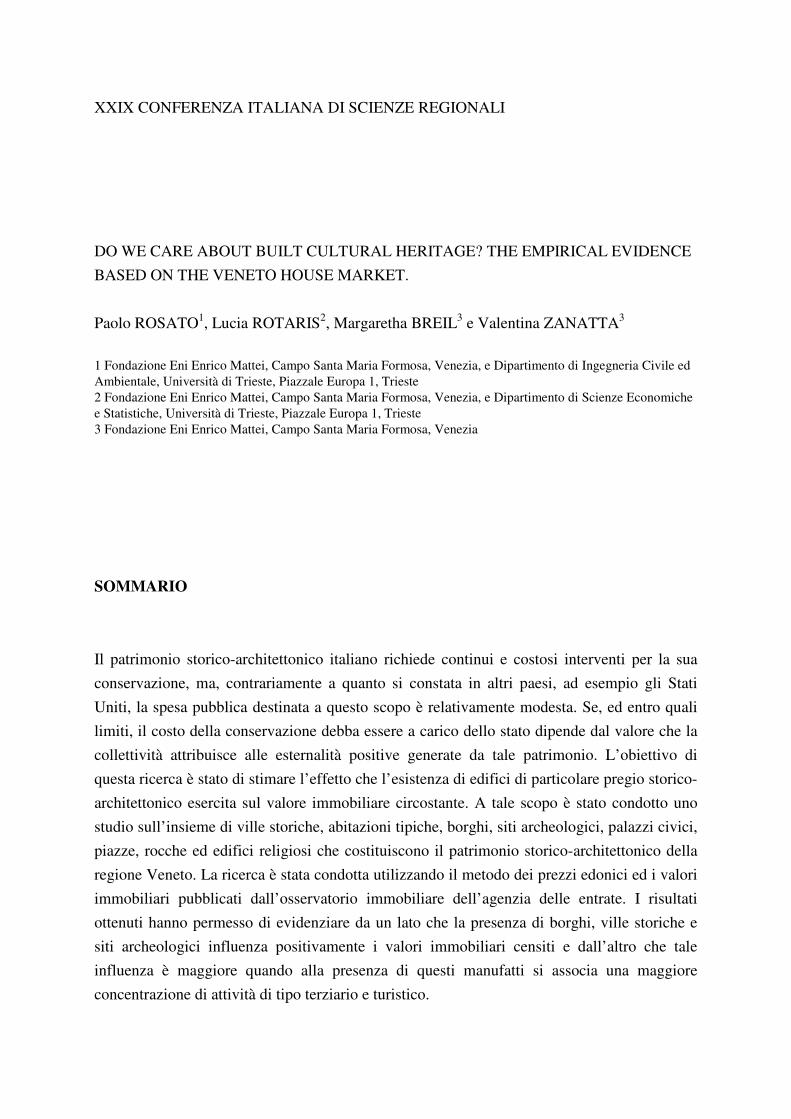
To describe the environmental quality of each municipality the surface (in per cent terms)
characterized by urban infrastructures, woods, mountains, meadows or pastures, arable land,
orchards or vineyards, rivers, lakes or coast, as reported in the Corine 2001 data base4, had
been collected (fig. 3). Moreover two indexes had been calculated: one representing the ratio
of the area with meadows or pastures and the area with woods, named landscape index, and
one representing the landscape variety that is:
Landscape variety index = - Σk ((% area with use k) * ln (% area with use k))
4 http://dataservice.eea.europa.eu/dataservice/
Figure 3 Percentage of municipality area with mountains (a) and with orchards or vineyards
(b).
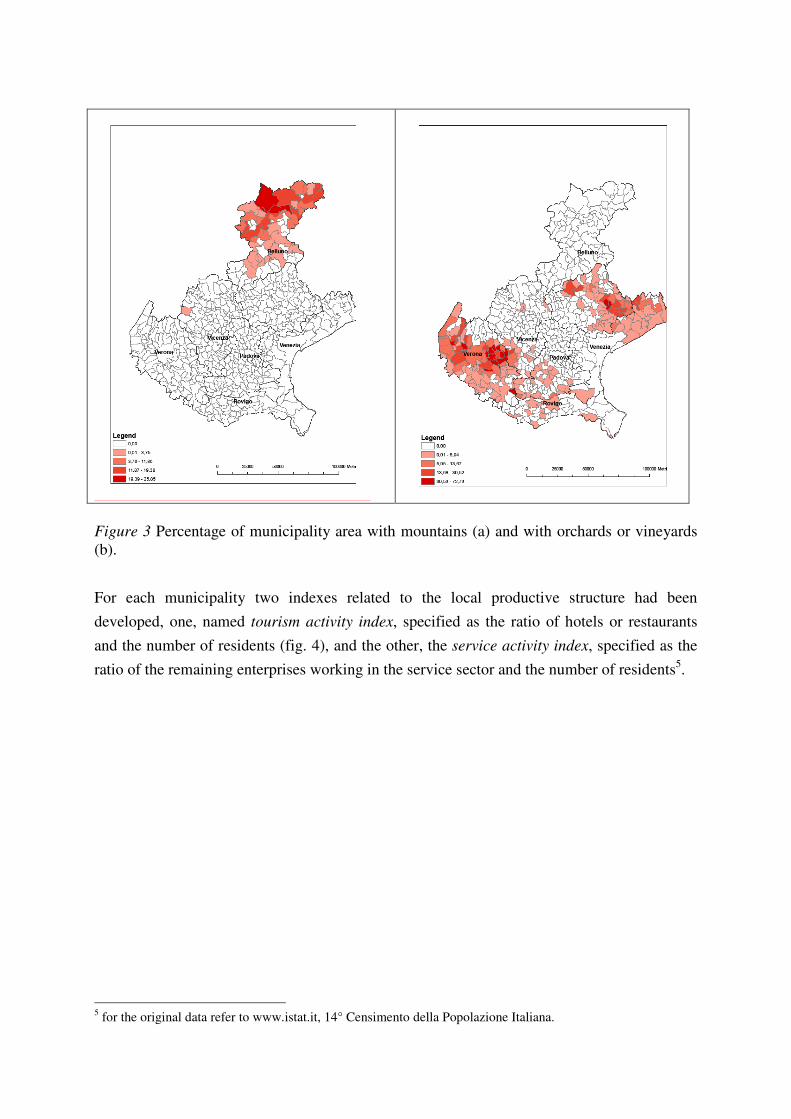
For each municipality two indexes related to the local productive structure had been
developed, one, named tourism activity index, specified as the ratio of hotels or restaurants
and the number of residents (fig. 4), and the other, the service activity index, specified as the
ratio of the remaining enterprises working in the service sector and the number of residents5.
5 for the original data refer to www.istat.it, 14° Censimento della Popolazione Italiana.
Figure 4 Tourist activity index
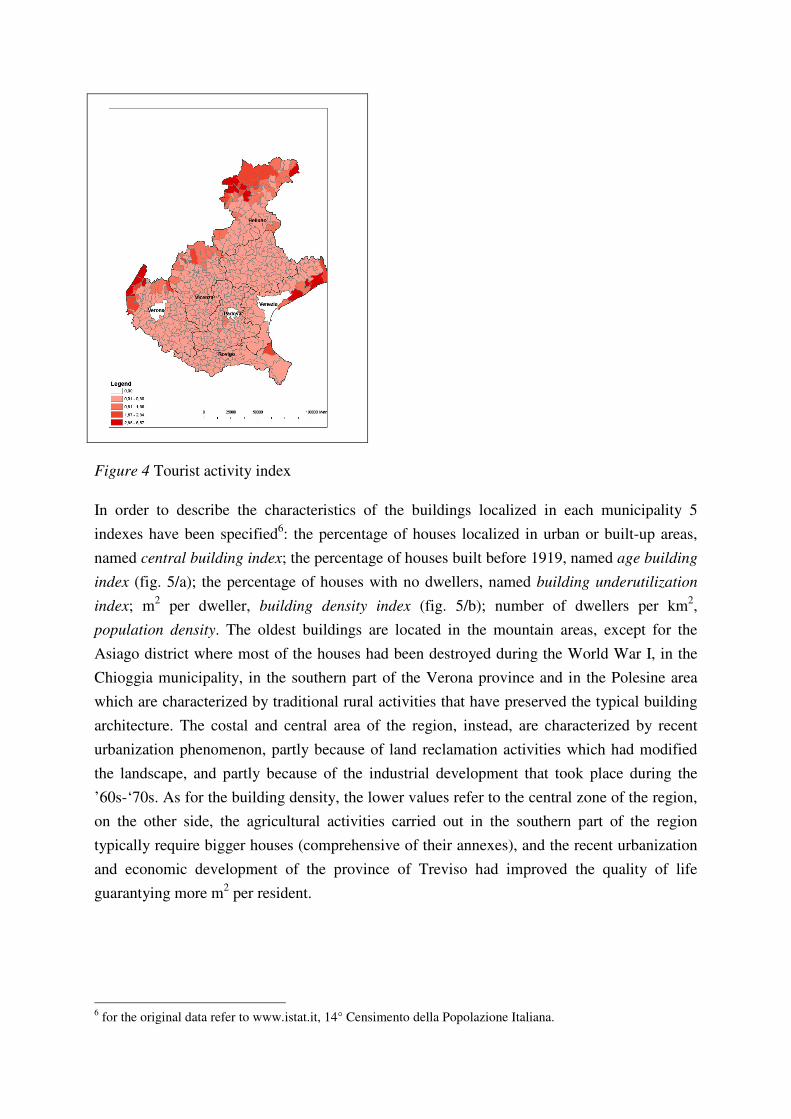
In order to describe the characteristics of the buildings localized in each municipality 5
indexes have been specified6: the percentage of houses localized in urban or built-up areas,
named central building index; the percentage of houses built before 1919, named age building
index (fig. 5/a); the percentage of houses with no dwellers, named building underutilization
index; m2 per dweller, building density index (fig. 5/b); number of dwellers per km
2,
population density. The oldest buildings are located in the mountain areas, except for the
Asiago district where most of the houses had been destroyed during the World War I, in the
Chioggia municipality, in the southern part of the Verona province and in the Polesine area
which are characterized by traditional rural activities that have preserved the typical building
architecture. The costal and central area of the region, instead, are characterized by recent
urbanization phenomenon, partly because of land reclamation activities which had modified
the landscape, and partly because of the industrial development that took place during the
’60s-‘70s. As for the building density, the lower values refer to the central zone of the region,
on the other side, the agricultural activities carried out in the southern part of the region
typically require bigger houses (comprehensive of their annexes), and the recent urbanization
and economic development of the province of Treviso had improved the quality of life
guarantying more m2 per resident.
6 for the original data refer to www.istat.it, 14° Censimento della Popolazione Italiana.
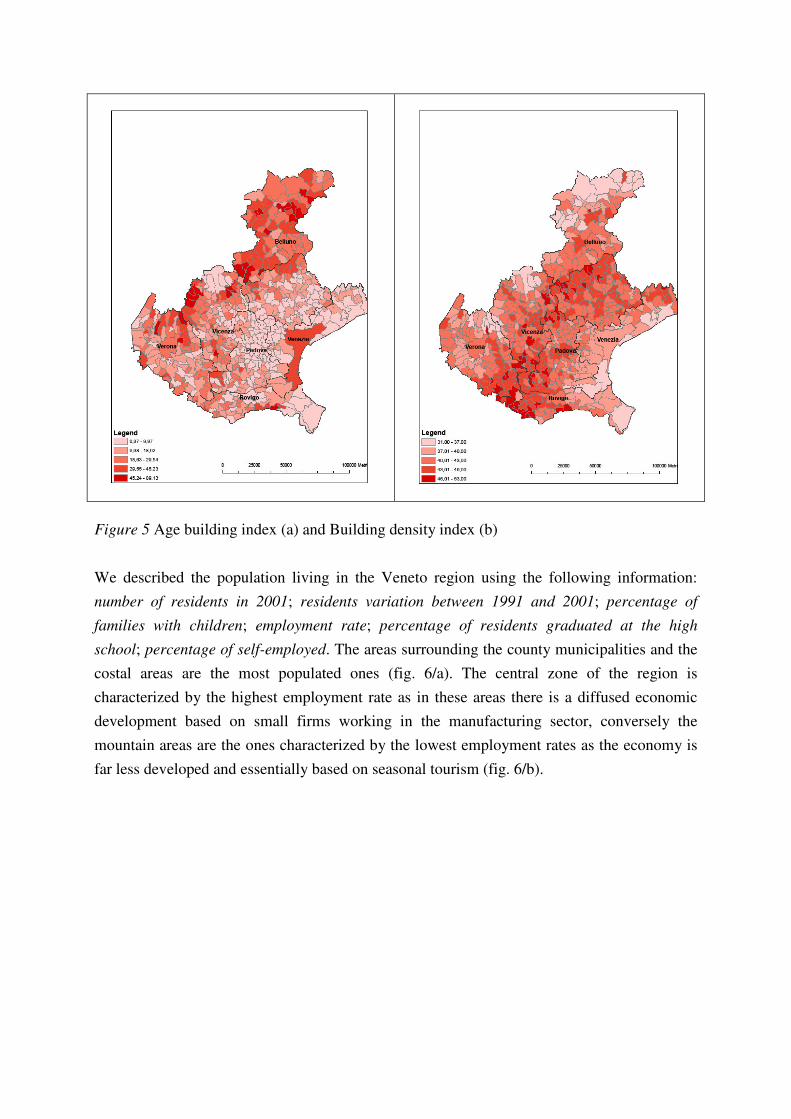
Figure 5 Age building index (a) and Building density index (b)
We described the population living in the Veneto region using the following information:
number of residents in 2001; residents variation between 1991 and 2001; percentage of
families with children; employment rate; percentage of residents graduated at the high
school; percentage of self-employed. The areas surrounding the county municipalities and the
costal areas are the most populated ones (fig. 6/a). The central zone of the region is
characterized by the highest employment rate as in these areas there is a diffused economic
development based on small firms working in the manufacturing sector, conversely the
mountain areas are the ones characterized by the lowest employment rates as the economy is
far less developed and essentially based on seasonal tourism (fig. 6/b).
Figure 6 Residents in 2001 (a) and Employment rate (b)
Finally on the bases of the information reported in the Guida del Touring Club Italiano -
Veneto, the characteristics of the built cultural heritage localized in each municipality had
been collected, that is the number of historical villas (fig. 7/a), traditional buildings, palaces,
historical districts (fig. 7/b), squares, fortresses, religious buildings and archeological sites.
In particular we counted 429 villas all over the Veneto region, they are localized especially
along the Riviera del Brenta (between Venice and Padua), the Terraglio area (between Venice
and Treviso), and in the Verona and Vicenza counties, and 52 historical districts. The length
of the municipality description and of the district description (if any) had been included in the
database too.
Figure 7 Number of historical villas (a) and of historical districts (b)
Table 1 Descriptive statistics of the variables
Minimum Maximum Mean Std. Deviation
Min price (€ per m2) area in central area 383 1750 778.90 182.96
Max price (€ per m2) area in central area 547 2152 976.59 238.26
Min price (€ per m2) area in peripheral area 332 1412 624.53 149.96
Max price (€ per m2) area in peripheral area 448 1631 835.94 178.39
Motorway accessibility 0 1 0.05 0.22
Regional road accessibility 0 1 0.80 0.40
Railway accessibility 0 1 0.26 0.44
Municipality % area with urban infrastructures 0 47.35 8.33 7.33
Municipality % area with woods 0 97.83 19.98 28.89
Municipality % area with meadows or pastures 0 58.99 3.65 8.32
Municipality % area with arable land 0 100.00 62.45 32.84
Municipality % area with orchards or vineyards 0 72.73 2.79 8.24
Municipality % area with high mountains 0 25.76 0.55 2.71
Municipality % area with rivers, lakes or coast 0 71.41 2.16 8.11
Municipality % non classified area 0 13.53 0.09 0.62
Landscape index 0 17363.91 99.32 1170.93
Landscape variety index 0 1.45 0.63 0.33
Tourism activity index 0.60 12.53 3.89 1.37
Service activity index 0.08 6.57 0.56 0.63
Central building index 13.43 100.00 73.80 16.77
Age building index 0.37 89.13 17.79 12.95
Building density index 30.53 52.95 42.43 3.14
Population density index 5.70 1632.00 251.97 217.12
Building underutilization index 0 13.10 4.68 2.36
% of families with children 33.33 69.05 59.62 4.19
Employment rate 35.02 60.44 51.17 3.95
% of graduated at high school 7.34 40.59 23.95 5.07
% of self employed 1.52 16.57 6.54 2.05
Residents in 2001 127 51755 6111.82 6225.34
Residents variation between 1991 and 2001 -2024 2938 306.90 563.77
Municipality listed in the Guida del Touring Club Italiano 0 1 0.83 0.38
Length of Municipality description in the Guida Touring
Club Italiano 0 354 11.38 24.28
Historical villas 0 13 0.75 1.51
Traditional buildings 0 23 0.19 1.10
Palaces 0 18 0.42 1.71
Historical districts 0 2 0.09 0.30
Length of district description in the Guida Touring Club
Italiano 0 90 0.89 5.60
Squares 0 7 0.17 0.66
Fortresses 0 2 0.09 0.32
Religious buildings 0 18 0.73 1.42
Archeological sites 0 1 0.03 0.16
4 ECONOMETRIC ANALYSIS
In order to measure the effect that the built cultural heritage produces on the house market
values in the Veneto region we have estimated the following model:
1 1 1 1 1
E V I D B
j jm jm jv jv ji ji jd jd jp jp
e v i d b
Y ES VS IS D BCHα β λ δ ω σ= = = = =
= + + + + +∑ ∑ ∑ ∑ ∑ (1)
Where:
Y= max/min price in €/m2 for a house localized in the central/peripheral area of each
municipality;
ES= characteristics of the environment and of the accessibility level, and of the productive
structure of each municipality;
VS= landscape variety;
IS= characteristics of the buildings localized in each municipality;
D= characteristics of the population living in each municipality;
BCH= Built Cultural Heritage, that is number of historical villas, traditional buildings,
palaces, historical districts, squares, fortresses, religious buildings and archeological sites
localized in each municipality.
We estimated four classes of models because we used four different price values for each
municipality: the maximum price for a house localized in the central/urbanized area of the
municipality; the minimum price for a house localized in the central/urbanized area of the
municipality; the maximum price for a house localized in the peripheral area of the
municipality; the minimum price for a house localized in the peripheral area of the
municipality. In the following section we will report in detail only about the first class of
models as the strongest influence of the built cultural heritage are produced over this class of
values7.
All the models had been estimated via the OLS stepwise technique introducing the
independent variables accordingly to the blocks previously described (1). The variables not
statistically significant accordingly to each estimation step had not been prevented from been
introduced in the successive one. The specification and the sequence of the variable blocks are
based on the literature review, on the data availability constrains, and on the goal of the study,
that is the estimation of the value perceived for the built cultural heritage in Veneto. Indeed,
the first three blocks represent the characteristics of the supply side of the market (except for
the presence of historical buildings), while the forth block depict the characteristics of the
demand side of the market, finally the fifth block details the characteristics of the built
cultural heritage. In order to verify if the influence produced by the built cultural heritage is
strengthen by the presence of tourism or service activities some interaction effects based on
these three variables had been introduced in the last two models. The estimates of all the
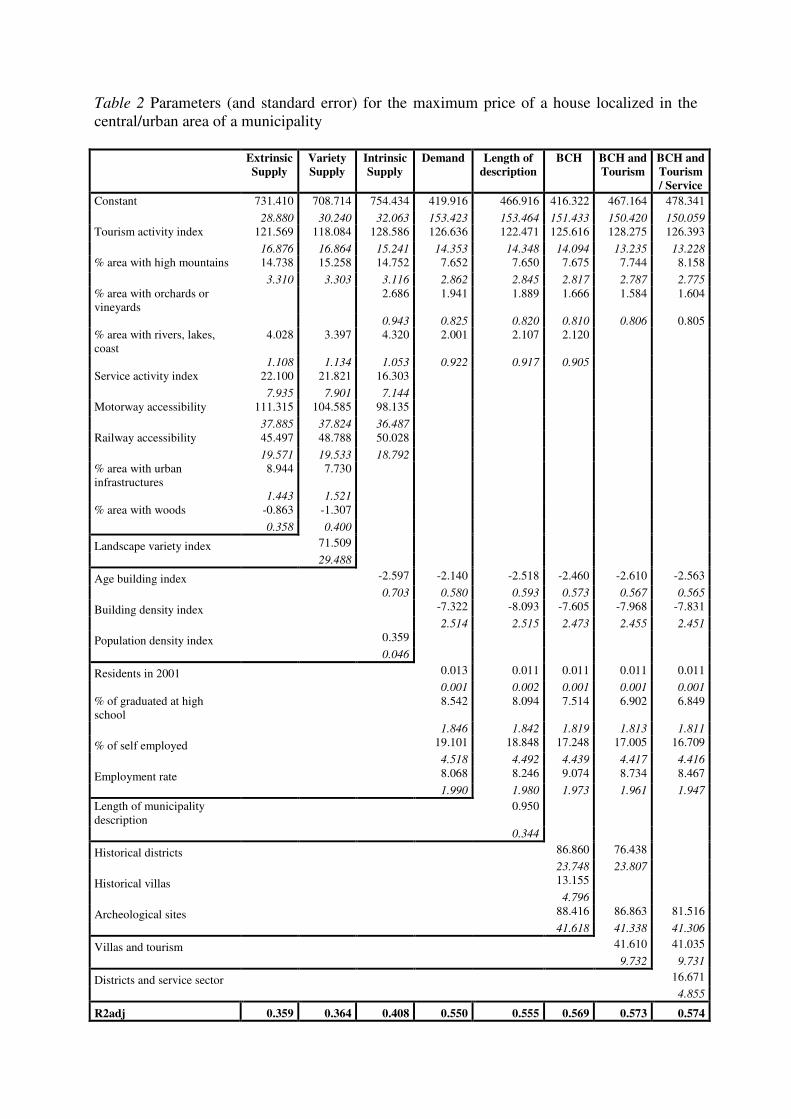
models are reported in table 28.
7 Refer to the appendix for the results of the other econometric models.
8 historical villas and religious buildings had not been included in the BCH Tourism model because of
collinearity problems, for the same reason historical villas, religious buildings and villas*service activities had
not been included in the BCH Tourism/Service sector model.
Table 2 Parameters (and standard error) for the maximum price of a house localized in the