54
XXVIII Ph.D in Physics Ezio Torassa Padova, May 13th 2013 Lesson #4 Higgs boson searches at LHC Standard Model
| Date post: | 22-Dec-2015 |
| Category: |
Documents |
| Upload: | shannon-jordan |
| View: | 219 times |
| Download: | 0 times |
XXVIII Ph.D in PhysicsEzio TorassaPadova, May 13th 2013
Lesson #4
Higgs boson searches at LHC
Standard Model
XXVIII Ph.D in PhysicsEzio TorassaPadova, May 13th 2013
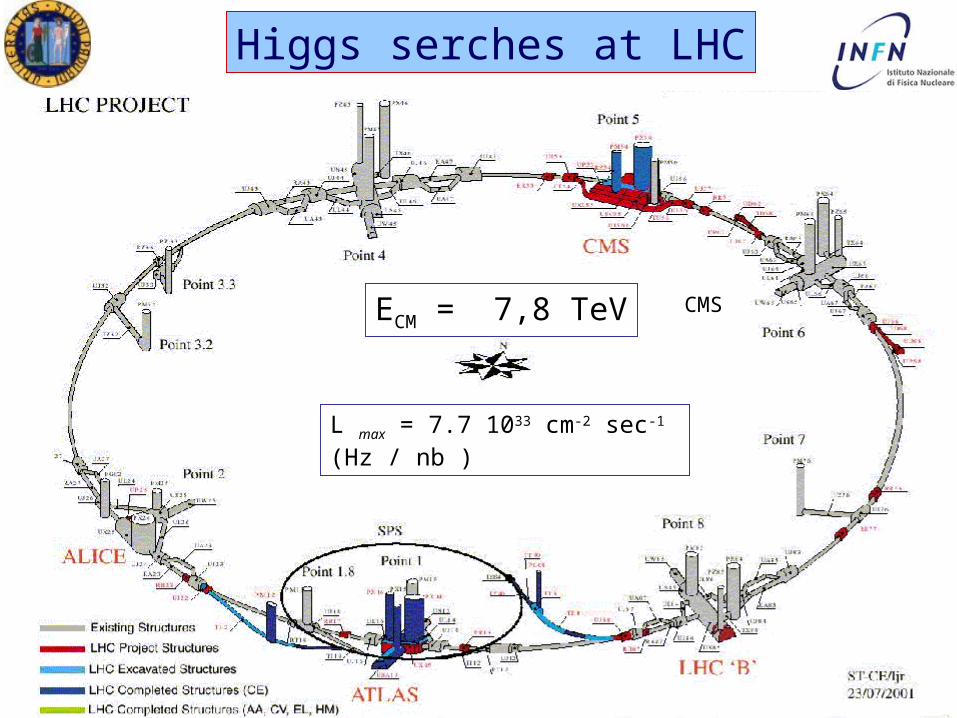
Higgs serches at LHC
ECM = 7,8 TeV
L max = 7.7 1033 cm-2 sec-1 (Hz / nb )
CMS
XXVIII Ph.D in PhysicsEzio TorassaPadova, May 13th 2013
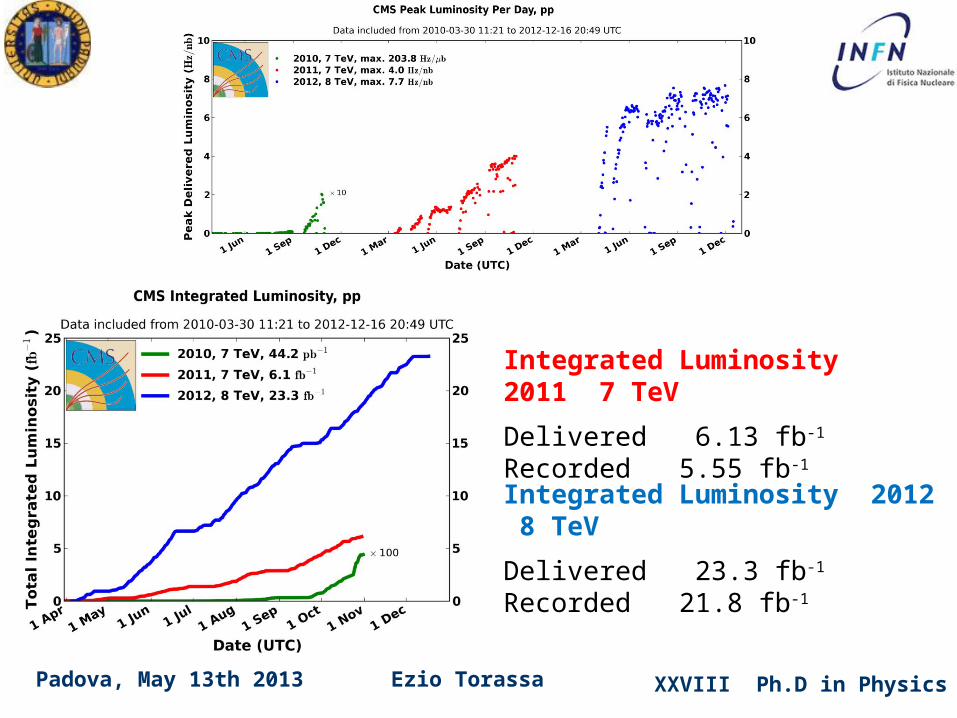
Integrated Luminosity 2012 8 TeV
Delivered 23.3 fb-1 Recorded 21.8 fb-1
Integrated Luminosity 2011 7 TeV
Delivered 6.13 fb-1 Recorded 5.55 fb-1
XXVIII Ph.D in PhysicsEzio TorassaPadova, May 13th 2013
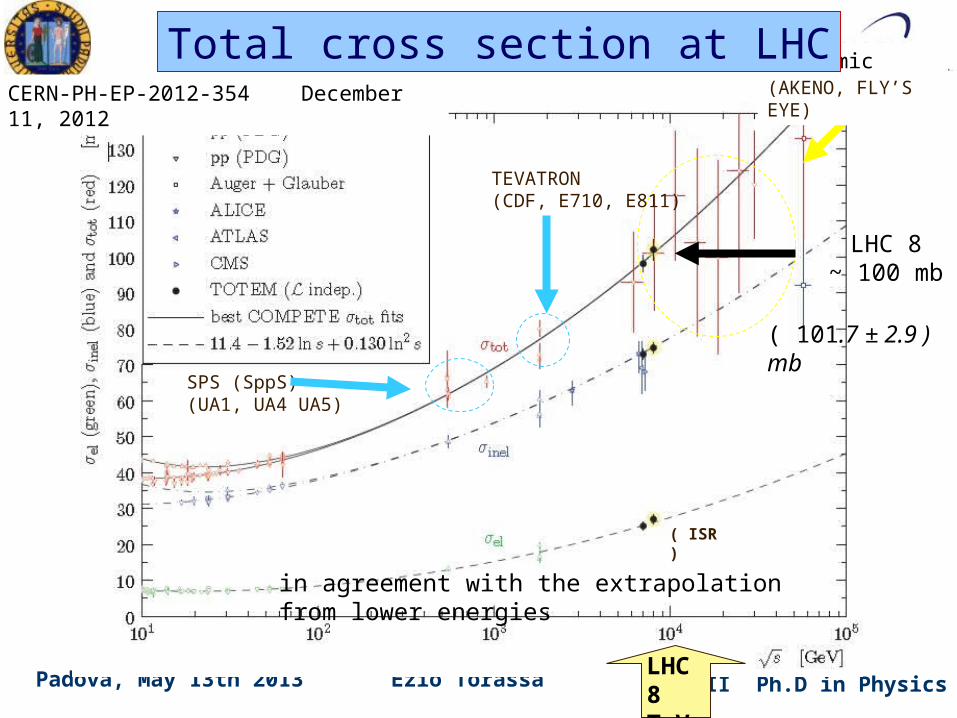
Cosmic Rays
LHC 8~ 100 mb
(AKENO, FLY’S EYE)
SPS (SppS) (UA1, UA4 UA5)
TEVATRON (CDF, E710, E811)
( ISR )
LHC8 TeV
Total cross section at LHCCERN-PH-EP-2012-354 December 11, 2012
( 101.7 ± 2.9 ) mb
in agreement with the extrapolation from lower energies
XXVIII Ph.D in PhysicsEzio TorassaPadova, May 13th 2013Padova 29 Giugno 2009 Ezio Torassa
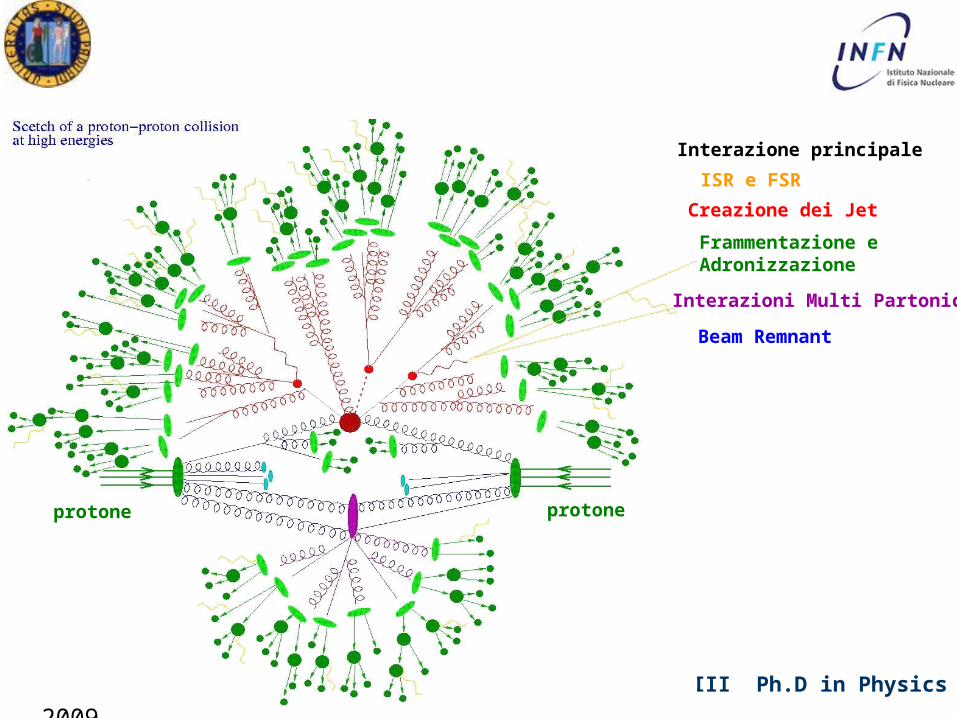
protone protone
Interazione principale
ISR e FSR
Creazione dei Jet
Frammentazione e Adronizzazione
Interazioni Multi Partoniche
Beam Remnant
XXVIII Ph.D in PhysicsEzio TorassaPadova, May 13th 2013
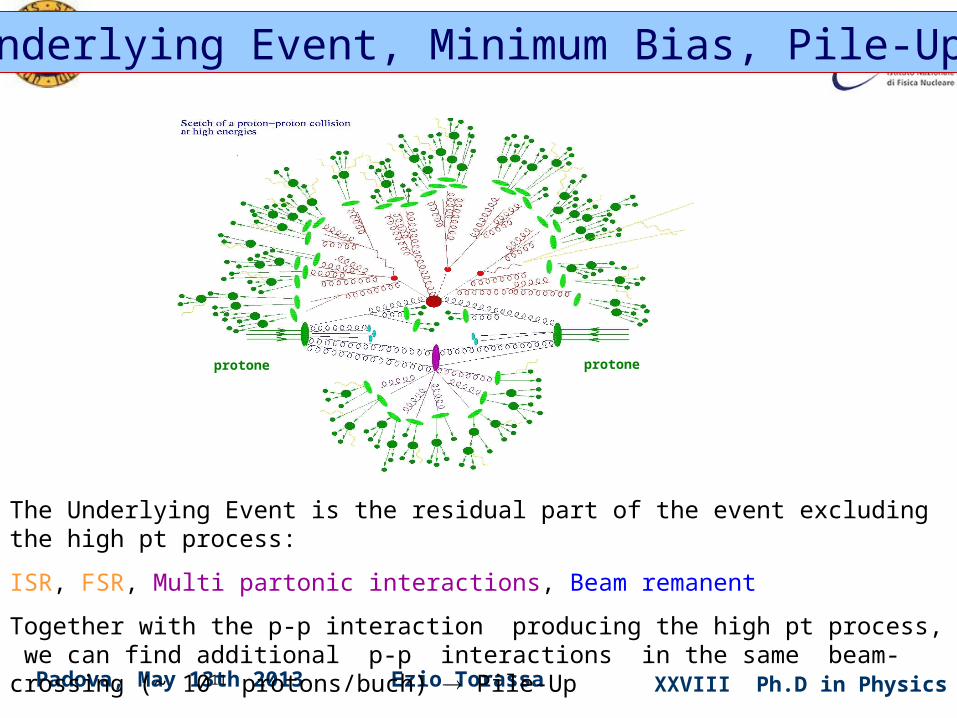
Underlying Event, Minimum Bias, Pile-Up
The Underlying Event is the residual part of the event excluding the high pt process:
ISR, FSR, Multi partonic interactions, Beam remanent
Together with the p-p interaction producing the high pt process, we can find additional p-p interactions in the same beam-crossing (~ 1011 protons/buch) Pile-Up
protone protone
XXVIII Ph.D in PhysicsEzio TorassaPadova, May 13th 2013
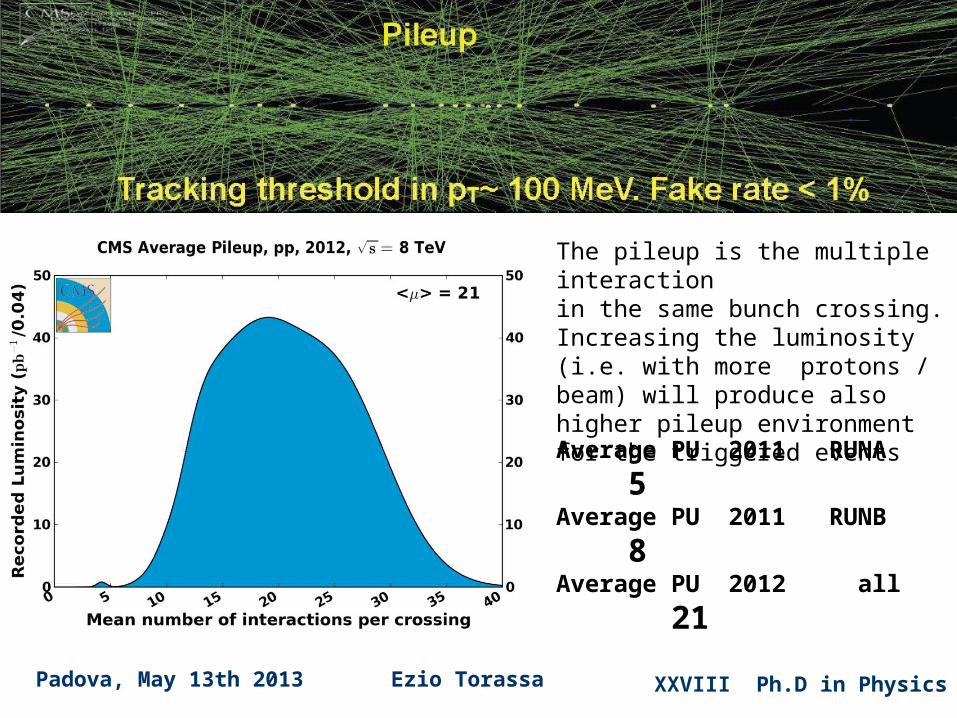
The pileup is the multiple interactionin the same bunch crossing.Increasing the luminosity (i.e. with more protons / beam) will produce also higher pileup environment for the triggered events
Average PU 2011 RUNA 5Average PU 2011 RUNB 8Average PU 2012 all 21
XXVIII Ph.D in PhysicsEzio TorassaPadova, May 13th 2013
XXVIII Ph.D in PhysicsEzio TorassaPadova, May 13th 2013
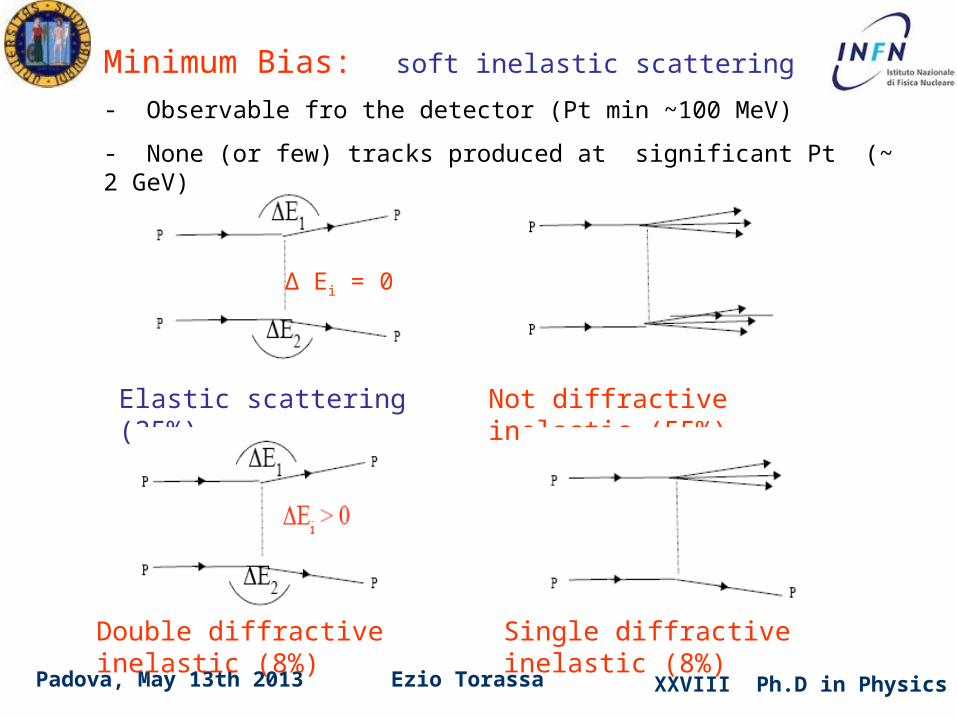
Δ Ei = 0
Elastic scattering (25%)
Double diffractive inelastic (8%)
Not diffractive inelastic (55%)
Single diffractive inelastic (8%)
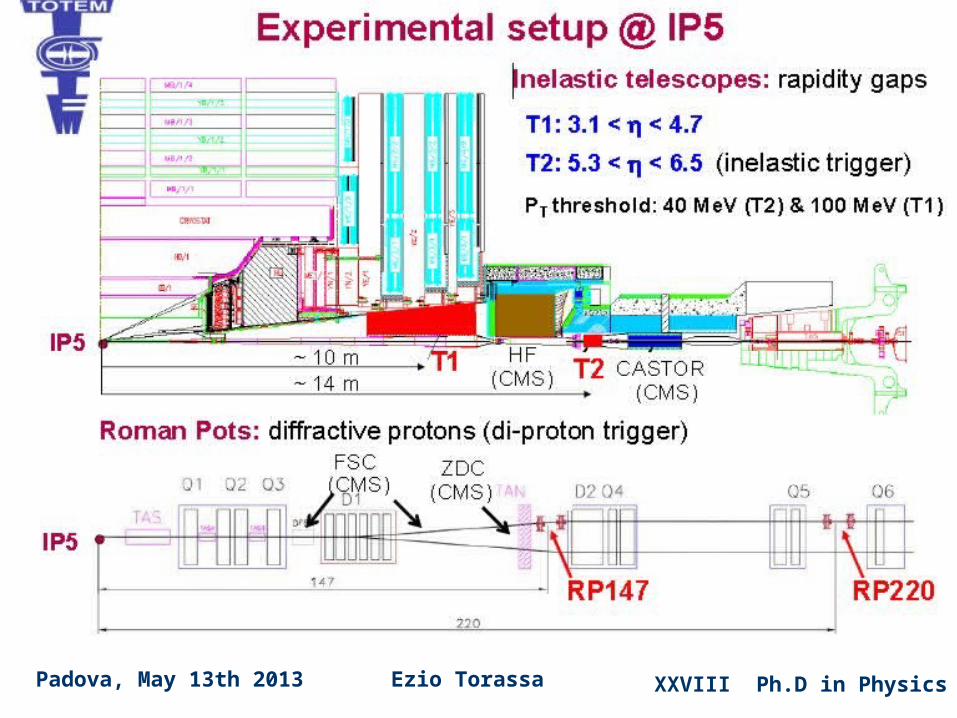
Minimum Bias: soft inelastic scattering
- Observable fro the detector (Pt min ~100 MeV)
- None (or few) tracks produced at significant Pt (~ 2 GeV)
XXVIII Ph.D in PhysicsEzio TorassaPadova, May 13th 2013
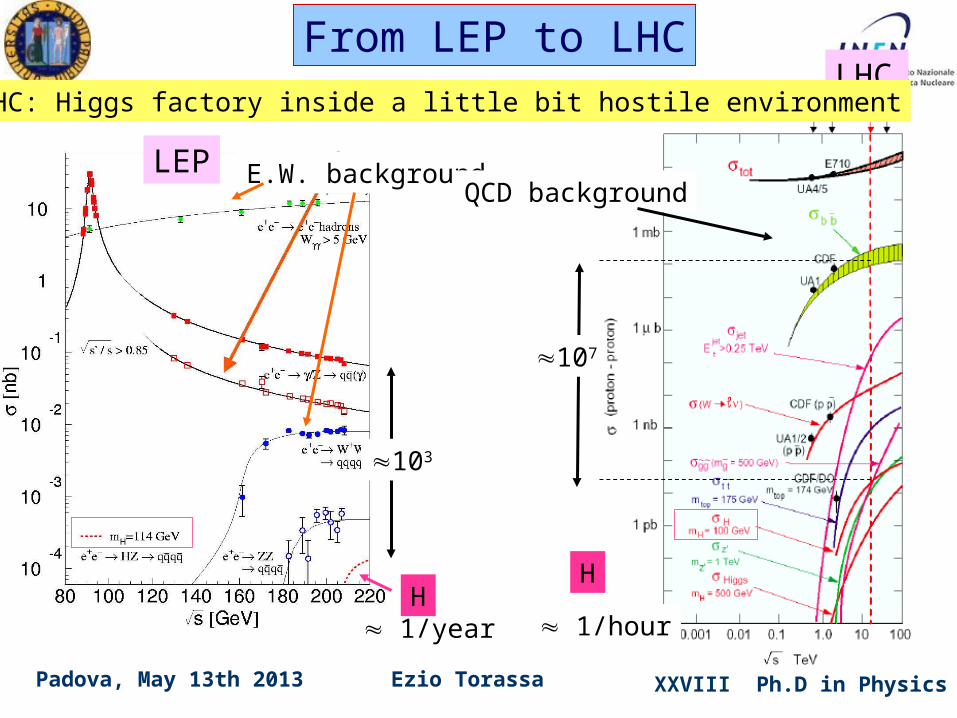
E.W. backgroundLEP
103
107
QCD background
HH
1/year
LHCLHC: Higgs factory inside a little bit hostile environment
1/hour
From LEP to LHC
XXVIII Ph.D in PhysicsEzio TorassaPadova, May 13th 201311
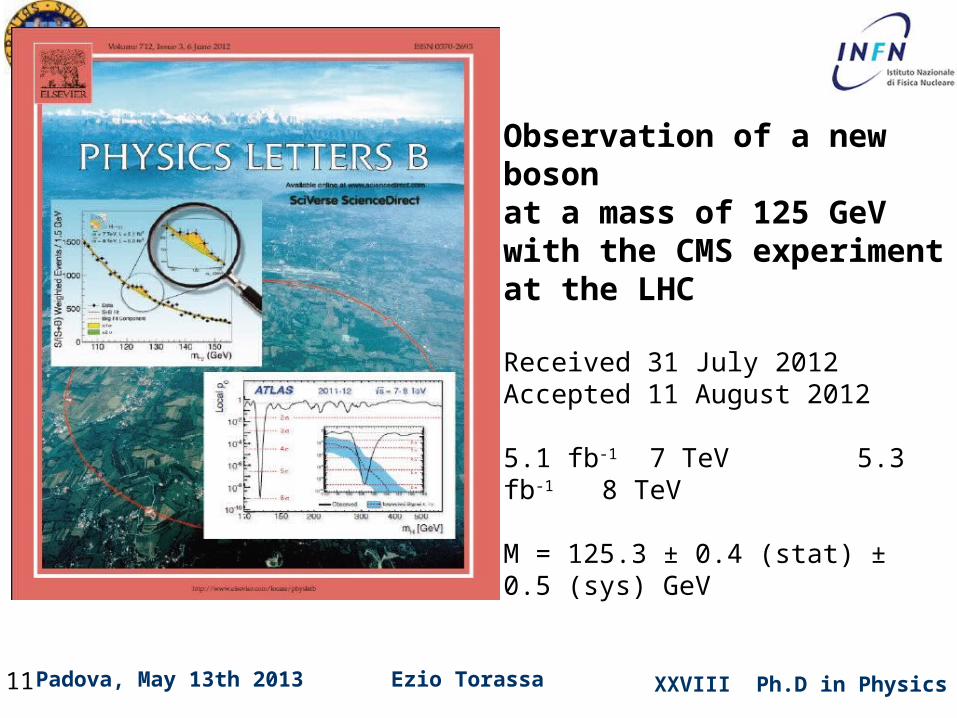
Observation of a new boson at a mass of 125 GeV with the CMS experiment at the LHC
Received 31 July 2012Accepted 11 August 2012
5.1 fb-1 7 TeV 5.3 fb-1 8 TeV
M = 125.3 ± 0.4 (stat) ± 0.5 (sys) GeV
XXVIII Ph.D in PhysicsEzio TorassaPadova, May 13th 2013
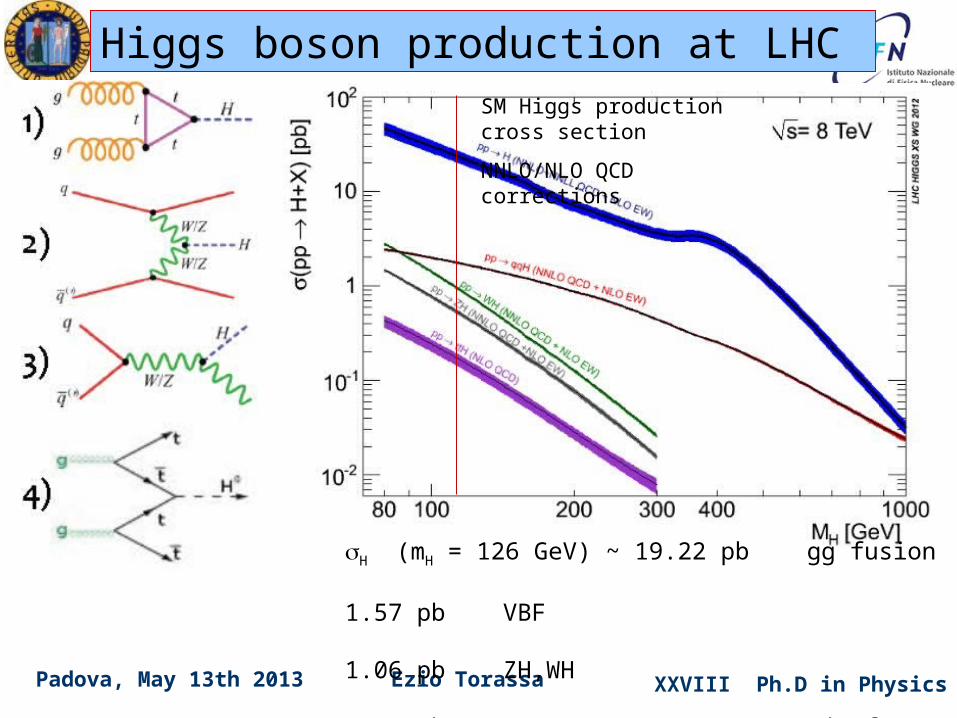
H (mH = 126 GeV) ~ 19.22 pb gg fusion 1.57 pb VBF 1.06 pb ZH,WH 0.13 pb ttH (105 pb for W)
Higgs boson production at LHC SM Higgs production cross section
NNLO/NLO QCD corrections
XXVIII Ph.D in PhysicsEzio TorassaPadova, May 13th 2013
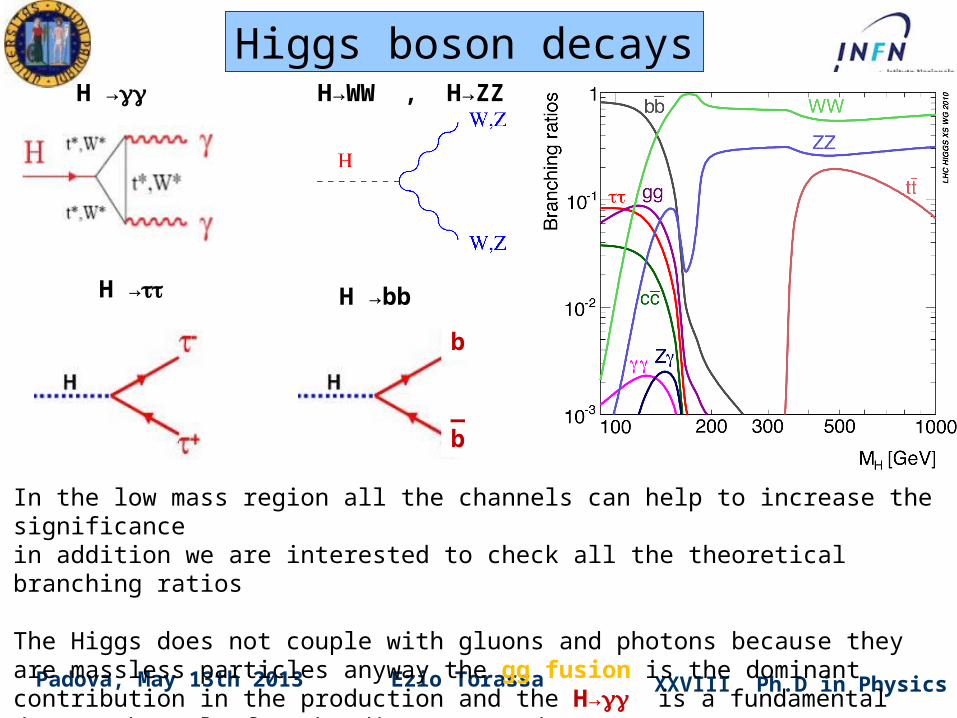
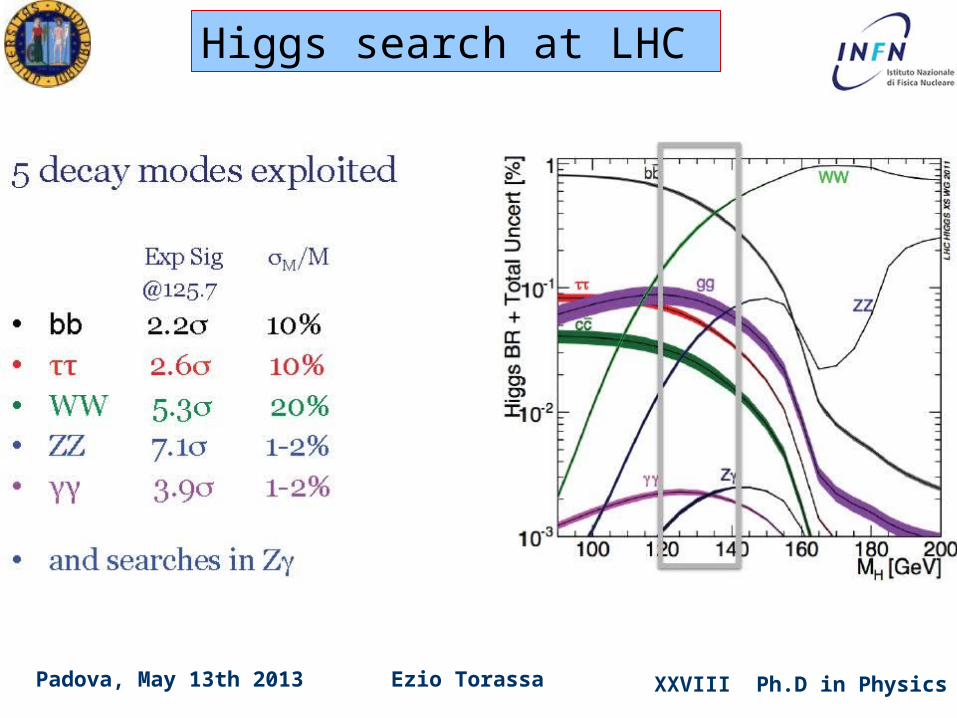
H → H→WW , H→ZZ
In the low mass region all the channels can help to increase the significancein addition we are interested to check all the theoretical branching ratios
The Higgs does not couple with gluons and photons because they are massless particles anyway the gg fusion is the dominant contribution in the production and the H→ is a fundamental decay channel for the discovery and mass measurement
H →
b
b_
H →bb
Higgs boson decays
XXVIII Ph.D in PhysicsEzio TorassaPadova, May 13th 2013
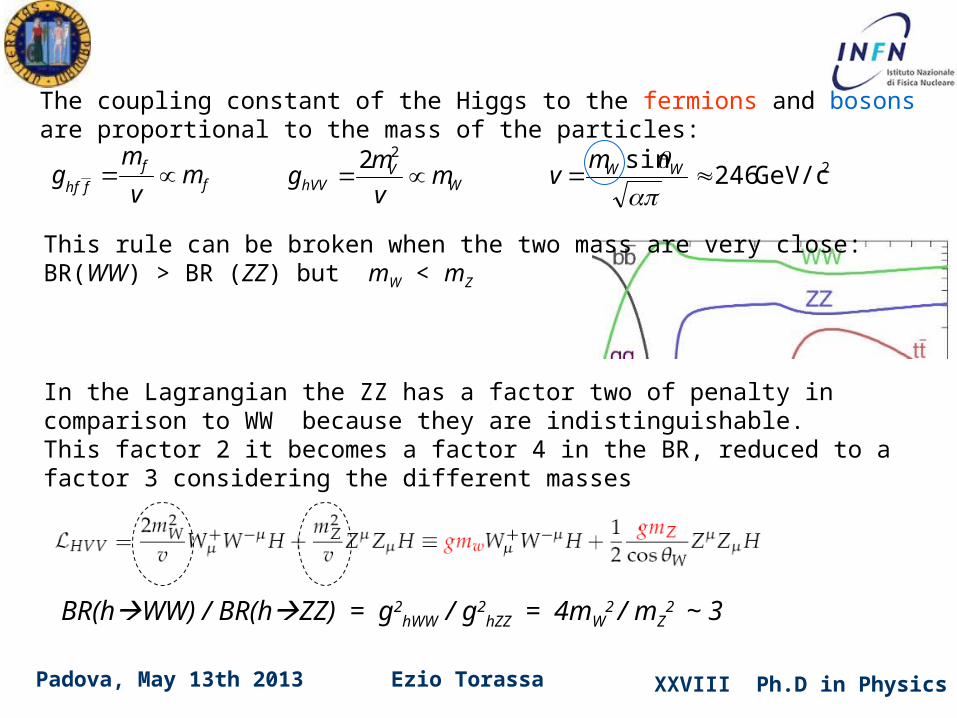
BR(hWW) / BR(hZZ) = g2hWW / g2
hZZ = 4mW2 / mZ
2 ~ 3
This rule can be broken when the two mass are very close:BR(WW) > BR (ZZ) but mW < mZ
In the Lagrangian the ZZ has a factor two of penalty in comparison to WW because they are indistinguishable. This factor 2 it becomes a factor 4 in the BR, reduced to a factor 3 considering the different masses
The coupling constant of the Higgs to the fermions and bosons are proportional to the mass of the particles:
ff
fhfm
v
mg W
VhVV m
v
mg
22 2GeV/c246sin
WWmv
XXVIII Ph.D in PhysicsEzio TorassaPadova, May 13th 2013
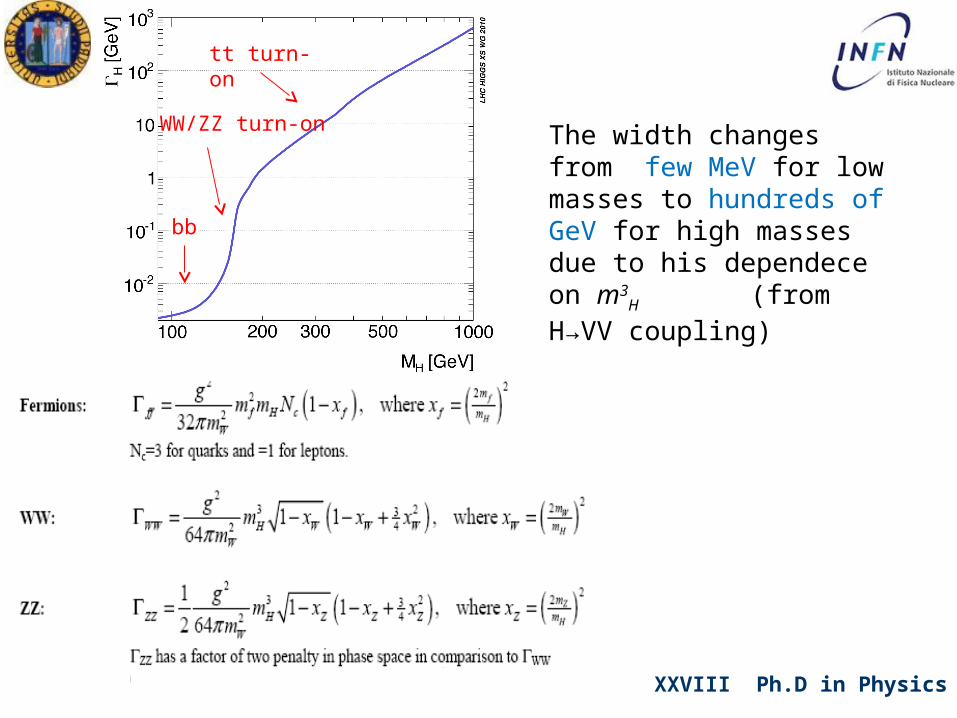
The width changes from few MeV for low masses to hundreds of GeV for high masses due to his dependece on m3
H (from H→VV coupling)
tt turn-on
WW/ZZ turn-on
bb
XXVIII Ph.D in PhysicsEzio TorassaPadova, May 13th 2013
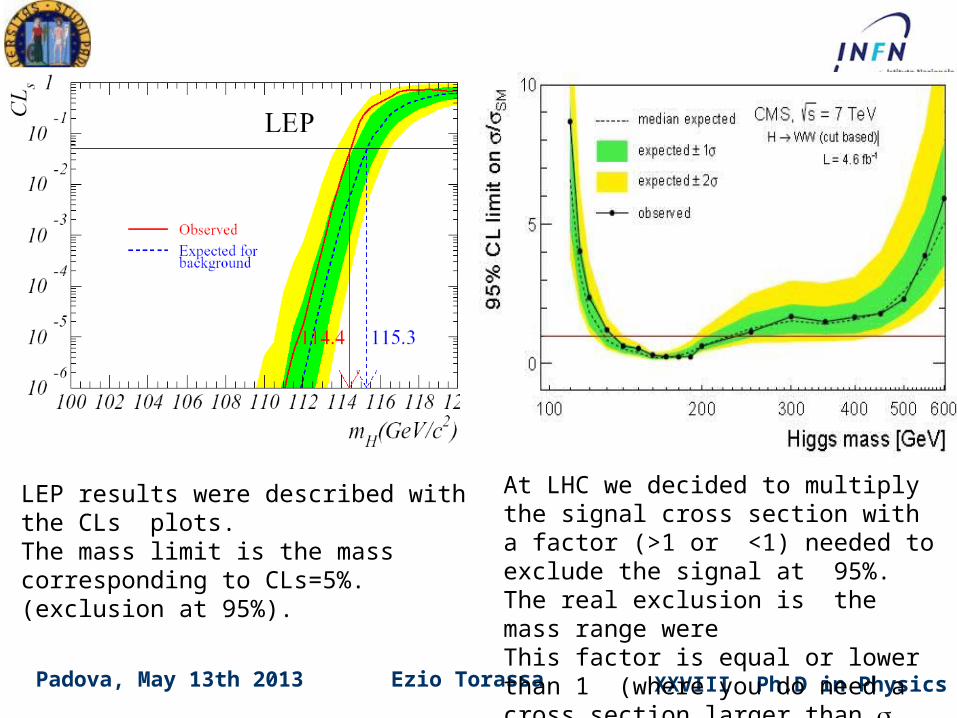
LEP results were described with the CLs plots. The mass limit is the mass corresponding to CLs=5%. (exclusion at 95%).
At LHC we decided to multiply the signal cross section with a factor (>1 or <1) needed to exclude the signal at 95%.The real exclusion is the mass range wereThis factor is equal or lower than 1 (where you do need a cross section larger than SM to obtain the exclusion.
XXVIII Ph.D in PhysicsEzio TorassaPadova, May 13th 2013
Higgs search at LHC
XXVIII Ph.D in PhysicsEzio TorassaPadova, May 13th 2013
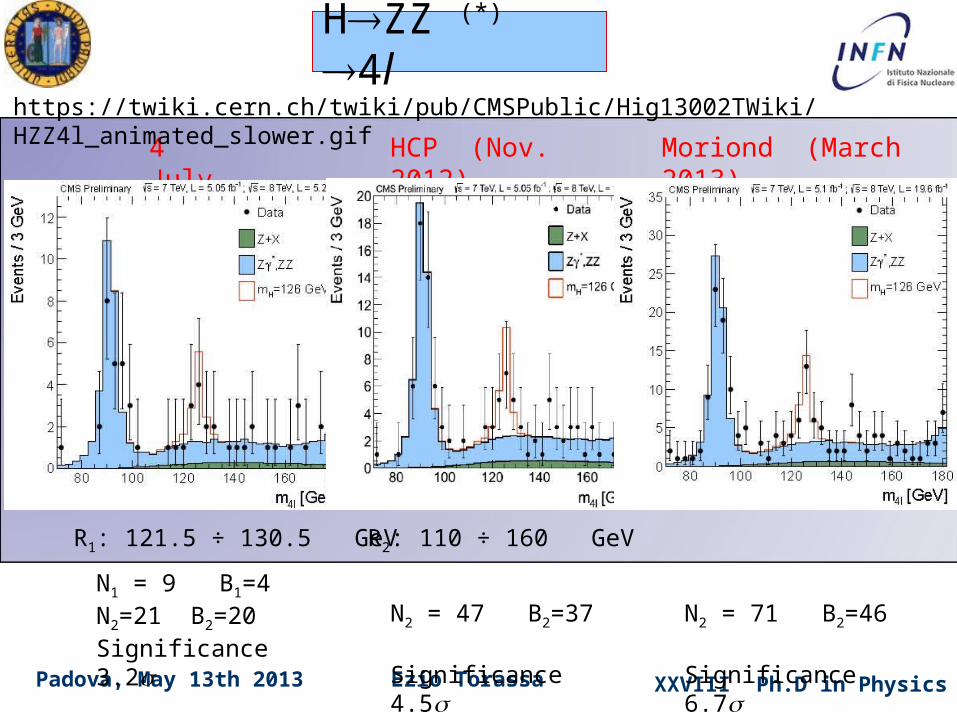
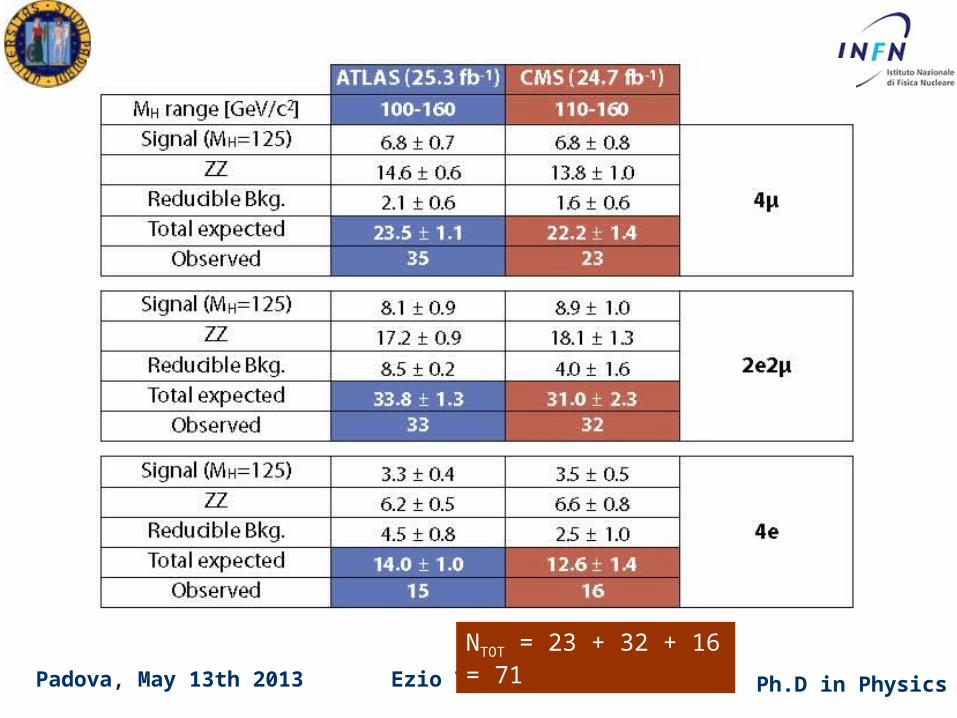
HZZ (*) 4l
4 July HCP (Nov. 2012) Moriond (March 2013)
N1 = 9 B1=4 N2=21 B2=20 Significance 3.2
N2 = 47 B2=37 Significance 4.5
R1: 121.5 ÷ 130.5 GeV R2: 110 ÷ 160 GeV
N2 = 71 B2=46 Significance 6.7
https://twiki.cern.ch/twiki/pub/CMSPublic/Hig13002TWiki/HZZ4l_animated_slower.gif
XXVIII Ph.D in PhysicsEzio TorassaPadova, May 13th 2013
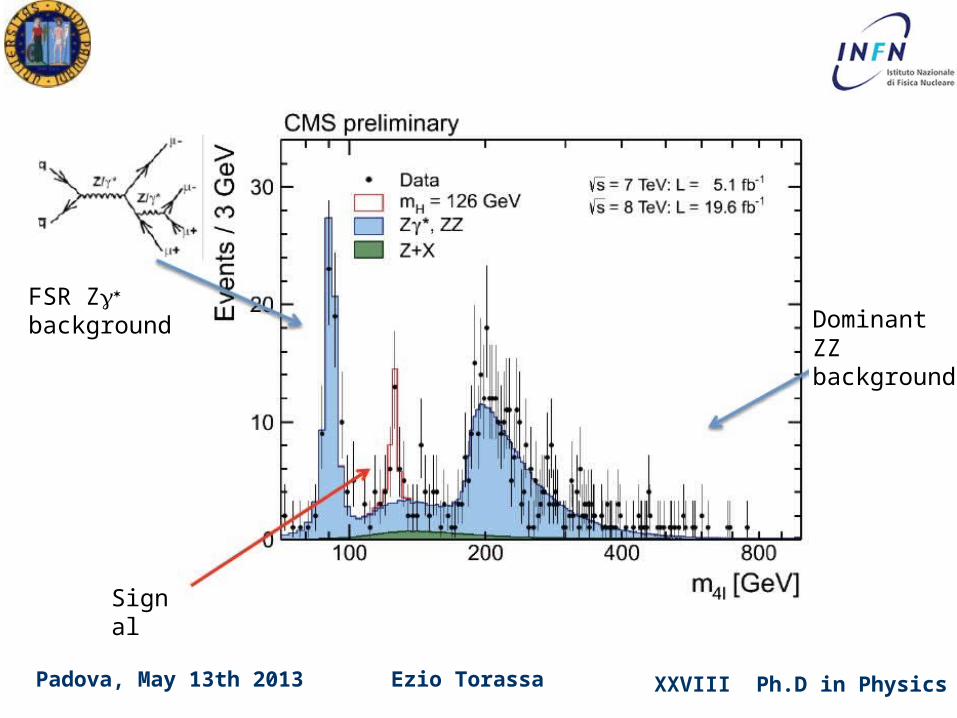
Dominant ZZ background
FSR Z background
Signal
XXVIII Ph.D in PhysicsEzio TorassaPadova, May 13th 2013
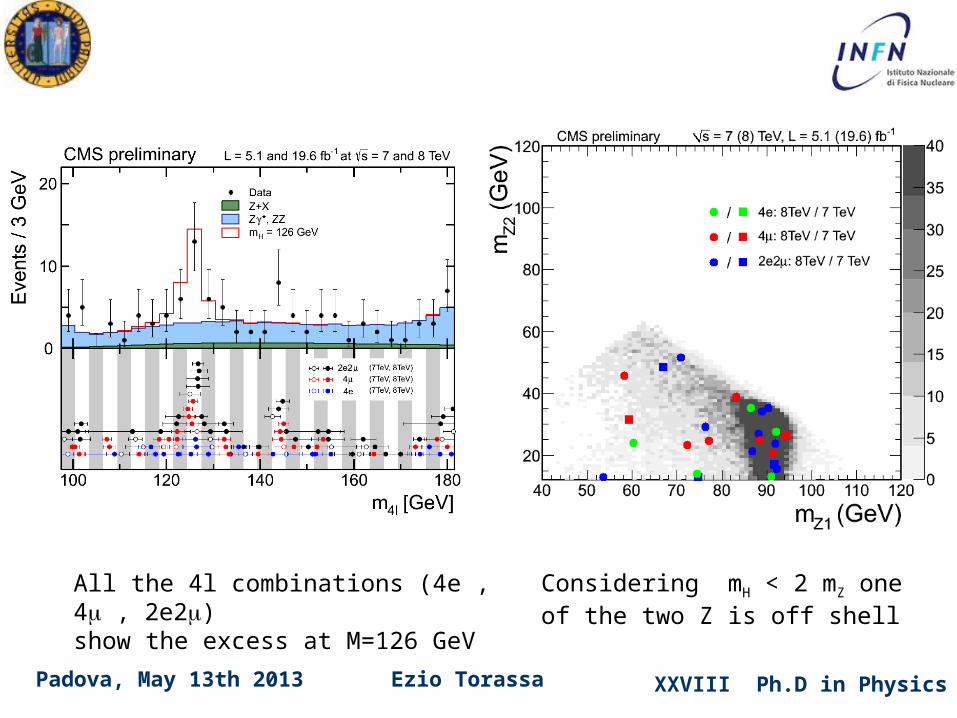
Considering mH < 2 mZ one of the two Z is off shell
All the 4l combinations (4e , 4 , 2e2)show the excess at M=126 GeV
XXVIII Ph.D in PhysicsEzio TorassaPadova, May 13th 2013
NTOT = 23 + 32 + 16 = 71
XXVIII Ph.D in PhysicsEzio TorassaPadova, May 13th 2013
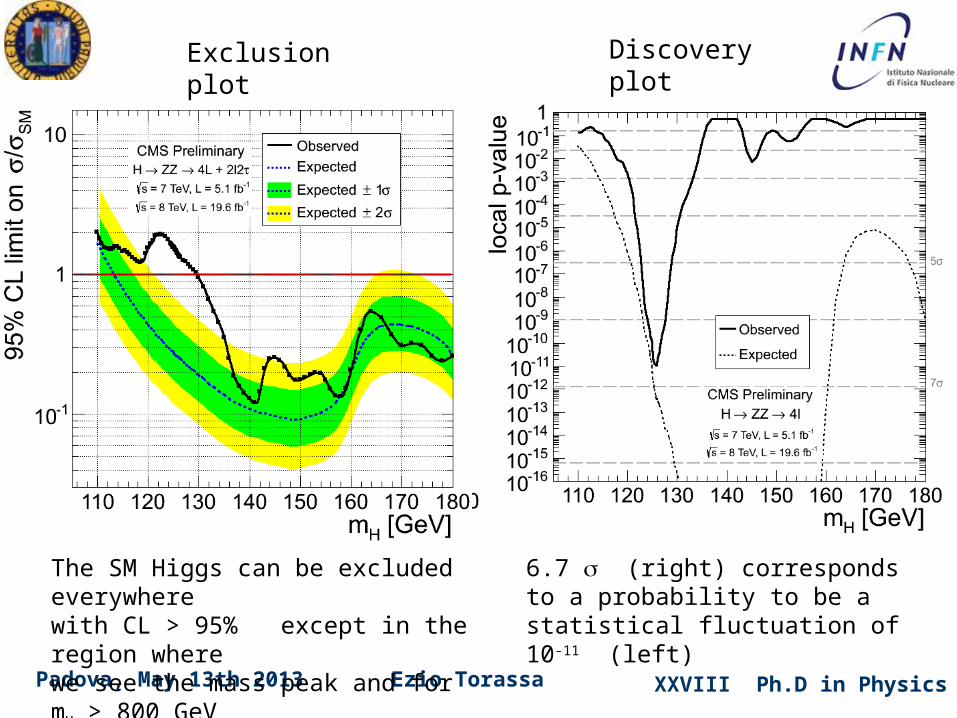
The SM Higgs can be excluded everywhere with CL > 95% except in the region where we see the mass peak and for mH > 800 GeV
Exclusion plot Discovery plot
6.7 (right) corresponds to a probability to be a statistical fluctuation of 10-11 (left)
XXVIII Ph.D in PhysicsEzio TorassaPadova, May 13th 2013
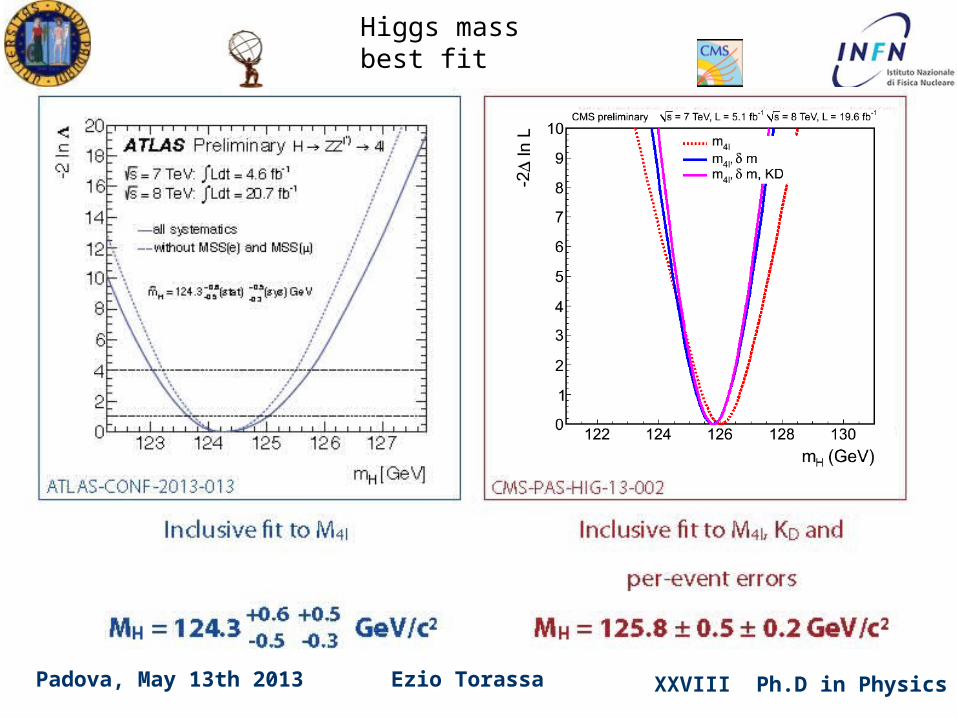
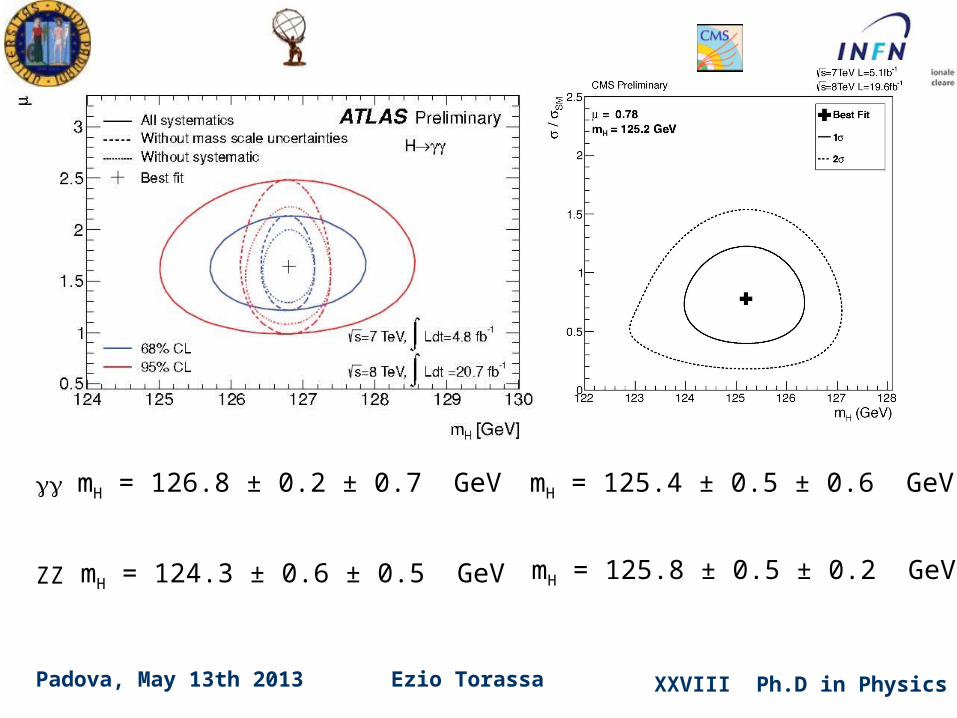
Higgs mass best fit
XXVIII Ph.D in PhysicsEzio TorassaPadova, May 13th 2013
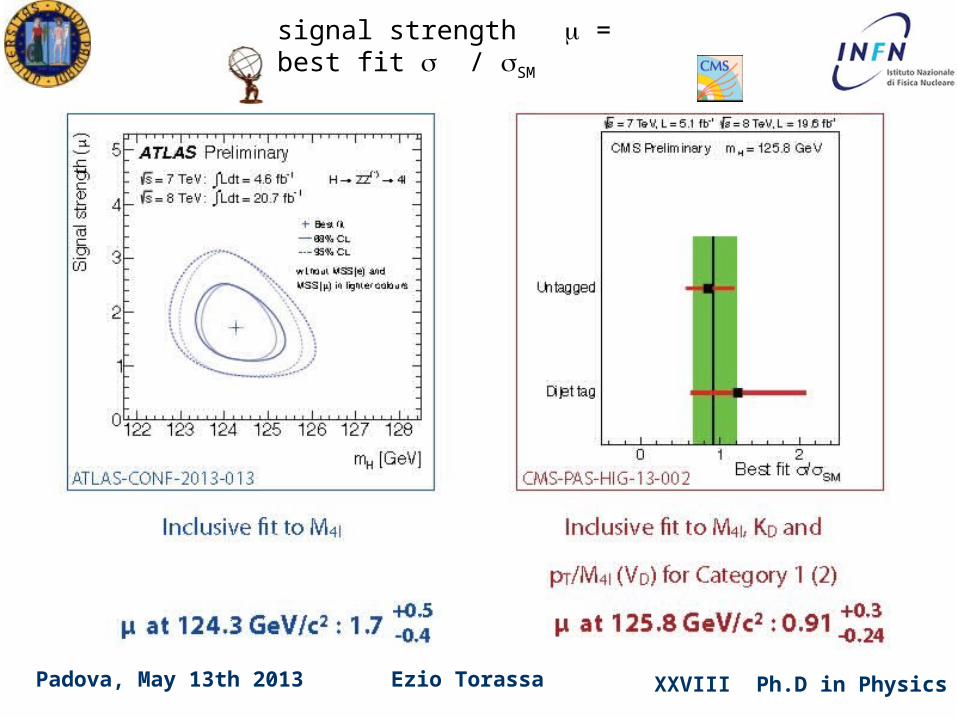
signal strength = best fit / SM
XXVIII Ph.D in PhysicsEzio TorassaPadova, May 13th 2013
H
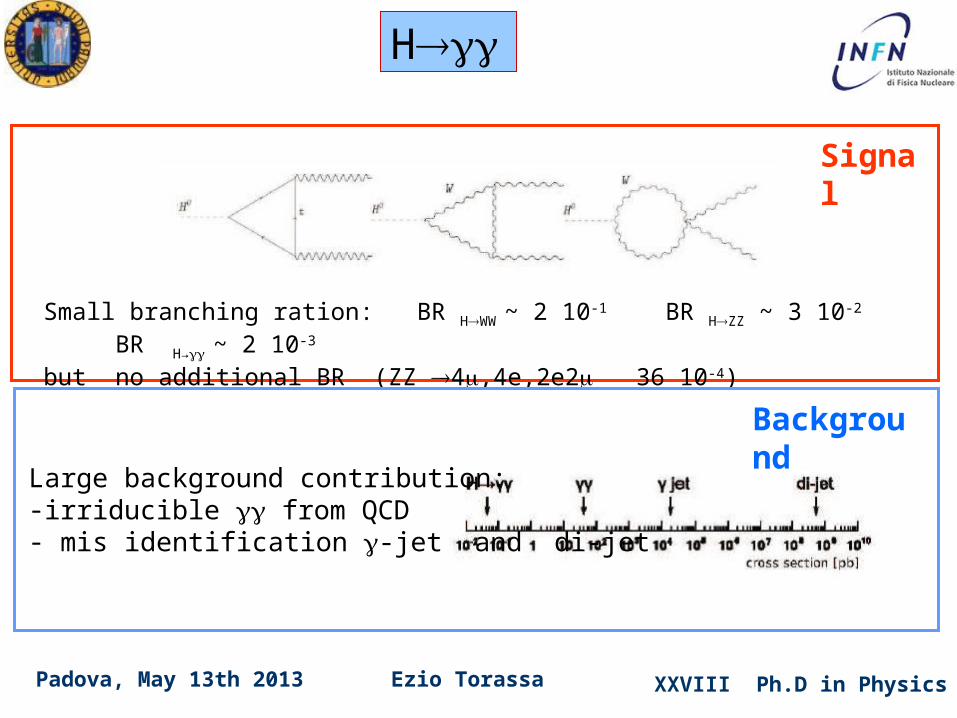
Large background contribution:-irriducible from QCD - mis identification -jet and di-jet
Small branching ration: BR HWW ~ 2 10-1 BR HZZ ~ 3 10-2 BR H→ ~ 2 10-3 but no additional BR (ZZ 4,4e,2e2 36 10-4)
Signal
Background
XXVIII Ph.D in PhysicsEzio TorassaPadova, May 13th 2013
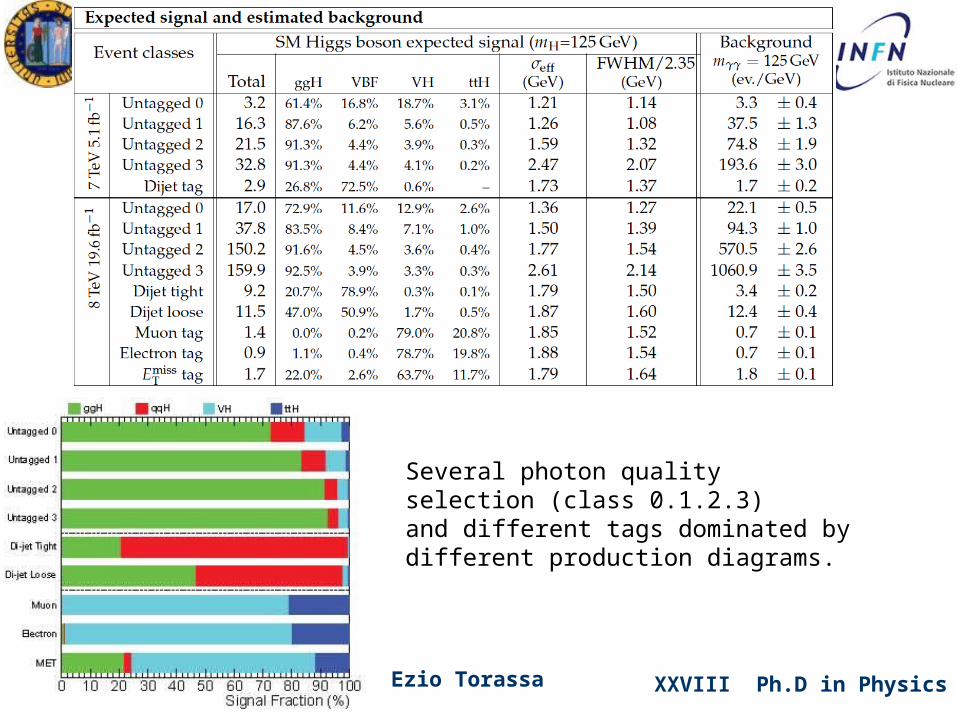
Several photon quality selection (class 0.1.2.3)and different tags dominated by different production diagrams.
XXVIII Ph.D in PhysicsEzio TorassaPadova, May 13th 2013
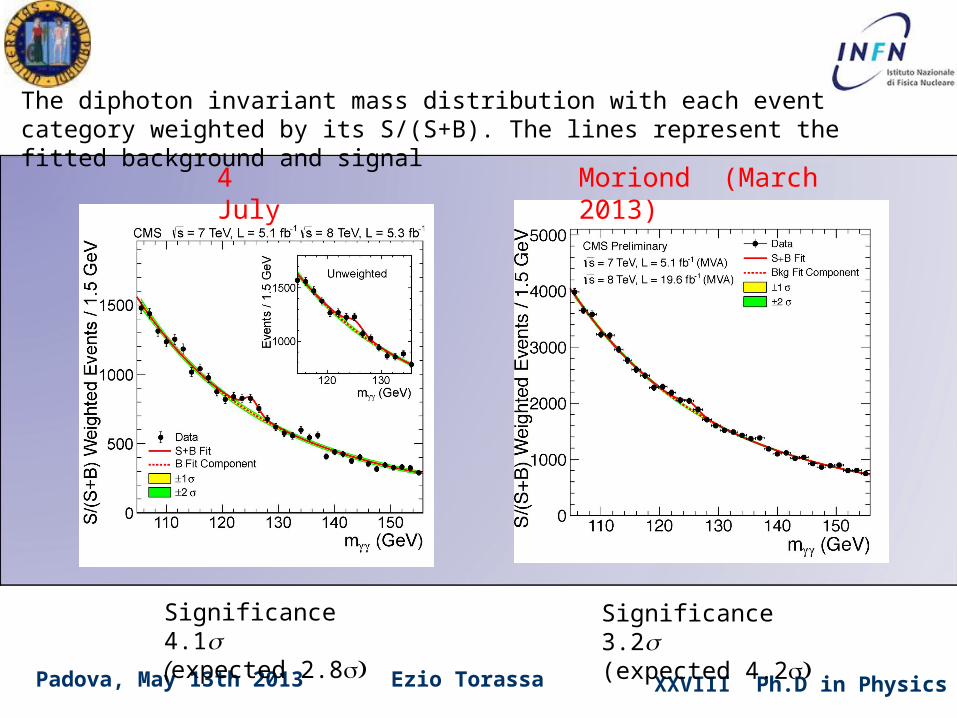
The diphoton invariant mass distribution with each event category weighted by its S/(S+B). The lines represent the fitted background and signal
4 July Moriond (March 2013)
Significance 4.1(expected 2.8
Significance 3.2(expected 4.2
XXVIII Ph.D in PhysicsEzio TorassaPadova, May 13th 2013
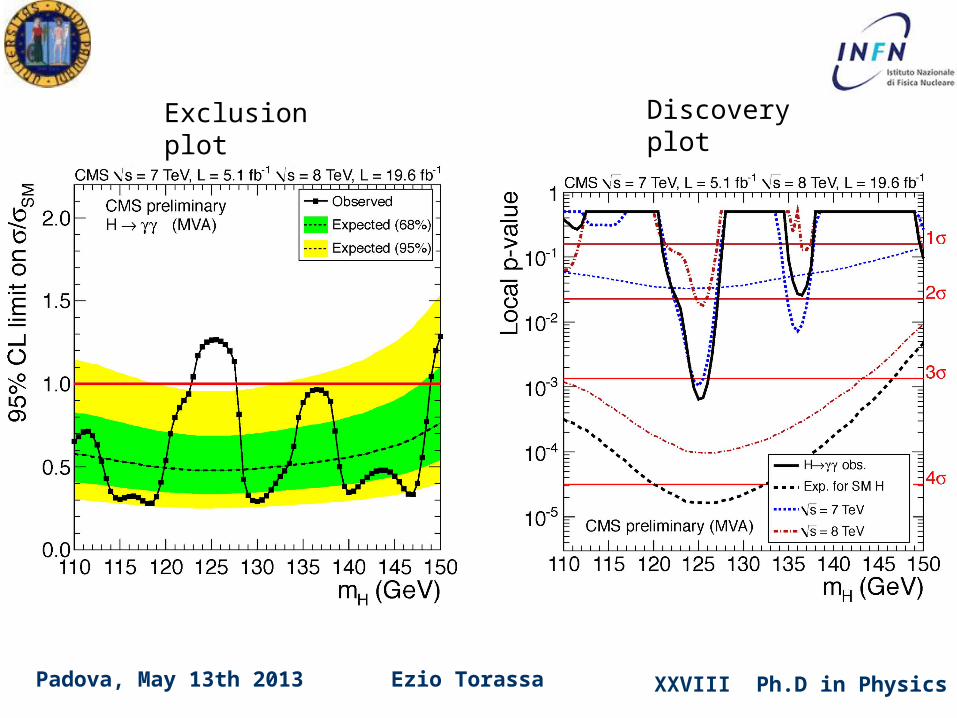
Exclusion plot Discovery plot
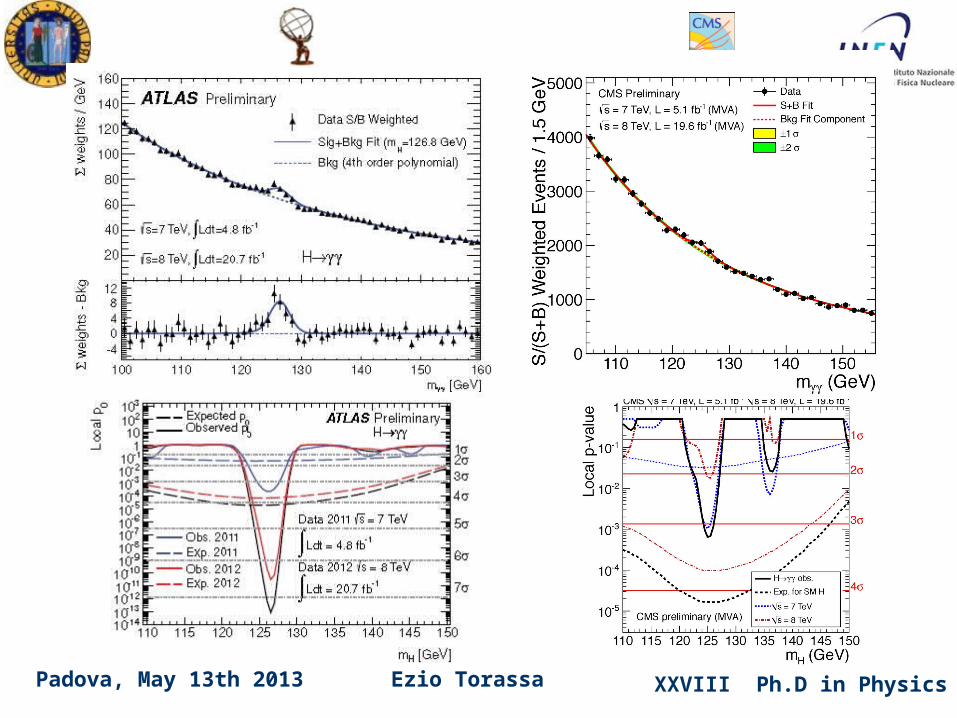
XXVIII Ph.D in PhysicsEzio TorassaPadova, May 13th 2013
XXVIII Ph.D in PhysicsEzio TorassaPadova, May 13th 2013
mH = 124.3 ± 0.6 ± 0.5 GeV mH = 125.8 ± 0.5 ± 0.2 GeVZZ
mH = 126.8 ± 0.2 ± 0.7 GeV mH = 125.4 ± 0.5 ± 0.6 GeV
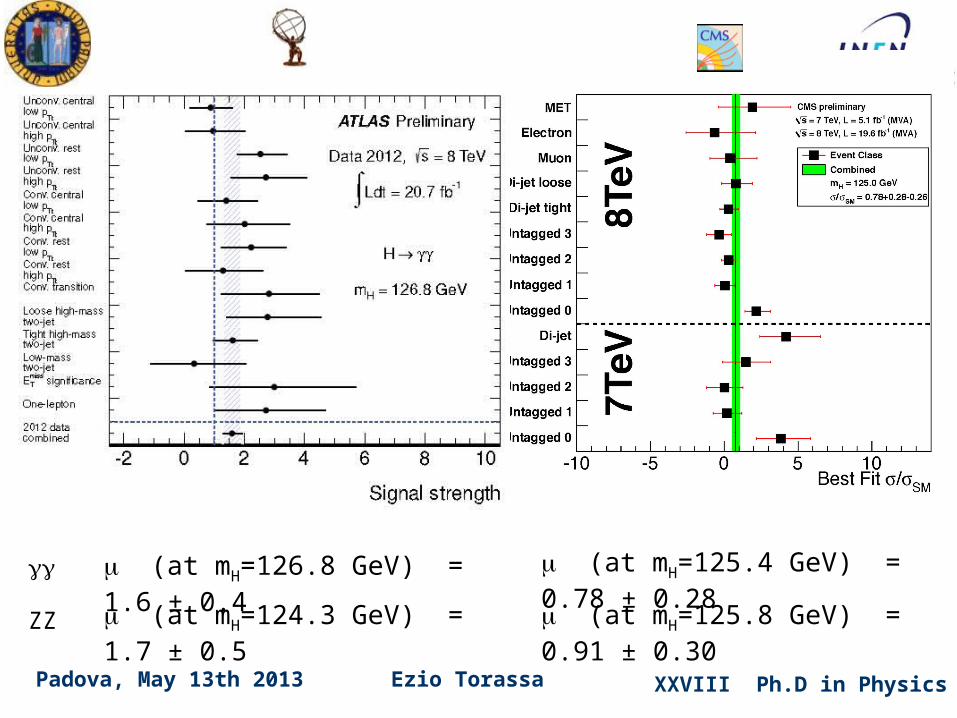
XXVIII Ph.D in PhysicsEzio TorassaPadova, May 13th 2013
(at mH=125.4 GeV) = 0.78 ± 0.28 (at mH=126.8 GeV) = 1.6 ± 0.4
ZZ (at mH=125.8 GeV) = 0.91 ± 0.30 (at mH=124.3 GeV) = 1.7 ± 0.5
XXVIII Ph.D in PhysicsEzio TorassaPadova, May 13th 2013
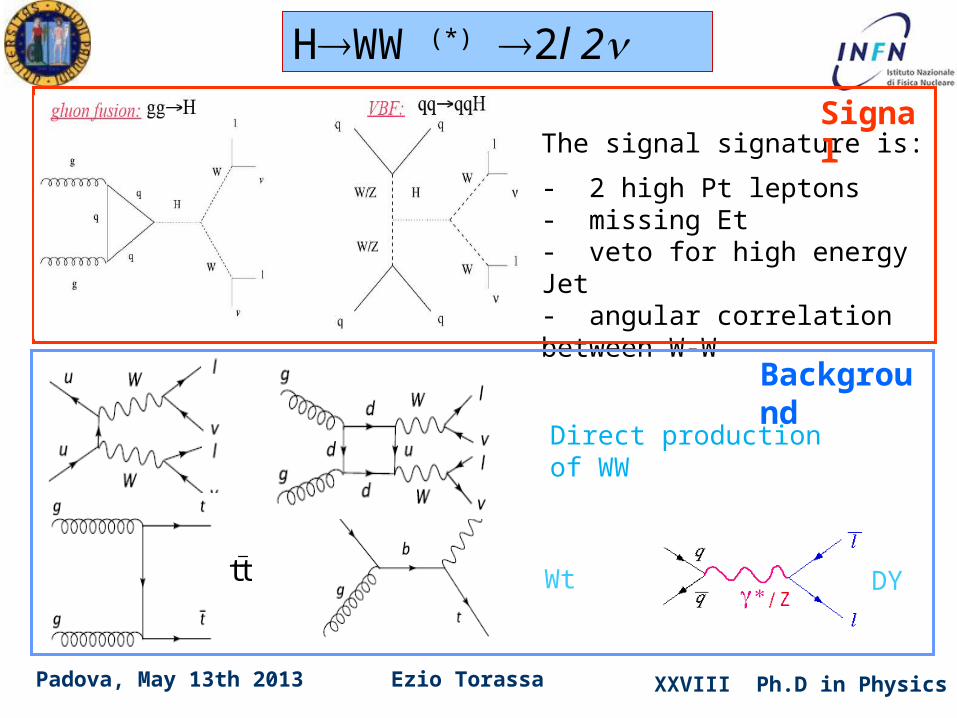
Direct production of WW
Wt
The signal signature is:
- 2 high Pt leptons - missing Et- veto for high energy Jet - angular correlation between W-W
DYtt
HWW (*) 2l 2Signal
Background
XXVIII Ph.D in PhysicsEzio TorassaPadova, May 13th 2013
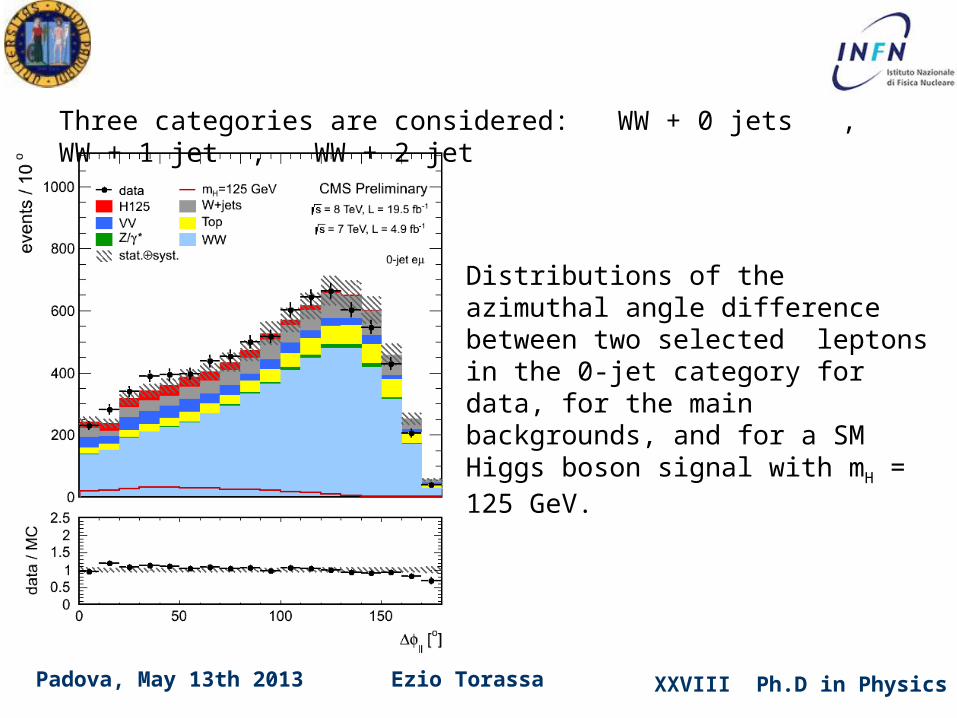
Three categories are considered: WW + 0 jets , WW + 1 jet , WW + 2 jet
Distributions of the azimuthal angle difference between two selected leptons in the 0-jet category for data, for the main backgrounds, and for a SM Higgs boson signal with mH = 125 GeV.
XXVIII Ph.D in PhysicsEzio TorassaPadova, May 13th 2013
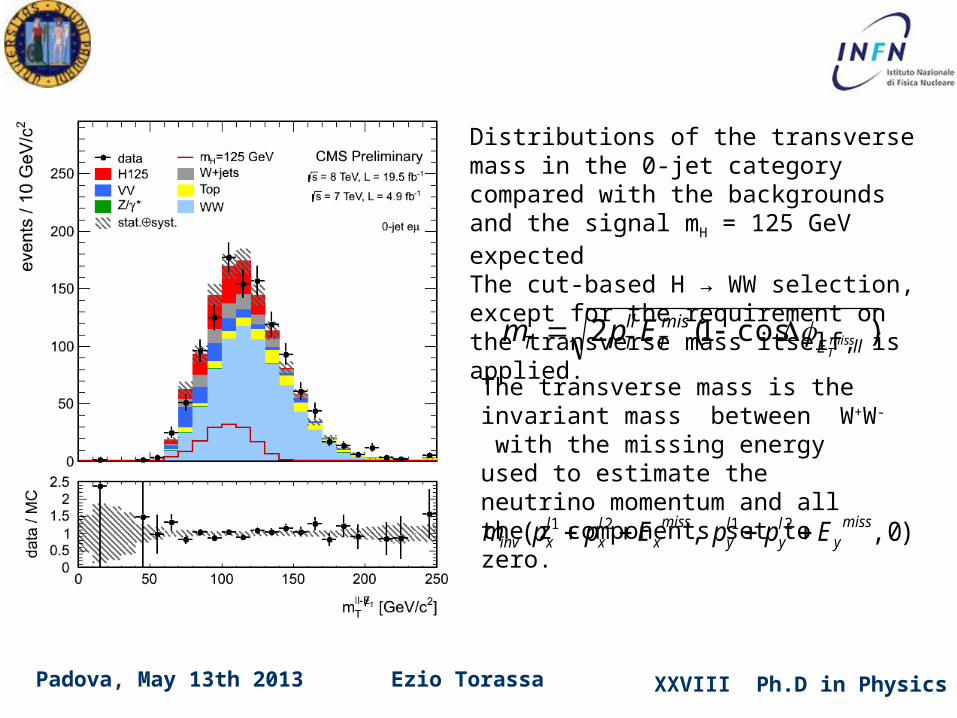
Distributions of the transverse mass in the 0-jet category compared with the backgrounds and the signal mH = 125 GeV expectedThe cut-based H → WW selection, except for the requirement on the transverse mass itself, is applied.
)cos1(2llE
misT
llTT miss
TEpm
The transverse mass is the invariant mass between W+W- with the missing energy used to estimate the neutrino momentum and all the z components set to zero.
)0,,( 2121 missy
ly
ly
missx
lx
lxinv EppEppm
XXVIII Ph.D in PhysicsEzio TorassaPadova, May 13th 2013
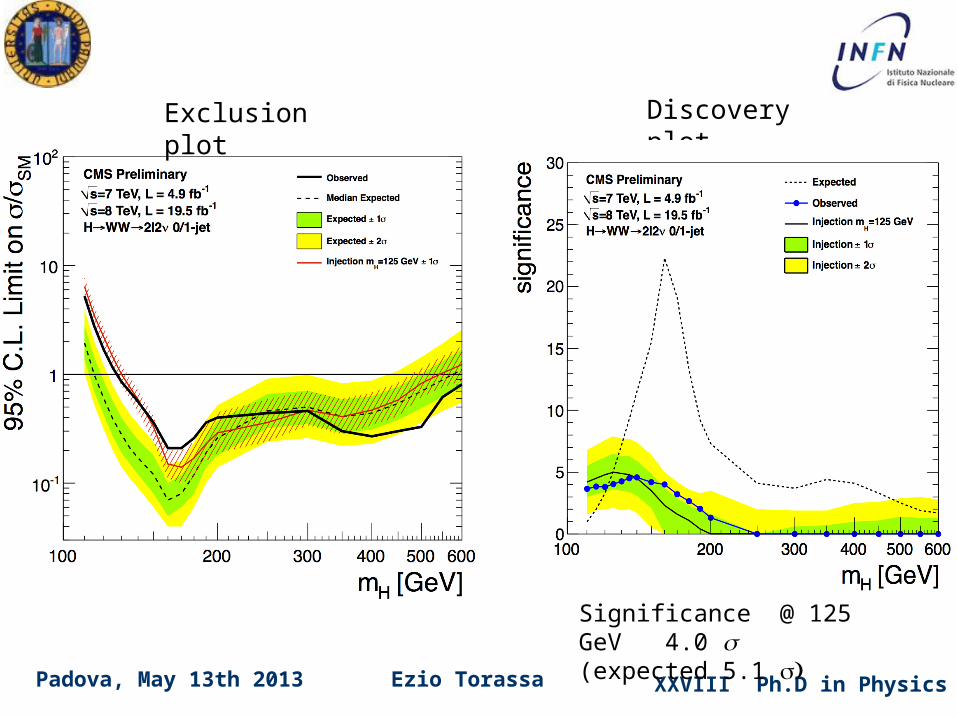
Exclusion plot Discovery plot
Significance @ 125 GeV 4.0 (expected 5.1
XXVIII Ph.D in PhysicsEzio TorassaPadova, May 13th 2013
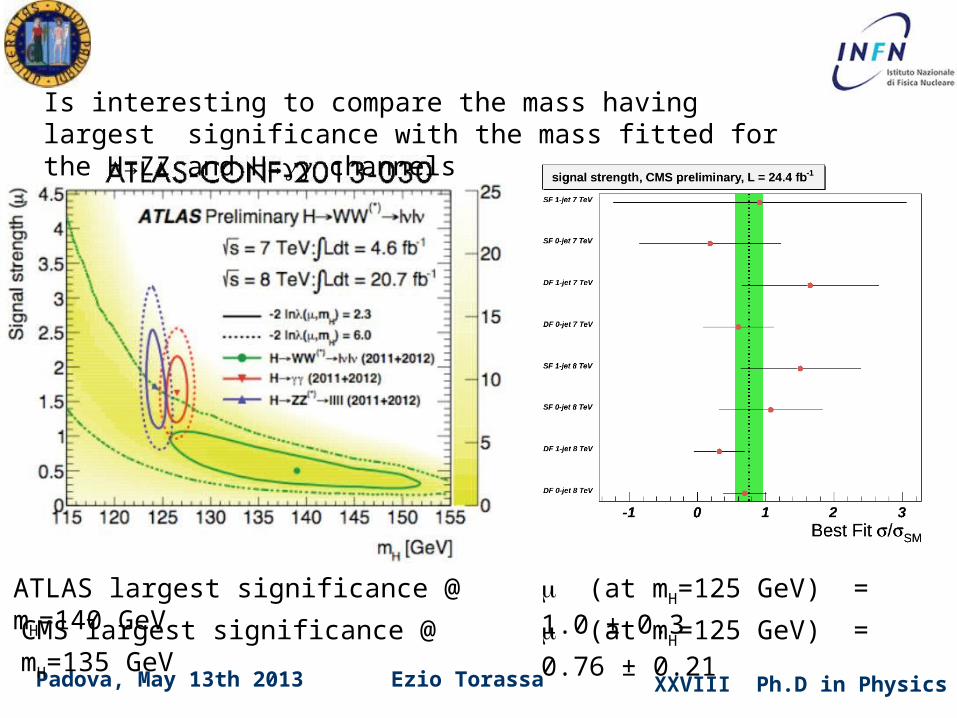
ATLAS largest significance @ mH=140 GeV
CMS largest significance @ mH=135 GeV
Is interesting to compare the mass having largest significance with the mass fitted for the H→ZZ and H→ channels
(at mH=125 GeV) = 0.76 ± 0.21
(at mH=125 GeV) = 1.0 ± 0.3
XXVIII Ph.D in PhysicsEzio TorassaPadova, May 13th 2013
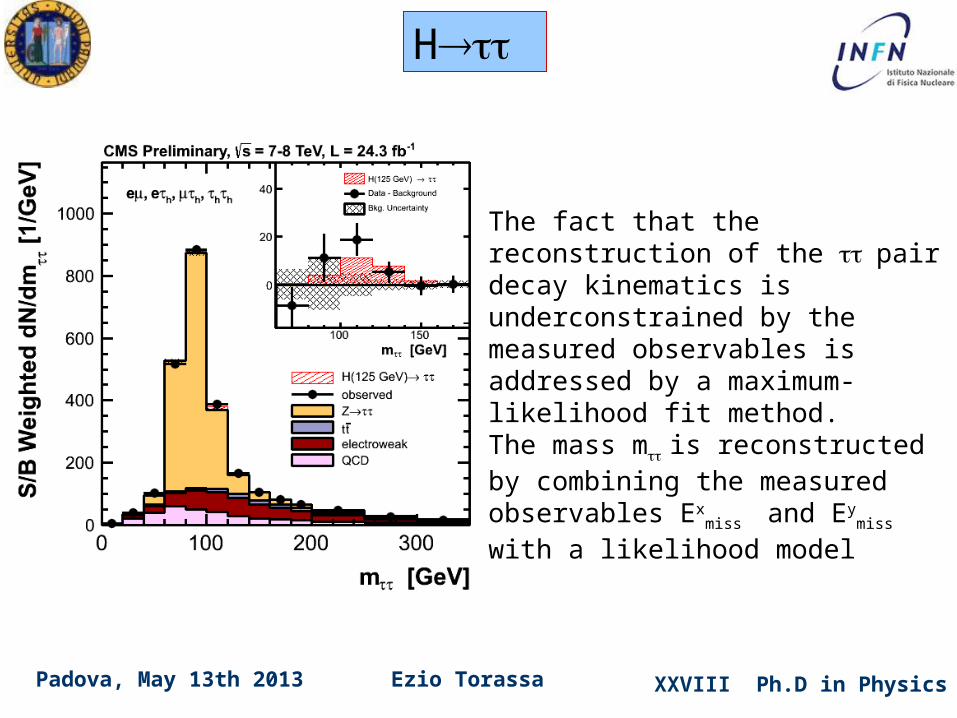
The fact that the reconstruction of the pair decay kinematics is underconstrained by the measured observables is addressed by a maximum-likelihood fit method. The mass mis reconstructed by combining the measured observables Ex
miss and Ey
miss with a likelihood model
H
XXVIII Ph.D in PhysicsEzio TorassaPadova, May 13th 2013
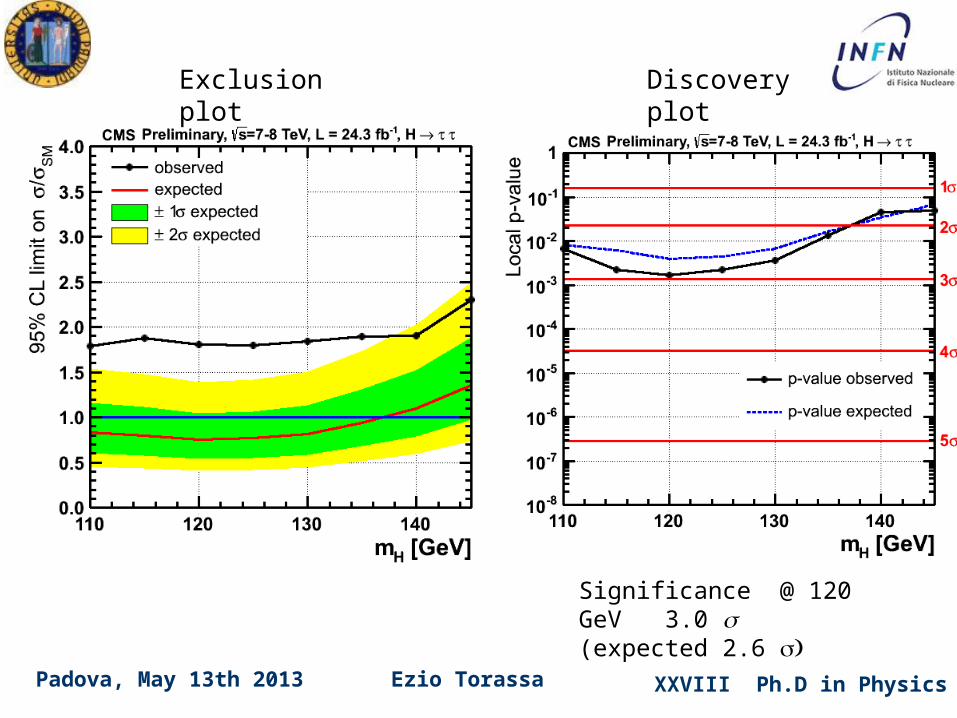
Exclusion plot Discovery plot
Significance @ 120 GeV 3.0 (expected 2.6
XXVIII Ph.D in PhysicsEzio TorassaPadova, May 13th 2013
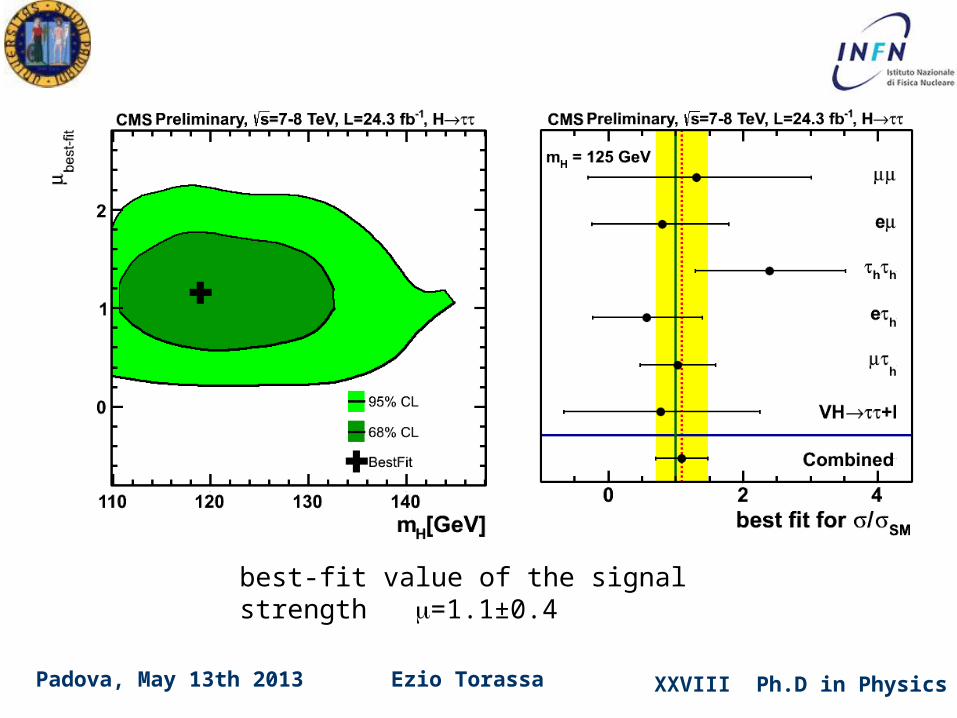
best-fit value of the signal strength =1.1±0.4
XXVIII Ph.D in PhysicsEzio TorassaPadova, May 13th 2013
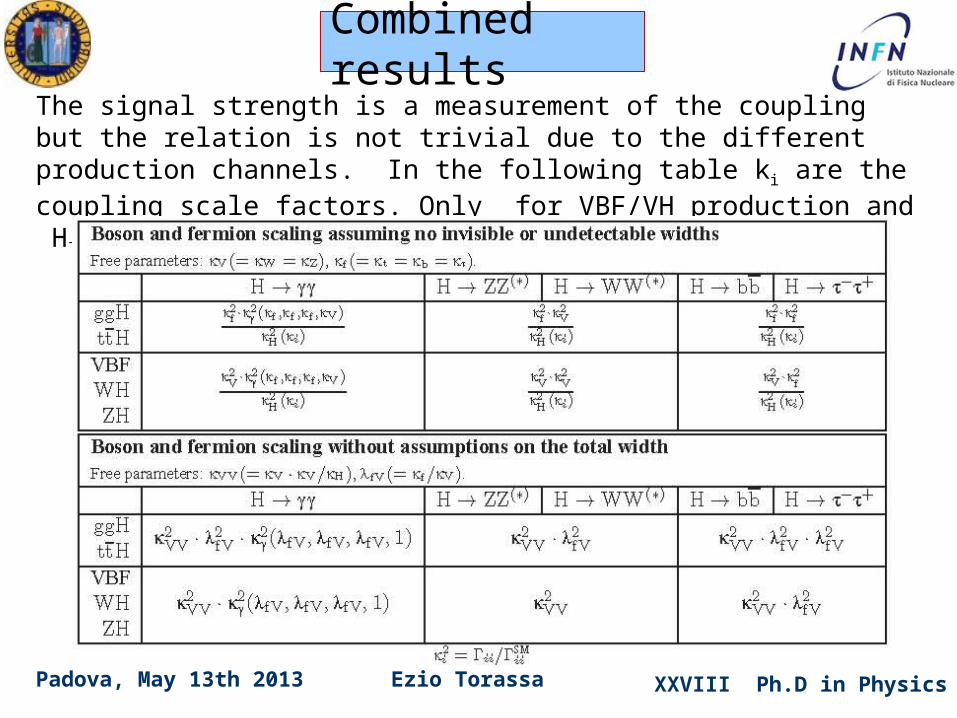
The signal strength is a measurement of the coupling but the relation is not trivial due to the different production channels. In the following table ki are the coupling scale factors. Only for VBF/VH production and H→VV decay the signal strength factor is simply k2
VV
Combined results
XXVIII Ph.D in PhysicsEzio TorassaPadova, May 13th 2013
ff
fhfm
v
mg
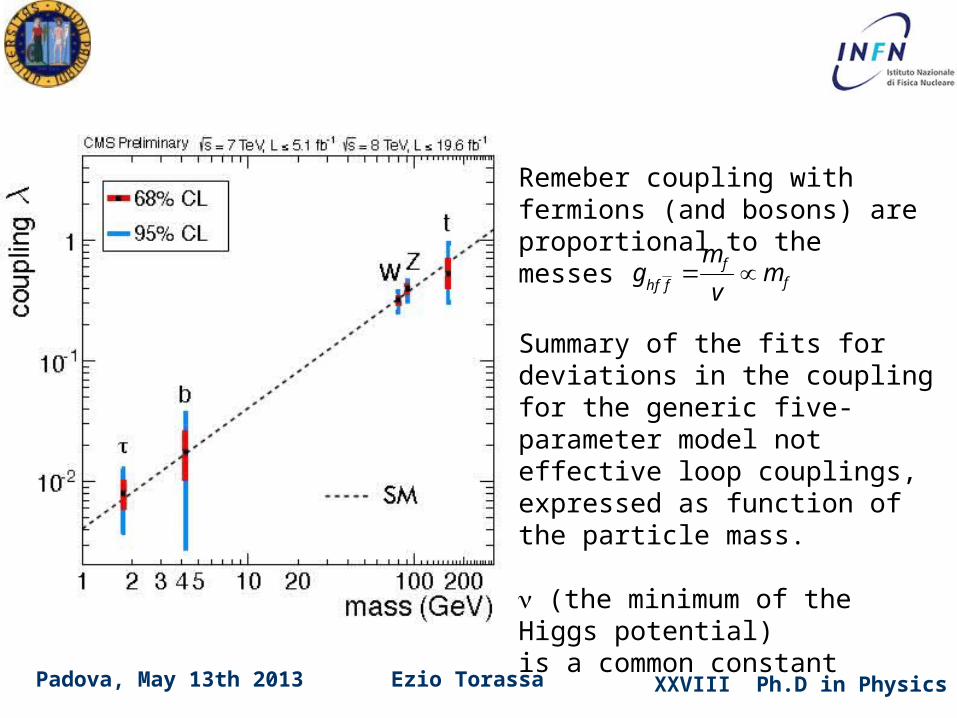
Remeber coupling with fermions (and bosons) are proportional to the messes
Summary of the fits for deviations in the coupling for the generic five-parameter model not effective loop couplings, expressed as function of the particle mass.
(the minimum of the Higgs potential)is a common constant
XXVIII Ph.D in PhysicsEzio TorassaPadova, May 13th 2013
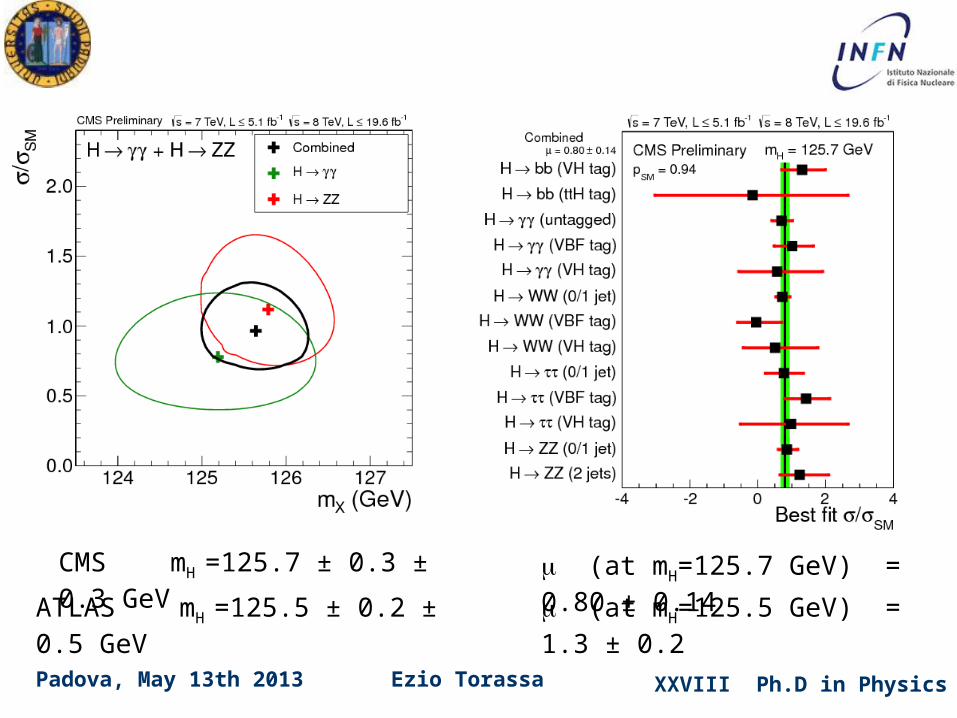
(at mH=125.7 GeV) = 0.80 ± 0.14CMS mH =125.7 ± 0.3 ± 0.3 GeV
ATLAS mH =125.5 ± 0.2 ± 0.5 GeV (at mH=125.5 GeV) = 1.3 ± 0.2
XXVIII Ph.D in PhysicsEzio TorassaPadova, May 13th 2013
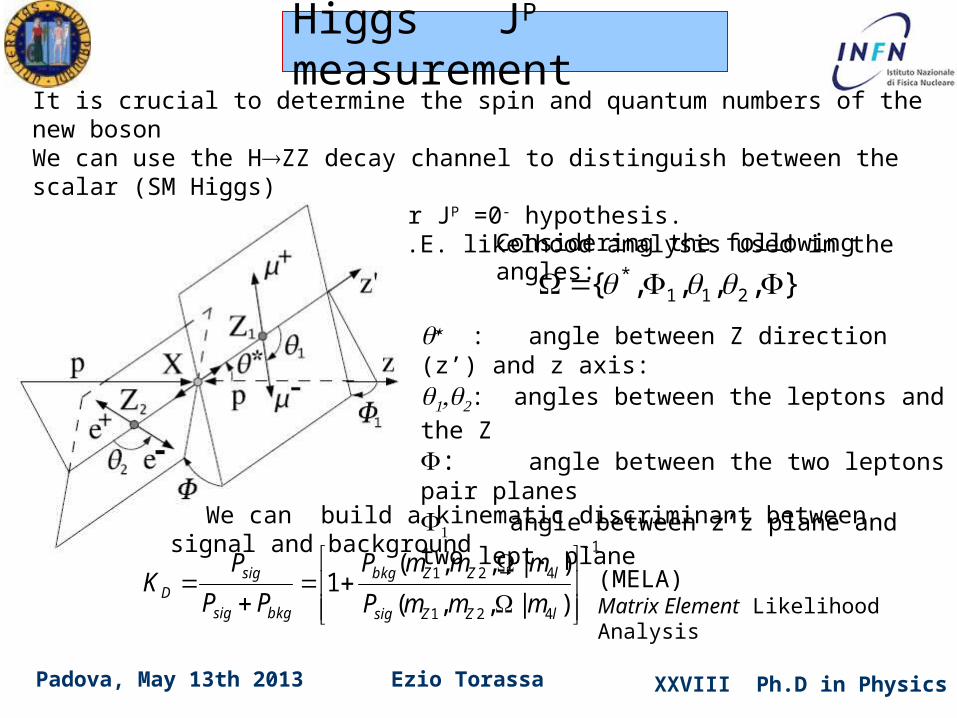
It is crucial to determine the spin and quantum numbers of the new bosonWe can use the HZZ decay channel to distinguish between the scalar (SM Higgs)JP=0+ and the pseudoscalar JP =0- hypothesis.We start to remember the M.E. likelhood analysis used in the mass estimation
Considering the following angles:
},,,,{ 211*
: angle between Z direction (z’) and z axis:: angles between the leptons and the Z
: angle between the two leptons pair planes angle between z’z plane and two lept. plane
We can build a kinematic discriminant between signal and background1
421
421
)|,,(
)|,,(1
lZZsig
lZZbkg
bkgsig
sigD
mmmP
mmmP
PP
PK
(MELA)Matrix Element Likelihood Analysis
Higgs JP measurement
XXVIII Ph.D in PhysicsEzio TorassaPadova, May 13th 2013
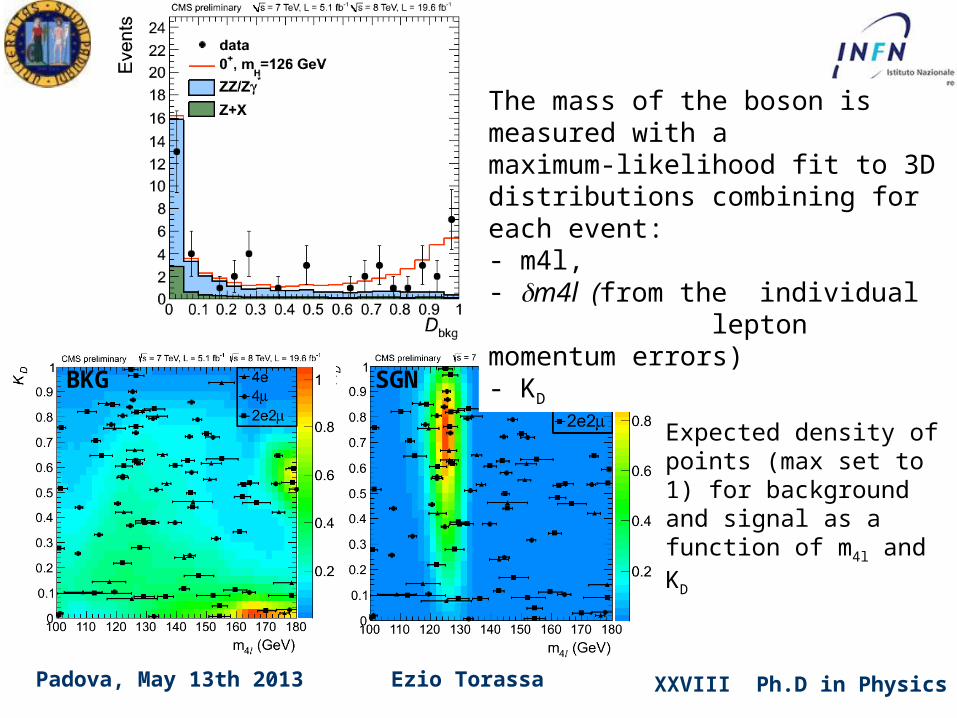
The mass of the boson is measured with a maximum-likelihood fit to 3D distributions combining for each event:- m4l, - m4l (from the individual lepton momentum errors)- KD
BKG SGN
Expected density of points (max set to 1) for background and signal as a function of m4l and KD
XXVIII Ph.D in PhysicsEzio TorassaPadova, May 13th 2013
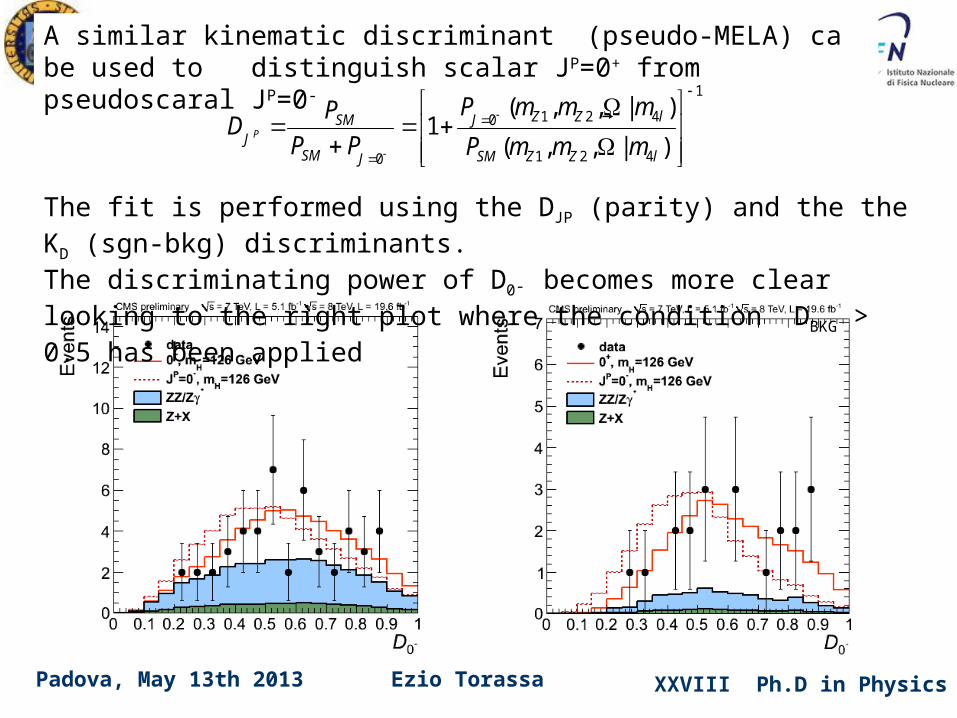
The fit is performed using the DJP (parity) and the the KD (sgn-bkg) discriminants.The discriminating power of D0- becomes more clear looking to the right plot where the condition DBKG > 0.5 has been applied
A similar kinematic discriminant (pseudo-MELA) ca be used to distinguish scalar JP=0+ from pseudoscaral JP=0-
1
421
4210
0)|,,(
)|,,(1
lZZSM
lZZJ
JSM
SMJ mmmP
mmmP
PP
PD P
XXVIII Ph.D in PhysicsEzio TorassaPadova, May 13th 2013
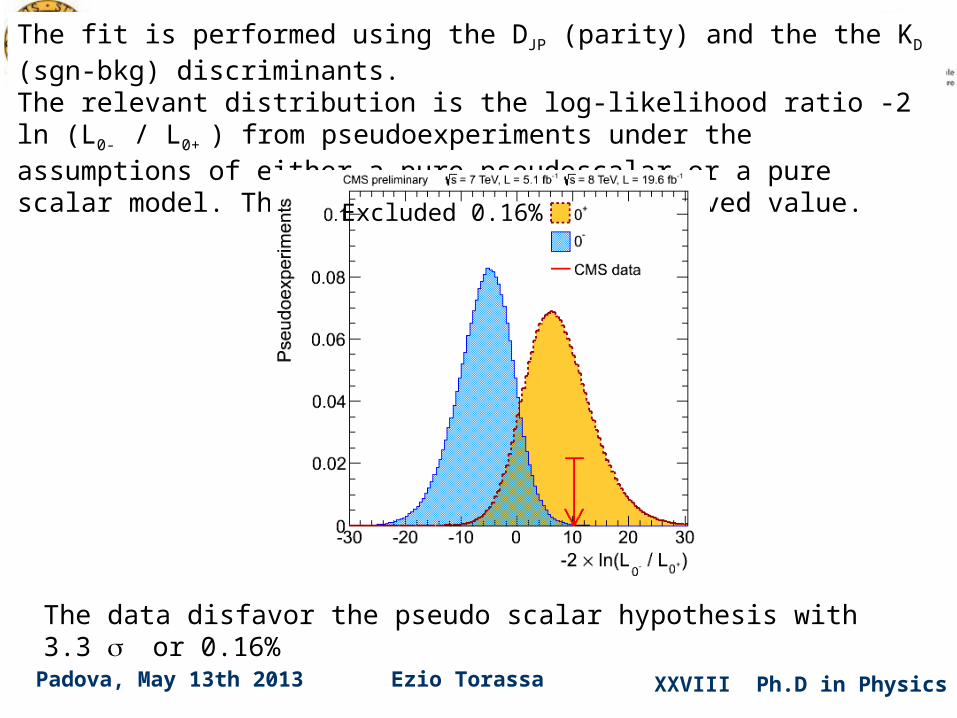
The fit is performed using the DJP (parity) and the the KD (sgn-bkg) discriminants.The relevant distribution is the log-likelihood ratio -2 ln (L0- / L0+ ) from pseudoexperiments under the assumptions of either a pure pseudoscalar or a pure scalar model. The arrow indicates the observed value.
The data disfavor the pseudo scalar hypothesis with 3.3 or 0.16%
Excluded 0.16%
XXVIII Ph.D in PhysicsEzio TorassaPadova, May 13th 2013
XXVIII Ph.D in PhysicsEzio TorassaPadova, May 13th 2013
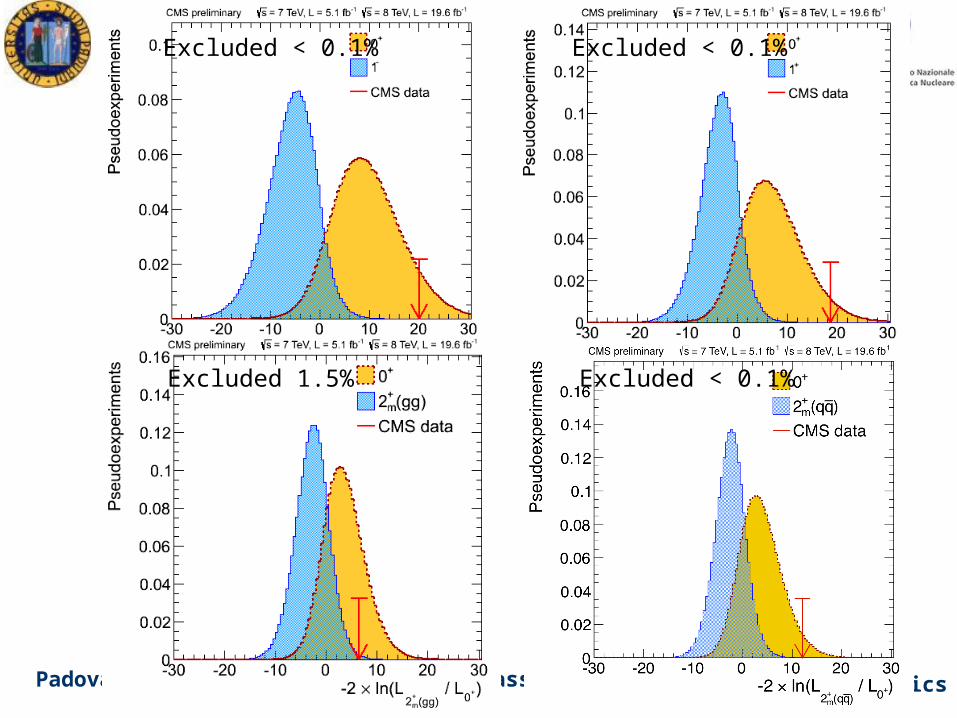
Excluded < 0.1% Excluded < 0.1%
Excluded < 0.1%Excluded 1.5%
XXVIII Ph.D in PhysicsEzio TorassaPadova, May 13th 201349
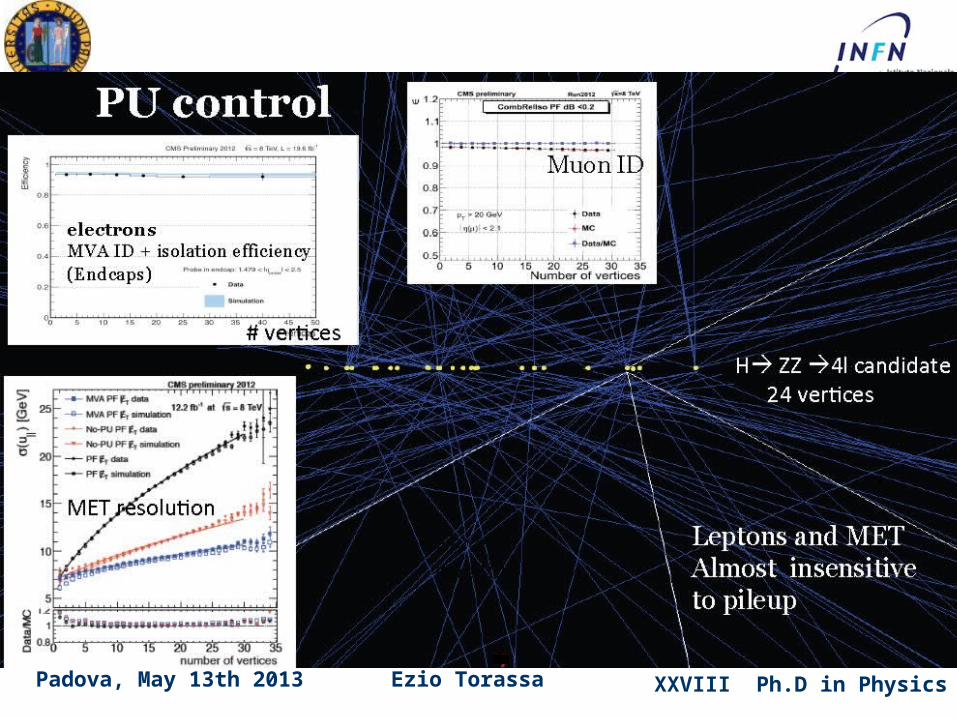
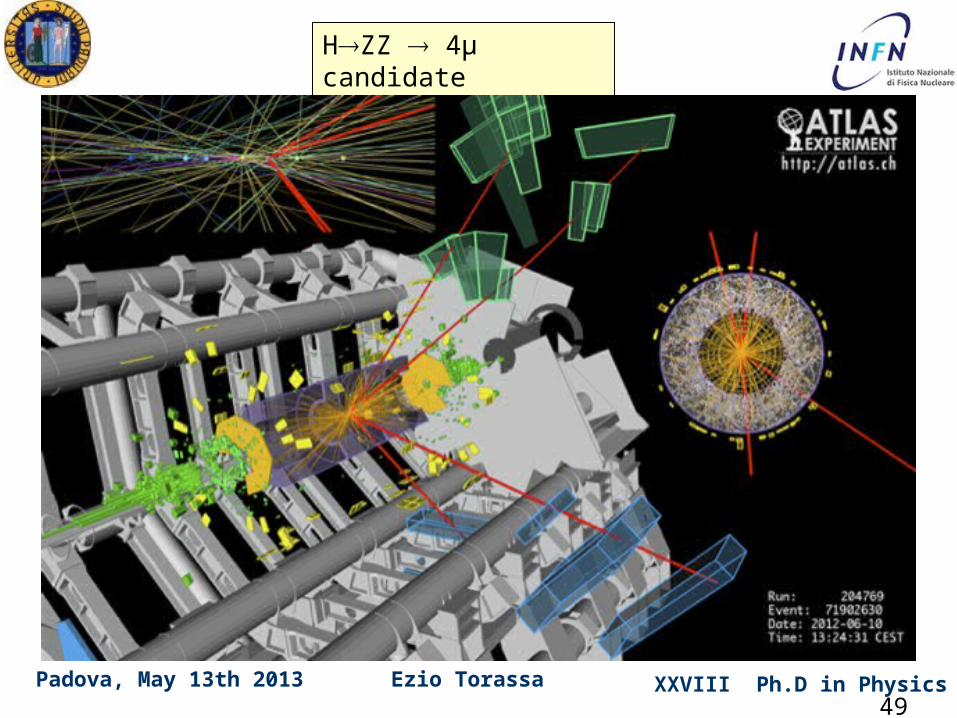
HZZ 4μ candidate
XXVIII Ph.D in PhysicsEzio TorassaPadova, May 13th 2013
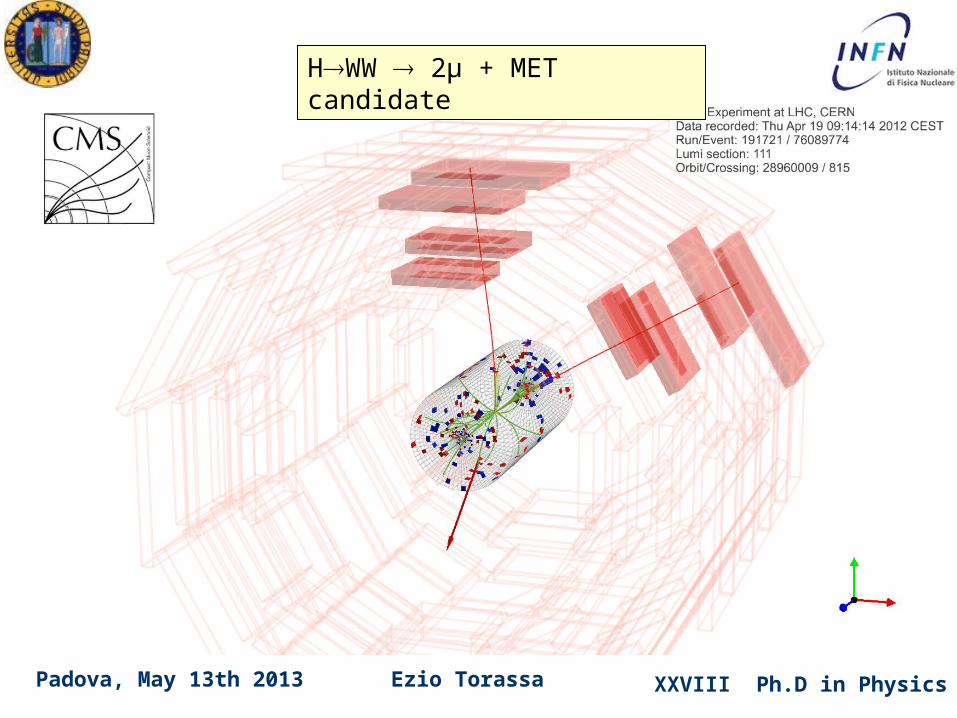
HWW 2μ + MET candidate
XXVIII Ph.D in PhysicsEzio TorassaPadova, May 13th 2013
Higgs searches at LHC:
CERN-PH-EP-2012-354 TOTEM Luminosity measurementCERN-PH-EP/2013-035 arXiv:1303.4571v1 (19 March 2013)Observation of a new boson with mass near 125 GeV in pp collisions at √s = 7 and 8 TeV
CMS-PAS-HIG-13-005Combination of standard model Higgs boson searches and measurements of the properties of the new boson with a mass near 125 GeV
CMS-PAS-HIG-13-002Properties of the Higgs-like boson in the decay H to ZZ to 4l in pp collisions at √s =7 and 8 TeV
XXVIII Ph.D in PhysicsEzio TorassaPadova, May 13th 2013
Backup
XXVIII Ph.D in PhysicsEzio TorassaPadova, May 13th 2013
XXVIII Ph.D in PhysicsEzio TorassaPadova, May 13th 2013
Look elsewhere effect
arXiv:1005.1891v3
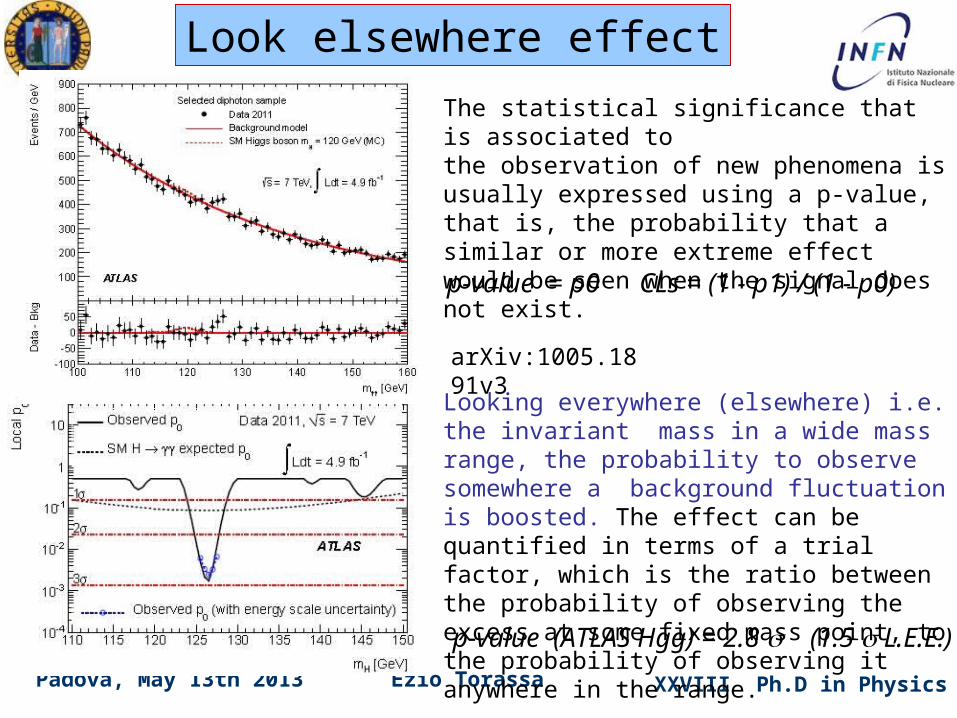
The statistical significance that is associated tothe observation of new phenomena is usually expressed using a p-value, that is, the probability that a similar or more extreme effect would be seen when the signal does not exist.
p-value = p0 CLs = (1 - p1) / (1 - p0)
Looking everywhere (elsewhere) i.e. the invariant mass in a wide mass range, the probability to observe somewhere a background fluctuation is boosted. The effect can be quantified in terms of a trial factor, which is the ratio between the probability of observing the excess at some fixed mass point, to the probability of observing it anywhere in the range.
p-value (ATLAS Hgg) = 2.8 (1.5 L.E.E.)


