Adapteo is a leading Northern European company for adaptable buildings. We build, rent out and sell buildings for temporary and permanent needs. Adapteo was born in the demerger of Cramo on 30 June, 2019 and is since 1 July 2019 listed on Nasdaq Stockholm. ANNUAL REPORT WITH BOARD OF DIRECTORS’ REPORT AND FINANCIAL STATEMENTS — 2019
Transcript
ANNUAL REPORT WITH BOARD OF DIRECTORS’ REPORT AND FINANCIAL STATEMENTS
XXXXXXXXXXXX
1
Adapteo is a leading Northern European company for adaptable buildings. We build, rent out and sell buildings for temporary and permanent needs. Adapteo was born in the demerger of Cramo on 30 June, 2019 and is since 1 July 2019 listed on Nasdaq Stockholm.
ANNUAL REPORT WITH BOARD OF DIRECTORS’ REPORT AND FINANCIAL STATEMENTS —2019
ANNUAL REPORT WITH BOARD OF DIRECTORS’ REPORT AND FINANCIAL STATEMENTS 2
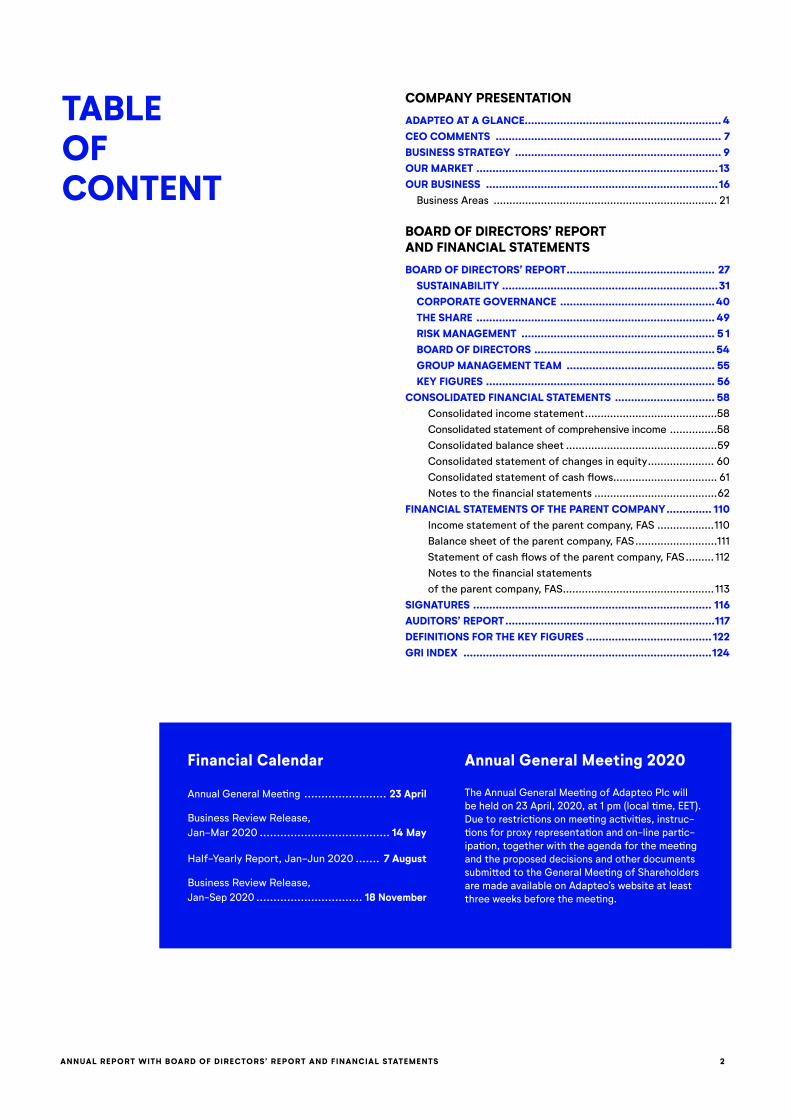
TABLE OF CONTENT
COMPANY PRESENTATION
ADAPTEO AT A GLANCE............................................................. 4CEO COMMENTS ...................................................................... 7BUSINESS STRATEGY ................................................................ 9OUR MARKET ...........................................................................13OUR BUSINESS ........................................................................16
Business Areas ....................................................................... 21
BOARD OF DIRECTORS’ REPORT AND FINANCIAL STATEMENTS
BOARD OF DIRECTORS’ REPORT .............................................. 27SUSTAINABILITY ...................................................................31CORPORATE GOVERNANCE ................................................40THE SHARE .......................................................................... 49RISK MANAGEMENT ............................................................ 5 1BOARD OF DIRECTORS ........................................................ 54GROUP MANAGEMENT TEAM .............................................. 55KEY FIGURES ....................................................................... 56
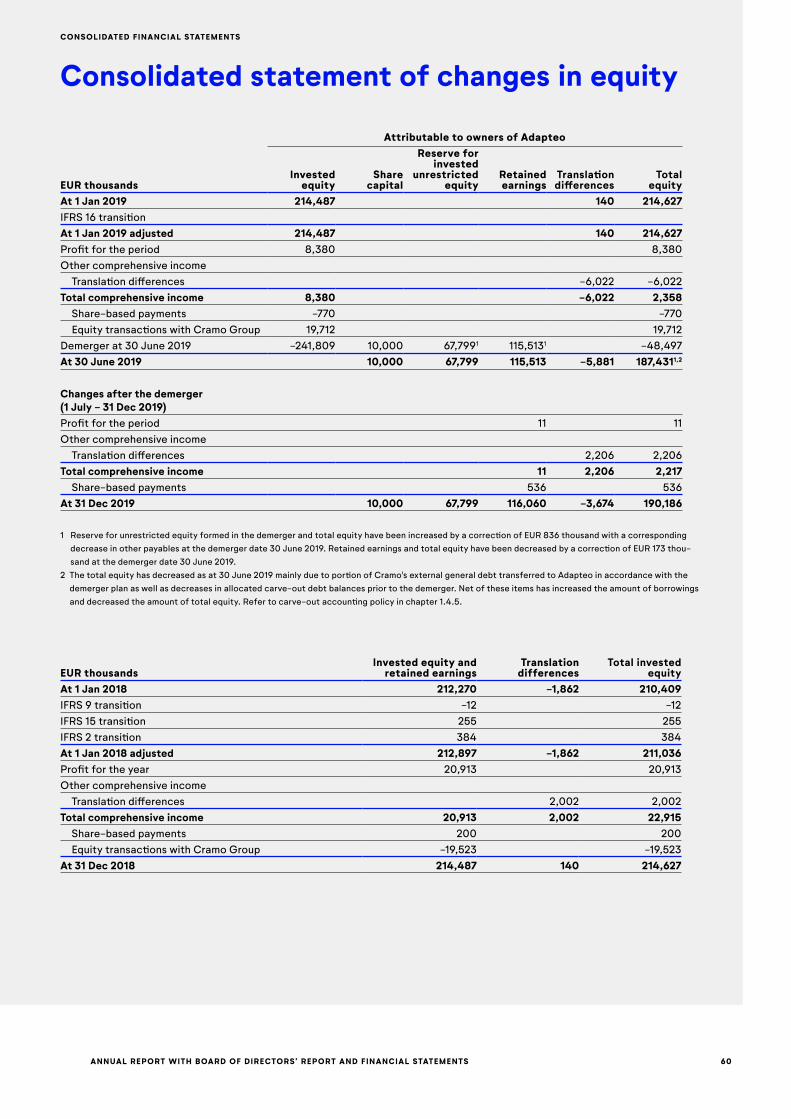
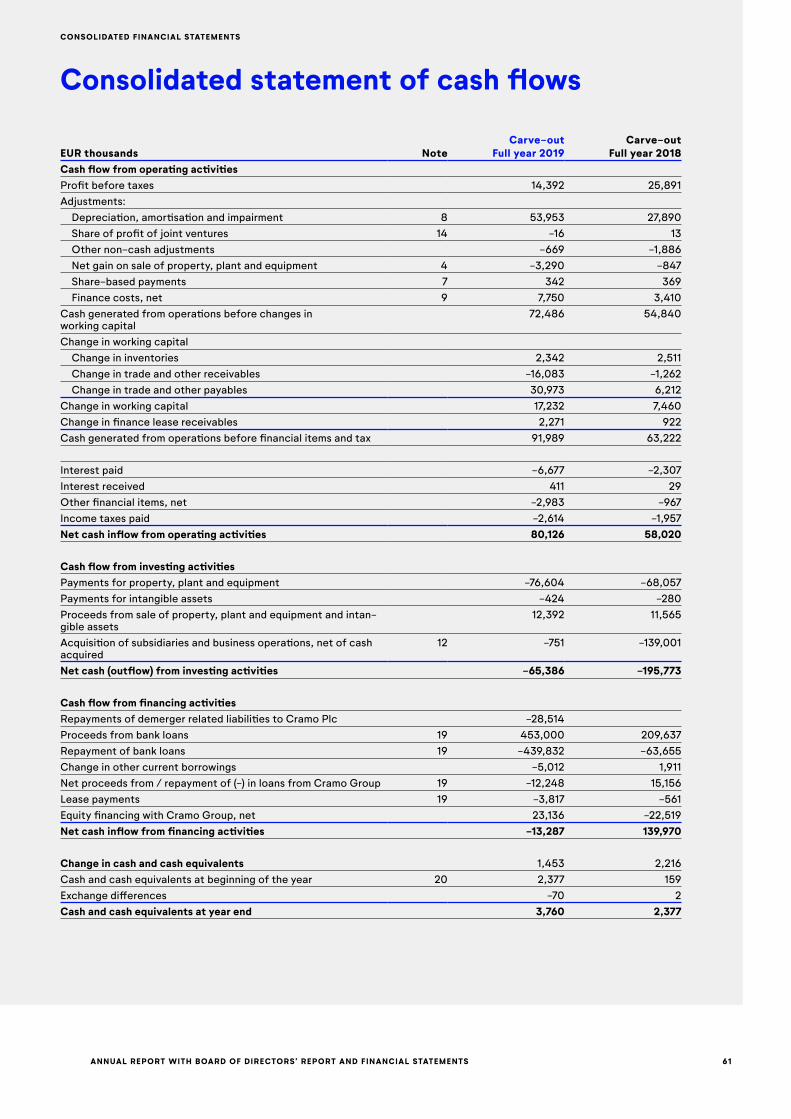
CONSOLIDATED FINANCIAL STATEMENTS ............................... 58Consolidated income statement ..........................................58Consolidated statement of comprehensive income ...............58Consolidated balance sheet ................................................59Consolidated statement of changes in equity ..................... 60Consolidated statement of cash flows................................. 61Notes to the financial statements .......................................62
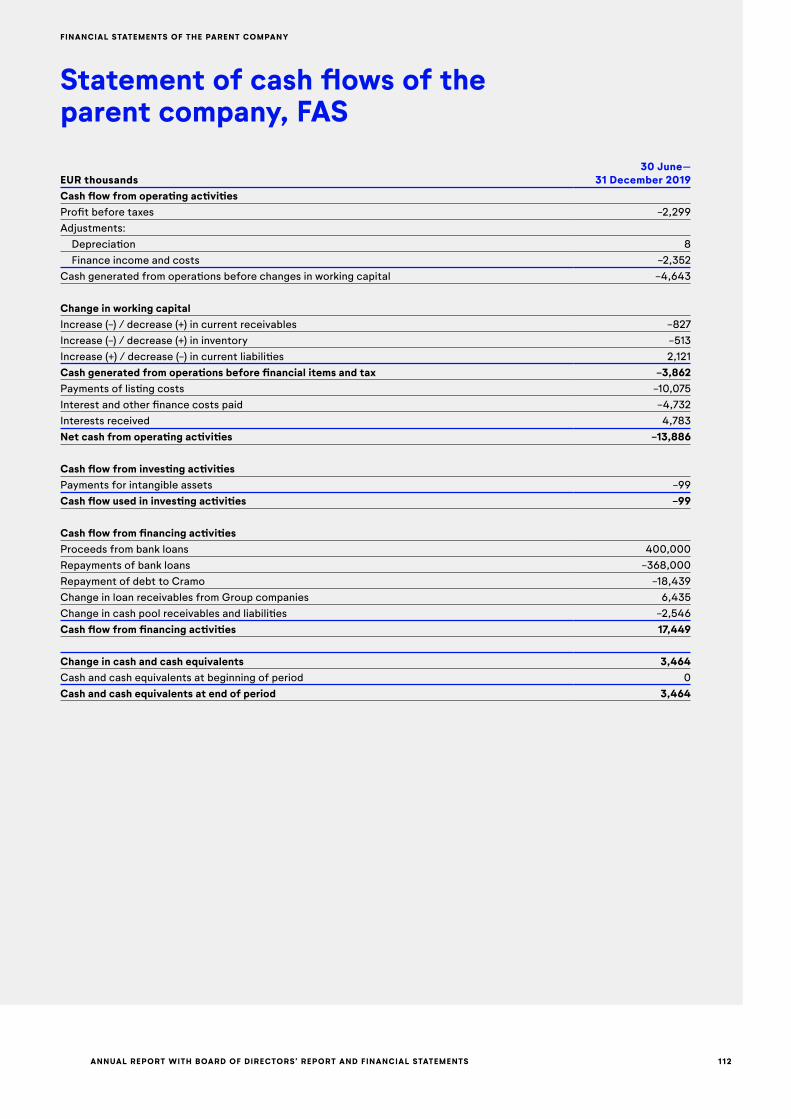
FINANCIAL STATEMENTS OF THE PARENT COMPANY .............. 110Income statement of the parent company, FAS ..................110Balance sheet of the parent company, FAS ..........................111Statement of cash flows of the parent company, FAS ......... 112 Notes to the financial statements of the parent company, FAS ................................................ 113
SIGNATURES .......................................................................... 116AUDITORS’ REPORT .................................................................117DEFINITIONS FOR THE KEY FIGURES .......................................122GRI INDEX .............................................................................124
Financial Calendar
Annual General Meeting ........................ 23 April
Business Review Release, Jan-Mar 2020 ...................................... 14 May
Half-Yearly Report, Jan-Jun 2020 ....... 7 August
Business Review Release, Jan-Sep 2020 ............................... 18 November
Annual General Meeting 2020
The Annual General Meeting of Adapteo Plc will be held on 23 April, 2020, at 1 pm (local time, EET). Due to restrictions on meeting activities, instruc-tions for proxy representation and on-line partic-ipation, together with the agenda for the meeting and the proposed decisions and other documents submitted to the General Meeting of Shareholders are made available on Adapteo’s website at least three weeks before the meeting.
ANNUAL REPORT WITH BOARD OF DIRECTORS’ REPORT AND FINANCIAL STATEMENTS
XXXXXXXXXXXX
3
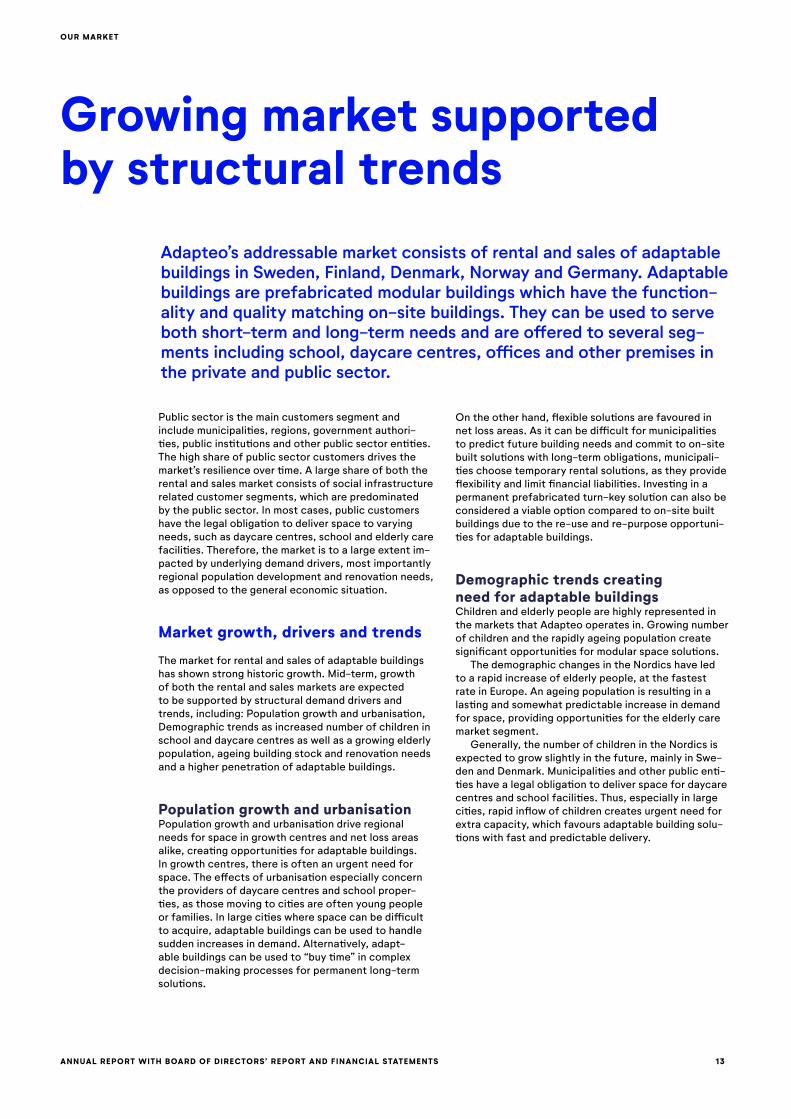
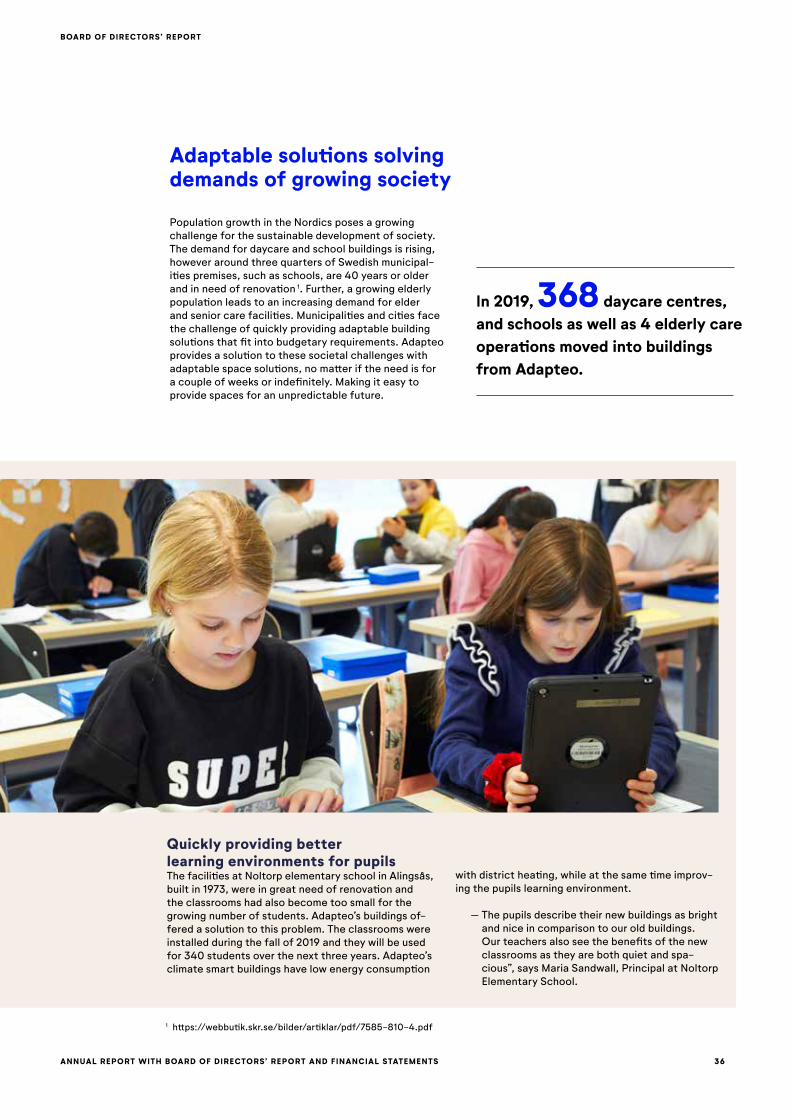
School children i front of their adaptable school.
ANNUAL REPORT WITH BOARD OF DIRECTORS’ REPORT AND FINANCIAL STATEMENTS 4
Collaborative
ADAPTEO IN BRIEF
Adapteo at a glance
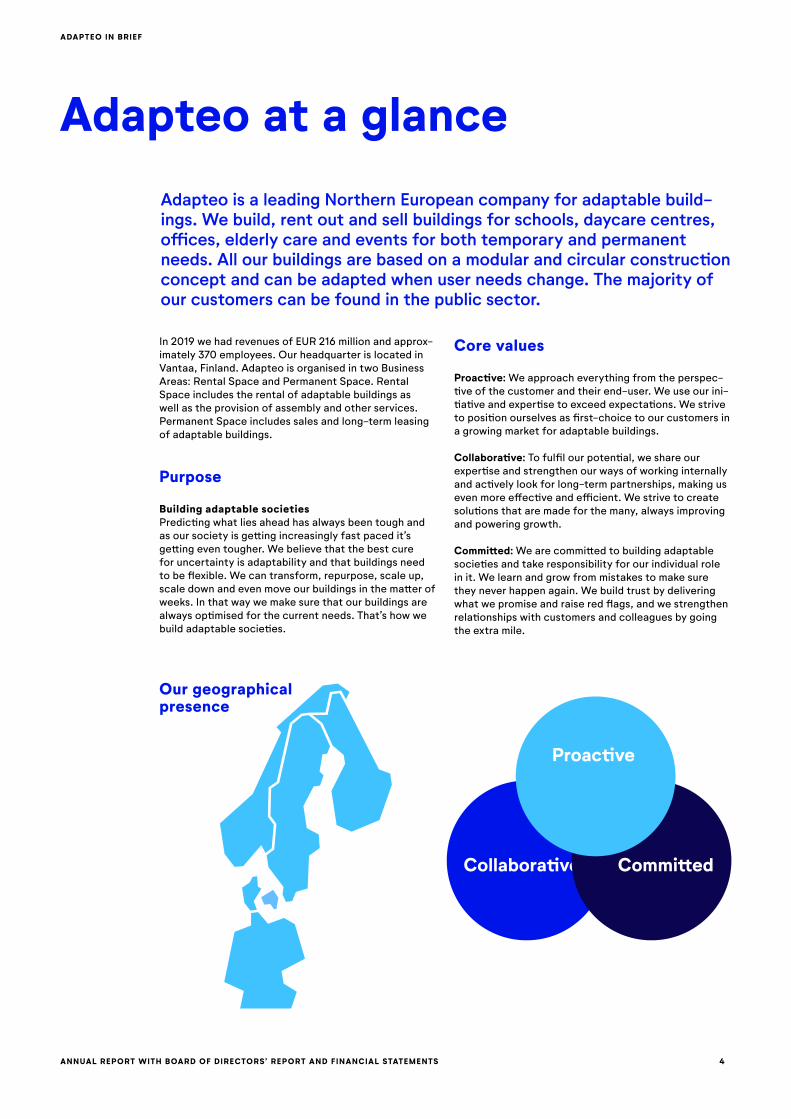
In 2019 we had revenues of EUR 216 million and approx-imately 370 employees. Our headquarter is located in Vantaa, Finland. Adapteo is organised in two Business Areas: Rental Space and Permanent Space. Rental Space includes the rental of adaptable buildings as well as the provision of assembly and other services. Permanent Space includes sales and long-term leasing of adaptable buildings.
Purpose
Building adaptable societiesPredicting what lies ahead has always been tough and as our society is getting increasingly fast paced it’s getting even tougher. We believe that the best cure for uncertainty is adaptability and that buildings need to be flexible. We can transform, repurpose, scale up, scale down and even move our buildings in the matter of weeks. In that way we make sure that our buildings are always optimised for the current needs. That’s how we build adaptable societies.
Core values
Proactive: We approach everything from the perspec-tive of the customer and their end-user. We use our ini-tiative and expertise to exceed expectations. We strive to position ourselves as first-choice to our customers in a growing market for adaptable buildings.
Collaborative: To fulfil our potential, we share ourexpertise and strengthen our ways of working internallyand actively look for long-term partnerships, making useven more effective and efficient. We strive to create solutions that are made for the many, always improving and powering growth.
Committed: We are committed to building adaptable societies and take responsibility for our individual role in it. We learn and grow from mistakes to make sure they never happen again. We build trust by delivering what we promise and raise red flags, and we strengthen relationships with customers and colleagues by going the extra mile.
Adapteo is a leading Northern European company for adaptable buildings. We build, rent out and sell buildings for schools, daycare centres, offices, elderly care and events for both temporary and permanent needs. All our buildings are based on a modular and circular construction concept and can be adapted when user needs change. The majority of our customers can be found in the public sector.
Our geographical presence
Proactive
Committed
ANNUAL REPORT WITH BOARD OF DIRECTORS’ REPORT AND FINANCIAL STATEMENTS 5
ADAPTEO IN BRIEF
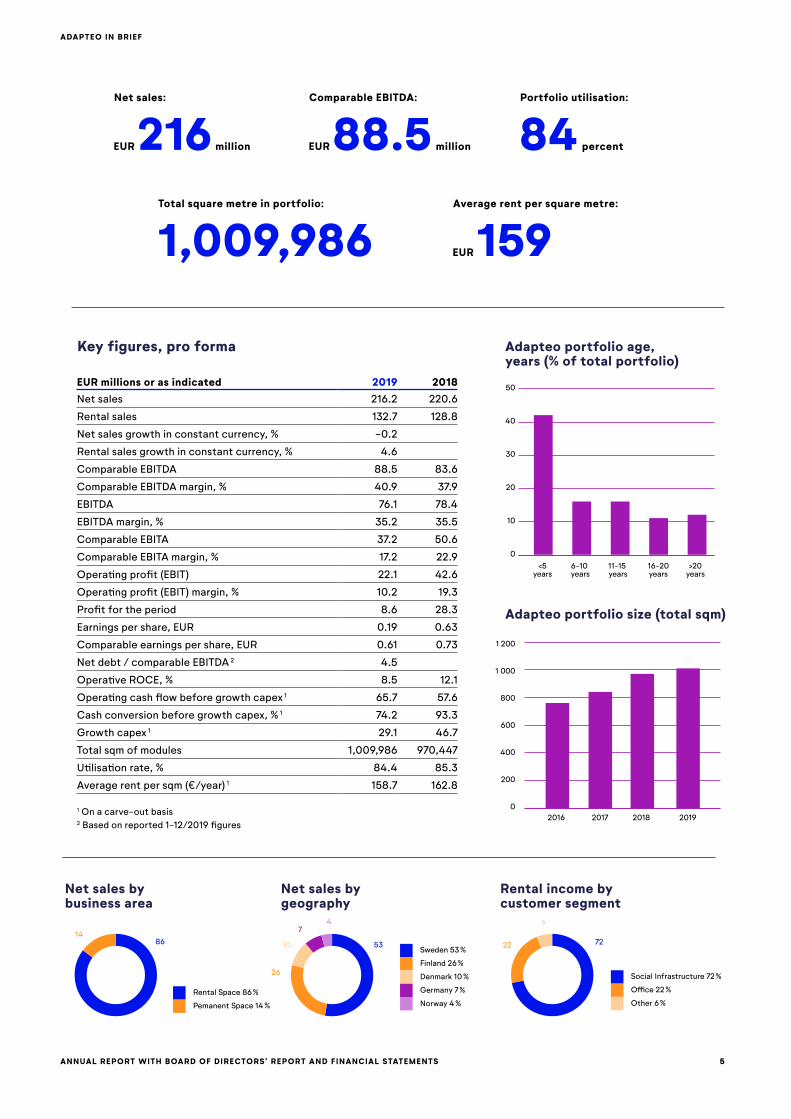
EUR 216 million
Net sales:
84 percent
Portfolio utilisation:
EUR 159Average rent per square metre:
EUR 88.5 million
Comparable EBITDA:
1,009,986Total square metre in portfolio:
Adapteo portfolio age, years (% of total portfolio)
Adapteo portfolio size (total sqm)
<5 years
2016 2017 2018 2019
6-10 years
11-15 years
16-20 years
>20 years
1 200
1 000
800
600
400
200
0
50
40
30
20
10
0
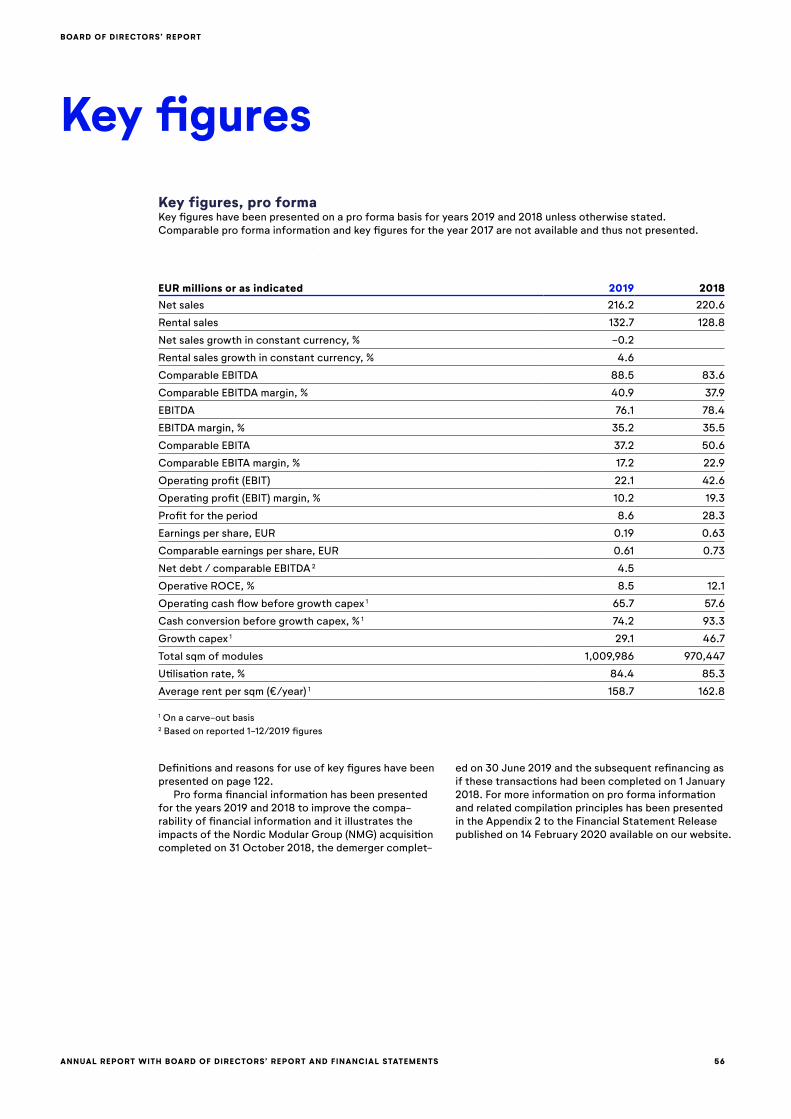
EUR millions or as indicated 2019 2018Net sales 216.2 220.6
Rental sales 132.7 128.8
Net sales growth in constant currency, % -0.2
Rental sales growth in constant currency, % 4.6
Comparable EBITDA 88.5 83.6
Comparable EBITDA margin, % 40.9 37.9
EBITDA 76.1 78.4
EBITDA margin, % 35.2 35.5
Comparable EBITA 37.2 50.6
Comparable EBITA margin, % 17.2 22.9
Operating profit (EBIT) 22.1 42.6
Operating profit (EBIT) margin, % 10.2 19.3
Profit for the period 8.6 28.3
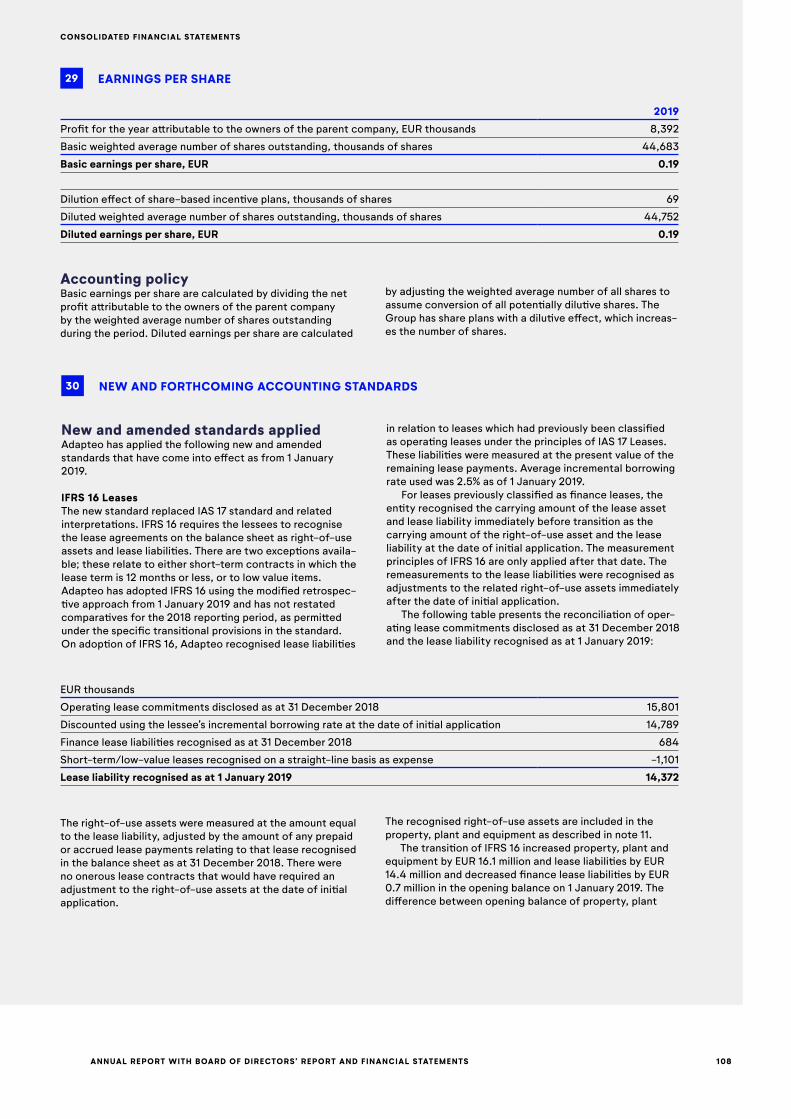
Earnings per share, EUR 0.19 0.63
Comparable earnings per share, EUR 0.61 0.73
Net debt / comparable EBITDA 2 4.5
Operative ROCE, % 8.5 12.1
Operating cash flow before growth capex 1 65.7 57.6
Cash conversion before growth capex, % 1 74.2 93.3
Growth capex 1 29.1 46.7
Total sqm of modules 1,009,986 970,447
Utilisation rate, % 84.4 85.3
Average rent per sqm (€/year) 1 158.7 162.8
1 On a carve-out basis2 Based on reported 1-12/2019 figures
Key figures, pro forma
86 53 7214
26
2210
764
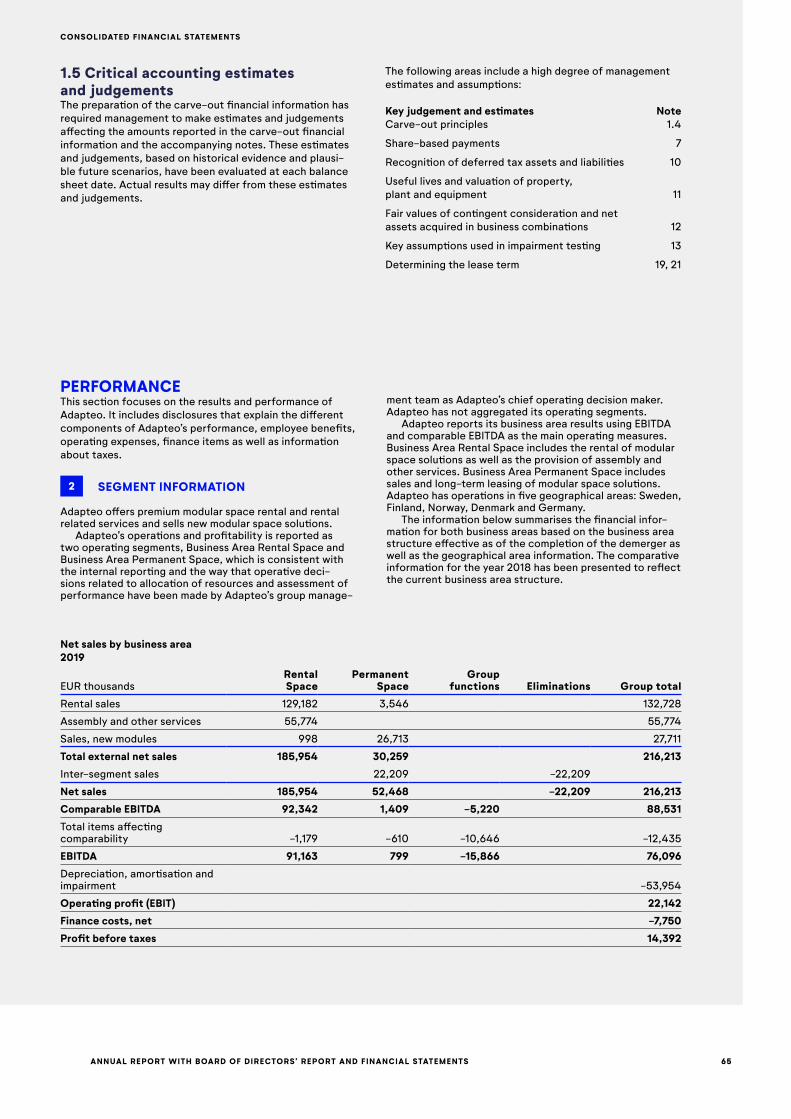
Net sales by business area
Net sales by geography
Rental income by customer segment
Rental Space 86 %
Pemanent Space 14 %
Sweden 53 %
Finland 26 %
Denmark 10 %
Germany 7 %
Norway 4 %
Social Infrastructure 72 %
Office 22 %
Other 6 %
ANNUAL REPORT WITH BOARD OF DIRECTORS’ REPORT AND FINANCIAL STATEMENTS 6
ADAPTEO IN BRIEF
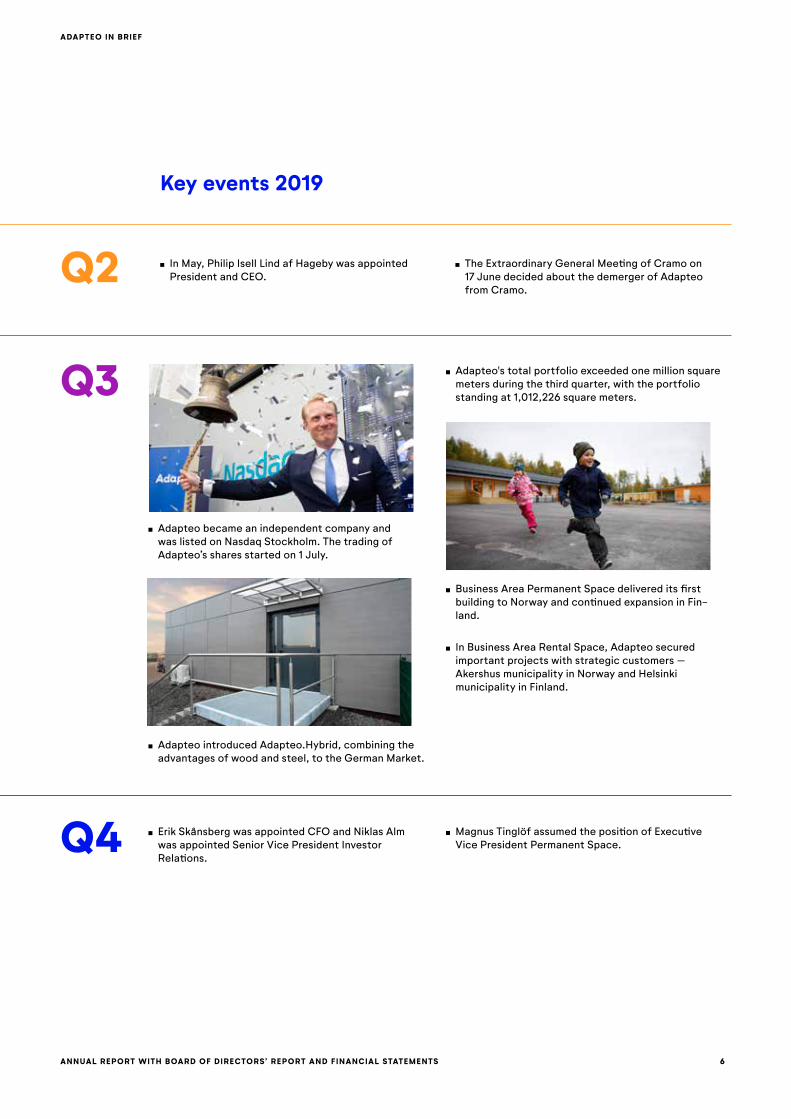
Key events 2019
In May, Philip Isell Lind af Hageby was appointed President and CEO.
Erik Skånsberg was appointed CFO and Niklas Alm was appointed Senior Vice President Investor Relations.
Magnus Tinglöf assumed the position of Executive Vice President Permanent Space.
Adapteo became an independent company and was listed on Nasdaq Stockholm. The trading of Adapteo’s shares started on 1 July.
Adapteo introduced Adapteo.Hybrid, combining the advantages of wood and steel, to the German Market.
Business Area Permanent Space delivered its first building to Norway and continued expansion in Fin-land.
Adapteo's total portfolio exceeded one million square meters during the third quarter, with the portfolio standing at 1,012,226 square meters.
The Extraordinary General Meeting of Cramo on 17 June decided about the demerger of Adapteo from Cramo.
Q2
Q3
Q4
In Business Area Rental Space, Adapteo secured important projects with strategic customers – Akershus municipality in Norway and Helsinki municipality in Finland.
ANNUAL REPORT WITH BOARD OF DIRECTORS’ REPORT AND FINANCIAL STATEMENTS 7
CEO COMMENTS
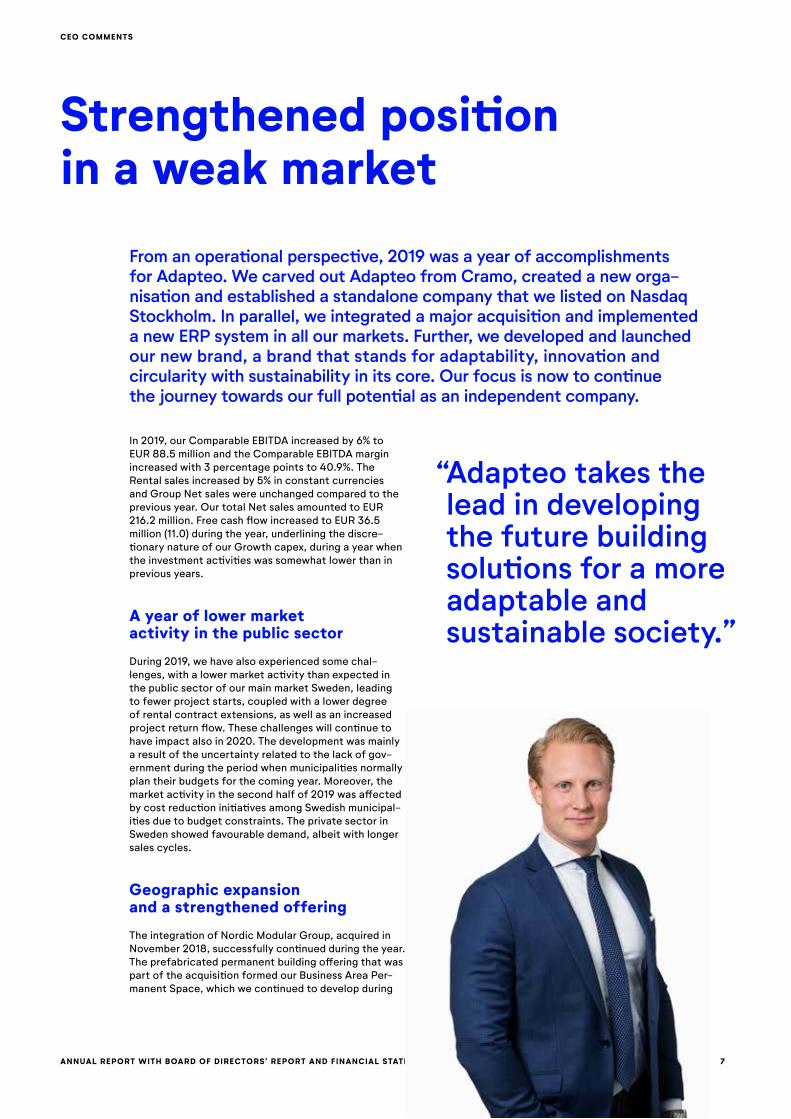
Strengthened position in a weak market
“ Adapteo takes the lead in developing the future building solutions for a more adaptable and sustainable society.”
In 2019, our Comparable EBITDA increased by 6% to EUR 88.5 million and the Comparable EBITDA margin increased with 3 percentage points to 40.9%. The Rental sales increased by 5% in constant currencies and Group Net sales were unchanged compared to the previous year. Our total Net sales amounted to EUR 216.2 million. Free cash flow increased to EUR 36.5 million (11.0) during the year, underlining the discre-tionary nature of our Growth capex, during a year when the investment activities was somewhat lower than in previous years.
A year of lower market activity in the public sector
During 2019, we have also experienced some chal-lenges, with a lower market activity than expected in the public sector of our main market Sweden, leading to fewer project starts, coupled with a lower degree of rental contract extensions, as well as an increased project return flow. These challenges will continue to have impact also in 2020. The development was mainly a result of the uncertainty related to the lack of gov-ernment during the period when municipalities normally plan their budgets for the coming year. Moreover, the market activity in the second half of 2019 was affected by cost reduction initiatives among Swedish municipal-ities due to budget constraints. The private sector in Sweden showed favourable demand, albeit with longer sales cycles.
Geographic expansion and a strengthened offering
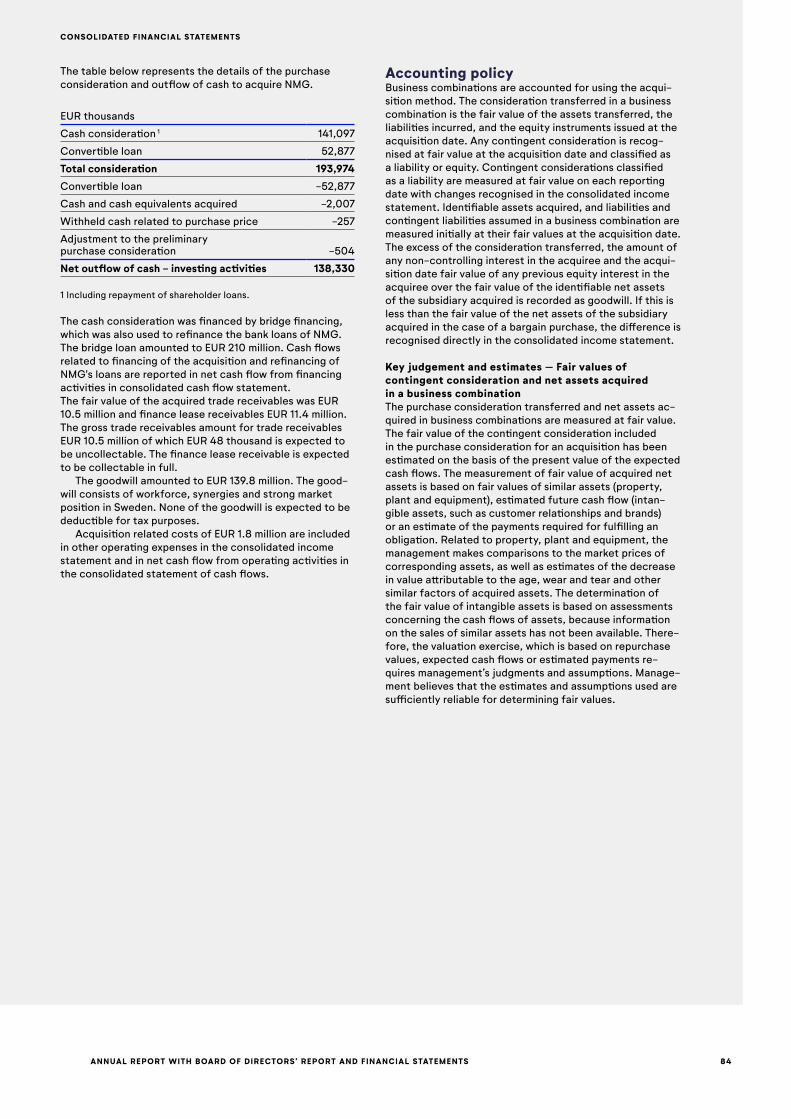
The integration of Nordic Modular Group, acquired in November 2018, successfully continued during the year. The prefabricated permanent building offering that was part of the acquisition formed our Business Area Per-manent Space, which we continued to develop during
From an operational perspective, 2019 was a year of accomplishments for Adapteo. We carved out Adapteo from Cramo, created a new organisation and established a standalone company that we listed on Nasdaq Stockholm. In parallel, we integrated a major acquisition and implemented a new ERP system in all our markets. Further, we developed and launched our new brand, a brand that stands for adaptability, innovation and circularity with sustainability in its core. Our focus is now to continue the journey towards our full potential as an independent company.
ANNUAL REPORT WITH BOARD OF DIRECTORS’ REPORT AND FINANCIAL STATEMENTS 8
CEO COMMENTS
the year, by expanding our operations in Finland and entering the Norwegian market. In the integration work, we thoroughly analysed the commercial logic in the respective companies’ Rental Space solution portfolios and optimised our value propositions and our offering. In addition, we reached a milestone in the third quarter, when our total portfolio of rentable square metres ex-ceeded one million. That gives us the largest and most versatile portfolio in the Nordics and one of the leading ones in Europe.
Measures for improved profitability and growth
We improved our commercial competitiveness, organisational efficiency and performance in Business Area Rental Space, and continued our performance uplift programme in Business Area Permanent Space during the year. Early 2019, we launched an Operational Excellence programme with the aim to remove bottle-necks and to improve our overall operational efficiency. This includes initiatives within LEAN production, direct material sourcing, and standardisation of product structures, procurement processes and organisational efficiency. The initiatives delivered improvements in our manufacturing networks as well as in sourcing, with further improvements to be realised in 2020.
We also continued our Group wide programme for Commercial Excellence. The program is built on five pillars – commercial offering optimisation, pricing excellence, sales force effectiveness, sales digital-isation and brand equity growth. An integral part of our commercial offering optimisation is to refine and continuously sharpen our solution portfolio. In Business Area Rental Space, we launched the Adapteo.Hybrid modular system, a new adaptable building solution for the Central European market. The solution combines the advantages of steel and wood in the same con-struction enabling high energy efficiency and offers excellent exterior design with premium indoor climate. In Finland, we ramped up the replacement activities of older buildings systems to strengthen our long-term competitiveness.
Leading the way to a sustainable and circular industry
We all know that the construction and real estate industry pose a large impact on the environment. In contrast to the traditional construction and real estate industry, our buildings are adaptable, accessible and built in wood, and they are being used and reused over time, depending on our customers’ needs. This circular business model, together with our constant focus on resource efficiency and innovation, is paving the way for a new and more sustainable construction and real estate industry, where Adapteo takes the lead in devel-oping the future building solutions for a more adaptable
and sustainable society. In 2020, we will continue to develop our work within sustainability, securing that our strategy is well-integrated in all areas of our operation and that our solutions enable a fossil free future.
Mid-term structural trends support our market
Although we saw a lower market activity in 2019, the needs in the public sector remain and our mid-term view of the favourable market development stays unchanged. An old building stock with substantial renovation needs, urbanisation, demographic changes, growing number of pupils in school and children in day care centres, and a constantly growing elderly popula-tion, are all examples of the primary market drivers that are expected to generate persistent demand for our solutions. Simultaneously, we see a stronger market penetration of prefabricated buildings and adaptable space solutions that we expect to continue and even escalate in the years to come.
Strengthened organisation for continued growth in 2020
Adapteo is a new organisation in its shape, but with a well-established business model and knowledgeable people. In 2019, we strengthened the organisation in various areas and will continue to do so. Attracting talents and experienced co-workers, developing our competences and capabilities, as well as retaining our key employees will be essential to succeed.
When we now put 2019 to the records and enter into a new decade, I look forward to building the industry’s leading company for adaptable buildings, and to put all focus on improving our business and competitiveness, and above all, to deliver best-in-class solutions and services for our customers and their users. I can’t wait to make this happen.
Rest assured that we will not rest until we have succeeded!
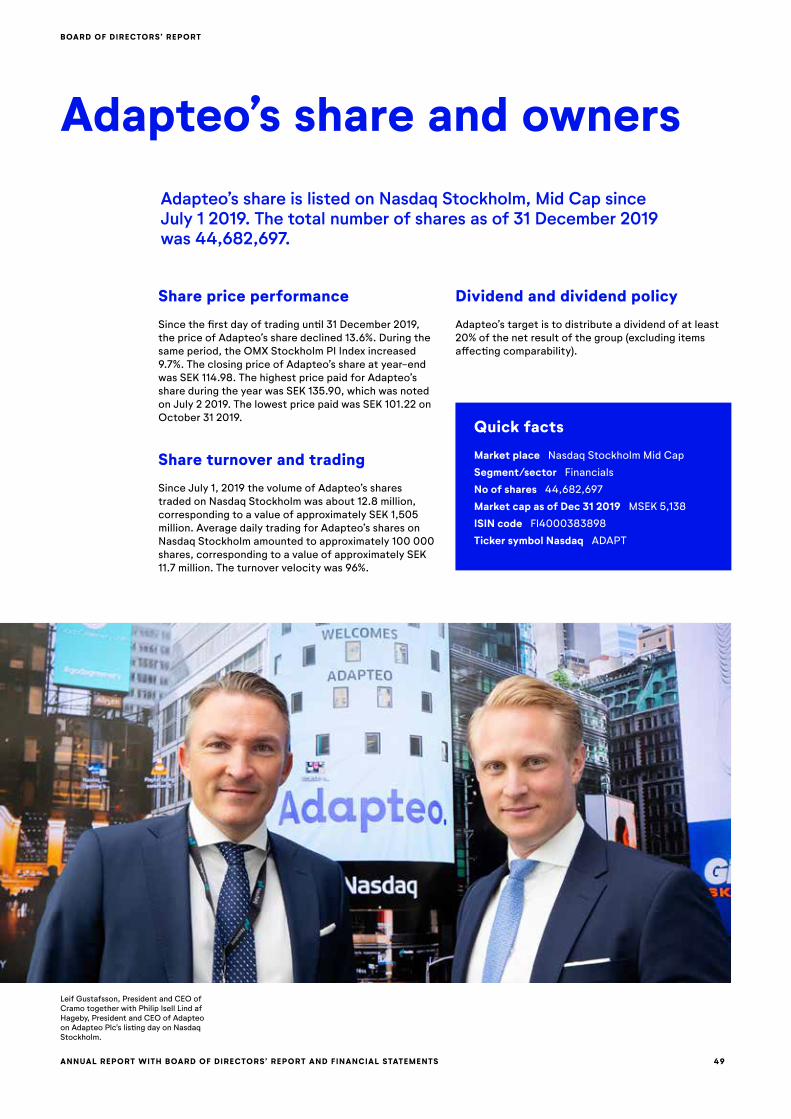
Philip Isell Lind af HagebyPresident and CEO Adapteo Group
ANNUAL REPORT WITH BOARD OF DIRECTORS’ REPORT AND FINANCIAL STATEMENTS 9
BUSINESS STRATEGY
Current activities Entering into the segment elderly care accommo-dation segment
Increased focus on the private sector
Business model expansionAdapteo has limited presence in the sales market outside Sweden and leveraging the existing operating platform is an opportunity to expand and strengthen its position in other countries. Combining the platform of the rental operations with the long-term rental, sales capabilities and resources added by the NMG acquisi-tion, forms the backbone of capturing the opportunity.
Current activities Introducing sales of turn-key solutions in Finland and Norway
Introducing long-term rental in Finland and Norway
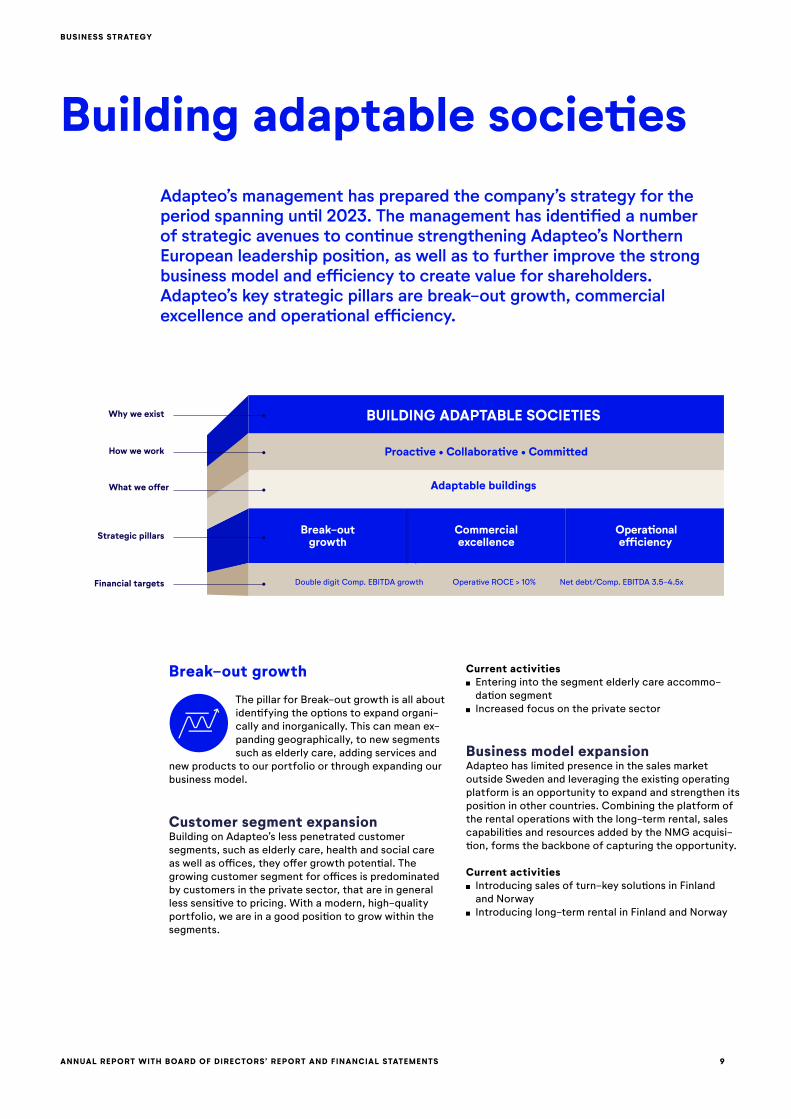
Building adaptable societies
Break-out growth
The pillar for Break-out growth is all about identifying the options to expand organi-cally and inorganically. This can mean ex-panding geographically, to new segments such as elderly care, adding services and
new products to our portfolio or through expanding our business model.
Customer segment expansionBuilding on Adapteo’s less penetrated customer segments, such as elderly care, health and social care as well as offices, they offer growth potential. The growing customer segment for offices is predominated by customers in the private sector, that are in general less sensitive to pricing. With a modern, high-quality portfolio, we are in a good position to grow within the segments.
Adapteo’s management has prepared the company’s strategy for the period spanning until 2023. The management has identified a number of strategic avenues to continue strengthening Adapteo’s Northern European leadership position, as well as to further improve the strong business model and efficiency to create value for shareholders. Adapteo’s key strategic pillars are breakout growth, commercial excellence and operational efficiency.
Commercialexcellence
Opera�onale�ciency
Break-outgrowth
Adaptable buildings
BUILDING ADAPTABLE SOCIETIES
Financial targets
Strategic pillars
How we work
What we o�er
Why we exist
ANNUAL REPORT WITH BOARD OF DIRECTORS’ REPORT AND FINANCIAL STATEMENTS 10
BUSINESS STRATEGY
Offering expansionAdapteo’s strong value chain capabilities combined with extensive market knowledge, is a base for ex-tending the current offering. Continuous development of new product and solutions will underpin the growth towards both existing and new customers and will also support us in maintaining a stable and attractive price development for our solutions.
Current activities Entering into elderly caremarket Introducing the Adapteo.Hybrid solution Project offices
Geographic expansionAdapteo aims to capture the geographical market opportunities by leveraging its existing strongholds and further expanding the operational footprint. In addition, bolt-on acquisitions can be a tool to accelerate the strategy execution.
Current activities Nordic penetration for both Business Areas Successful expansion of Business Area Permanent Space in Finland and Norway
Continued regional expansion in Germany
Value added service expansion Complementing our adaptable building offering with value added products and services such as facility management, janitorial, security and insurance services as well as interior and exterior add-on amenities will provide an attractive additional revenue stream in the long term.
Current activities Facility management Landscaping and playground Service and maintenance
Commercial excellence
The pillar for Commercial excellence focuses on our aim to shift from a sales strategy based on intuition to one based on hard facts. We drive this through immense focus on pricing excellence,
together with ensuring that we enable an efficient sales force with the right tools and frameworks, as well as utilising our strategic marketing capabilities to generate leads and sales.
Offering optimisationOffering a portfolio of complementary solutions that is optimally positioned in the market and addresses the customers’ needs is important to capture value. Adapteo seeks to utilise its knowledge on customer preferences to harmonise its portfolio and offering and will focus its investing activities to the higher quality and more versatile module series with attractive module economics.
Current activities Value proposition clarification for all building systems Offering consolidation and harmonisation Technical characteristics upgrades and enhance-ments for existing building systems
Brand equity growthAdapteo will introduce a unified marketing and brand strategy, including positioning of the brand and the offering. The brands that the acquired NMG used in its operations will be harmonised with those of Adapteo.
Current activities Harmonising the Group’s brand portfolio and structure
Developing a brand platform for increased aware-ness, perception and preference
Improvement of marketing performance in all markets for better lead generation and sales
Pricing excellenceAdapteo will seek to align and optimise the pricing of our module series to create dynamic price positioning and to eliminate overlaps in the offering.
Current activities Mapped overall pricing and harmonised pricing models throughout the organisation
Sales force effectivenessAn important aspect in improving sales force effective-ness is aligning sales processes, to ensure a consistent way of working that puts the customer in focus. Based on the processes, KPIs and a sales steering model are set to drive performance throughout the organisation. Current activities Aligning sales processes with regards to solution design and offer calculation
Ensuring alignment of sales tools and templates across the organisation
Implementing a new KPI structure driving individual and collective sales performance
ANNUAL REPORT WITH BOARD OF DIRECTORS’ REPORT AND FINANCIAL STATEMENTS 11
BUSINESS STRATEGY
Factory and hub efficiencyAdapteo strives to produce the adaptable buildings in a faster, more reliable and sustainable way. In the supply chain, there is a strive to achieve logistic efficiencies and enable seamless delivery of buildings. Gaining material cost savings through more efficient production planning, as well as on maximising the delivery and re-turn margin for rental modules, by focusing on assem-bly and disassembly costs, and subcontractor sourcing.
Current activities Further development of LEAN production processes Implementing standardisation of product structure Replacing parts of the external production with inhouse production
Organisational efficiencyAdapteo are continuously working to unify processes and introduce a common culture to the organisation. This includes creating and implementing a new, com-mon and aligned operating model with clear functions and roles. Additional actions are optimising the sizes of organisations in different countries based on the significance of the business and other key metrics and introducing best practices across the company.
Current activities Implement structures, guidelines and policies to drive efficiency
Strengthening the organisation through attracting and retaining talents
Driving performance management throughout the organisation
Time utilisation optimisationIncreased optimal utilisation rate of the portfolio is a result of a seamless co-operation and strong capabil-ities throughout the value chain and organisation. Key working areas to further improve the utilisation rate include supply chain, sales and operations, product development, solution and product standardisation, production and sourcing as well as data and analytics capabilities.
Current activities Utilising Business Intelligence tools to improve portfolio planning processes
Sales digitalisationDigital tools can be utilised to improve the efficiency in the sales process, as well as improve the customer engagement throughout their buying process. Sales digitalisation as a strategic lever will ensure that the sales organisation keeps driving the industry, at the same time as maximising the revenue potential in the future.
Current activities Implementing future proof digital tools, e.g. 3D vis-ualisation tool of interior and exterior of modules
Driving sales steering and support in a centralised BI solution
Implementing portfolio operations planning tools
Operational efficiency
The pillar for Operational efficiency focuses on finding the ways to cost- efficiency while maintaining high level of quality. Our operating model in each of our Business Units is always a matter of
close attention; from how we can optimise the factory efficiency to improving the sourcing of modules, mate-rials and subcontractors as well as utilising our portfolio in the most optimal way.
Sourcing excellenceCost synergies can be captured, particularly following the NMG acquisition. Improved sourcing efficiency is possible by leveraging the larger scale of the combined operations, by centralising group functions a decrease of indirect costs related to e.g. marketing and IT sys-tems and additional operational efficiency by optimised sourcing of modules.
Current activities Direct material sourcing optimisation Procurement processes improvements
ANNUAL REPORT WITH BOARD OF DIRECTORS’ REPORT AND FINANCIAL STATEMENTS 12
BUSINESS STRATEGY
Financial Targets
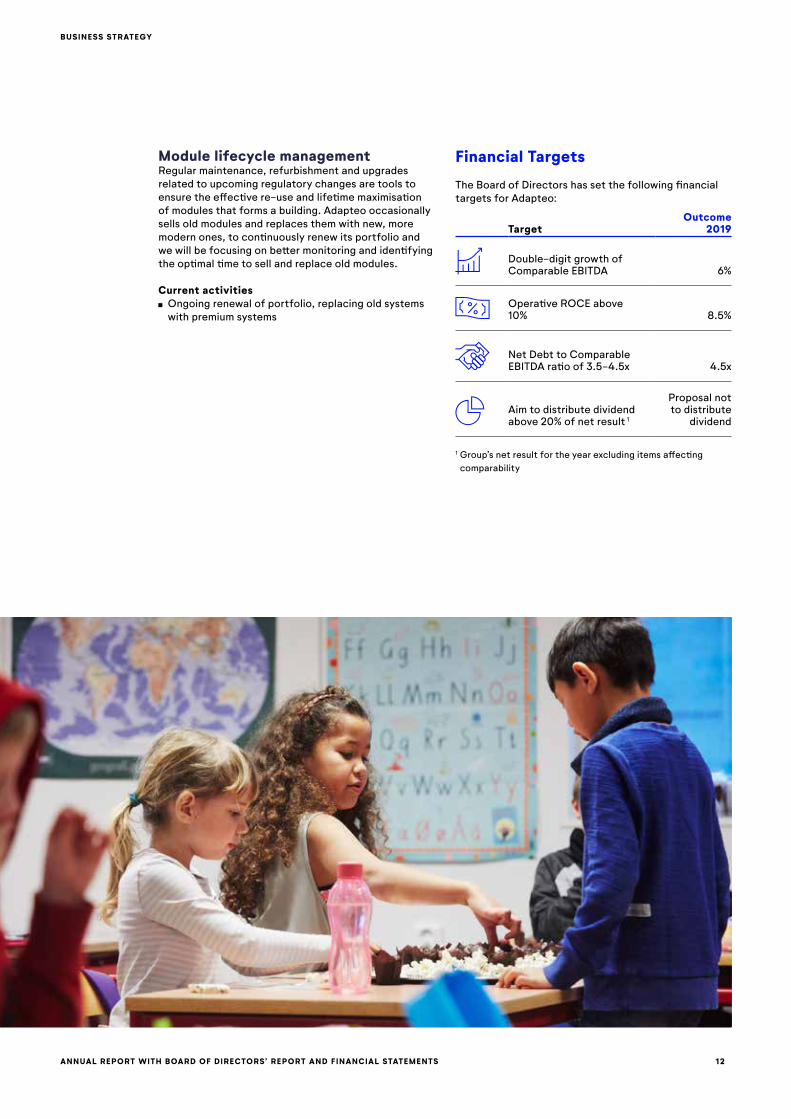
The Board of Directors has set the following financial targets for Adapteo:
TargetOutcome
2019
Double-digit growth of Comparable EBITDA 6%
Operative ROCE above 10% 8.5%
Net Debt to Comparable EBITDA ratio of 3.5-4.5x 4.5x
Aim to distribute dividend above 20% of net result 1
Proposal not to distribute
dividend
1 Group’s net result for the year excluding items affecting comparability
Module lifecycle managementRegular maintenance, refurbishment and upgrades related to upcoming regulatory changes are tools to ensure the effective re-use and lifetime maximisation of modules that forms a building. Adapteo occasionally sells old modules and replaces them with new, more modern ones, to continuously renew its portfolio and we will be focusing on better monitoring and identifying the optimal time to sell and replace old modules.
Current activities Ongoing renewal of portfolio, replacing old systems with premium systems
ANNUAL REPORT WITH BOARD OF DIRECTORS’ REPORT AND FINANCIAL STATEMENTS 13
OUR MARKET
Growing market supported by structural trends
Public sector is the main customers segment and include municipalities, regions, government authori-ties, public institutions and other public sector entities. The high share of public sector customers drives the market’s resilience over time. A large share of both the rental and sales market consists of social infrastructure related customer segments, which are predominated by the public sector. In most cases, public customers have the legal obligation to deliver space to varying needs, such as daycare centres, school and elderly care facilities. Therefore, the market is to a large extent im-pacted by underlying demand drivers, most importantly regional population development and renovation needs, as opposed to the general economic situation.
Market growth, drivers and trends
The market for rental and sales of adaptable buildings has shown strong historic growth. Mid-term, growth of both the rental and sales markets are expected to be supported by structural demand drivers and trends, including: Population growth and urbanisation, Demographic trends as increased number of children in school and daycare centres as well as a growing elderly population, ageing building stock and renovation needs and a higher penetration of adaptable buildings.
Population growth and urbanisationPopulation growth and urbanisation drive regional needs for space in growth centres and net loss areas alike, creating opportunities for adaptable buildings. In growth centres, there is often an urgent need for space. The effects of urbanisation especially concern the providers of daycare centres and school proper-ties, as those moving to cities are often young people or families. In large cities where space can be difficult to acquire, adaptable buildings can be used to handle sudden increases in demand. Alternatively, adapt-able buildings can be used to “buy time” in complex decision-making processes for permanent long-term solutions.
Adapteo’s addressable market consists of rental and sales of adaptable buildings in Sweden, Finland, Denmark, Norway and Germany. Adaptable buildings are prefabricated modular buildings which have the functionality and quality matching onsite buildings. They can be used to serve both shortterm and longterm needs and are offered to several segments including school, daycare centres, offices and other premises in the private and public sector.
On the other hand, flexible solutions are favoured in net loss areas. As it can be difficult for municipalities to predict future building needs and commit to on-site built solutions with long-term obligations, municipali-ties choose temporary rental solutions, as they provide flexibility and limit financial liabilities. Investing in a permanent prefabricated turn-key solution can also be considered a viable option compared to on-site built buildings due to the re-use and re-purpose opportuni-ties for adaptable buildings.
Demographic trends creating need for adaptable buildingsChildren and elderly people are highly represented in the markets that Adapteo operates in. Growing number of children and the rapidly ageing population create significant opportunities for modular space solutions.
The demographic changes in the Nordics have led to a rapid increase of elderly people, at the fastest rate in Europe. An ageing population is resulting in a lasting and somewhat predictable increase in demand for space, providing opportunities for the elderly care market segment.
Generally, the number of children in the Nordics is expected to grow slightly in the future, mainly in Swe-den and Denmark. Municipalities and other public enti-ties have a legal obligation to deliver space for daycare centres and school facilities. Thus, especially in large cities, rapid inflow of children creates urgent need for extra capacity, which favours adaptable building solu-tions with fast and predictable delivery.
ANNUAL REPORT WITH BOARD OF DIRECTORS’ REPORT AND FINANCIAL STATEMENTS 14
OUR MARKET
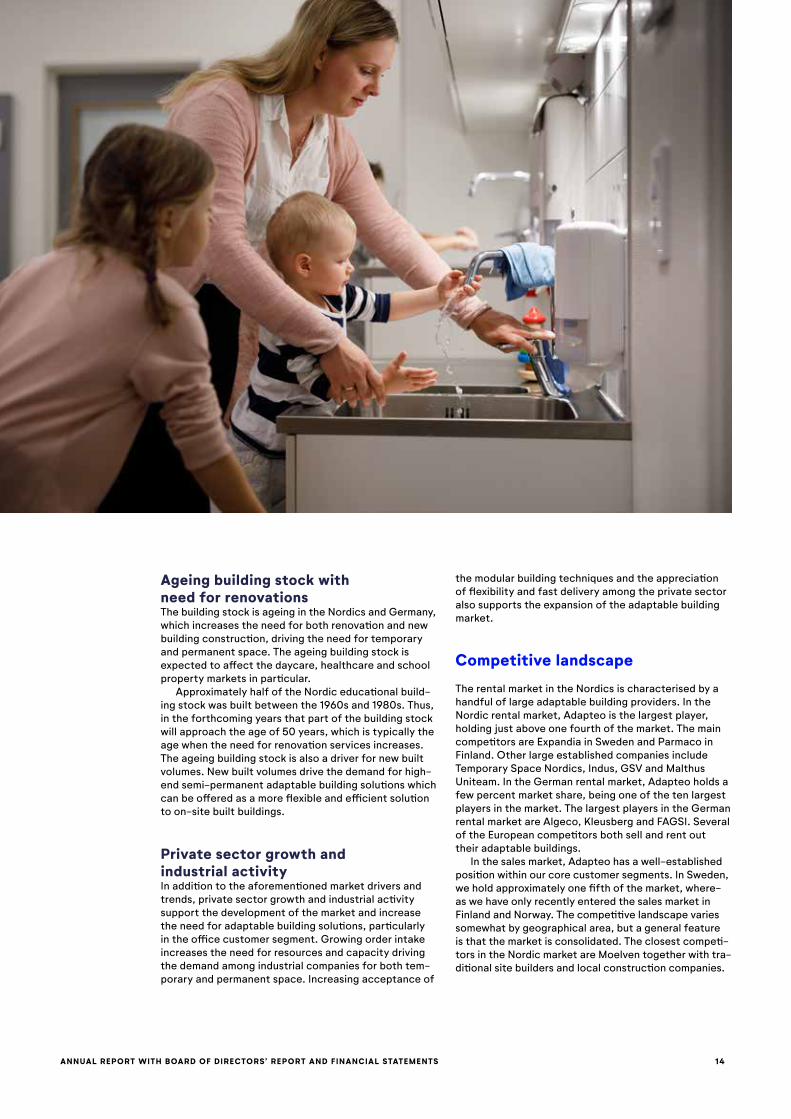
Ageing building stock with need for renovationsThe building stock is ageing in the Nordics and Germany, which increases the need for both renovation and new building construction, driving the need for temporary and permanent space. The ageing building stock is expected to affect the daycare, healthcare and school property markets in particular.
Approximately half of the Nordic educational build-ing stock was built between the 1960s and 1980s. Thus, in the forthcoming years that part of the building stock will approach the age of 50 years, which is typically the age when the need for renovation services increases. The ageing building stock is also a driver for new built volumes. New built volumes drive the demand for high-end semi-permanent adaptable building solutions which can be offered as a more flexible and efficient solution to on-site built buildings.
Private sector growth and industrial activityIn addition to the aforementioned market drivers and trends, private sector growth and industrial activity support the development of the market and increase the need for adaptable building solutions, particularly in the office customer segment. Growing order intake increases the need for resources and capacity driving the demand among industrial companies for both tem-porary and permanent space. Increasing acceptance of
the modular building techniques and the appreciation of flexibility and fast delivery among the private sector also supports the expansion of the adaptable building market.
Competitive landscape
The rental market in the Nordics is characterised by a handful of large adaptable building providers. In the Nordic rental market, Adapteo is the largest player, holding just above one fourth of the market. The main competitors are Expandia in Sweden and Parmaco in Finland. Other large established companies include Temporary Space Nordics, Indus, GSV and Malthus Uniteam. In the German rental market, Adapteo holds a few percent market share, being one of the ten largest players in the market. The largest players in the German rental market are Algeco, Kleusberg and FAGSI. Several of the European competitors both sell and rent out their adaptable buildings.
In the sales market, Adapteo has a well-established position within our core customer segments. In Sweden, we hold approximately one fifth of the market, where-as we have only recently entered the sales market in Finland and Norway. The competitive landscape varies somewhat by geographical area, but a general feature is that the market is consolidated. The closest competi-tors in the Nordic market are Moelven together with tra-ditional site builders and local construction companies.
ANNUAL REPORT WITH BOARD OF DIRECTORS’ REPORT AND FINANCIAL STATEMENTS 15
OUR MARKET
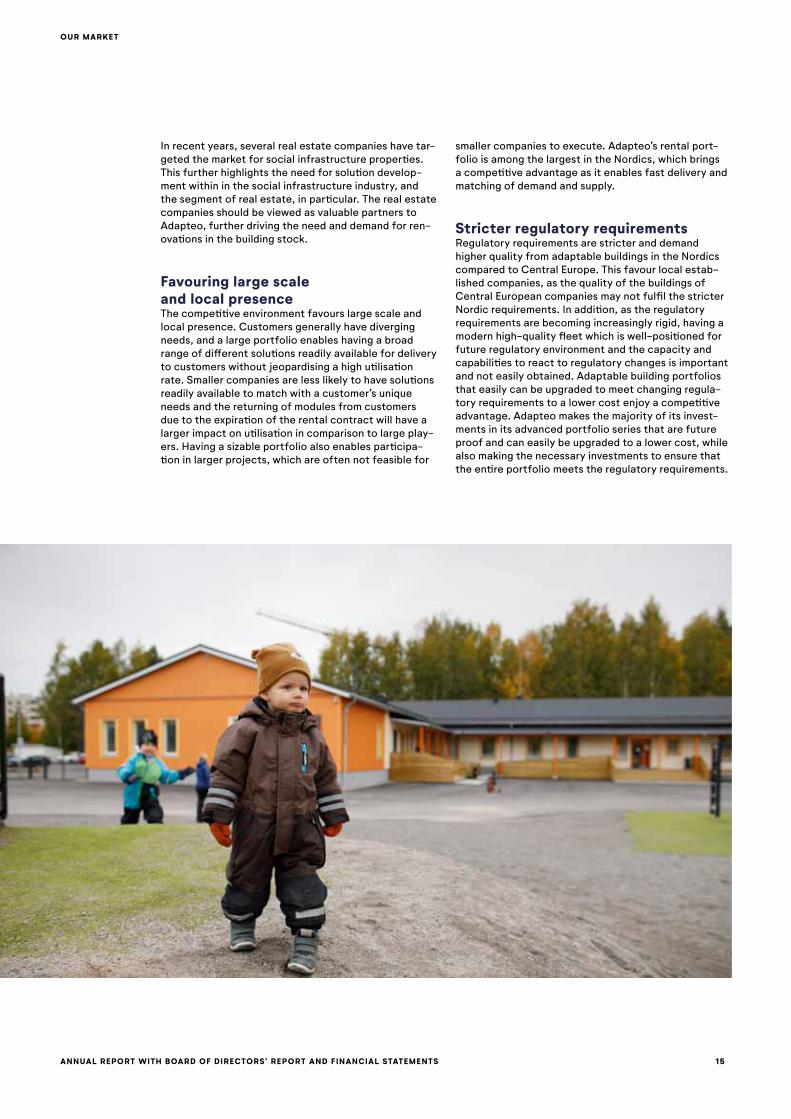
In recent years, several real estate companies have tar-geted the market for social infrastructure properties. This further highlights the need for solution develop-ment within in the social infrastructure industry, and the segment of real estate, in particular. The real estate companies should be viewed as valuable partners to Adapteo, further driving the need and demand for ren-ovations in the building stock.
Favouring large scale and local presenceThe competitive environment favours large scale and local presence. Customers generally have diverging needs, and a large portfolio enables having a broad range of different solutions readily available for delivery to customers without jeopardising a high utilisation rate. Smaller companies are less likely to have solutions readily available to match with a customer’s unique needs and the returning of modules from customers due to the expiration of the rental contract will have a larger impact on utilisation in comparison to large play-ers. Having a sizable portfolio also enables participa-tion in larger projects, which are often not feasible for
smaller companies to execute. Adapteo’s rental port-folio is among the largest in the Nordics, which brings a competitive advantage as it enables fast delivery and matching of demand and supply.
Stricter regulatory requirementsRegulatory requirements are stricter and demand higher quality from adaptable buildings in the Nordics compared to Central Europe. This favour local estab-lished companies, as the quality of the buildings of Central European companies may not fulfil the stricter Nordic requirements. In addition, as the regulatory requirements are becoming increasingly rigid, having a modern high-quality fleet which is well-positioned for future regulatory environment and the capacity and capabilities to react to regulatory changes is important and not easily obtained. Adaptable building portfolios that easily can be upgraded to meet changing regula-tory requirements to a lower cost enjoy a competitive advantage. Adapteo makes the majority of its invest-ments in its advanced portfolio series that are future proof and can easily be upgraded to a lower cost, while also making the necessary investments to ensure that the entire portfolio meets the regulatory requirements.
ANNUAL REPORT WITH BOARD OF DIRECTORS’ REPORT AND FINANCIAL STATEMENTS 16
OUR BUSINESS
Our adaptable buildings are either rented out or sold to primarily public sector customers, such as municipali-ties, but also to private companies, such as manufac-turing companies. Our space solutions are delivered ready-for-use to the customers. We aim to offer cost-efficient solutions, adapted to people’s needs without exploiting limited natural resources or polluting the environment. The quality and technical features of our buildings match site-built solutions and meet the regulatory requirements for permanent space. We also offer facility management services to both our rental and sales customers.
Large and versatile portfolio in the Nordics
Adapteo has the largest portfolio of adaptable build-ings in the Nordic rental market based on the number of square metres. The rental portfolio consists of solutions based on a modular building technique that can be used for multiple purposes as well as buildings specifically designed for a certain use. In the customer segment for schools, the buildings are used mainly as
A leading company for adaptable buildings
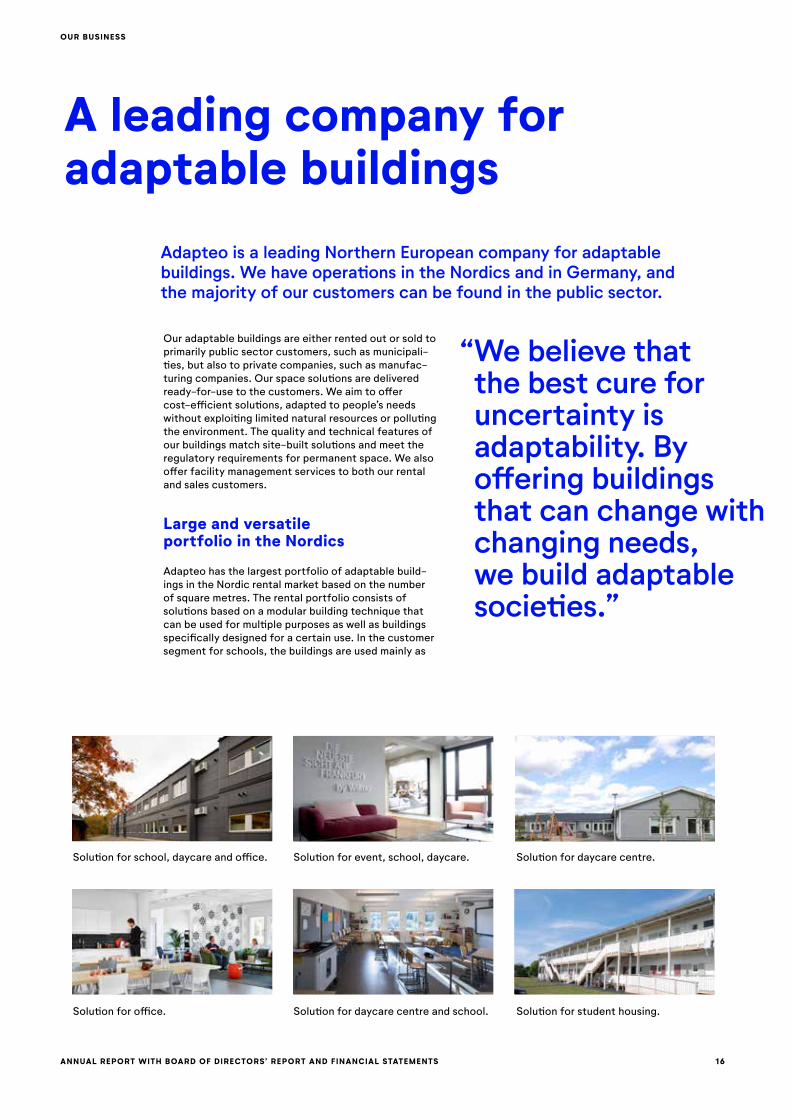
“ We believe that the best cure for uncertainty is adaptability. By offering buildings that can change with changing needs, we build adaptable societies.”
Adapteo is a leading Northern European company for adaptable buildings. We have operations in the Nordics and in Germany, and the majority of our customers can be found in the public sector.
Solution for office.
Solution for school, daycare and office.
Solution for daycare centre and school.
Solution for event, school, daycare.
Solution for student housing.
Solution for daycare centre.
ANNUAL REPORT WITH BOARD OF DIRECTORS’ REPORT AND FINANCIAL STATEMENTS 17
OUR BUSINESS
primary and secondary school buildings as well as other educational buildings, such as universities. Special accommodation buildings are used as e.g. worker accommodation, whereas adaptable buildings within health and social care are mainly used as housing for elderly and disabled persons. Offices form a major part of our private market.
The average age of Adapteo’s portfolio varies between the countries and is approximately about ten years, with the lifetime of a module being up to 30 years. Our adaptable buildings can be used and reused, creating a circular construction industry. Adaptable buildings can be used during several rental rounds and also serve different purposes depending on our cus-tomer’s needs.
Comprehensive offering for various customers
Adapteo offers services and solutions predominantly to municipalities, counties, government authorities, public institutions and other public sector entities. Our private sector customers include for example private compa-nies, renting or leasing adaptable solutions for shorter
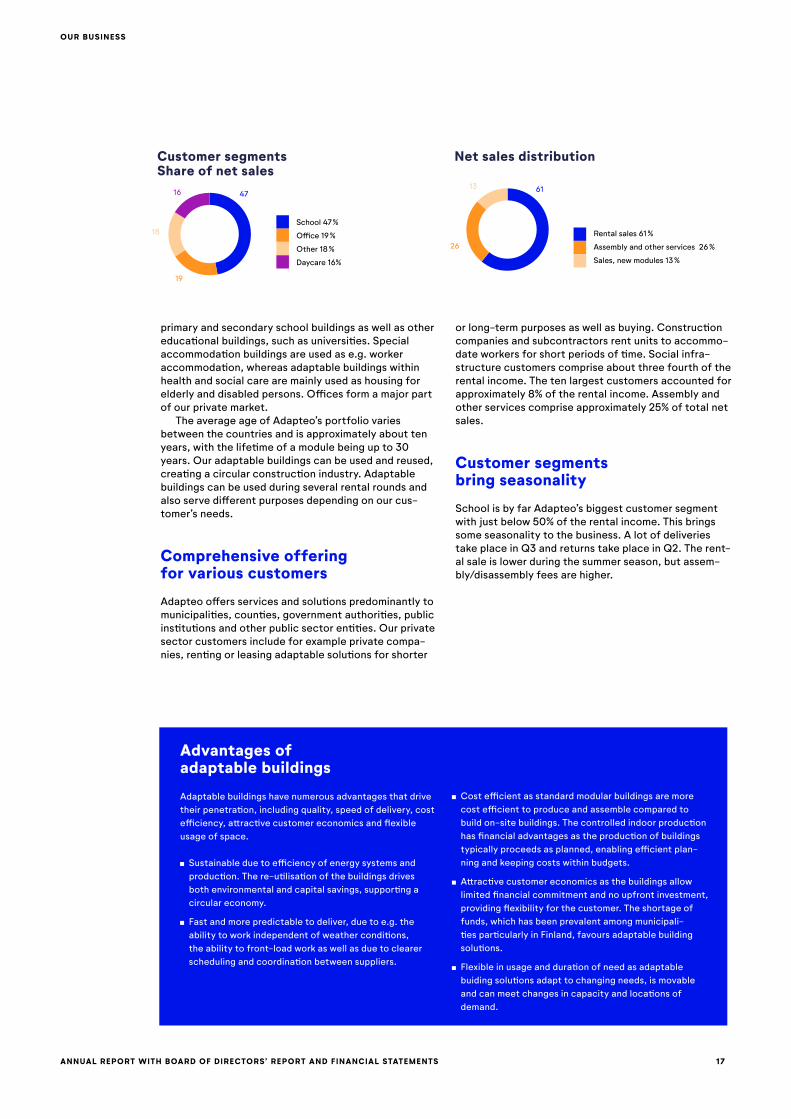
or long-term purposes as well as buying. Construction companies and subcontractors rent units to accommo-date workers for short periods of time. Social infra-structure customers comprise about three fourth of the rental income. The ten largest customers accounted for approximately 8% of the rental income. Assembly and other services comprise approximately 25% of total net sales.
Customer segments bring seasonality
School is by far Adapteo’s biggest customer segment with just below 50% of the rental income. This brings some seasonality to the business. A lot of deliveries take place in Q3 and returns take place in Q2. The rent-al sale is lower during the summer season, but assem-bly/disassembly fees are higher.
Advantages of adaptable buildings
Adaptable buildings have numerous advantages that drive their penetration, including quality, speed of delivery, cost efficiency, attractive customer economics and flexible usage of space. Sustainable due to efficiency of energy systems and
production. The re-utilisation of the buildings drives both environmental and capital savings, supporting a circular economy.
Fast and more predictable to deliver, due to e.g. the ability to work independent of weather conditions, the ability to front-load work as well as due to clearer scheduling and coordination between suppliers.
Cost efficient as standard modular buildings are more cost efficient to produce and assemble compared to build on-site buildings. The controlled indoor production has financial advantages as the production of buildings typically proceeds as planned, enabling efficient plan-ning and keeping costs within budgets.
Attractive customer economics as the buildings allow limited financial commitment and no upfront investment, providing flexibility for the customer. The shortage of funds, which has been prevalent among municipali-ties particularly in Finland, favours adaptable building solutions.
Flexible in usage and duration of need as adaptable buiding solutions adapt to changing needs, is movable and can meet changes in capacity and locations of demand.
4761
19
26
18
1316
Customer segmentsShare of net sales
Net sales distribution
School 47 %
Office 19 %
Other 18 %
Daycare 16%
Rental sales 61 %
Assembly and other services 26 %
Sales, new modules 13 %
ANNUAL REPORT WITH BOARD OF DIRECTORS’ REPORT AND FINANCIAL STATEMENTS 18
OUR BUSINESS
Inhouse manufacturing capabilities coupled with external supplier network
Adapteo has in-house production of rental modules in Sweden, but the manufacturing is mainly outsourced to three suppliers located in Estonia, Poland and the Czech Republic. We manage the key value chain operations inhouse, which improves our capabilities to develop our offering and to better meet the custom-ers’ needs. The inhouse manufacturing capabilities also provide complementary knowhow, which further assists us in developing and designing our solutions, e.g. through smarter as well as more sustainable and cost-efficient materials. For example, we are switch-ing the material in our module covers, which are used during transport and storage, from single-use plastic to recycled plastic.
New adaptable buildings are manufactured based on the management’s forecast on the near-term de-mand or due to a specific customer need. This gives us flexibility with regards to capital expenditures through increasing or decreasing new production if there are changes in demand outlook, which limits our risks and helps maintaining a high utilisation rate in the existing rental portfolio. It also reduces waste, since it allows us to order the right amount of material. By refurbishing insulation waste, we can reuse left-over material from the production. Left-over pieces of insulation are torn apart and can then be reused.
Public tender expertise and long customer relationships
Due to the structure of Adapteo’s customer base, pub-lic procurement processes are essential in Adapteo’s customer acquisition, as the majority of all public contracts are obtained through a public tender process in accordance with applicable laws and regulations in each operating country of Adapteo. The legislation provides the limits within which public sector entities can design the public procurement processes, including with respect to inclusion of qualitative criteria for eval-uation of tenders. The public procurement organisers set the criteria and weighting for each specific criterion based on which the winning service provider is chosen. If several participants meet all other criteria, the price is usually the determining factor.
Many private sector customers also organise tenders for their projects. As private tenders are not regulated by law, good customer relationships and references are essential in winning the deal in such tenders. When renting modules for more permanent solutions, private companies particularly value the quick and efficient delivery and assembly of the buildings. They also value the adaptability of the solution, as it can easily scale up or down depending on the need.
Wide-spread network with hubs enabling fast and efficient rental model
Modular space needs are typically dispersed geo-graphically and to ensure logistical efficiency and a fast delivery time, a broad hub network with optimised locations is important from a competitive perspective. Adapteo has eight hubs and 20 warehouses across the Nordics and Germany, which helps us to efficiently serve our customers. In addition, we have a well-estab-lished supplier network and strong relationships that are important to ensure high quality, fast lead times and cost efficiency. Subcontractors are often used in the sourcing of adaptable buildings and we spend sig-nificant time and investment to build relationships with credible suppliers.
ANNUAL REPORT WITH BOARD OF DIRECTORS’ REPORT AND FINANCIAL STATEMENTS 19
OUR BUSINESS
Design and R&D capabilities, with proven track-record of product innovation
Adapteo continuously design, build and develop our modules to anticipate the future needs of our custom-ers and changes in legislation, regulations, building permits and local permitting in the markets in where we operate. A key element in our design and R&D is circularity, meaning that we improve and develop our processes continuously in order to maximise value and minimise environmental impact. Our inhouse design and R&D functions enable continuous product innovation and improvement. This supports us in making successful material decisions and designing standard modules that are suitable for various end uses and customer needs as well as in securing that the current portfolio is deemed to comply with existing and future building regulations.
Performance 2019
Adapteo’s Net sales in 2019 decreased by 2% to EUR 216.2 (220.6) million, mainly due to a decrease in Exter-nal sales of new modules. In constant currencies, Net sales were unchanged compared to last year. Rental sales increased by 5% in constant currencies. The geo-graphical markets had slightly different developments. In Sweden, the private market remained stable, but the public market activity was lower than usual with the number of new public tenders being historically low. In Finland, the utilisation rate and prices per square meter remained stable, but public market activity for new rentals was lower than usual during the second and fourth quarter of the year. In Denmark, Net sales decreased mainly due to low assembly and disassembly activity during the first half of the year, whereas there was a large delivery and several other projects during 2018. In Germany, Net sales decreased in compari-son with last year despite a strong first quarter with successful BAUMA fair sales. Comparable EBITDA increased by 6% to EUR 88.5 (83.6) million. The Compa-rable EBITDA margin increased to 40.9% (37.9%).
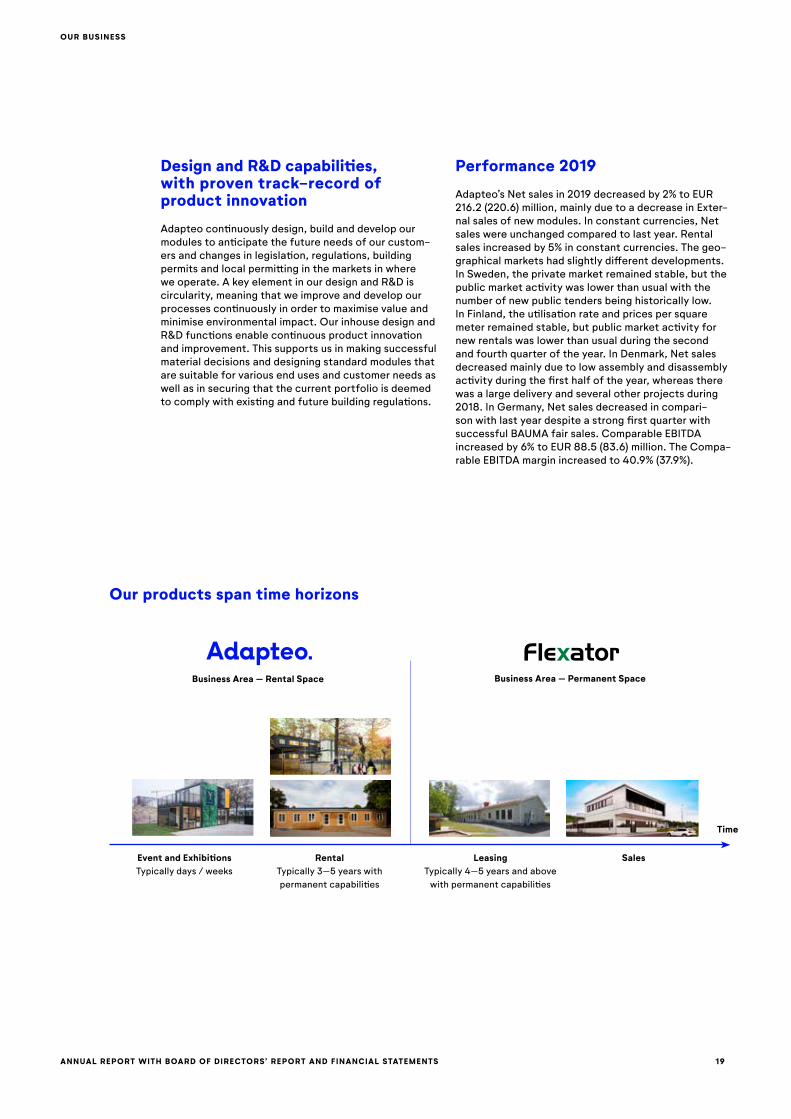
Event and ExhibitionsTypically days / weeks
Business Area – Rental Space Business Area – Permanent Space
RentalTypically 3–5 years withpermanent capabilities
LeasingTypically 4–5 years and above
with permanent capabilities
Sales
Time
Our products span time horizons
ANNUAL REPORT WITH BOARD OF DIRECTORS’ REPORT AND FINANCIAL STATEMENTS
XXXXXXXXXXXX
20
Inspiring and inviting office space with maximum flexibility that enables collaboration and engagement.
ANNUAL REPORT WITH BOARD OF DIRECTORS’ REPORT AND FINANCIAL STATEMENTS 21
OUR BUSINESS
Rental value chain
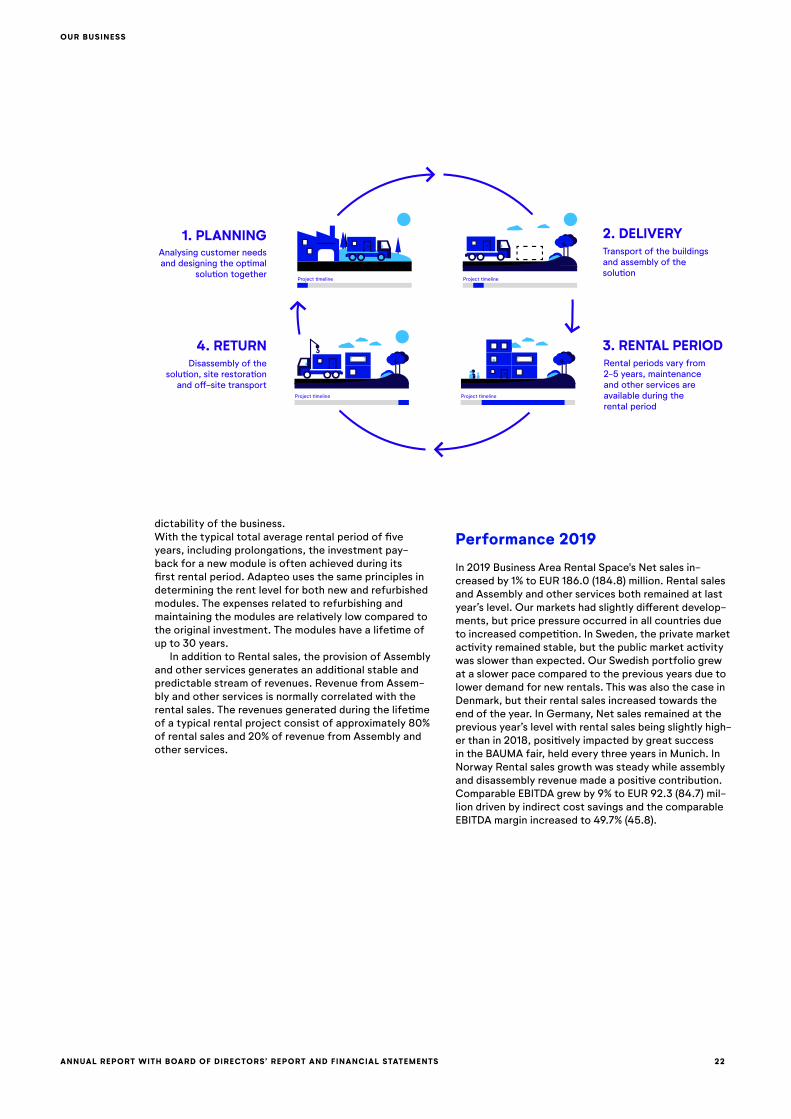
The rental value chain is built around matching cus-tomer needs with the existing rental portfolio and customisation of the modules in local hubs. The value chain and lifecycle of a modular space rental project for public and private sectors differ mainly in how the project begins. Almost all new projects for public sector customers begin with a public tender while in the private sector, the rental project typically begins with a planning phase in which the customer’s needs for an adaptable space is analysed and the optimal solution is designed. Once the rental contract is signed, the project progresses similarly for both public and private sector customers with planning – delivery – rental – return.
Rental commercial model
Our large rental portfolio generates predictable and recurring rental sales streams based on existing agree-ments. Approximately 80% of the contract value is Rental sales and thus recurring. The average utilisation rate for the rental portfolio is approximately 85%. A typical duration of a new rental contract is three years, however 70 to 80% of all new contracts are prolonged one or multiple times and the total average rental period including prolongations has historically been approximately five years. Our rental contracts typically contain a provision requiring customers to inform us three to six months prior to the end of the rental period about its possible prolonging, which improves the pre-
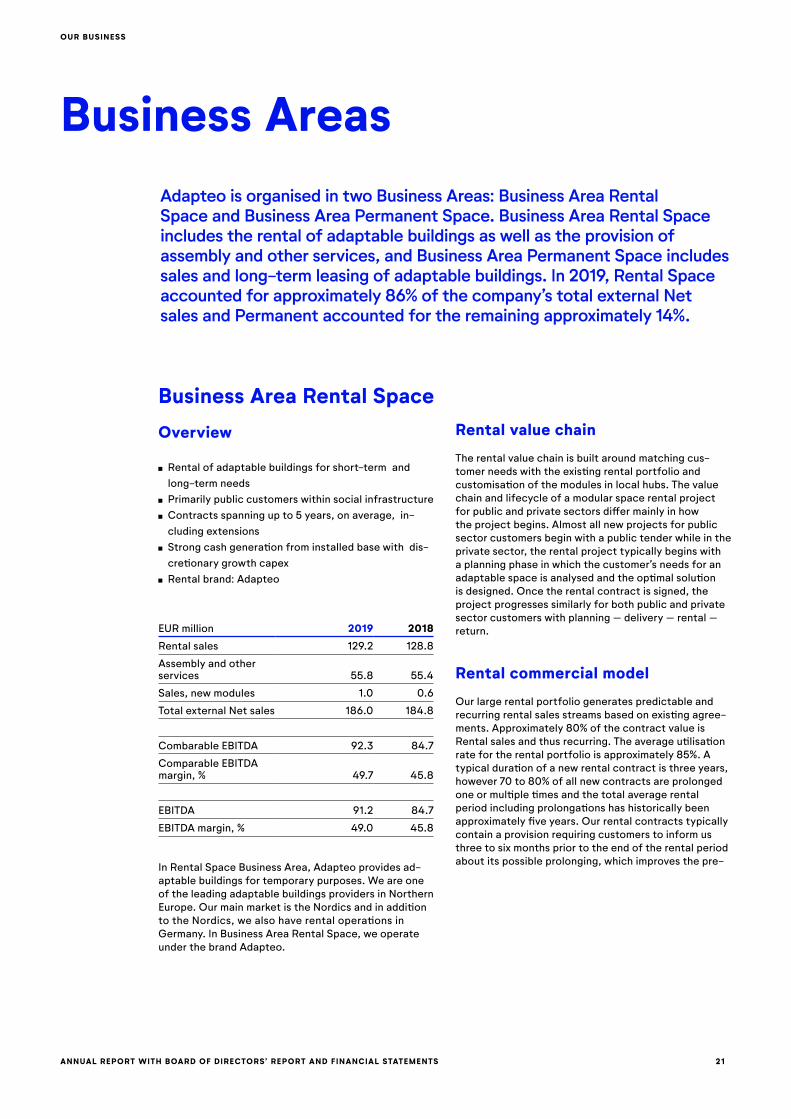
Business Area Rental Space
Overview
Rental of adaptable buildings for short-term and long-term needs
Primarily public customers within social infrastructure Contracts spanning up to 5 years, on average, in-cluding extensions
Strong cash generation from installed base with dis-cretionary growth capex
Rental brand: Adapteo
EUR million 2019 2018
Rental sales 129.2 128.8
Assembly and other services 55.8 55.4
Sales, new modules 1.0 0.6
Total external Net sales 186.0 184.8
Combarable EBITDA 92.3 84.7
Comparable EBITDA margin, % 49.7 45.8
EBITDA 91.2 84.7
EBITDA margin, % 49.0 45.8
In Rental Space Business Area, Adapteo provides ad-aptable buildings for temporary purposes. We are one of the leading adaptable buildings providers in Northern Europe. Our main market is the Nordics and in addition to the Nordics, we also have rental operations in Germany. In Business Area Rental Space, we operate under the brand Adapteo.
Business AreasAdapteo is organised in two Business Areas: Business Area Rental Space and Business Area Permanent Space. Business Area Rental Space includes the rental of adaptable buildings as well as the provision of assembly and other services, and Business Area Permanent Space includes sales and longterm leasing of adaptable buildings. In 2019, Rental Space accounted for approximately 86% of the company’s total external Net sales and Permanent accounted for the remaining approximately 14%.
ANNUAL REPORT WITH BOARD OF DIRECTORS’ REPORT AND FINANCIAL STATEMENTS 22
OUR BUSINESS
Performance 2019
In 2019 Business Area Rental Space's Net sales in-creased by 1% to EUR 186.0 (184.8) million. Rental sales and Assembly and other services both remained at last year’s level. Our markets had slightly different develop-ments, but price pressure occurred in all countries due to increased competition. In Sweden, the private market activity remained stable, but the public market activity was slower than expected. Our Swedish portfolio grew at a slower pace compared to the previous years due to lower demand for new rentals. This was also the case in Denmark, but their rental sales increased towards the end of the year. In Germany, Net sales remained at the previous year’s level with rental sales being slightly high-er than in 2018, positively impacted by great success in the BAUMA fair, held every three years in Munich. In Norway Rental sales growth was steady while assembly and disassembly revenue made a positive contribution. Comparable EBITDA grew by 9% to EUR 92.3 (84.7) mil-lion driven by indirect cost savings and the comparable EBITDA margin increased to 49.7% (45.8).
dictability of the business. With the typical total average rental period of five years, including prolongations, the investment pay-back for a new module is often achieved during its first rental period. Adapteo uses the same principles in determining the rent level for both new and refurbished modules. The expenses related to refurbishing and maintaining the modules are relatively low compared to the original investment. The modules have a lifetime of up to 30 years.
In addition to Rental sales, the provision of Assembly and other services generates an additional stable and predictable stream of revenues. Revenue from Assem-bly and other services is normally correlated with the rental sales. The revenues generated during the lifetime of a typical rental project consist of approximately 80% of rental sales and 20% of revenue from Assembly and other services.
Project �meline Project �meline
Project �meline
2. DELIVERY
3. RENTAL PERIOD
Transport of the buildings and assembly of the solu�on
Analysing customer needs and designing the op�mal
solu�on together
1. PLANNING
4. RETURNDisassembly of the
solu�on, site restora�on and o�-site transport
Rental periods vary from 2-5 years, maintenance and other services are available during the rental period
Project �meline
ANNUAL REPORT WITH BOARD OF DIRECTORS’ REPORT AND FINANCIAL STATEMENTS 23
OUR BUSINESS
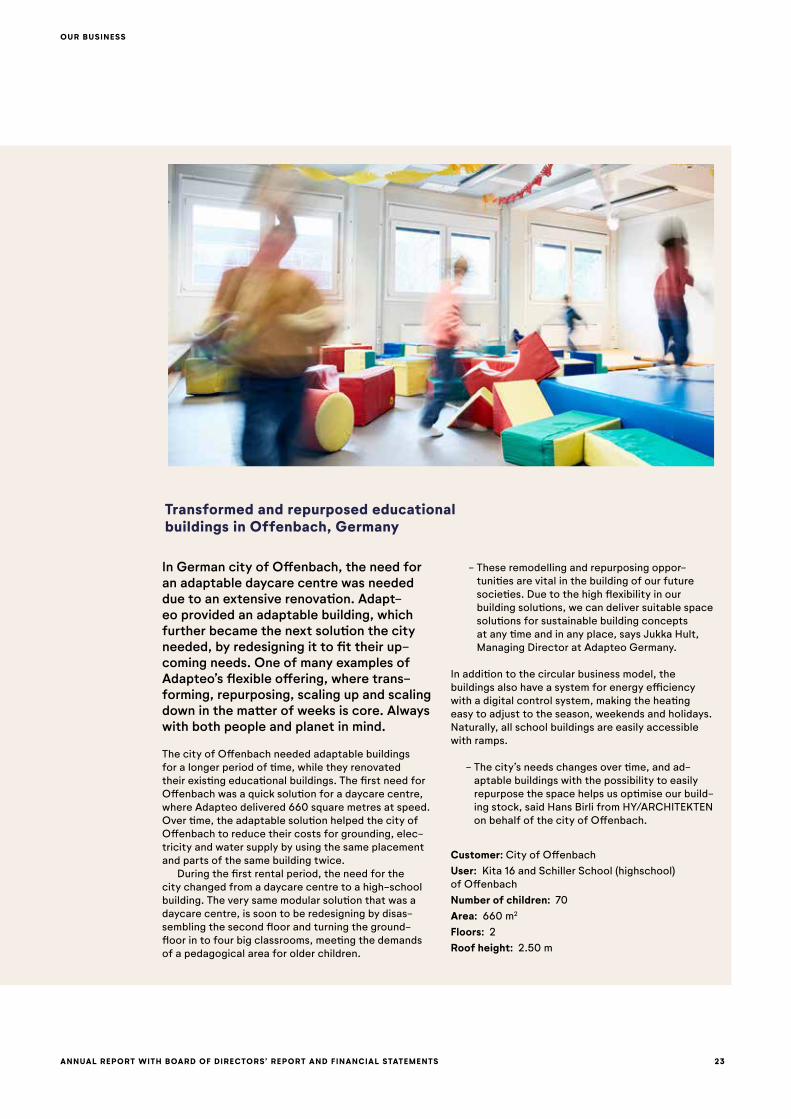
Transformed and repurposed educational buildings in Offenbach, Germany
In German city of Offenbach, the need for an adaptable daycare centre was needed due to an extensive renovation. Adapteo provided an adaptable building, which further became the next solution the city needed, by redesigning it to fit their upcoming needs. One of many examples of Adapteo’s flexible offering, where transforming, repurposing, scaling up and scaling down in the matter of weeks is core. Always with both people and planet in mind.
The city of Offenbach needed adaptable buildings for a longer period of time, while they renovated their existing educational buildings. The first need for Offenbach was a quick solution for a daycare centre, where Adapteo delivered 660 square metres at speed. Over time, the adaptable solution helped the city of Offenbach to reduce their costs for grounding, elec-tricity and water supply by using the same placement and parts of the same building twice.
During the first rental period, the need for the city changed from a daycare centre to a high-school building. The very same modular solution that was a daycare centre, is soon to be redesigning by disas-sembling the second floor and turning the ground-floor in to four big classrooms, meeting the demands of a pedagogical area for older children.
- These remodelling and repurposing oppor-tunities are vital in the building of our future societies. Due to the high flexibility in our building solutions, we can deliver suitable space solutions for sustainable building concepts at any time and in any place, says Jukka Hult, Managing Director at Adapteo Germany.
In addition to the circular business model, the buildings also have a system for energy efficiency with a digital control system, making the heating easy to adjust to the season, weekends and holidays. Naturally, all school buildings are easily accessible with ramps.
- The city’s needs changes over time, and ad-aptable buildings with the possibility to easily repurpose the space helps us optimise our build-ing stock, said Hans Birli from HY/ARCHITEKTEN on behalf of the city of Offenbach.
Customer: City of OffenbachUser: Kita 16 and Schiller School (highschool) of OffenbachNumber of children: 70Area: 660 m2
Floors: 2Roof height: 2.50 m
ANNUAL REPORT WITH BOARD OF DIRECTORS’ REPORT AND FINANCIAL STATEMENTS 24
OUR BUSINESS
Sales offering
Adapteo’s turn-key solutions can be considered by cus-tomers as substitutes for buildings constructed by tra-ditional building contractors which are manufactured in controlled indoor circumstances with a short delivery time. Our buildings in this business area resemble permanent buildings in their characteristics and comply with the permanent building requirements. Customised adaptable buildings are designed and planned based on the specific needs of the customers. Flexator’s turn-key buildings are readily prepared standard buildings built with a modular technique for various uses in particular for schools, daycare centres, offices and housing.
Long-term leasing
As an alternative to buying, we offer the possibility to lease the buildings which usually includes the oppor-tunity for the customer to buy the building once the leasing agreement expires. Most of the customers using this possibility are Swedish municipalities using the leased buildings for schools or daycare centres. The leasing fee is typically paid yearly in advance and the contract period is usually four to five years with the possibility to extend. If the customer does not buy the building once the leasing agreement expires, the mod-ules are returned to us and we can either sell or lease them to other customers.
Performance 2019
Business Area Permanent Space's external Net sales in 2019 amounted to EUR 30.3 (35.8) million, a decrease of 15%. The core segments school and daycare had a positive impact on external sales. External sales were underpinned by the first three building deliveries to Finland and a first building delivered to Norway. Both external and internal sales declined due to the Gråbo factory’s transition to produce C90 rental modules. In the second half of the year, internal sales increased compared to the second half of 2018, due to higher demand from Rental Space in Finland. Comparable EBITDA decreased to EUR 1.4 (4.0) million, representing 4.7% (11.2) of External net sales.
Overview
Tailor-made pre-fabricated solutions for sale or long-term leasing
Focus on social infrastructure sector customer segment
Turn-key solutions with controlled high quality industrial manufacturing
Comply with permanent building requirements Brand Flexator
Permanent Space
EUR million 2019 2018
Rental sales 3.5 –
Sales new modules 26.7 35.8
External Net sales 30.3 35.8
Inter-segment sales 22.2 24.8
Combarable EBITDA 1.4 4.0
Comparable EBITDA margin, % 4.7 11.2
EBITDA 0.8 4.0
In the Business Area Permanent Space, Adapteo pro-vides mainly tailor-made pre-fabricated buildings for sale or long-term leasing to public and private sector customers. In addition to our main market Sweden, we have recently entered the Finnish and Norwegian sales and long-term leasing market. Adapteo entered the modular space solutions sales market through the Nor-dic Modular Group Acquisition in 2018. In the Business Area Permanent Space, we operate under the brand Flexator.
Sales value chain
The sales value chain resembles the normal construc-tion value chain with the exception that the sourcing and building is completed before transportation. The delivery time varies from four to nine months from the order to the delivery to the customer from Flexator’s in-house production facilities. Once the project is completed, the customer owns the building, except for in long-term leasing, where Adapteo owns the build-ing. We also offer additional maintenance services to our customers in Business Area Permanent Space. The warranty period is based on local market standards in the construction industry.
Business Area Permanent Space
ANNUAL REPORT WITH BOARD OF DIRECTORS’ REPORT AND FINANCIAL STATEMENTS 25
OUR BUSINESS
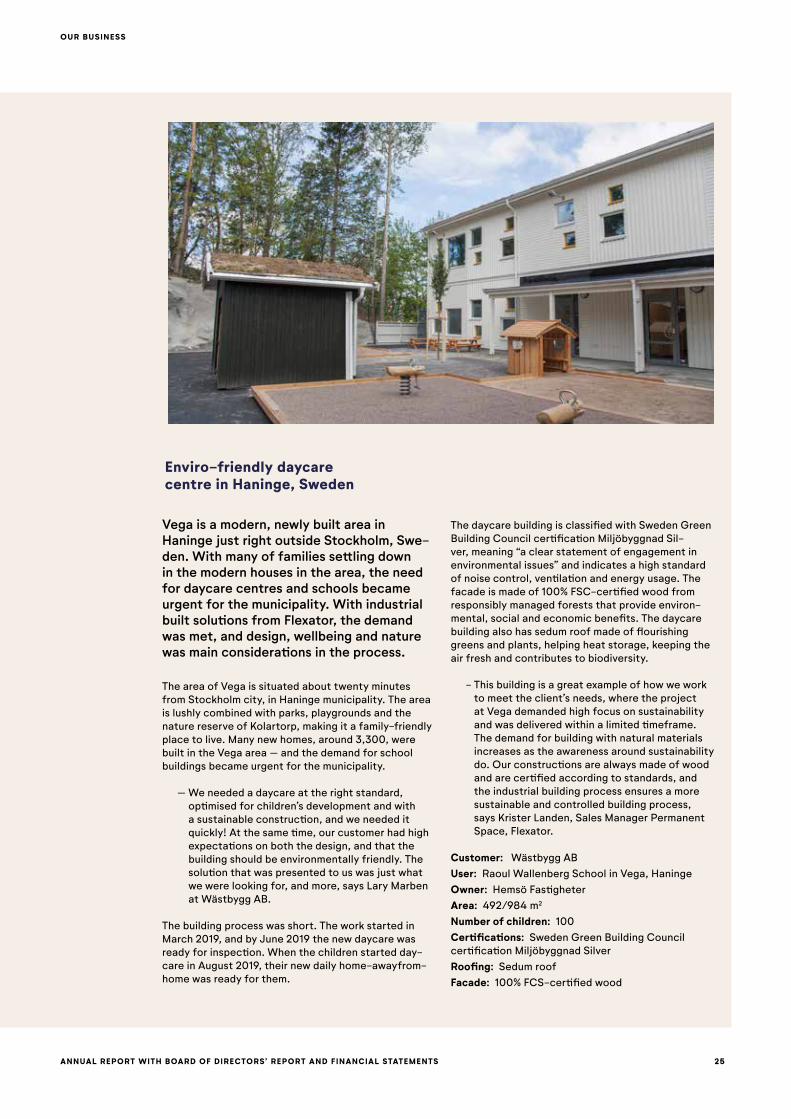
Enviro-friendly daycare centre in Haninge, Sweden
Vega is a modern, newly built area in Haninge just right outside Stockholm, Sweden. With many of families settling down in the modern houses in the area, the need for daycare centres and schools became urgent for the municipality. With industrial built solutions from Flexator, the demand was met, and design, wellbeing and nature was main considerations in the process.
The area of Vega is situated about twenty minutes from Stockholm city, in Haninge municipality. The area is lushly combined with parks, playgrounds and the nature reserve of Kolartorp, making it a family-friendly place to live. Many new homes, around 3,300, were built in the Vega area – and the demand for school buildings became urgent for the municipality.
– We needed a daycare at the right standard, optimised for children’s development and with a sustainable construction, and we needed it quickly! At the same time, our customer had high expectations on both the design, and that the building should be environmentally friendly. The solution that was presented to us was just what we were looking for, and more, says Lary Marben at Wästbygg AB.
The building process was short. The work started in March 2019, and by June 2019 the new daycare was ready for inspection. When the children started day-care in August 2019, their new daily home-awayfrom-home was ready for them.
The daycare building is classified with Sweden Green Building Council certification Miljöbyggnad Sil-ver, meaning “a clear statement of engagement in environmental issues” and indicates a high standard of noise control, ventilation and energy usage. The facade is made of 100% FSC-certified wood from responsibly managed forests that provide environ-mental, social and economic benefits. The daycare building also has sedum roof made of flourishing greens and plants, helping heat storage, keeping the air fresh and contributes to biodiversity.
- This building is a great example of how we work
to meet the client’s needs, where the project at Vega demanded high focus on sustainability and was delivered within a limited timeframe. The demand for building with natural materials increases as the awareness around sustainability do. Our constructions are always made of wood and are certified according to standards, and the industrial building process ensures a more sustainable and controlled building process, says Krister Landen, Sales Manager Permanent Space, Flexator.
Customer: Wästbygg ABUser: Raoul Wallenberg School in Vega, HaningeOwner: Hemsö FastigheterArea: 492/984 m2
Number of children: 100Certifications: Sweden Green Building Council certification Miljöbyggnad SilverRoofing: Sedum roofFacade: 100% FCS-certified wood
ANNUAL REPORT WITH BOARD OF DIRECTORS’ REPORT AND FINANCIAL STATEMENTS
XXXXXXXXXXXX
26
BOARD OF DIRECTORS’ REPORT AND FINANCIAL STATEMENTS
ANNUAL REPORT WITH BOARD OF DIRECTORS’ REPORT AND FINANCIAL STATEMENTS 27
BOARD OF DIRECTORS’ REPORT
Business Area Permanent Space includes sales and long-term leasing of adaptable buildings.
Adapteo is a new brand with over 30 years of ex-perience, born from the acquisition of Nordic Modular Group and the demerger from Cramo. Market offers comprise premium modular space solutions to schools, day care centres, offices, accommodation and events for temporary and permanent needs. In 2019, Adapteo’s pro forma net sales were EUR 216 million. Pro forma net sales include the modular space business of Cramo Plc and acquired Nordic Modular Group’s net sales for the full year.
Adapteo is listed on Nasdaq Stockholm with the ticker ADAPT since 1 July 2019.
Employees and recruitment
At the end of 2019 the number of employees was 376 (406) divided equally between Business Area Rent-al Space and Business Area Permanent Space. The geographical distribution of employees across Adapteo Group was: Sweden 69%, Finland 12%, Germany 10%, Denmark 7%, and Norway 2%.
Adapteo is dependent on engaged staff with the right skillset who share the Group’s values:
Proactive in everything we do and striving to exceed our customers’ expectations.
Collaborative by sharing expertise and strengthening our ways of working internally, making us more effec-tive and efficient.
Committed to Adapteo’s purpose of building ad-aptable societies and taking responsibility for our individual role in it.
To attract, develop, and retain talent is a key success factor of Adapteo and as the company is operating in a highly competitive market for skilled staff, where the importance of having an attractive employer brand and employee offering is high.
In 2019, Adapteo launched an employee engagement survey, which will be conducted on an annual basis, in order to monitor e. g. how the cultural transformation is progressing. The survey also measures the employees’ engagement as well as a Net Promotor Score. Engage-ment is measured through the Engagement Index (EI), with an aggregated score for the group of 76 compared to a benchmark of 78.
BOARD OF DIRECTORS’ REPORT
The following financial information is presented on a pro forma basis unless otherwise indicated.
Significant events in 2019
On 17 June 2019, an Extraordinary Annual Meeting of Cramo Plc decided to separate and distribute its Cramo Adapteo business area to its shareholders through a partial demerger and to list Adapteo on Nasdaq Stockholm. Cramo shareholders received one Adapteo share for each of their Cramo shares. Adapteo Plc was formed as a result of the demerger from Cramo Plc completed on 30 June 2019. The first day of trading in Adapteo was 1 July 2019.
During 2018 and 2019, the majority of the functions and processes created to turn Adapteo into an inde-pendent company were gradually established.
Presentation of financial information
The financial information in this Board of Directors Report has been presented on a pro forma basis unless otherwise indicated. Pro forma financial information has been presented for the years 2019 and 2018 to improve the comparability of financial information and it illustrates the impacts of the Nordic Modular Group (NMG) acquisition completed on 31 October 2018, the demerger completed on 30 June 2019 and the subse-quent refinancing as if these transactions had been completed on 1 January 2018.
Operations
Adapteo is a leading Northern European company for adaptable buildings. The Group has two primary business areas: Business Area Rental Space and Busi-ness Area Permanent Space. It has operations in five geographical areas: Sweden, Finland, Norway, Denmark and Germany.
Business Area Rental Space includes the rental of modular space solutions as well as the provision of assembly and other services.
ANNUAL REPORT WITH BOARD OF DIRECTORS’ REPORT AND FINANCIAL STATEMENTS 28
BOARD OF DIRECTORS’ REPORT
Business Area Rental SpaceBusiness Area Rental Space's net sales increased by 1% to EUR 186.0 (184.8) million. Rental sales and Assembly and other services both remained at last year’s level. Utilisation rate decreased to 84% compared to 85% the previous year as a result of a high number of returns and due to high capital expenditure on C90 modules in late 2019. Price pressure has increased in all countries due to increased competition.
Comparable EBITDA grew by 9% to EUR 92.3 (84.7) million driven by indirect cost savings and sales of rental modules and the comparable EBITDA margin increased to 49.7% (45.8%). EBITDA amounted to EUR 91.2 (84.7) million. Items affecting comparability includ-ed costs related to restructuring of EUR 1.2 million.
Business Area Permanent SpaceBusiness Area Permanent Space's external net sales amounted to EUR 30.3 (35.8) million, showing a de-crease of -15%. The core segments School and Day Care had a positive impact on external sales
Comparable EBITDA decreased to EUR 1.4 (4.0) million, representing 4.7% (11.2%) of external net sales. Profitability was negatively affected by production lines being in transition. The Anneberg factory is executing an efficiency programme in order to improve material flow and remove bottlenecks in production. EBITDA amounted to EUR 0.8 (4.0) million. Items affecting comparability included costs related to restructuring of EUR 0.6 million.
R&D
Adapteo continuously design, build and develop mod-ules to anticipate the future needs of customers and changes in legislation, regulations, building permits and local permitting. A key element in design and R&D is circularity, meaning that the company improves and de-velops its processes continuously in order to maximise value and minimise environmental impact.
R&D highlights in 2019 Adapteo comprise the new
Eldery care module M3 in Denmark,
Entrance module E for preschools in Finland,
Modules series Hybrid in Germany, as well as
Upgrading of Kubik to new Swedish requirements and optimised layout for preschools.
R&D costs are treated as operating expenses and not capitalised.
Seasonality
Rental sales is very evenly distributed over the year’s quarters and thus also the Group’s total net sales. As-sembly and other services peak in Q3 whereas sales of new modules peaks in Q2.
Net sales and results of operations
Adapteo’s net sales in 2019 (pro forma 2018 compar-isons) decreased by 2% to EUR 216.2 (220.6 Jan-Dec 2018) million, mainly due to a decrease in external sales of new modules. In constant currencies, net sales were unchanged compared to last year. Rental sales increased by 5% in constant currencies.
In Sweden, the private market remained stable, but the public market activity was lower than usual with the number of new public tenders being historically low. In Finland, the utilisation rate and prices per square meter remained stable, but public market activity for new rentals was lower than usual during the second and fourth quarter of the year. In Denmark, net sales decreased mainly due to low assembly and disassembly activity during the first half of the year, whereas there was a large delivery and several other projects during 2018. In Germany, net sales decreased in comparison with last year despite a strong first quarter with suc-cessful BAUMA fair sales.
Utilisation rate of the total fleet was 84% (85%) and average rent per square meter declined from EUR 163 in the previous year to EUR 159.
Adapteo’s comparable EBITDA increased by 6% to EUR 88.5 (83.6) million. The comparable EBITDA margin increased to 40.9% (37.9%).
Depreciation, amortisation and impairment on prop-erty, plant and equipment (PPE) and intangibles totalled EUR -54.0 (-35.8) million. The increase was due to a EUR -9.8 million write-down of old modules to better reflect current market demand and the acquisition of NMG with a direct impact to fleet size growth. The adoption of the new leasing standard IFRS 16 on 1 Janu-ary 2019 increased depreciations by EUR 4.1 million.Operating profit (EBIT) amounted to EUR 22.1 (42.6) million. Operating profit included items affecting comparability of EUR 12.4 (5.2) million. EUR 8.1 mil-lion were related to the costs of the public listing of Adapteo, EUR 2.1 million to the restructuring related to the NMG, and EUR 2.3 million were expenses related to integration of NMG. During the comparison period, items affecting comparability included costs regarding preparations for the public listing of Adapteo of EUR 1.4 million and NMG acquisition related expenses of EUR 3.8 million.
Net financial expenses were EUR -7.6 (-7.4) million as a result of new refinancing arrangements and the NMG acquisition. Adapteo refinanced all the debts trans-ferred in the demerger with a new term loan of EUR 400 million drawn on 1 July 2019. NMG was consolidat-ed from 1 November 2018.
January-December profit before taxes totalled EUR 14.6 (35.1) million and profit for the period was EUR 8.6 (28.3) million. Earnings per share was EUR 0.19 (0.63).
The adoption of the new leasing standard IFRS 16 on 1 January 2019 had a positive effect of EUR 4.1 million on comparable EBITDA and increased net debt by EUR 13.7 million.
ANNUAL REPORT WITH BOARD OF DIRECTORS’ REPORT AND FINANCIAL STATEMENTS 29
BOARD OF DIRECTORS’ REPORT
Dividend
Adapteo Plc is a well-capitalised company with a good cash position. A good cash position is important in con-texts including the company being able to demonstrate long term financial sustainability to customers, and to be able to make investments in future growth. The preservation of cash and financial stability are areas of extra into focus during early 2020 and the uncertainty to all business due to the Covid-19 pandemic. The Board of Directors thus proposes to the 2020 AGM that no dividend be paid in 2020.
Proposed appropriation of earnings
Distributable funds of the parent company at 31 December 2019:
Reserve for invested unrestricted equity 67,799Retained earnings 0Profit for the period -1,699Distributable equity 66,101
The Board of Directors proposes to the AGM that the loss for the financial period 2019 is added to retained earnings.
Significant events after the end of the fiscal year
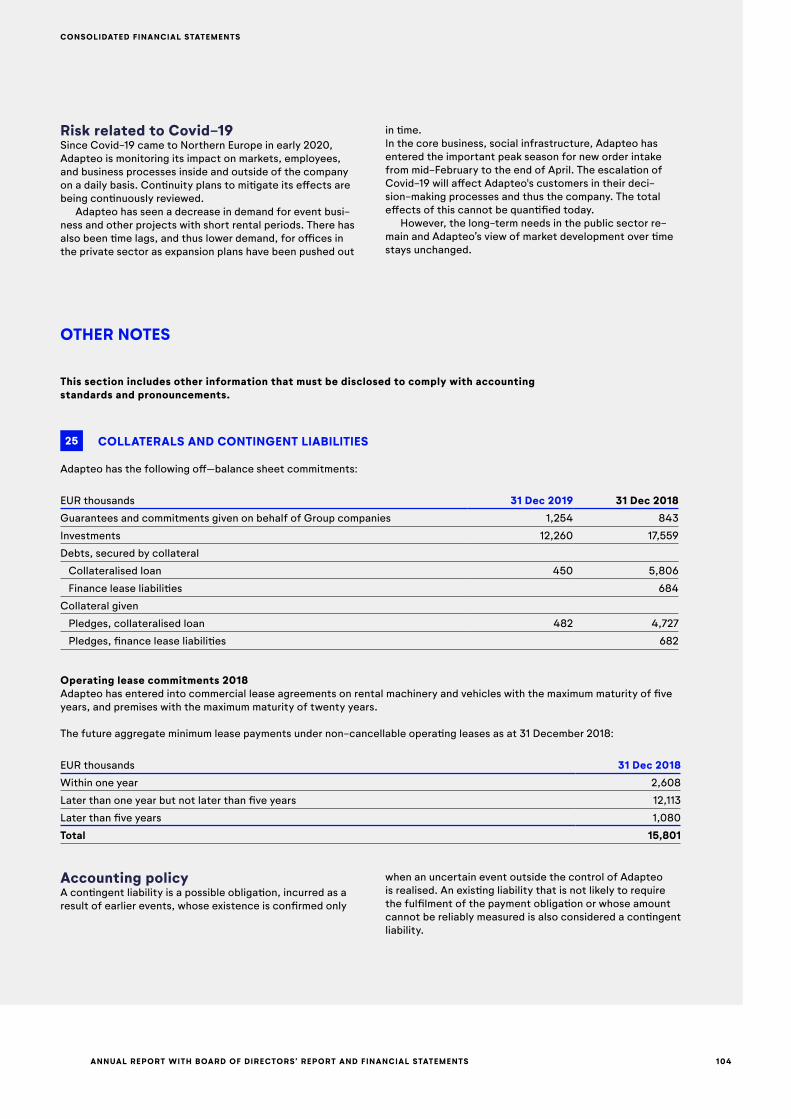
Since Covid-19 came to Northern Europe in early 2020, Adapteo is monitoring its impact on markets, employ-ees, and business processes inside and outside of the company on a daily basis. Continuity plans to mitigate its effects are being continuously reviewed.
Adapteo has seen a decrease in demand for event business and other projects with short rental periods. There has also been time lags, and thus lower demand, for offices in the private sector as expansion plans have been pushed out in time.
In the core business, social infrastructure, Adapteo has entered the important peak season for new order intake from mid-February to the end of April. The es-calation of Covid-19 will affect Adapteo's customers in their decision-making processes and thus the company. The total effects of this cannot be quantified today. However, the long-term needs in the public sector remain and Adapteo’s view of market development over time stays unchanged.
Capital expenditure
Adapteo’s net capital expenditure totalled EUR 69.2 (58.2) million. Net fleet capex amounted to EUR 59.4 (53.5) million and growth capex to EUR 29.1 (46.7) million. Growth capex decreased due to slower fleet growth in Sweden. In addition to fleet expansion, reinvestments were made to replace modules disposed of during the reporting period. Disposed C30 modules were replaced by modern C90 modules, which will gen-erate higher rental income in the future. Expenditure on new rental modules required for growth was made in Sweden, Finland, Denmark and Germany.
Cashflow and financial position
In 2019, cash flow from operating activities before fi-nancial items and taxes improved and amounted to EUR 92.0 (63.2) million. Operating cash flow before growth capex totalled EUR 65.7 (57.6) million. Net working capital decreased during 2019 by EUR 17.2 (7.5) million. Net cash flow used in investing activities totalled EUR -65.4 (-195.8) million.
On 31 December 2019, borrowings totalled EUR 412.1 million (on 31 December 2018 EUR 380.6 million). Net debt totalled EUR 399.8 million (on 31 December 2018 EUR 367.2 million). Net debt to comparable EBITDA was 4.5. Cash and cash equivalents amounted to EUR 3.8 million (on 31 December 2018 EUR 2.4 million).
Adapteo has a EUR 500,000,000 loan agreement that consists of a EUR 400,000,000 term loan and a EUR 100,000,000 revolving credit facility. The loan agreement contains financial covenants. The EUR 400,000,000 term loan was drawn on 1 July 2019 and used to refinance the debts transferred from Cramo at the demerger. At the end of the review period the EUR 100,000,000 revolving credit facility was fully undrawn.
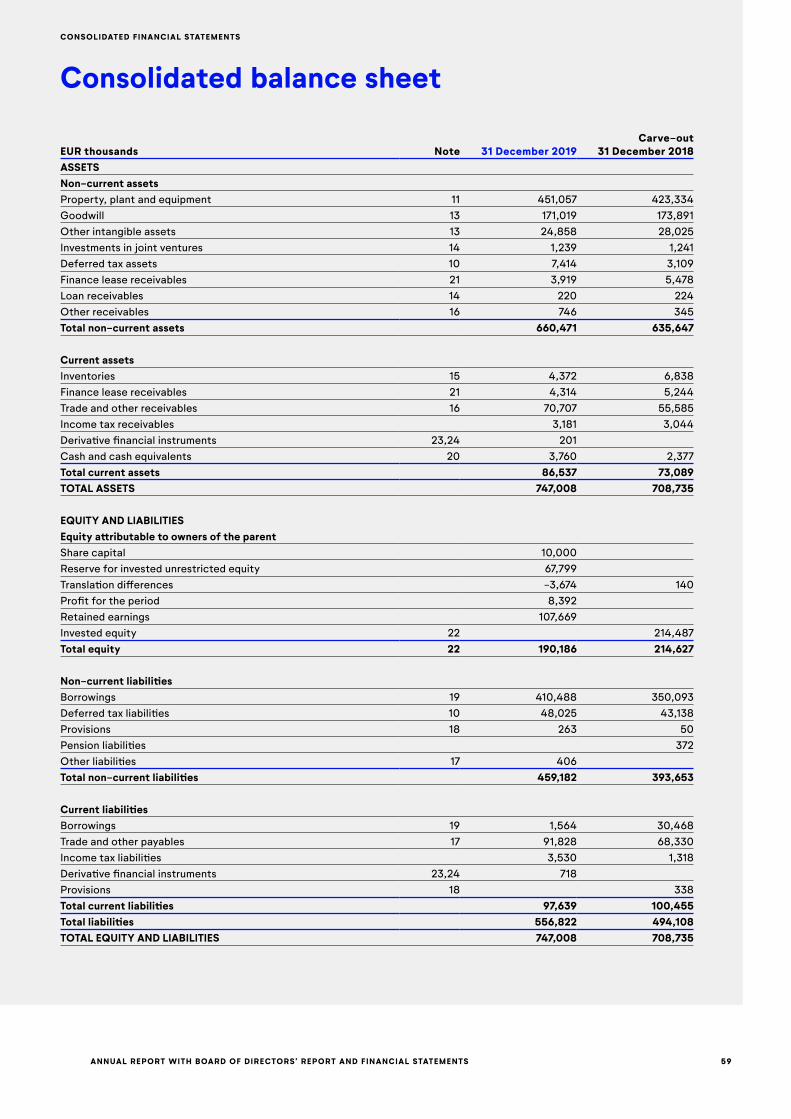
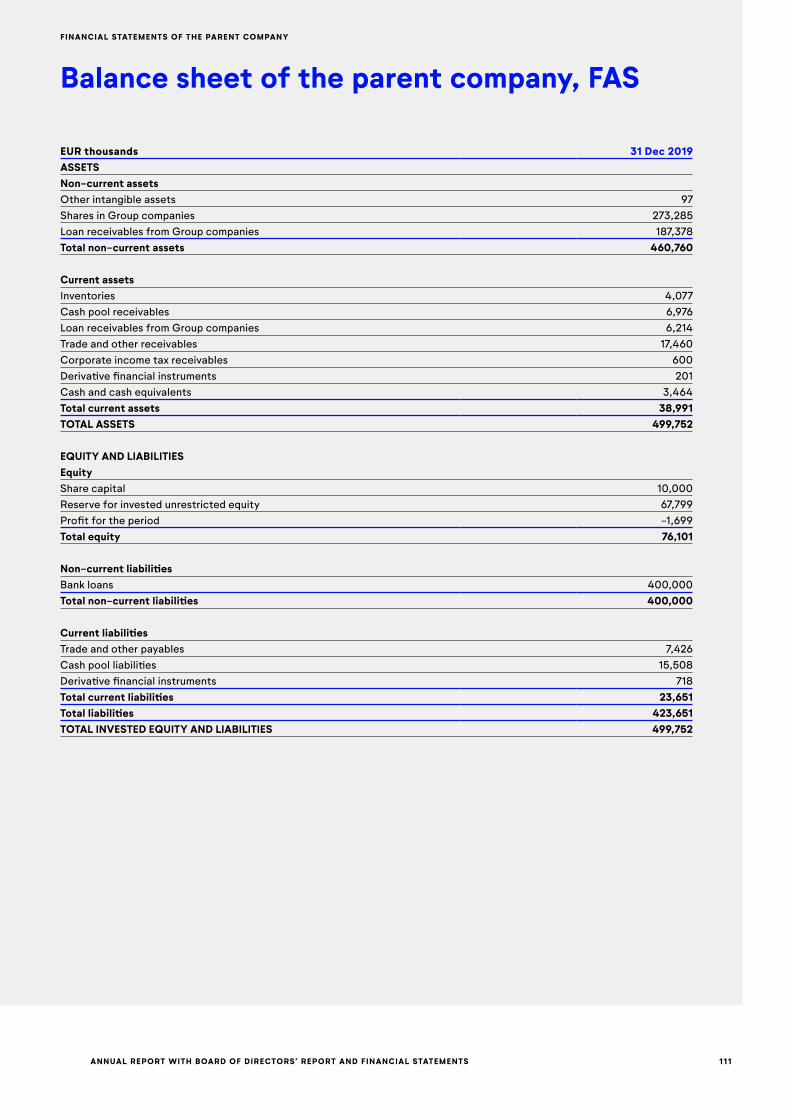
Property, plant and equipment amounted to EUR 451.1 million (on 31 December 2018 EUR 423.3 million) of the balance sheet total at the end of the review period. Total assets were EUR 747.0 million (on 31 December 2018 EUR 708.7 million).
Operative return on capital employed (ROCE) for January−December amounted to 8.5% (12.1% in 2018, pro forma).
Parent company
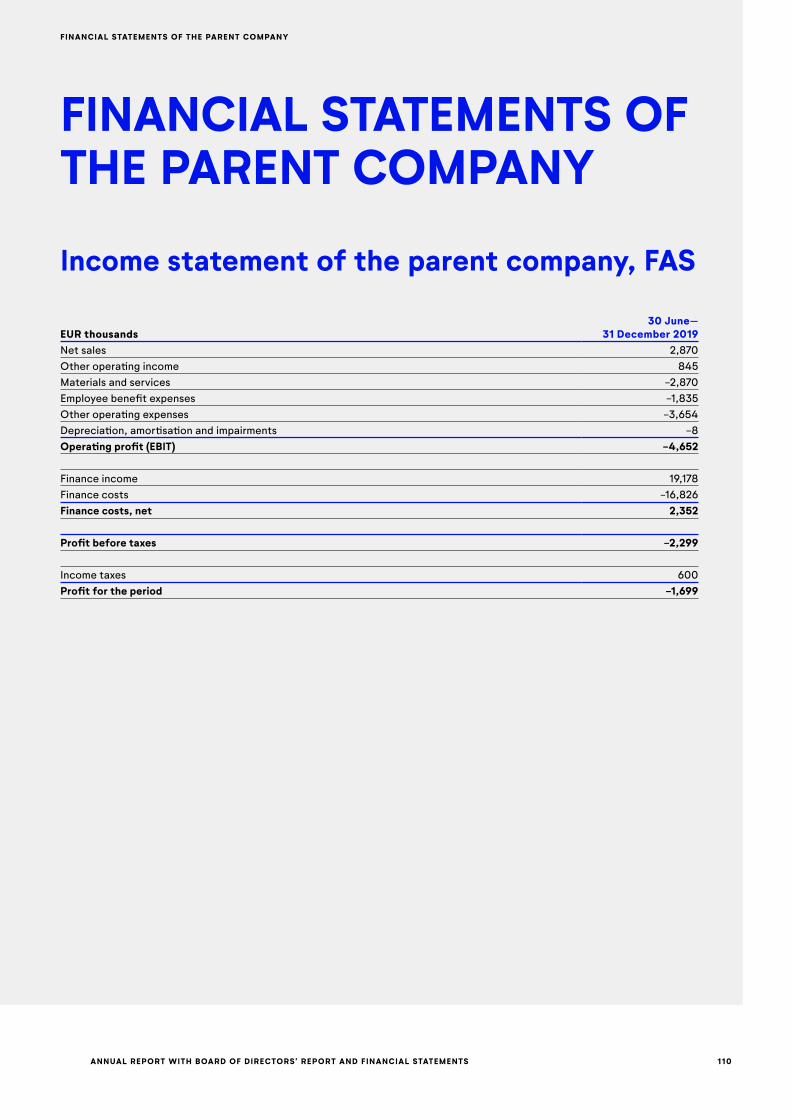
In 2019, parent company net sales were EUR 2.9 million and the profit for the period was EUR -1.7 million. At year-end, the parent company had 15 employees and held cash and cash equivalents of EUR 3.5 million.
ANNUAL REPORT WITH BOARD OF DIRECTORS’ REPORT AND FINANCIAL STATEMENTS
XXXXXXXXXXXX
30
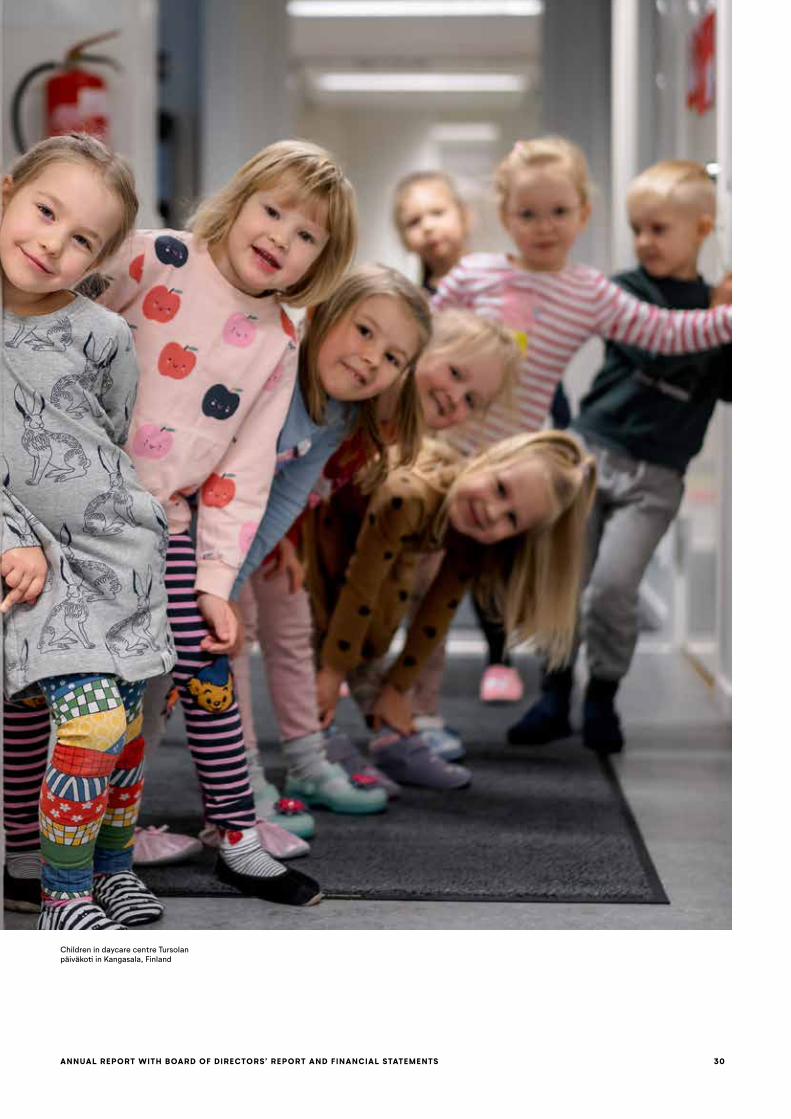
Children in daycare centre Tursolan päiväkoti in Kangasala, Finland
ANNUAL REPORT WITH BOARD OF DIRECTORS’ REPORT AND FINANCIAL STATEMENTS 31
BOARD OF DIRECTORS’ REPORT
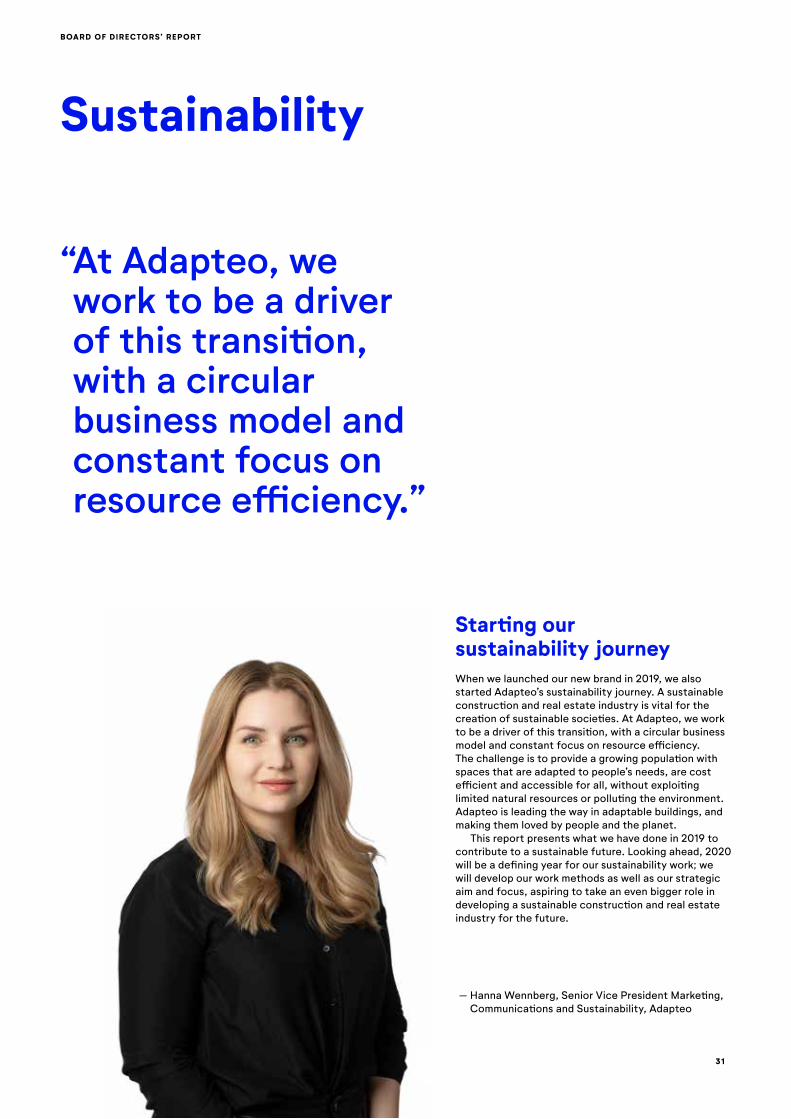
Starting our sustainability journeyWhen we launched our new brand in 2019, we also started Adapteo’s sustainability journey. A sustainable construction and real estate industry is vital for the creation of sustainable societies. At Adapteo, we work to be a driver of this transition, with a circular business model and constant focus on resource efficiency. The challenge is to provide a growing population with spaces that are adapted to people’s needs, are cost efficient and accessible for all, without exploiting limited natural resources or polluting the environment. Adapteo is leading the way in adaptable buildings, and making them loved by people and the planet.
This report presents what we have done in 2019 to contribute to a sustainable future. Looking ahead, 2020 will be a defining year for our sustainability work; we will develop our work methods as well as our strategic aim and focus, aspiring to take an even bigger role in developing a sustainable construction and real estate industry for the future.
“ At Adapteo, we work to be a driver of this transition, with a circular business model and constant focus on resource efficiency.”
– Hanna Wennberg, Senior Vice President Marketing, Communications and Sustainability, Adapteo
Sustainability
ANNUAL REPORT WITH BOARD OF DIRECTORS’ REPORT AND FINANCIAL STATEMENTS 32
BOARD OF DIRECTORS’ REPORT
Goal: Ensure inclusive and equitable quality education and promote lifelong learning opportunities for allMilestone: 4.A: Create including and safe environments for education
Adapteo provides adaptable buildings for schools, creating improved learning environ-ments for students and supporting municipal-ities with quick solutions to school building needs. Our buildings are accessible and barrier-free, ensuring an inclusive learningenvironment for all.
Goal: Build resilient infrastructure, pro-mote inclusive and sustainable industri-alisation and foster innovationMilestone: 9.4 Upgrade all industry and infrastructure for increased sustainability
With our continuous work to improve envi-ronmental performance of our buildings we contribute to a more sustainable industry and infrastructure in society.
Goal: Make cities and human settlements inclusive, safe, resilient and sustainableMilestone: 11.1 Safe housing for an affordable cost
With a focus on quality buildings adaptable tosociety’s needs and cost efficiency, Adapteocontributes to SDG 11.
Goal: Ensure sustainable consumption and production patternsMilestone: 12.2 Sustainable management and use of natural resourcesMilestone: 12.5 Make significant reduc-tion in the quantity of waste
Our circular business model provides sustain-able solutions to changing societal needs. We have a systematic approach to sustainable resource management and reduction of waste. We constantly improve our industrial produc-tion of buildings to circulate materials and reduce environmental impact.
Goal: Take urgent action to combat climate change and its impactsMilestone: 13.3 Increase knowledge and capacity to handle climate changes
Adapteo’s buildings are climate smart andenergy efficient. Our project with the Ministry of the Environment in Finland aims to develop new ways of measuring climate impact of the construction and real estate industry, and increase knowledge and capacity to reduce climate impact.
Adapteo aims to contribute to the UN Sustainable Development Goals (SDGs). In 2019, an initial mapping of our work and how it relates to theglobal development agenda lead to the selection of five SDGs for which Adapteo’s sustainability work should contribute.
Contributing to the UN Sustainable Development Goals
ANNUAL REPORT WITH BOARD OF DIRECTORS’ REPORT AND FINANCIAL STATEMENTS 33
BOARD OF DIRECTORS’ REPORT
Environmental sustainabilityEnvironmental sustainability has become the defin-ing issue of our time, and rapid change is needed to address the challenges related to increasing climate change and ecosystem depletion. The expectations on companies to meet sustainability demands, from consumers, politicians and civil society are growing. At Adapteo, we see strong demands from our cus-tomers, as well as from our own employees and other stakeholders to aim high with our sustainability work, and to communicate our sustainability efforts.
Construction and real estate have a very large impact on the environment. We need to ensure sustainability throughout a building’s entire life cycle. This requires that the sourcing of materials, construction, use, reuse, adaptation and end of life are managed in the most sustainable way possible.
With a circular business model and sustainable resource management, Adapteo offers climate smart products from cradle to grave, which we constantly improve to optimise function and environmental per-formance. In collaboration with other actors, Adapteo is spearheading the development of a climate smart construction and real estate industry and contributing to a sustainable society.
Creating a circular construction industryTo reduce greenhouse gas emissions, we need to keep resources in use for as long as possible and create a cir-cular economy. At Adapteo, we apply this approach to create adaptable buildings that can be used and reused, creating a circular construction industry. We can build, transform, repurpose, scale up and scale down in a mat-ter of weeks, ensuring that our buildings can be used during several rental rounds and serve different purpo-ses depending on our customer’s needs. Our buildings can be rented, leased or bought to function for example as a daycare, and when they are no longer needed they will be renovated and rented out again and again, in the same or different function. Some of our very first units are still in use after 30 years. Designing for circularity is key, and we improve and adjust our processes contin-uously to maximise value and minimise environmental impact. 95% of the units that were installed in 2019, were refurbished for re-use, and 5% were new.
Participating in a project with the Ministry of Envi-ronment in Finland is one way of contributing to a larger shift in society towards a sustainable business and housing sector.
Our Green Modules consume as little energy as possible. Through good insulation, air-tight windows and doors, as well as using low-energy waterborne heating, we ensure our solutions’ energy-efficiency. Our aim is for 50% of our rental portfolio to be Green Modules by 2023, and in 2019 we reached 32%.
The construction industry accounts for 20% of Sweden’s greenhouse gas emissions 1.
ANNUAL REPORT WITH BOARD OF DIRECTORS’ REPORT AND FINANCIAL STATEMENTS 34
BOARD OF DIRECTORS’ REPORT
We also apply a circular perspective to the production of new modules and through closing the material loop, we are able to minimise waste and use more and more recycled material. An example of our circular approach is switching from single-use plastic to recycled plastic
in our module covers used during transport and storage. The new covers will last longer and reduce waste; we expect to reduce single use plastics for covers with 60%. The project was started in 2019 and the new solu-tion will be piloted with a new supplier in early 2020.
Optimising climate smart buildings for the future
In a unique and ambitious project, the Ministry of the Environment in Finland aims to make cities carbon neutral within the coming decades. An important component is finding out how to construct and use buildings in the most climate smart way.
Adapteo is part of this project and our buildings are being analysed from cradle to grave to identify optimal use of material, transport, use, and reuse of our modules.
- We are already optimising our buildings to deliver a future proof model. In my opinion, the best buildings are made of wood – a material with many benefits. Wood is a renewable resource, it binds CO2 over time, it is adaptable and can be reused and rebuilt, it is relatively lightweight and easy to transport. Other aspects of an optimised building are efficient production with minimal waste, something we continuously work with in our factories, says Niko Oksa, technical sales manager at Adapteo in Finland.
In 2019, six Adapteo buildings were analysed, and during the coming year assessments of another ten buildings will be initiated. The project has now established a formula to calculate greenhouse gas emissions, and CO2 uptake, throughout a buildings 50-year lifecycle. The result provides the buildings carbon footprint and handprint. The findings will in-fluence procurement criteria and building standards in Finland to enable a fossil free future.
ANNUAL REPORT WITH BOARD OF DIRECTORS’ REPORT AND FINANCIAL STATEMENTS 35
BOARD OF DIRECTORS’ REPORT
Sustainable resource managementAt Adapteo, we aim to increase material efficiency, reduce waste and increase the share of recycled waste.
The environmental impact of a building comes largely from material use, and by choosing renewable mate-rials with the right qualities, we can enable design for sustainability already at the drawing board. The primary material for our production is wood. Wood has a lower climate impact compared to other building materials such as concrete and steel. A building made of wood has significantly lower CO2-emissions than a comparable concrete building, for premises around 35-40% accord-ing to one study.
Another key factor for sustainable construction is to minimise waste at all stages. Adapteo’s adaptable buildings are industrially constructed, which enables a systematic approach to resource use and waste prevention, using a LEAN-process. With industrial production we can make sure we order the right amount of material. We also constantly develop our ability to make use of left-over material from different parts of the production process. In 2019, we installed a new industrial machine for refurbishing of insulation waste; the left-over pieces of insulation are torn apart and can be reused rather than put to waste.
Another example of waste reduction is a project together with our supplier Harmet; developing solutions for the reuse of left-over materials from façade panels.
For a growing number of customers, it is important that buildings are environmentally certified. During 2019, the Sweden Green Building Council certified one of our buildings from the Business Area Permanent Space with ‘Miljöbyggnad Silver’. In the years to come, we aim to increase the number of green building certifications.
Sustainability in our own operationsAlso, in our own operations, we incorporate a sustaina-bility perspective.
As of 2019 ISO Quality Management Standard 9001 and ISO Environmental Management Standard 14001 have been implemented in Finland, Sweden, Germany and Norway. The aim is to implement these certifica-tions in all Adapteo’s operating markets.
Efficient transport is key to minimising climate impact. In 2019, we partnered with our supplier Harmet to develop new measures to improve the transport effi-ciency of steel, with careful planning, and smart pack-ing of vehicles, we reduce air pockets and can fit more into each delivery. We also assess how we can enhance material flows to construction sites by co-packing different types of material in prepared kits. This benefits the workflow on site and enables optimised transport.
During 2019, we procured
100% green energy for all our production facilities in Sweden and in 2020 all of Adapteo’s business operations in Sweden will start using green energy.
We cut our insulation waste in half due to our new process
In our new machine, left-over pieces of insulation are torn apart and can be reused rather than put to waste.
ANNUAL REPORT WITH BOARD OF DIRECTORS’ REPORT AND FINANCIAL STATEMENTS 36
BOARD OF DIRECTORS’ REPORT
Population growth in the Nordics poses a growing challenge for the sustainable development of society. The demand for daycare and school buildings is rising, however around three quarters of Swedish municipal-ities premises, such as schools, are 40 years or older and in need of renovation 1. Further, a growing elderly population leads to an increasing demand for elder and senior care facilities. Municipalities and cities face the challenge of quickly providing adaptable building solutions that fit into budgetary requirements. Adapteo provides a solution to these societal challenges with adaptable space solutions, no matter if the need is for a couple of weeks or indefinitely. Making it easy to provide spaces for an unpredictable future.
Adaptable solutions solving demands of growing society
Quickly providing better learning environments for pupilsThe facilities at Noltorp elementary school in Alingsås, built in 1973, were in great need of renovation and the classrooms had also become too small for the growing number of students. Adapteo’s buildings of-fered a solution to this problem. The classrooms were installed during the fall of 2019 and they will be used for 340 students over the next three years. Adapteo’s climate smart buildings have low energy consumption
with district heating, while at the same time improv-ing the pupils learning environment.
– The pupils describe their new buildings as bright and nice in comparison to our old buildings. Our teachers also see the benefits of the new classrooms as they are both quiet and spa-cious”, says Maria Sandwall, Principal at Noltorp Elementary School.
In 2019, 368 daycare centres, and schools as well as 4 elderly care operations moved into buildings from Adapteo.
ANNUAL REPORT WITH BOARD OF DIRECTORS’ REPORT AND FINANCIAL STATEMENTS 37
BOARD OF DIRECTORS’ REPORT
Sustainability governance At Adapteo, sustainability is integrated into the busi-ness model and is a key issue at all levels of operation. Adapteo’s sustainability work is led by the Marketing and Sustainability team that are responsible for follow up of implementation throughout the organisation.
Hanna Wennberg, Senior Vice President Marketing, Communication and Sustainability is responsible for the sustainability area within the Group Management Team. The central functions for implementation are the Sourc-ing and Supply Chain Management and Human Resourc-es. In 2020 Adapteo will develop a strategic direction for its sustainability work and set up a structure for ongoing reporting and follow-up to the Adapteo Group Management Team.
Stakeholder dialogue and materiality analysisIn 2019, Adapteo conducted a stakeholder dialogue with interviews with selected customers, investors and management about expectations and concerns related to Adapteo’s sustainability work. Based on insights from the stakeholder dialogue a materiality analysis was developed, and ten key sustainability aspects were selected as focus areas for Adapteo’s sustainability ef-forts and reporting. The selected sustainability aspects guided the choice of material topics included in the Global Reporting Index on page 124–129.
Minimising riskTo ensure all employees at Adapteo are well informed and work in line with our values we have a set of policy documents. These include Adapteo’s Sustainability Pol-icy; Code of Conduct; Procurement Policy; Anti-Fraud Policy; HR Policy; Whistleblowing Policy; and Enterprise Risk Management Policy.
An initial mapping of sustainability risks for Adapteo’s business operations has been conducted, identifying risks such as reducing CO2 emissions from transport, discrimination and health and safety of clients and uninvolved parties. In 2020, we will include sustainabil-ity risks in our overall risk assessment and identify risk management strategies. To secure good working condi-tions at our workplaces, we have implemented a gender equality and diversity plan and a channel for whistle-blowing to combat discrimination and other offensive ill treatment. These issues are also mentioned in our code of conduct and human resource policy. Furthermore, all construction and production sites have visible safety rules to secure the safety and health of our employees.
We work with sustainability in partnership with our suppliers. It is very important for us that anti-corruption, protection of human rights are ensured and that we work actively against discrimination, not only in our own operations, but also through our supply chain. There-fore, our Business Code for Suppliers includes clear statements on these issues, as well as other areas such as environmental protection. In 2019, we reviewed all our agreements with major suppliers to ensure they have signed our Business Code for Suppliers. Going forward, we will review the endorsement and compliance of the Business Code for Suppliers on an annual basis.
Supplier assessment
All major suppliers go through an assess-ment which includes environ mental and social questions, and other sustainability aspects.
ANNUAL REPORT WITH BOARD OF DIRECTORS’ REPORT AND FINANCIAL STATEMENTS 38
BOARD OF DIRECTORS’ REPORT
A sustainable workplace Our competent and innovative workforce are essential to delivering solutions to our clients and developing our business going forward. At Adapteo, we want to contribute to a sustainable future together with our employees. As of 31 December 2019, Adapteo had a total of 408 employees in five countries, including temporary employees. All of Adapteo’s employees have collective bargaining agreements (CBAs) or corre-sponding agreements that are compliant with local employment agreements and CBAs. A safe work environment
As we work in the construction sector, maintaining a safe working environment is very important for us. At Adapteo, the health and safety of our employees is our highest priority. Adapteo’s industrial construction is based on standardised production processes, which re-duces the time spent on construction sites compared to the traditional construction process, lowering the risk of accidents. We have taken several steps to secure our employees safety: all construction and production sites have visible safety rules and ahead of every new assignment, a security check is completed. All work-re-lated injuries are reported and followed-up, and during 2019 no fatal work-related injuries were reported.
Gender equality and diversityWe launched Adapteo with the ambition to establish a healthy, driven and inclusive work place. Our three guiding principles are to be proactive, collaborative and committed. Adapteo is a firm believer in equal employ-ment and career advancement opportunities. In 2019, 100% of employees in the Nordics and 44% in Germany received regular performance and career development reviews. Going forward, our aim is to reach 100% in all markets. At Adapteo, we aim for high job satisfaction, commitment and security for all employees and they are entitled to equal rights, obligations and opportu-nities regardless of their sex, gender identity, gender expression, age, sexual orientation, disability, ethnic-ity, religion or other beliefs. We have a zero tolerance for discrimination of any kind or ill treatment, which is clearly stated in our internal policies.
Adapteo operates in a male dominated industry. It is important for us to actively promote an even gender balance both in the operational and management organisations.
Gender balance at AdapteoAll
employeesBoard of
DirectorsManagement
teams
Women 15.2% 40% 28.2%
Men 84.8% 60% 71.8%
Read our full GRI index on page 124–129.
298
7
44
2534
Employees per country
Sweden (298)
Norway (7)
Finland (44)
Denmark (25)
Germany (34)
7
95
73
165
73
Employees per age group
< 24 (7)
24–35 (95)
36–45 (73)
46–59 (165)
60+ (73)
206202
Employees per Business Area
Rental Space (206)
Permanent Space (202)
Includes permanent employees only
In 2019, over 80% of our employees have participated in a code of conduct training.
ANNUAL REPORT WITH BOARD OF DIRECTORS’ REPORT AND FINANCIAL STATEMENTS
XXXXXXXXXXXX
39
Adapteo’s industrial construction is based on standardised production processes, which reduces the time spent on con-struction sites compared to the traditional construction process, lowering the risk of accidents.
ANNUAL REPORT WITH BOARD OF DIRECTORS’ REPORT AND FINANCIAL STATEMENTS 40
BOARD OF DIRECTORS’ REPORT
Corporate Governance structure
The following sections describe the governance struc-ture within Adapteo and how corporate governance creates a framework for rules and regulations, areas of responsibility and processes, and routines that effec-tively safeguard the interests of shareholders and other parties by minimising risks and creating good conditions for a stable expansion of Adapteo’s business.
Adapteo is a Finnish limited liability company whose shares are listed on Nasdaq Stockholm. Adapteo uses one-tier governance model, which, in addition to the General Meeting of the Shareholders, comprises the Board and the President and CEO. In the operative management of the company, the President and CEO is assisted by the Group Management Team.
1. ShareholdersAt year-end 2019, the total number of shareholders in Adapteo was 9,580. The proportion of foreign own-ership was 65.7% of the number of shares and votes in Adapteo. One owner represented at least 10% of the voting interests for all shares in the company. EQT Public Value Investments S.à r.l. represented 6,731,743 shares, corresponding to 15.1% of total number of shares and votes.
Further details about the company’s shares and shareholders are presented in the section “The Adapteo share”, see pages 49–50, and on the website https://www.adapteogroup.com/investors/the-share/the-largest-shareholders/
Corporate governance
Corporate governance relates to decision-making structures by which the shareholders, directly or indi-rectly, control the Group. The Corporate Governance Principles have been adopted by the Board of Directors of Adapteo Plc (the Board). They supplement the Finn-ish Companies Act, the Finnish Securities Markets Act, the Finnish Accounting Act, the rules and recommen-dations of Nasdaq Stockholm, as well as the Company’s Articles of Association. The Company applies – on a comply or explain basis – the Swedish Corporate Governance Code (Sw. Svensk kod för bolagsstyrning) issued by the Swedish Corporate Governance Board (Sw. Kollegiet för svensk bolagsstyrning) from time to time. Apart from the transitional deviation of Rule 9.7 in the Swedish Corporate Governance Code regarding the duration of the vesting period of the Performance Share Plan 2019, Adapteo does not deviate from the Swedish Corporate Governance Code for the financial year 2019. For more information regarding the deviation and the Performance Share Plan 2019, please refer to the page 45–46 . No violations of applicable stock exchange rules or of good practice on the securities market have been reported regarding Adapteo of the Nasdaq Disciplinary committee or the Swedish Se-curities Council during 2019. The Swedish Corporate Governance Code is available at http://www.corporat-egovernanceboard.se.
The General Meeting of Shareholders, the Board and the President and CEO are responsible for the man-agement of the Company, and their duties are primarily determined in accordance with the Finnish Companies Act.
The Board ensures that Adapteo complies with the principles of good corporate governance.
The auditor’s statement regarding this report can be found on pages 117–121.
Further information about corporate governance in Adapteo is available at www.adapteogroup.com
Adapteo’s corporate governance is devised to support the Group’s longterm strategies, market presence and competitiveness. At the same time, it shall uphold confidence among stakeholders, such as shareholders, customers, suppliers, capital markets, society, and employees.
ANNUAL REPORT WITH BOARD OF DIRECTORS’ REPORT AND FINANCIAL STATEMENTS 41
BOARD OF DIRECTORS’ REPORT
2. General Meeting of Shareholders
The General Meeting of Shareholders is the ultimate decision-making authority of the Company. The Annual General Meeting (AGM) is convened by the Board annually within six months from the end of the previous financial year. An Extraordinary Meeting of Share-holders (EGM) may be convened if the Board deems it necessary, or if one is legally required.
The AGM decides on the distribution of profits, adopts the financial statements and discharges the members of the Board and the President and CEO from liability. It elects the members of the Board, as well as decides on their remuneration. The AGM also elects the auditor of the Company. In addition, a shareholder may request that his/her proposal be handled at the next General Meeting of Shareholders.
General Meetings shall be convened by publishing a notice to the meeting on the Company’s website no earlier than three months and no later than three weeks prior to the date of the General Meeting. In addition, Adapteo publishes the invitation to the meeting by means of a regulatory press release immediately after the Board has decided to convene a General Meeting. Each share carries one vote at a General Meeting of Shareholders. The agenda for the meeting and the proposed decisions and other documents are made available on the Company’s website at least three weeks before the General Meeting.
The decisions of the General Meeting of Share-holders are published by means of a regulatory press release immediately after the General Meeting of Shareholders. The minutes of the General Meeting of Shareholders are published on Adapteo’s website within two weeks after the General Meeting of Shareholders in question.
Adapteo was established on 30 June 2019, through the partial demerger of Cramo Plc. Hence, the EGM of Cra-mo, held on 17 June 2019, resolved on the composition and remuneration of Adapteo’s Board, elected Adapt-eo’s auditor and resolved to establish the Shareholders’ Nomination Committee of Adapteo.
The Annual General Meeting 2020 will be held at 13:00 EET on 23 April, 2020, in Helsinki, Finland.
3. Nomination CommitteeThe Shareholders’ Nomination Committee (Nomination Committee) consisting of the largest shareholders of the Company (or persons appointed by such sharehold-ers) is established for preparing proposals concerning the election and the remuneration of the members of the Board and the Chairman of Board to the follow-ing AGM. The Nomination Committee consists of four members, one member being the Chairman of the Board and three members representing the Company’s three largest shareholders who, on the last business day of September preceding the next Annual General Meeting, hold the largest number of votes calculated out of all shares in the Company. The chairman of the Nomination Committee shall be the member that has been appointed by the largest shareholder unless the Nomination Committee decides otherwise. The term of the members of the Nomination Committee shall end upon the appointment of the following Nomination Committee.
3. NOMINATION COMMITTEE 8. AUDITOR
1. SHAREHOLDERS
2. GENERAL MEETING OF SHAREHOLDERS
4. BOARD OF DIRECTORS
7. PRESIDENT AND CEO, GROUP MANAGEMENT
BUSINESS AREAS AND BUSINESS UNITS
6. REMUNERATION 5. AUDIT COMMITTEE
SYSTEMS FOR INTERNAL AUDIT AND RISK MANAGEMENT
Corporate Governance structure
ANNUAL REPORT WITH BOARD OF DIRECTORS’ REPORT AND FINANCIAL STATEMENTS 42
BOARD OF DIRECTORS’ REPORT
The Nomination Committee shall conduct its duties in accordance with the Swedish Corporate Governance Code. The main purpose of the Nomination Committee is to ensure that the Board and its members represent a sufficient level of breadth of qualifications, exper-tise, knowledge and competence for the needs of the company and have the possibility to devote sufficient amount of time to attending their duties as members of the Board. The Nomination Committee shall pay attention to achieving a balanced gender distribution and diversity balance on the Board considering the competence of the Board as a whole. The Nomination Committee shall in its work consider the diversity prin-ciples of the company. In preparing its proposal regard-ing the Board of Directors, the Nomination Committee has applied Section 4.1 of the Code as its diversity policy. Taking the Company’s operations, phase of development and general circumstances into account, this respects the need for the Board of Directors to be appropriately composed and characterised by versa-tility and breadth in terms of its skills, experience and background.
The proposals and the Nomination Committee’s statement will be published at the latest on 31 January each year. For further information about the Nomi-nation Committee, see the Committee Charter at the website www.adapteogroup.com. In accordance with instructions on Adapteo’s website, shareholders are welcome to present proposals and opinions to the committee.
Shareholders who wish to submit proposals to the Nomination Committee can do so by e-mail to [email protected] or by ordinary mail to the address Adapteo Plc, Nomination Committee, Attn: Caroline Lind, Box 3293, 103 65 Stockholm, Sweden.
The members of Adapteo’s Nomination Committee for the 2020 Annual General Meeting are:
Fredrik Åtting, appointed by EQT Fund Management S.à r.l.
Dr. Giulia Nobili, appointed by Sterling Strategic Value Fund S.A., SICAV-RAIF
Jan Särlvik, appointed by Nordea Funds
Peter Nilsson, Chairman of the Board of Directors of Adapteo
4. Board of DirectorsAccording to Adapteo’s Articles of Association, the Board comprises a minimum of five and a maximum of eight members. The Board is responsible for the admin-istration of Adapteo and the appropriate organisation of its operations. The Board of Directors is Adapteo’s highest decision-making body below the General Meeting of Shareholders. The Board is responsible for the organisation of the Group and management of the Group’s affairs. The Board’s tasks include adopt-ing strategies, business plans, interim reports, year-end reports, annual financial statements and certain instructions, policies and guidelines. The Board is also required to monitor economic developments and ensure the quality of financial reporting and internal controls and evaluate operations based on the objectives and guidelines set by the Board. Additional targets include deciding on the Group’s major investments, acquisitions and divestments, and other changes in the organisation and activities.
The Board appoints and dismisses the President and CEO, supervises his or her actions, and decides on his or her remuneration and other terms and conditions of service.
The Board adopts instructions for the Board com-mittees and an instruction for the President and CEO, as well as an instruction for the financial reporting. The work of the Board follows written rules of procedure to ensure that the Board obtains information on all issues, and that all aspects of the Group’s activities relating to the Board are addressed.
ANNUAL REPORT WITH BOARD OF DIRECTORS’ REPORT AND FINANCIAL STATEMENTS 43
BOARD OF DIRECTORS’ REPORT
Work of the BoardTo fulfill its duties, the Board’s work follows an annual cycle. At the beginning of the year, the Board consid-ers the year-end report and the annual report, as well as matters to be submitted to the AGM. Each year, the Board reviews the strategic direction of the Group as well as the business plan and targets for the year ahead. There is also a presentation of the annual audit made by the Group’s principal auditor.
Every quarter, the Board reviews the Group’s earn-ings and interim reports. An inaugural Board meeting is held in connection with the AGM at which members of the Board’s committees are appointed and matters such as the right to sign on behalf of the company are de-cided. At Board meetings, there are normally business presentations and/or presentations on certain matters. The Board evaluates the performance of the President and CEO and also follows up on the compliance of the Code of Conduct during the year. The Board held seven meetings in 2019, including the inaugural meeting. Five of the meetings were physical meetings and two were per capsulam.
Evaluation of the BoardThe annual evaluation of the Board of Directors’ work, including the Board’s committees, was conducted in accordance with the instructions by the Nomination Committee. The 2019 evaluation was answered by each Board member. In addition, the Chairman of the Nomination Committee met with each Board member separately to discuss the evaluation and presented the results of the evaluation to the Nomination Committee. The evaluation included working procedures, com-petence and composition of the Board as well as the experience and diversity of the Board members.
Remuneration of the Board of DirectorsPursuant to the Articles of Association of Adapteo, the General Meeting of Shareholders determines the remuneration payable to the members of the Board of Directors. The Extraordinary General Meeting of Cra-mo, held on 17 June 2019, resolved that remuneration to the Board members elected by the General Meeting, for the period ending at the end of the first Annual General Meeting of Adapteo, should be as per below. See also note 27.
The Chairman of the Board EUR 85,000.
Each of the other Board members EUR 37,500.
The member of the Board elected chairperson of the Audit Committee will receive an additional compen-sation of EUR 5,000.
The Board has established an Audit Committee to assist the Board in fulfilling its oversight responsibilities of the company’s financial reporting process and in moni-toring the statutory audit of the financial statements and consolidated financial statements and assist the Board in its oversight of matters pertaining to finan-cial reporting, internal control, internal audit and risk management, and by making proposals on such matters to the Board.
The Board in its entirety has performed the remu-neration related tasks typically vested with a Remuner-ation Committee. However, the Board will during 2020 review and assess the potential need for establishing a Remuneration Committee. Before such review and as-sessment have been concluded, the Board will continue to perform the remuneration related tasks typically vested with a Remuneration Committee.
CompositionMembers of the Board of Directors are appointed annu-ally by the Annual General Meeting, which also appoints the chairman of the Board, for the period until the end of the next AGM. According to the Group’s Articles of Association, the members of the Board of Directors to be elected by the General Meeting shall consist of a minimum of five members and a maximum of eight members. None of the Board members are employed by the Group.
The EGM of Cramo resolved that the number of members of the Board of Adapteo shall be five and resolved to elect Peter Nilsson as Chairman and Carina Edblad, Outi Henriksson, Andreas Philipson and Joakim Rubin as members of the Board of Directors of Adap-teo. The term of office of the members of the Board of Directors of Adapteo commenced on 30 June 2019 and will expire at the end of the first AGM of Adapteo. Based on an evaluation of independence, the mem-bers of the Board are considered to be independent of Adapteo. The members of the Board are independent of Adapteo’s major shareholder, excluding Joakim Rubin who is not independent of Adapteo’s major shareholder.
The Chairman leads the work, is responsible for ensuring that the Board’s work is carried out efficiently and that the Board fulfils its obligations in accordance with applicable laws and regulations. The Chairman shall monitor the Board’s performance and prepare and chair the meetings. The Chairman is also responsible for ensuring that the Board of Directors evaluates its work each year and always receives the information neces-sary to perform its work effectively. The Chairman rep-resents the Board in relation to Adapteo’s shareholders.
ANNUAL REPORT WITH BOARD OF DIRECTORS’ REPORT AND FINANCIAL STATEMENTS 44
BOARD OF DIRECTORS’ REPORT
Authorisation to issue shares and to acquire Adapteo’s own sharesThe EGM of Cramo on 17 June 2019 decided to author-ise the Board of Adapteo to resolve to issue shares and special rights entitling to shares up to a maximum of 4,500,000 shares, corresponding to approximately 10% of Adapteo’s shares as of this date. The EGM also authorise Adapteo’s Board to decide on the acquisition of not more than 4,500,000 Adapteo shares. Both authorisation are valid until the end of the next AGM, however no longer than until 30 June 2020.
5. Audit CommitteeThe Board has appointed the Audit Committee and adopted a written charter for the Audit Committee set-ting forth purposes, composition, operations and duties of the committee as well as qualifications for commit-tee membership.
The Audit Committee shall have at least two mem-bers. They may not be employed by the Company or the Group. The President and CEO or any other person belonging to the Company’s management may not be a member of the Committee. The Audit Committee may invite, in addition to representatives of the Company and external auditors, experts to its meetings, when necessary.
The Committee as a whole shall possess the exper-tise and experience required for the performance of the duties and responsibilities of the Committee. Without limiting the applicable requirements, desirable quali-fications for Committee members include appropriate understanding of accounting practices and financial reporting. At least one Committee member shall have special expertise in accounting, bookkeeping or audit-ing, and the Committee as a whole shall have sufficient expertise and experience of the Company’s operating environment.
The Audit Committee assists the Board in fulfilling its oversight responsibilities of the Company’s financial reporting process and in monitoring the statutory audit of the financial statements and consolidated financial statements of the Company and assists the Board in its oversight of matters pertaining to financial reporting, internal control, internal audit and risk management, and by making proposals on such matters to the Board. In addition, the Audit Committee reviews the descrip-tion of the main features of the internal control and risk management systems pertaining to the financial reporting process and monitors the efficiency of the system of internal control and risk management and the audit process.
In addition, the duties of the Audit Committee include preparatory work on the decision on electing the audi-tor, the evaluation of the independence of the auditor, particularly the provision of related services to the Company and carrying out other tasks assigned to it by the Board. The Audit Committee does not have in-dependent decision-making authority in matters within the competence of the Board, but it assists the Board in preparing such matters that the Board within its com-petence collectively makes the decisions on.
The Board elects the members and the Chairman of the Audit Committee from among its members. Mem-bers are appointed for a one-year term of office, which expires at the end of the AGM following the election. The Audit Committee consists since June 2019 of Outi Henriksson (chair) and Joakim Rubin. During 2019 the Audit Committee held four meetings with both mem-bers attending all meetings.
6. RemunerationThe Board in its entirety has performed the remunera-tion related tasks typically vested with a Remuneration Committee. However, the Board will during 2020 review and assess the potential need for establishing a Remu-neration Committee.
Remuneration of the President and CEO and Group ManagementThe remuneration for Adapteo’s senior executives shall consist of a base salary, variable compensation, long term incentive programs, pension contributions and additional benefits. The base salary shall reflect the position, qualification and individual performance and the variable compensation shall be dependent on the extent to which predetermined quantitative and quali-tative goals are met. The short-term incentive compen-sation is limited to a maximum of 70% of the base salary for the President and CEO, and to 50% for members other executives. In case of termination of employment of a senior executive by the Group, the compensation can be up to six months’ base salary. See note 27 for information about the remuneration during 2019.
Performance-based incentive programsIt is considered by the Board to be in the best interest of the shareholders that key personnel in Adapteo have a long-term interest in a good value development of the shares of the Group. Particularly, this applies to the group of key personnel that consists of the senior executives and the business unit managers. It is also the assessment of the Board that a share-related long-term incentive program increases the attractiveness of Adapteo on the global market and enhances the possi-bility to recruit and keep key personnel in the Group.
ANNUAL REPORT WITH BOARD OF DIRECTORS’ REPORT AND FINANCIAL STATEMENTS 45
BOARD OF DIRECTORS’ REPORT
The plan is aimed at approximately 20 key employees. The reward from the discretionary period 2019 is based on the Group's EPS and the Group's operative ROCE. Per current estimation, the rewards to be paid based on the discretionary period 2019 are approximately EUR 0.9 million at the maximum. The maximum rewards were converted to Adapteo shares when the trading on Adapteo shares started.
A member of the Group Management Team must hold 50% of the shares resulting from the plan, until his or her shareholding in total corresponds to the value of his or her annual gross salary.
It is to be noted that the Board of Adapteo Plc has resolvedresolved not to launch a new discretionary pe-riod for 2020 under the Performance Share Plan 2019. Instead, the board is currently investigating alternative long-term incentive (LTI) programmes to better align with the interests of shareholders and management of Adapteo. A new LTI programme is expected to be presented and launched during Q1 2020.
Employee Share Savings Plan The Employee Share Savings Plan was offered to all Adapteo Group employees. In the plan, employees were offered an opportunity to voluntarily save a proportion of their salary to be used for the purchase of Adapteo shares.
The plan period is 1 July - 31 December 2019, during which savings from the participants’ salaries have been deducted monthly. The minimum savings amount per participant per month is 2% of gross salary, and the maximum is 5%. The total amount of all savings may not exceed EUR 0.8 million. Each participant will receive one free matching share for every two purchased sav-ings shares after the designated holding period, which ends on 15 May 2022, assuming the preconditions of shareholding and employment have been met. It is to be noted that the Board of Directors of Adapteo Plc has resolved not to launch a new Employee Share Savings Plan for 2020. The shares earned under the current Employee Share Savings Plan 2019 shall continue to vest in accordance with terms and conditions of the plan and payed to the participants in the original time table in May 2022.
Cramo’s Share-Based Incentive PlansPursuant to the demerger from Cramo, the Board of Directors of Cramo resolved on certain adjustments to the reward payments of share-based incentive plans set out from Cramo summarised below:
Share-Based Incentive PlansBefore the demerger from Cramo Plc, the Board of Di-rectors of Cramo Plc resolved to establish new share-based incentive plans for Adapteo Group employees. The aim was to align the objectives of the shareholders and the employees, to retain the employees at Adap-teo, and to offer them continuity to existing Cramo share-based incentive plans after the demerger.
Performance Share Plan 2019In the plan, the participants have an opportunity to earn Adapteo shares based on the achievement of per-formance criteria, as established by the Board. The plan includes three discretionary periods, 1 July - 31 De-cember 2019 and calendar years 2020 and 2021. Each discretionary period is followed by a two-year vesting period. Each discretionary period is conditional to the Board's resolution. A participant's participation in the plan is contingent upon his or her participation in the Adapteo Employee Share Savings Plan. Any rewards will be paid out after the vesting period in Adapteo shares. The participants are entitled to get a gross number of shares if all the vesting conditions are met. However, a portion of shares is withheld to cover applicable taxes arising from the rewards to the participants and a net number of shares is paid.
The plan constitutes a transitional deviation from the requirement of the Swedish Corporate Governance Code 2016, which provides that the vesting period to the date for acquisition of shares is to be no less than three years. For business, continuity and programme design reasons, the discretionary periods and vesting periods of the Performance Share Plan 2019 have been set to match Adapteo's financial year, being the calen-dar year. However, as the completion of the demerger was registered on 30 June 2019, the demerger occurred during a calendar year. Therefore, the first discretion-ary period commenced on 1 July 2019, and, as a result, the first discretionary period and vesting period would together be approximately two and a half years. It has been assessed that applying a discretionary period and vesting period of a total of three and a half years would be detrimental to the incentivising purpose of the programme. The second and third discretionary periods, together with their vesting periods, would both be a total of three years.
ANNUAL REPORT WITH BOARD OF DIRECTORS’ REPORT AND FINANCIAL STATEMENTS 46
BOARD OF DIRECTORS’ REPORT
Performance Share Plans 2017, 2018 and 2019 All rewards will be paid out in both Cramo and Adap-teo shares, so that for each earned Cramo share, the participants receive one additional Adapteo share. The participants are entitled to get a gross number of shares if all the vesting conditions are met. However, a portion of shares is withheld to cover applicable taxes arising from the rewards to the participants and a net number of shares is paid.
The pending confirmed rewards from the discretion-ary periods 2017 and 2018 will be paid to participants in the original schedule after the relevant vesting periods, in May 2020 and 2021.
For Adapteo participants, the discretionary period 2019 ended already on 30 June 2019. Any rewards accrued by 30 June 2019 will be paid to participants in the original schedule after the relevant vesting period, in May 2022.
One Cramo Share Plan After the completion date pursuant to the demerger, the pending matching shares in the One Cramo Share Plan will be paid to the participants in the original schedule after the relevant holding periods, in May 2020, 2021, and 2022. Matching shares will be paid out in both Cramo and Adapteo shares, so that for each earned Cramo share, the participants receive one ad-ditional Adapteo share. The participants are entitled to get a gross number of shares if all the vesting condi-tions are met. However, a portion of shares is withheld to cover applicable taxes arising from the rewards to the participants and a net number of shares is paid.
For Adapteo participants, saving in the One Cramo Share Plan ended on 30 June 2019. Any savings not used for share purchases before the demerger has been used to purchase Adapteo shares for Adapteo partici-pants after the demerger. The matching shares will be denominated respectively.
Due to the recent tender offer process for all shares of Cramo Plc made by Boels, the Board of Directors of Adapteo has decided to make certain considerations relating to the share-based plans originating from Cramo. The Board of Directors has decided that all Adapteo shares under the affected programmes shall continue to vest in accordance with the original time table and terms and conditions. The Board of Directors will decide on the treatment of the shares or share val-ue of Cramo share under each respective plan period.
7. President and CEO, Group Management
The Company’s Board appoints and dismisses the President and CEO. The Board decides on the terms and conditions of the President and CEO’s employ-ment. The terms and conditions as well as the financial benefits from the President and CEO’s employment are specified in a written service contract. The President and CEO is responsible for managing, supervising and controlling the business operations of the Company.
The President and CEO is responsible for the day-to-day executive management of the Company in accordance with the instructions and orders given by the Board. In addition, the President and CEO ensures that the accounting practices of Adapteo comply with Finnish law and that its financials have been organised in a reliable manner. The duties of the President and CEO are also set out in instructions for the President and CEO adopted by the Board of Directors of Adapt-eo. The President and CEO shall provide the Board and its members with the information necessary for the performance of the duties of the Board.
The President and CEO prepares matters for deci-sion by the Board, develops the Company in line with the targets approved by the Board and ensures the proper implementation of the decisions of the Board. The President and CEO is also responsible for ensur-ing that the Company is managed in compliance with applicable laws and regulations. The President and CEO is not a member of the Board but may attend the meetings of the Board and has the right to speak at the meetings.
The Company’s Board decides on the appointment of the members of the Group Management Team based on a proposal by the President and CEO. The Group Management is chaired by the President and CEO and comprises other senior management appointed by the Board. The Group Management Team meets regularly to address matters concerning the entire Group. The Group Management Team is not a decision-making body of the Company. It assists the President and CEO in the implementation of the Group strategy and in operational management. The Group Management Team is responsible for managing the Company’s core business operations as a whole, which requires planning of various development processes, Group principles and Group practices, as well as monitoring the devel-opment of financial matters and Group business plans. The Group Management Team convenes monthly and minutes are kept of all meetings.
ANNUAL REPORT WITH BOARD OF DIRECTORS’ REPORT AND FINANCIAL STATEMENTS 47
BOARD OF DIRECTORS’ REPORT
In addition to Philip Isell Lind af Hageby, President and CEO, the Group Management Team consists of Teemu Saarela, Senior Vice President (SVP) Corporate Devel-opment; Timo Pirskanen, CFO (until 27 November 2019); Erik Skånsberg, CFO (since 27 November 2019); Björn Kölerud, interim Executive Vice President Permanent Space (until 2 September 2019); Jan Isgård, interim Executive Vice President Permanent Space (from 2 September to 16 December 2019) Magnus Tinglöf, Executive Vice President Permanent Space (since 16 December 2019); Hanna Wennberg, SVP Marketing, Communications and Sustainability, Simon Persson, SVP Human Resources Development and Niklas Alm, SVP Investor Relations (since 27 November 2019). For further information about the members of Group Man-agement Team, see page 55.
8. AuditorThe task of the external auditor is to audit the Group’s annual report and accounts, the consolidated financial statements and the significant subsidiaries, as well as the management by the Board of Directors and the President and CEO. Following each fiscal year, the auditor shall submit an audit report to the AGM. The principal auditor participates at selected meetings with the Audit Committee and presents the annual audit to the Board of Directors, where the Board also meets the auditor without the management being present.
At Cramo’s Extraordinary General Meeting on 17 June 2019, the auditor, KPMG Oy Ab of Finland, was elected external auditing firm until the AGM 2020 in compliance with a proposal from the Nomination Com-mittee. The principal auditor is Toni Aaltonen, Author-ised Public Accountant.
For the 2019 financial period, the KPMG auditing fees of the group companies totaled to EUR 411.000, of which the parent company accounted for EUR 161.000. The auditing firm has not provided non-audit services during the period.
Internal control and risk manage-ment for financial reporting
Adapteo applies principles set forth in the COSO Internal Control – Integrated Framework which helps organisations design and implement internal control. Adapteo Internal Control Framework is designed to identify, assess and manage risks through effective internal controls in order to achieve timely and reliable preparation of the financial reports, and to ensure that applicable accounting principles and other require-ments as a publicly listed company are applied consist-ently. Further, the Internal Control Framework assists Adapteo in being efficient in the business operations, and to comply with applicable laws and regulation.
Control environment
In Adapteo, the Board of Directors is responsible for setting the ambitions for and monitoring the adequate-ness and effectiveness of internal control. In accord-ance with the Board of Directors’ and its Audit Com-mittee’s charters, the Audit Committee assesses the company’s financial reporting process and the appro-priateness of the internal control system and reviews the internal control reports. The duties of the Board of Directors and the Audit Committee are presented in more detail in the Corporate Governance section.
The President and CEO is responsible for imple-menting practical actions regarding internal controls and to maintain an organisational structure in which responsibility, authority, and reporting relationships are clearly and comprehensively defined. An authori-sation matrix is used where the division of authority for each organisational role is specified through approval limits. Adapteo has defined internal controls operating principles which assists personnel, management and the Board of Directors in their respective roles and duties regarding internal controls. Further, Adapteo has established a Risk & Control Steering Committee which convenes on a quarterly basis and reviews e.g. the results of the internal control self-assessments.
Adapteo’s ethical principles and business norms are specified in Adapteo’s Code of Conduct. Compliance with the principles is promoted through internal com-munication and training. Adapteo strives to ensure that its key business partners also comply with the same or similar principles. The Group's personnel and business partners can report suspected violations of Adapteo’s Code of Conduct on Adapteo’s website.
Risk assessment
Adapteo’s internal controls for financial reporting are designed based on the assessment of financial report-ing risks at both process and financial statement line item level. The risk assessment is updated annually, and is the basis for the annual internal control self-assess-ment cycle.
ANNUAL REPORT WITH BOARD OF DIRECTORS’ REPORT AND FINANCIAL STATEMENTS 48
BOARD OF DIRECTORS’ REPORT
Monitoring activities
Monitoring of the effectiveness of internal control includes both ongoing and separate evaluations and in-ternal audits. The self-assessment process for financial reporting controls is carried out on a quarterly basis based on an annual plan. The self-assessment process was introduced in 2019 and is executed by persons who are independent from the business and finance processes subject to assessment. Corrective actions have been planned for all control defects noted in the self-assessments.
Adapteo has established an internal audit function. According to the defined charter, the duties of the in-ternal audit function include independent and objective auditing activities, as well as value-adding consulting activities that improve operations. Internal audit con-tributes to the achievement of the company’s objec-tives through systematic assessment and development of the company’s risk management, internal controls, and corporate governance processes. The internal audit function reports directly to the Board’s Audit Committee and, administratively, to the CFO. Internal audit procedures are supplied from an external service provider. In 2019, the internal audit procedures have focused on the core and enabling business processes, as well as an implementation review of the new group-wide ERP system.
Control activities
Adapteo’s accounting and reporting manuals define the standards, processes and responsibilities for financial reporting. These manuals facilitate the achievement of Adapteo’s objectives regarding the reliability of finan-cial reporting. Adapteo has defined risk-based internal control points for its main processes, such as sales, project management, fleet management, procurement, and financial reporting. These control points include e. g. approvals, reconciling sub-ledgers and accounts, analytical reviews, limitations of access rights, and segregation of duties. The defined control points are designed to prevent, detect and correct material errors and deviations in financial reporting.
Information and communication
Adapteo communicates internal control related matters through employee meetings, its intranet, and through targeted trainings for employees. All key policies are made available through Adapteo’s intranet. Governance and internal control related matters have been in focus during the year 2019 as part of the preparations for de-merger.
Key financial reporting risks Control activities
Group accounting principles are not consistently applied (e.g. IFRS)
Group Accounting Manual and reporting instructions are defined and communicated within Finance Community
Reporting processes and procedures are not documented, kept up to date or followed
Procedures and instructions are defined and communicated
Closing process task list are in use for monthly closing
Closing process controls are defined and monitored
Revenues for rental sales, assembly or other sales are not recognised in the appropriate accounting period
Group-wide ERP system provides structures for revenue recognition
Business Controlling reviews revenue recognition on a monthly basis
Rental equipment is not appropriately valued in the financial statements
Condition of rental equipment is evaluated during and after the rental period
Process for systematic assessment of the rental equipment impairment is implemented
Provision for bad debt is not calculated based on Group’s guidelines
Credit policy sets forth principles for credit management Aged receivables are assessed on a monthly basis and bad debt provision is calculated in accordance with the Group Policy
ANNUAL REPORT WITH BOARD OF DIRECTORS’ REPORT AND FINANCIAL STATEMENTS 49
BOARD OF DIRECTORS’ REPORT
Dividend and dividend policy
Adapteo’s target is to distribute a dividend of at least 20% of the net result of the group (excluding items affecting comparability).
Adapteo’s share and owners
Share price performance
Since the first day of trading until 31 December 2019, the price of Adapteo’s share declined 13.6%. During the same period, the OMX Stockholm PI Index increased 9.7%. The closing price of Adapteo’s share at year-end was SEK 114.98. The highest price paid for Adapteo’s share during the year was SEK 135.90, which was noted on July 2 2019. The lowest price paid was SEK 101.22 on October 31 2019.
Share turnover and trading
Since July 1, 2019 the volume of Adapteo’s shares traded on Nasdaq Stockholm was about 12.8 million, corresponding to a value of approximately SEK 1,505 million. Average daily trading for Adapteo’s shares on Nasdaq Stockholm amounted to approximately 100 000 shares, corresponding to a value of approximately SEK 11.7 million. The turnover velocity was 96%.
Adapteo’s share is listed on Nasdaq Stockholm, Mid Cap since July 1 2019. The total number of shares as of 31 December 2019 was 44,682,697.
Quick facts
Market place Nasdaq Stockholm Mid Cap
Segment/sector Financials
No of shares 44,682,697
Market cap as of Dec 31 2019 MSEK 5,138
ISIN code FI4000383898
Ticker symbol Nasdaq ADAPT
Leif Gustafsson, President and CEO of Cramo together with Philip Isell Lind af Hageby, President and CEO of Adapteo on Adapteo Plc's listing day on Nasdaq Stockholm.
ANNUAL REPORT WITH BOARD OF DIRECTORS’ REPORT AND FINANCIAL STATEMENTS 50
At year-end 2019, the total number of shareholders in Adapteo was 9,580. The proportion of foreign ownership was 65.7% of the number of shares and votes in Adapteo. One owner represented at least 10% of the voting inter-ests for all shares in the company. EQT Public Value Investments S.à r.l. represented 6,731,743 shares, corresponding to 15.1% of total number of shares and votes.
Source: Nasdaq
ANNUAL REPORT WITH BOARD OF DIRECTORS’ REPORT AND FINANCIAL STATEMENTS 51
BOARD OF DIRECTORS’ REPORT
Group Treasury and Risk Management is responsible for maintain the risk management policy and operating model and facilitating the practical implementation of risk management procedures. The annual cycle sets forth the framework for risk management activities. Fa-cilitation includes also assisting the Group management for preparation of annual risk assessment to the Board of Directors. Group Treasury also has the operational responsibility for financial risk management under the Group Treasury policy which has been approved by the Board of Adapteo.
Enterprise risk management and main risksAdapteo Group’s annual risk management process consists of risk identification, risk assessment, risk management, risk monitoring and risk reporting. The risk management framework fosters awareness of risk and control throughout the organisation and supports informed decision making. Continuous communication and dialog are necessary to promote risk awareness throughout Adapteo Group and to ensure successful integration of risk management into strategic planning, budgeting, daily decision-making and operations.
As a result of risk management process, Adapteo’s main risks have been identified for which mitigation plans and activities have been defined, implemented and further monitored throughout the year. Accord-ing to the annual cycle, the Group management risk workshop has concluded on the main risks for Adapteo Group, which are reviewed in the Board of Directors periodically. A risk overview, summary of identified main risks and mitigation activities for Adapteo Group are presented on the following pages.
Enterprise risk management emphasizes the role of cor-porate culture and is an integrated part of operations, planning and decision-making in Adapteo Group.
ResponsibilitiesAdapteo Group’s risk management governance is based on a three lines of defense model. The roles and responsibilities of various organisational bodies are described in the pertinent documents of Adapteo, such as charters and job descriptions. This model helps the Board of Directors and management at all levels of the company to properly address risks and opportunities the company is facing, and as result enhance capabil-ities to create, preserve and ultimately realise value. Risk management responsibilities have been assigned:
Board of Directors is ultimately responsible for en-suring that risk management is properly organised in Adapteo Group. The Board defines the risk appetite continuously, according to the current conditions. The Board Audit Committee is responsible for monitoring that Adapteo Group risk management process operates effectively.
Business Units and Group Functions are responsible for identifying, assessing, managing and performing risk mitigation activities as a part of day-to-day business activities. Risks are identified taking into account local market conditions, business operations and surrounding risk factors.
Risk management
All business activities are exposed to risks varying in likelihood and impact. The primary objective of risk management in Adapteo Group is to support the company’s strategy execution, continuity of operations and realisation of business objectives by anticipating any risks involved in the Group’s operations and managing them in a proactive manner.
ANNUAL REPORT WITH BOARD OF DIRECTORS’ REPORT AND FINANCIAL STATEMENTS 52
BOARD OF DIRECTORS’ REPORT
Risk overview
Risk Risk description
Business and IT integration
Adapteo's business operations are dependent on the integration of business require-ments and IT capabilities.
Failures in integration may affect the efficiency of operations and the correctness of both internal and external reporting.
Global economic and financial conditions
Adapteo's business is exposed to general economic conditions. Economic fluctuations may affect demand, supply and financing of operations.
Competition environment
Adapteo operates in a highly competitive market environment with growing competitor presence.
Market position is dependent on continuous operational development.
Brand awareness Adapteo's brand awareness in the market may be affected by the relatively young age of the company.
This may affect Adapteo's ability to attract new customers especially in emerging markets.
Employees Strategy execution is highly dependent on personnel resources. Both availability and possible loss of key personnel may have a material adverse effect on strategy implementation.
Operating platform scalability
Growth of Adapteo's business operations is dependent on the scalability of the compa-ny's operating platform.
Failures in operating model adaptation and development may affect Adapteo's ability to reach its growth targets.
Regulatory changes Adapteo's business is subject to various regulatory requirements. Changes in legislation and official regulations may have material impacts on business and operations.
Initiative prioritisation As a relatively young independent listed company, Adapteo has multiple development projects ongoing simultaneously.
Insufficient prioritisation and staffing of internal initiatives may affect core business operations.
Compliance risks Adapteo's governance, risk and compliance processes may fail to meet internal and external requirements resulting in possible regulatory penalties, reputational harm and fraud.
Performance management
Failures in performance management and its alignment with Adapteo's strategic and operational targets may adversely affect the company's ability to reach its targets.
Project lifecycle management
Adapteo has a standardised project sales, delivery and management model which aims to harmonise project lifecycle management related processes and activities.
Failures in adapting and following the project lifecycle management process may cause process inefficiencies and margin losses.
Project pricing and profitability
Inability on implement company level pricing strategies, related processes and tools may increase the risk of cost overruns and margin slippages.
Risk of not being able to price projects taking into account market competition and dynamics.
Fleet management Adapteo's business is dependent on effective fleet management. Inefficiencies in fleet management may affect Adapteo's ability to take advantage of sales and rental opportunities, cause additional costs, impair brand value and lead to damage liabilities.
Health and safety risks Managing risks related to occupational health and safety are in a key role considering the inherent dangers related to modular assembling sites.
Failure to do so may result in injuries, serious or even fatal accidents.
Company culture and internal communication
Adapteo's company culture and the clarity of internal communication are key drivers for organisational success and job satisfaction.
Failures in maintaining, developing and communicating Adapteo culture may result in weakened job satisfaction and create organisational silos affecting Adapteo's future success.
ANNUAL REPORT WITH BOARD OF DIRECTORS’ REPORT AND FINANCIAL STATEMENTS 53
BOARD OF DIRECTORS’ REPORT
Key risks and mitigation activities
Identified key risks Risk mitigation activities
Global economic and financial conditionsAdapteo’s business is exposed to general economic condi-tions. Economic fluctuations, and slow or negative economic growth could have a negative impact on Adapteo’s business, financial condition and results of operations in several differ-ent ways, including weakened demand, increased expenses as well as suppliers, contractors or Adapteo’s customers experi-encing difficulties in meeting their contractual obligations.
Adapteo constantly monitors the economic and geopolitical situation and actively adapts its operations and strategies in order to mitigate risks related global economic and financial conditions.
Competition environmentAdapteo operates in a competitive market where both new competitors have emerged and existing competitors have expanded their presence. Adapteo’s market position is de-pendent on the continuous development of services, products and production methods and processes, as well as customer relationships.
Adapteo performs ongoing market and competitor analysis to gain understanding of the competition environment, pricing factors and emerging solutions. Through ongoing service, fleet and process development Adapteo is able to provide a broad range of different solutions to match customer needs and enable fast delivery and matching demand and supply. Additionally, Adapteo performs customer surveys to ensure optimisation between fleet specifications and customer needs.
EmployeesAdapteo’s success and the execution of its strategy is dependent on its ability to recruit, retain and develop highly qualified, motivated and skilled personnel. The availability and loss of key personnel may have a material adverse effect on Adapteo’s business.
Adapteo actively maps its existing competencies with business needs. Recruitments are proactively planned and performed in order to ensure an optimised mix of personnel resources. Succession plans are maintained for key personnel to mitigate possible risks related to employment termination. Employment terms are actively assessed against market prac-tices to ensure competitive advantage.
Regulatory changesAdapteo’s business is subject to regulatory requirements concerning, for example, building, zoning, environmental and safety regulations. Changes in general or local legislation and official regulations could have a material impact on Adapteo’s business and result of operations especially in the form of higher costs caused by significant modification costs or even scrapping of modules.
Adapteo is in active communication with regulators and continuously analyses the regulatory environment including current and upcoming changes in general and local legislation in the respective countries that the company operates in. Based on the analysis, impact assessment is performed, and action plans prepared and implemented to allow for proactive adaptation of operating methods and possible fleet specifica-tion changes in relation to regulatory requirements.
Fleet managementEffective management of Adapteo’s fleet is crucial to the success of Adapteo’s business. Failure to properly manage the design, manufacturing, repair and maintenance of its fleet could adversely affect Adapteo’s ability to take advantages of sales and rental opportunities, cause additional upgrade and refurbishment costs or even impairment losses for modules that are beyond economic repair, impair brand value or lead to liabilities to pay damages.
Adapteo actively analyses fleet composition against market demand in order to ensure a high fleet utilisation ratio and optimised fleet specifications. Fleet inspection, maintenance and stocktaking processes are under continuous development to ensure the high quality of fleet. Slow moving fleet items are actively tracked and disposed if necessary. Depreciation schemes are assessed on an ongoing basis to ensure the cor-rectness and reliability of financial reporting.
Health and safety risksManaging risks related to occupational health and safety are in a key role considering the inherent dangers related to mod-ular assembling sites. Failure to do so may result in injuries, serious or even fatal accidents.
Adapteo focuses on prevention of accidents through relevant and regular employee safety training and safety communica-tion in accordance with guidelines and operating procedures. Adapteo aim to closely monitor the development of occupa-tional safety ratios at all levels of the company and performs root cause analysis to ensure ongoing development of health and safety precautions. The group has committed to conduct consistent work to strengthen occupational health and safety culture.
ANNUAL REPORT WITH BOARD OF DIRECTORS’ REPORT AND FINANCIAL STATEMENTS 54
BOARD OF DIRECTORS’ REPORT
Board of Directors
PETER NILSSON
Chairman of the Board of Directors since 2019Born 1962. Swedish citizen. Independent of the company and its major shareholder.
Education Attended the Stockholm School of Economics.
Primary work experience President and CEO of Sanitec Corporation 2010−2015. CEO of Duni AB 2004−2007. Various Senior Management positions, Swedish Match Group, 1987−2003.
Current positions of trust Board Chairman: Lindab International AB, Unilode Aviation Solu-tions International AG and Poleved Industrial Performance AB. Board member: Cramo Plc, Team Tråd & Galler Holding AB, J.H. Tidbeck AB, Lindab LTIP17-19 AB, Signtronic Produk-tion AB, Kylpanel i Nassjö AB, Sandur ehf. and Dagar ehf.
Share ownership According to shareholders’ register of Adapteo as at 31 December 2019: 1,916 shares. Peter Nilsson also holds, through Poleved Industrial Performance AB, a company controlled by Mr. Nilsson, 31,682 Adapteo shares.
CARINA EDBLAD
Member of the Board of Directors since 2019 Born 1963. Swedish citizen. Independent of the company and its major shareholder.
Education M.Sc. (Engineering) and leadership program at Ruter Dam.
Primary work experience CEO of Thomas Be-tong AB. Various Senior Management positions in Skanska, 1986−2011.
Current positions of trust Board Chairman: Svensk Betong Service AB. Board member: Thomas Betong AB, Instalco Intressenter AB and ERMCO (European Ready Mixed Concrete Organisation).
Share ownership According to shareholders’ register of Adapteo as at 31 December 2019: 0 shares.
OUTI HENRIKSSON
Member of the Board of Directors since 2019Chairman of the Audit Committee 2019-Born 1969. Finnish citizen. Independent of the company and its major shareholder.
Education M.Sc. (Econ.)
Primary work experience CFO and a member of the Executive Committee of Aktia Bank plc. CFO and a member of the Group Management Team of VR-Group Ltd 2012–2017.
Current positions of trust Board member: Veikkaus Ltd and Aktia Life Insurance Ltd.
Share ownership According to shareholders’ register of Adapteo as at 31 December 2019: 0 shares.
ANDREAS PHILIPSON
Member of the Board of Directors since 2019Born 1958. Swedish citizen. Independent of the company and its major shareholder.
Education M.Sc. (Engineering), Harvard Business School Executive Program of Service Profit Chain and ABB International Business Unit Program.
Primary work experience CEO and Founder of T.A.M. Group AB. CEO Catena AB 2011–2013.
Current positions of trust Board Chairman: Several subsidiaries of T.A.M. Group AB. Board member: Stendörren Fastigheter AB and Besqab AB (publ).
Share ownership According to shareholders’ register of Adapteo as at 31 December 2019: 0 shares.
JOAKIM RUBIN
Member of the Board of Directors since 2019Member of the Audit Committee 2019-Born 1960. Swedish citizen. Independent of the company, dependent on a company's major shareholder.
Education M.Sc. (Industrial Engineering and Management).
Primary work experience Partner of Public Value advisory team of EQT Partners AB. Founding Partner of Zeres Capital Partners AB 2013–2018. Senior Partner and Head of Public Market Fund of CapMan Plc 2008–2015. Sev-eral positions e.g. Head of Corporate Finance and Debt Capital Markets, Handelsbanken Capital Markets 1995–2008.
Current positions of trust Board Chairman: Hoist Finance AB (publ), HOIST Kredit AB and ÅF Pöyry AB (publ).
Share ownership According to shareholders’ register of Adapteo as at 31 December 2019: 1,916 shares.
ANNUAL REPORT WITH BOARD OF DIRECTORS’ REPORT AND FINANCIAL STATEMENTS 55
BOARD OF DIRECTORS’ REPORT
Group management team
PHILIP ISELL LIND AF HAGEBY
President and CEO and the Executive Vice President, Rental Space Busi-ness AreaBorn 1984, M.Sc. Economics
Previous positions Prior to the demerger of Cramo in 2019, Mr. Isell Lind af Hageby served as Cramo’s Executive Vice President, Modular Space. Previously, Mr. Isell Lind af Hageby served as Managing Director of Inwido Norway and as Senior Vice President for the company’s Norwe-gian business area between 2016 and 2017 and held various positions at SCAN COIN between 2012 and 2015.
Current positions of trust -
Share ownership According to shareholders’ register of Adapteo as at 31 December 2019: 3,582 shares
ERIK SKÅNSBERG
Interim CFOBorn 1964, M.Sc Economics
Previous positions Erik Skånsberg has an extensive background from senior financial and CFO positions from both listed and privately held companies, such as Addtech, Enviro-tainer and Kinnarps.
Share ownership According to shareholders’ register of Adapteo as at 31 December 2019: 0 shares
MAGNUS TINGLÖF
Executive Vice President, Permanent Space Business Area, IB Diploma Business and Management Pro-gramme Born 1970Previous positions Before joining the company in 2019 Mr Tinglöf served as the Managing Director of Elitfönster Industri and Executive Managing Director of Etrifönster AB. Previously, he has served as the Executive Managing Director of Elitfönster På Plats AB and has held various positions at Telesteps AB and at Cloetta AB.
Share ownership According to shareholders’ register of Adapteo as at 31 December 2019: 0 shares
Previous positions Prior to the de-merger of Cramo in 2019, Mr Persson served as the HR Business Partner of Cramo’s Modular Space division, Cramo Adapteo. Mr Persson has previously worked as a management consultant specialising in organisa-tion and HR at Knowit HRM AB and as a HR-Generalist at Pricewater-houseCoopers AB.
Share ownership According to shareholders’ register of Adapteo as at 31 December 2019: 175 shares
Previous positions Prior to the de-merger of Cramo in 2019, Mr Saarela served as the Head of Corporate Development of Cramo’s Modular Space division, Cramo Adapteo. Mr Saarela has held various managerial positions within Cramo’s Modular Space division since joining the com-pany in 2013. Previously, Mr Saarela has also held positions in financial management at Rautaruukki and Thermo Fisher Scientific between 2008 and 2013.
Share ownership According to shareholders’ register of Adapteo as at 31 December 2019: 1,245 shares
HANNA WENNBERG
Senior Vice President Marketing, Communications and SustainabilityBorn 1986, Studies in Strategic Communications and Rhetoric at Örebro University
Previous positions Ms Wennberg served as the Head of Marketing of the AI and analytics company Graviz Telescope in 2018-2019. Ms Wennberg has held various manage-rial marketing and communications positions at Atlas Copco and has also been a member of the Advisory Board of the Association of Swedish Advertisers.
Share ownership According to shareholders’ register of Adapteo as at 31 December 2019: 0 shares
NIKLAS ALM
Interim Senior Vice President Investor RelationsBorn 1967, B.Sc Economics
Previous positions Mr Alm has wide experience from several senior positions in investor relations and financial communication in a variety of companies, such as Dustin, San-itec and Stronghold Invest.
Share ownership According to shareholders’ register of Adapteo as at 31 December 2019: 550 shares
ANNUAL REPORT WITH BOARD OF DIRECTORS’ REPORT AND FINANCIAL STATEMENTS 56
BOARD OF DIRECTORS’ REPORT
Key figures, pro formaKey figures have been presented on a pro forma basis for years 2019 and 2018 unless otherwise stated. Comparable pro forma information and key figures for the year 2017 are not available and thus not presented.
ed on 30 June 2019 and the subsequent refinancing as if these transactions had been completed on 1 January 2018. For more information on pro forma information and related compilation principles has been presented in the Appendix 2 to the Financial Statement Release published on 14 February 2020 available on our website.
Definitions and reasons for use of key figures have been presented on page 122.
Pro forma financial information has been presented for the years 2019 and 2018 to improve the compa-rability of financial information and it illustrates the impacts of the Nordic Modular Group (NMG) acquisition completed on 31 October 2018, the demerger complet-
EUR millions or as indicated 2019 2018Net sales 216.2 220.6
Rental sales 132.7 128.8
Net sales growth in constant currency, % -0.2
Rental sales growth in constant currency, % 4.6
Comparable EBITDA 88.5 83.6
Comparable EBITDA margin, % 40.9 37.9
EBITDA 76.1 78.4
EBITDA margin, % 35.2 35.5
Comparable EBITA 37.2 50.6
Comparable EBITA margin, % 17.2 22.9
Operating profit (EBIT) 22.1 42.6
Operating profit (EBIT) margin, % 10.2 19.3
Profit for the period 8.6 28.3
Earnings per share, EUR 0.19 0.63
Comparable earnings per share, EUR 0.61 0.73
Net debt / comparable EBITDA 2 4.5
Operative ROCE, % 8.5 12.1
Operating cash flow before growth capex 1 65.7 57.6
Cash conversion before growth capex, % 1 74.2 93.3
Growth capex 1 29.1 46.7
Total sqm of modules 1,009,986 970,447
Utilisation rate, % 84.4 85.3
Average rent per sqm (€/year) 1 158.7 162.8
1 On a carve-out basis2 Based on reported 1-12/2019 figures
Key figures
ANNUAL REPORT WITH BOARD OF DIRECTORS’ REPORT AND FINANCIAL STATEMENTS 57
BOARD OF DIRECTORS’ REPORT
EUR millions or as indicated 2019 2018Items affecting comparability
Costs related to the listing 8.1 1.4
Acquisition and integration related expenses 2.3 3.8
Restructuring costs 2.1
Items affecting comparability in EBIT 12.4 5.2
Acquisition related expenses in net finance costs 0.4
Total items affecting comparability 12.4 5.6
Operating profit (EBIT) 22.1 42.6
Items affecting comparability in EBIT 12.4 5.2
Comparable EBIT 34.6 47.8
Comparable EBIT margin, % 16.0 21.7
Operating profit (EBIT) 22.1 42.6
Amortisation of intangible assets resulting from acquisitions 2.6 2.8
EBITA 24.8 45.4
Items affecting comparability in EBIT 12.4 5.2
Comparable EBITA 37.2 50.6
Comparable EBITA margin, % 17.2 22.9
Operating profit (EBIT) 22.1 42.6
Depreciation, amortisation and impairments 54.0 35.8
EBITDA 76.1 78.4
Items affecting comparability in EBIT 12.4 5.2
Comparable EBITDA 88.5 83.6
Comparable EBITDA margin, % 40.9 37.9
Reconciliation of pro forma operative ROCE
EUR millions or as indicated 2019 2018Net working capital -16.7 -5.9
Property plant and equipment 451.1 423.3
Investments in joint ventures 1.2 1.2
Operative capital employed total 435.6 418.6
Comparable EBITA 37.2 50.6
Operative ROCE, % 8.5 12.1
Reconciliation of certain pro forma key figuresReconciliation of pro forma operative comparable EBIT, comparable EBITA and comparable EBITDA
ANNUAL REPORT WITH BOARD OF DIRECTORS’ REPORT AND FINANCIAL STATEMENTS 58
CONSOLIDATED FINANCIAL STATEMENTS
Consolidated income statement
Consolidated statement of comprehensive income
EUR thousands NoteCarve-out
Full year 2019Carve-out
Full year 2018Net sales 2,3 216,213 151,988Other operating income 4 5,395 1,569Materials and services 5 -78,901 -57,004Employee benefit expenses 7 -33,089 -19,819Other operating expenses 6 -33,538 -19,531Depreciation, amortisation and impairments 8 -53,954 -27,890Share of profit of joint ventures 14 16 -13Operating profit (EBIT) 22,142 29,301
Finance income 3,037 1,657Finance costs -10,787 -5,066Finance costs, net 9 -7,750 -3,410
Profit before taxes 14,392 25,891
Income taxes 10 -6,001 -4,978Profit for the year 8,392 20,913
Attributable to owners of the parent 8,392 20,913
Earnings per share, basic, EUR 29 0.19 0.47Earnings per share, diluted, EUR 1 29 0.19 0.47
1 Calculated using the number of Adapteo shares issued as demerger consideration of 44,682,697 for all periods presented prior to the demerger.
EUR thousandsCarve-out
Full year 2019Carve-out
Full year 2018Profit for the year 8,392 20,913Other comprehensive incomeItems that may be reclassified subsequently to profit or loss:Translation differences -3,814 2,002Other comprehensive income for the year, net of tax -3,814 2,002Total comprehensive income for the year 4,578 22,915
Attributable to owners of the parent 4,578 22,915
The notes are an integral part of these consolidated financial statements.
CONSOLIDATED FINANCIAL STATEMENTS
ANNUAL REPORT WITH BOARD OF DIRECTORS’ REPORT AND FINANCIAL STATEMENTS 59
Current assetsInventories 15 4,372 6,838Finance lease receivables 21 4,314 5,244Trade and other receivables 16 70,707 55,585Income tax receivables 3,181 3,044Derivative financial instruments 23,24 201Cash and cash equivalents 20 3,760 2,377Total current assets 86,537 73,089TOTAL ASSETS 747,008 708,735
EQUITY AND LIABILITIESEquity attributable to owners of the parentShare capital 10,000Reserve for invested unrestricted equity 67,799Translation differences -3,674 140Profit for the period 8,392Retained earnings 107,669Invested equity 22 214,487Total equity 22 190,186 214,627
Current liabilitiesBorrowings 19 1,564 30,468Trade and other payables 17 91,828 68,330Income tax liabilities 3,530 1,318Derivative financial instruments 23,24 718Provisions 18 338Total current liabilities 97,639 100,455Total liabilities 556,822 494,108TOTAL EQUITY AND LIABILITIES 747,008 708,735
ANNUAL REPORT WITH BOARD OF DIRECTORS’ REPORT AND FINANCIAL STATEMENTS 60
CONSOLIDATED FINANCIAL STATEMENTS
Consolidated statement of changes in equity
Attributable to owners of Adapteo
EUR thousandsInvested
equityShare
capital
Reserve for invested
unrestricted equity
Retained earnings
Translation differences
Total equity
At 1 Jan 2019 214,487 140 214,627IFRS 16 transition At 1 Jan 2019 adjusted 214,487 140 214,627Profit for the period 8,380 8,380Other comprehensive income
Translation differences -6,022 -6,022Total comprehensive income 8,380 -6,022 2,358
Share-based payments -770 -770Equity transactions with Cramo Group 19,712 19,712
Demerger at 30 June 2019 -241,809 10,000 67,7991 115,5131 -48,497At 30 June 2019 10,000 67,799 115,513 -5,881 187,4311,2
Changes after the demerger (1 July - 31 Dec 2019)
Profit for the period 11 11Other comprehensive income
Translation differences 2,206 2,206Total comprehensive income 11 2,206 2,217
1 Reserve for unrestricted equity formed in the demerger and total equity have been increased by a correction of EUR 836 thousand with a corresponding
decrease in other payables at the demerger date 30 June 2019. Retained earnings and total equity have been decreased by a correction of EUR 173 thou-
sand at the demerger date 30 June 2019.
2 The total equity has decreased as at 30 June 2019 mainly due to portion of Cramo's external general debt transferred to Adapteo in accordance with the
demerger plan as well as decreases in allocated carve-out debt balances prior to the demerger. Net of these items has increased the amount of borrowings
and decreased the amount of total equity. Refer to carve-out accounting policy in chapter 1.4.5.
EUR thousandsInvested equity and
retained earningsTranslation
differencesTotal invested
equityAt 1 Jan 2018 212,270 -1,862 210,409IFRS 9 transition -12 -12IFRS 15 transition 255 255IFRS 2 transition 384 384At 1 Jan 2018 adjusted 212,897 -1,862 211,036Profit for the year 20,913 20,913Other comprehensive income
Translation differences 2,002 2,002 Total comprehensive income 20,913 2,002 22,915
Share-based payments 200 200Equity transactions with Cramo Group -19,523 -19,523
At 31 Dec 2018 214,487 140 214,627
ANNUAL REPORT WITH BOARD OF DIRECTORS’ REPORT AND FINANCIAL STATEMENTS 61
CONSOLIDATED FINANCIAL STATEMENTS
Consolidated statement of cash flows
EUR thousands NoteCarve-out
Full year 2019Carve-out
Full year 2018 Cash flow from operating activitiesProfit before taxes 14,392 25,891Adjustments:
Depreciation, amortisation and impairment 8 53,953 27,890Share of profit of joint ventures 14 -16 13Other non-cash adjustments -669 -1,886Net gain on sale of property, plant and equipment 4 -3,290 -847Share-based payments 7 342 369Finance costs, net 9 7,750 3,410
Cash generated from operations before changes in working capital
72,486 54,840
Change in working capitalChange in inventories 2,342 2,511Change in trade and other receivables -16,083 -1,262Change in trade and other payables 30,973 6,212
Change in working capital 17,232 7,460Change in finance lease receivables 2,271 922Cash generated from operations before financial items and tax 91,989 63,222
Interest paid -6,677 -2,307Interest received 411 29Other financial items, net -2,983 -967Income taxes paid -2,614 -1,957Net cash inflow from operating activities 80,126 58,020
Cash flow from investing activitiesPayments for property, plant and equipment -76,604 -68,057Payments for intangible assets -424 -280Proceeds from sale of property, plant and equipment and intan-gible assets
12,392 11,565
Acquisition of subsidiaries and business operations, net of cash acquired
12 -751 -139,001
Net cash (outflow) from investing activities -65,386 -195,773
Cash flow from financing activitiesRepayments of demerger related liabilities to Cramo Plc -28,514Proceeds from bank loans 19 453,000 209,637Repayment of bank loans 19 -439,832 -63,655Change in other current borrowings -5,012 1,911Net proceeds from / repayment of (-) in loans from Cramo Group 19 -12,248 15,156Lease payments 19 -3,817 -561Equity financing with Cramo Group, net 23,136 -22,519Net cash inflow from financing activities -13,287 139,970
Change in cash and cash equivalents 1,453 2,216Cash and cash equivalents at beginning of the year 20 2,377 159Exchange differences -70 2Cash and cash equivalents at year end 3,760 2,377
ANNUAL REPORT WITH BOARD OF DIRECTORS’ REPORT AND FINANCIAL STATEMENTS 62
CONSOLIDATED FINANCIAL STATEMENTS
Notes to the consolidated financial statements
BACKGROUND AND BASIS OF PREPARATION
1 BACKGROUND AND BASIS OF PREPARATION
1.1 BackgroundAdapteo Plc (the “Parent company” or the “Company”) with its subsidiaries (together, “Adapteo” or “Group”) is a leading Northern European provider of modular space solutions. Adapteo operates in Sweden, Finland, Nor-way, Denmark and Germany. Adapteo is a new brand with over 30 years of experience, born from the acquisition of Nordic Modular Group and the demerger from Cramo Plc (“Cramo”). Adapteo offers premium modular space solutions to schools, daycare centers, offices, accommodation and events for temporary and permanent needs.
Adapteo Plc was established through the partial de-merger of Cramo Plc on 30 June 2019 (“demerger”) when all the assets, debts and liabilities belonging to Cramo’s Modular Space business transferred to Adapteo Plc. The company’s shares are listed on the Main Market of Nasdaq Stockholm AB as of 1 July 2019.
Adapteo Plc is domiciled in Vantaa, and its registered address is Äyritie 12 B, 01510 Vantaa, Finland. The copies of the consolidated financial statements are available at www.adapteogroup.com.
The consolidated financial statements and the financial statements of the parent company were authorised for issue by the Board of Directors on 27 March 2020.
1.2 Adapteo’s businessAdapteo offers premium modular space rental and rent-al related services. Adapteo’s solutions are high quality, flexible, cost-effective, energy-efficient and sustainable, and they deliver a user experience comparable to that with permanent buildings. They are especially designed to meet the demanding needs and requirements that apply to tem-porary space solutions for schools, daycares, offices and accommodation, but are also used for events, exhibitions, shops and other application areas, to name a few.
Adapteo serves both the public and private sector and delivers comprehensive temporary space solutions as turn-key projects, including needs analysis, design, planning, assembly, maintenance and other services during the rental period as well as disassembly. Adapteo has operations in five geographical areas: Finland, Sweden, Norway, Denmark and Germany.
1.3 Basis of preparationThe consolidated financial statements of Adapteo have been prepared in accordance with International Financial Reporting Standards (IFRS) as adopted by the European Union, including International Accounting Standards (IAS) and the SIC and IFRIC interpretations valid on 31 December 2019. The notes of the consolidated financial statements also conform to the requirements of the Finnish accounting and corporate legislation which supplement the IFRS.
Adapteo has not formed a legal group before 30 June 2019. In these consolidated financial statements, the bal-ance sheet figures as at 31 December 2019 and consolidat-
ed income statement and cash flow statement information for the period 1 July – 31 December 2019 are based on ac-tual consolidated figures. The income statement and cash flow statement information for the year ended 31 Decem-ber 2019 is a combination of actual consolidated informa-tion for the period 1 July – 31 December 2019 and carve-out financial information for the period 1 January – 30 June 2019. The comparative figures for the year 2018 are fully based on carve-out financial information and accounting policies on the carve-out basis are set out below.
The consolidated financial statements have been prepared on a going concern basis and under the historical cost convention, except for derivative financial instruments and share-based payments.
These consolidated financial statements are presented in thousands of euros, except when otherwise indicated. All figures presented have been rounded which may cause, for example, the sum of individual figures to deviate from the presented sum total.
1.4 Principles applied in preparing the carve-out financial information for the year 2018 and for the six months period January-June 2019The carve-out financial information of Adapteo for the year ended 31 December 2018 and the carve-out financial information for the six months period ended 30 June 2019 included in the consolidated financial statements for the year ended 31 December 2019 have been prepared on a carve-out basis from the Cramo’s consolidated financial statements using the historical income and expenses, assets and liabilities and cash flows attributable to Adapteo business. The carve-out financial information also includes certain Cramo parent company’s and Cramo Services AB’s income, expenses, assets, liabilities and cash flows which will either be transferred to Adapteo or which have been allocated to Adapteo for the purpose of preparation of the carve-out financial information.
The carve-out financial information does not neces-sarily reflect what the combined results of operations, and financial position would have been had Adapteo existed as a separate independent legal group from 1 January 2018 and had it therefore presented stand-alone consolidated financial statements during the periods presented. Further, these may not be indicative of Adapteo’s future perfor-mance, financial position or cash flows.
The carve-out financial information has been prepared on a going concern basis and under the historical cost con-vention, except otherwise mentioned in relevant account-ing policy.
The carve-out financial information has been prepared in accordance with International Financial Reporting Stand-ards (“IFRS”) as adopted by the European Union, under consideration of the principles for determining which assets and liabilities, income and expenses as well as cash flows are to be assigned to Adapteo.
ANNUAL REPORT WITH BOARD OF DIRECTORS’ REPORT AND FINANCIAL STATEMENTS 63
CONSOLIDATED FINANCIAL STATEMENTS
IFRS does not provide guidance for the preparation of carve-out financial information, and accordingly in prepar-ing the carve-out financial information certain accounting conventions commonly used for the preparation of histor-ical financial statements for inclusion in prospectus have been applied. The application of these conventions has been described below.
Carve-out financial information includes the financial information of the following legal entities and business units (“Adapteo entities”) forming Adapteo business:
- Adapteo Holding AB (formerly Nordic Modular Group Holding AB) and its subsidiaries (together “Nordic Modu-lar Group”, “NMG”)) as from 31 October 2018
- Adapteo GmbH (formerly Cramo Adapteo GmbH)
- Adapteo AB (formerly Cramo Adapteo AB)
- Adapteo Finland Oy (formerly Cramo Adapteo Oy) as from 1 June 2018, and Adapteo business included in Cra-mo Finland Oy from 1 January 2018 to 31 May 2018
- Adapteo AS (formerly Cramo Adapteo AS) as from 1 July 2018, and Adapteo business included in Cramo AS from 1 January 2018 to 30 June 2018
- Adapteo A/S (formerly Cramo A/S)
- Assets, liabilities, income and expenses and cash flows from the demerging Cramo Plc and Cramo Services AB that are attributable to Adapteo business.
Carve-out financial information includes the allocations of income, expense, assets, liabilities and cash flows which are based on management judgement, assumptions and esti-mates as described below. The most significant estimates, judgements and assumptions relate to the allocation of costs of certain centrally provided services, cash manage-ment and financing related allocations, determination of current and deferred income taxes and invested equity.
Accordingly, management considers that the carve-out allocations have been made on a reasonable basis but are not necessarily indicative of the revenues and expens-es that would have been incurred if Adapteo had been a stand-alone entity preparing consolidated financial state-ments for the periods presented.
The following summarises the accounting and other prin-ciples applied in preparing carve-out financial information.
1.4.1 Intercompany transactions and transactions with related partiesIntercompany transactions, including assets and liabilities between Adapteo entities have been eliminated from the carve-out financial information. The carve-out financial information includes Adapteo’s transactions and balance sheet items. Intercompany transactions and balance sheet items with other Cramo Group companies previously con-sidered as intercompany transactions in Cramo reporting have been treated as transactions with related parties until the completion of the demerger.
Cramo Plc’s intercompany receivables and liabilities due to or due from Adapteo entities, other than intercompa-ny loan balances due from Adapteo entities as described under “Cash management and financing” below, have been allocated to Adapteo, including finance income and costs relating to these receivables and liabilities.
Carrying values for subsidiary shares of Adapteo subsid-iaries previously owned by Cramo’s parent company have
been allocated to Adapteo. The acquisition method has been used to eliminate the acquisition cost of subsidiaries.
1.4.2 Invested equityAs Adapteo has not formed a separate legal group nor pre-sented any stand-alone consolidated financial statements prior to the completion of the demerger, it has not been feasible to present share capital or an analysis of equity reserves prior to the demerger. Until 30 June 2019 the net assets of Adapteo are represented by capital invested in Adapteo and shown as “Invested equity” in the consolidat-ed balance sheet comprising of cumulative translation dif-ferences as well as invested equity and retained earnings.
Changes in net assets allocated to Adapteo are present-ed separately in the consolidated statement of changes in invested equity through line “Equity transactions with Cramo Group” and in the cash flow statements through the line-item “Equity financing with Cramo Group, net”, reflect-ing the internal equity financing between Cramo Group and Adapteo during the presented periods. The amount of which is affected by the net assets allocated to Adapteo entities consisting of allocation of income and expenses and assets and liabilities of Cramo Plc, Cramo Services AB and other Cramo Group entities comprising of both Adapteo and Equipment Rental businesses.
The carve-out financial information is presented in euros, which will be Adapteo’s parent company’s functional and reporting currency. Adapteo entities have also other functional currencies. Translation differences arising from translating the results for the period and equity are rec-ognised in the separate cumulative translation differences within total invested equity and their changes are present-ed in other comprehensive income.
1.4.3 Centrally provided services Cramo Group has historically provided services to its subsidiaries, such as Group management, finance and accounting, Modular Space management, human resources, sustainability, information technology, communications, fleet management and group projects & development. Centrally provided services have historically been re-charged from Cramo Group companies for costs that have arisen from services conducted on behalf of the Cramo Group companies. These historically recharged costs have been allocated to Adapteo entities and are included in the carve-out financial information.
Cramo’s parent company and Cramo Services AB have also been responsible for the management and gener-al administration of Cramo Group. For the purposes of the preparation of the carve-out financial information a portion of Cramo’s parent company’s and Cramo Service AB’s shared income and expense items relating to Cramo Group management and general administration which have historically not been allocated to subsidiaries are allocated to Adapteo. Allocations of the income and expense items are based on the sales or specific identificators such as project and users or based on number of employees, which the management believes to be an appropriate allocation principle.
These allocated income and expense items were affect-ed by the arrangements that existed in Cramo Group and are not necessarily representative of the position that may prevail in the future for Adapteo.
ANNUAL REPORT WITH BOARD OF DIRECTORS’ REPORT AND FINANCIAL STATEMENTS 64
CONSOLIDATED FINANCIAL STATEMENTS
1.4.4 Share-based paymentsAdapteo key personnel have historically participated in Cramo’s share-based incentive plans. The carve-out financial information includes employee cost allocations related to these participations based on the actual number of Adapteo employees over the cost recorded at Cramo. In addition, as part of the allocation of the centrally provided services as described under item 1.4.3 above, a portion of share-based payments related to Cramo group’s top management has been allocated to the carve-out financial information. The historical cost allocations may not be in-dicative of the future expenses that will be incurred through incentive schemes that will be established for Adapteo’s key personnel following the demerger.
1.4.5 Cash management and financingCash management is centralised and Cramo Group’s liquidity needs are mainly managed through cash pool ar-rangements. Adapteo’s cash and cash equivalents comprise of cash held by Adapteo legal entities. In the demerger, Adapteo Plc receives a portion of cash and cash equiva-lents of Cramo Plc that represents an amount appropriate for Adapteo’s operations and working capital needs at the time of completion of the demerger. No portion of Cramo Plc’s cash and cash equivalents has been allocated to the carve-out financial information.
Cramo Group’s external financing is centralised and managed by the Cramo parent company. Subsidiaries’ work-ing capital needs have historically been funded mainly by intercompany loans in addition to cash pool arrangements. In order to show the impacts of the historical intercompany financing of Adapteo entities (other than acquired NMG entities in October 2018), the intercompany loan balances including cash pool arrangements due to Cramo parent company have been included as financial liabilities in the carve-out financial information and are presented as relat-ed party transactions. The intercompany loan balances for those Adapteo entities which have historically been part of Cramo legal entities have been allocated to Adapteo based on the respective entity’s historical capital employed ratio. The related interest income and expense in the carve-out financial information have been determined based on the interest charges recorded directly by Adapteo legal entities or allocated to Adapteo entities. In the demerger, Cramo Plc’s intercompany loan receivables from Adapteo entities has been transferred to Adapteo Plc. Accordingly, these intercompany balances have been fully eliminated from Adapteo’s consolidated financial statements after the demerger.
The external debt financing of the demerging Cramo parent company and the related interest expenses that are directly attributable to Adapteo’s operations are included in the carve-out financial information in accordance with the demerger plan, consisting of financing arrangements related to the acquisition of NMG in October 2018. In addi-tion, carve-out financial information comprises the existing external funding arrangements and the related interest expenses of other Adapteo entities.
In connection with the demerger, in addition to external debt amounts directly attributable to Adapteo, a certain amount of Cramo’s external debt has been transferred to Adapteo Plc in accordance with the demerger plan. Cramo has negotiated with the primary financers and has obtained financing commitments for Adapteo consisting of a EUR 400 million term loan facility and a EUR 100 million revolv-ing credit facility, which has been used for refinancing of interest-bearing liabilities transferred to Adapteo in the demerger and financing general corporate purposes. The
carve-out financial information has not been adjusted to reflect the additional portion of Cramo Plc’s external debt to be transferred to Adapteo in the demerger or the effects of the obtained financing commitments.
In addition, the finance costs included in the carve-out financial information may not necessarily represent what the finance costs would have been, had Adapteo historical-ly obtained financing on a stand-alone basis. These costs may not be indicative of the cost of financing that will arise for Adapteo in the future.
1.4.6 DerivativesExternal derivative financial contracts entered into by Cramo have been allocated to Adapteo if those are directly attributable to Adapteo. The derivative financial instru-ments allocated to the carve-out financial information comprise of foreign currency option, swap and currency forwards agreements related to the acquisition of NMG. These arrangements were settled during 2018 and related income and costs are included in the carve-out financial information.
1.4.7 Income taxDuring the periods presented in the carve-out financial information, the legal entities in Adapteo have operated as separate taxpayers. For these entities the tax charges and the tax liabilities and tax receivables in the carve-out financial information are based on actual taxation.
Some of Adapteo entities have historically been in-cluded in Cramo legal entities including operations other than operations of Adapteo. During the periods presented, these Adapteo entities did not file separate tax returns. Tax charges in the carve-out financial information have been determined based on the separate return method, as if Adapteo entities were separate taxpayers in the jurisdiction of their primary operations. The current tax provision is the amount of tax payable or refundable based on Adapteo entity’s hypothetical, current-year separate return and has been recorded as current income tax expense and as a shareholder transaction through invested equity in the carve-out financial information. After computing its current tax payable or refund, Adapteo entity has provided deferred taxes on its temporary differences and on any tax loss carry forwards that it could claim on its hypothetical return. Deferred taxes on temporary differences are recog-nised where such temporary differences exist.
In the carve-out financial information any changes in deferred tax assets relating to Adapteo legal entity’s tax loss carry forwards in Denmark arisen from sold Equipment Rental business prior its disposal in 2017 have been rec-ognised through invested equity as they are deemed to be contributions from or distributions to Cramo Group.
The line item "income taxes paid" in the consolidated cash flow statement reflects current taxes for all carve-out entities as they are deemed to be paid by the respective tax filing group. To the extent that historically there has been no settlement through cash, such tax payments are deemed to be contributions from or distributions to Cramo Group and deemed to be settled immediately through equity. Such settlement through equity is reflected in the line item "Equity financing with Cramo Group, net” in the financing section of the consolidated cash flow statement.
The tax charges recorded in the consolidated income statement are not necessarily representative of the tax charges that may arise in the future.
ANNUAL REPORT WITH BOARD OF DIRECTORS’ REPORT AND FINANCIAL STATEMENTS 65
CONSOLIDATED FINANCIAL STATEMENTS
1.5 Critical accounting estimates and judgementsThe preparation of the carve-out financial information has required management to make estimates and judgements affecting the amounts reported in the carve-out financial information and the accompanying notes. These estimates and judgements, based on historical evidence and plausi-ble future scenarios, have been evaluated at each balance sheet date. Actual results may differ from these estimates and judgements.
The following areas include a high degree of management estimates and assumptions:
Key judgement and estimates NoteCarve-out principles 1.4
Share-based payments 7
Recognition of deferred tax assets and liabilities 10
Useful lives and valuation of property, plant and equipment 11
Fair values of contingent consideration and net assets acquired in business combinations 12
Key assumptions used in impairment testing 13
Determining the lease term 19, 21
PERFORMANCEThis section focuses on the results and performance of Adapteo. It includes disclosures that explain the different components of Adapteo’s performance, employee benefits, operating expenses, finance items as well as information about taxes.
2 SEGMENT INFORMATION
Adapteo offers premium modular space rental and rental related services and sells new modular space solutions.
Adapteo’s operations and profitability is reported as two operating segments, Business Area Rental Space and Business Area Permanent Space, which is consistent with the internal reporting and the way that operative deci-sions related to allocation of resources and assessment of performance have been made by Adapteo’s group manage-
ment team as Adapteo’s chief operating decision maker. Adapteo has not aggregated its operating segments.
Adapteo reports its business area results using EBITDA and comparable EBITDA as the main operating measures. Business Area Rental Space includes the rental of modular space solutions as well as the provision of assembly and other services. Business Area Permanent Space includes sales and long-term leasing of modular space solutions. Adapteo has operations in five geographical areas: Sweden, Finland, Norway, Denmark and Germany.
The information below summarises the financial infor-mation for both business areas based on the business area structure effective as of the completion of the demerger as well as the geographical area information. The comparative information for the year 2018 has been presented to reflect the current business area structure.
Net sales by business area2019
EUR thousandsRental Space
Permanent Space
Group functions Eliminations Group total
Rental sales 129,182 3,546 132,728
Assembly and other services 55,774 55,774
Sales, new modules 998 26,713 27,711
Total external net sales 185,954 30,259 216,213
Inter-segment sales 22,209 -22,209
Net sales 185,954 52,468 -22,209 216,213
Comparable EBITDA 92,342 1,409 -5,220 88,531
Total items affecting comparability -1,179 -610 -10,646 -12,435
EBITDA 91,163 799 -15,866 76,096
Depreciation, amortisation and impairment -53,954
Operating profit (EBIT) 22,142
Finance costs, net -7,750
Profit before taxes 14,392
ANNUAL REPORT WITH BOARD OF DIRECTORS’ REPORT AND FINANCIAL STATEMENTS 66
CONSOLIDATED FINANCIAL STATEMENTS
2018
EUR thousandsRental Space
Permanent Space
Group functions Eliminations Group total
Rental sales 99,947 19 99,966
Assembly and other services 45,814 10 45,824
Sales, new modules 690 5,508 6,198
Total external net sales 146,451 5,537 151,988
Inter-segment sales 2,383 4,125 -6,508
Net sales 148,834 9,662 -6,508 151,988
Comparable EBITDA 64,489 405 -3,141 61,752
Total items affecting compara-bility 4,562 4,562
EBITDA 64,489 405 -7,703 57,191
Depreciation, amortisation and impairment -27,890
Operating profit (EBIT) 29,301
Finance costs, net -3,410
Profit before taxes 25,891
EBITDA = Operating profit (EBIT) + depreciation, amortisation and impairments. Comparable EBITDA = EBITDA + items affect-ing comparability. Items affecting comparability = Material items outside ordinary course of business, such as costs related to the listing, acquisition and integration related expenses, restructuring expenses including redundancy payments.
Net sales 1 by geographical areaEUR thousands 2019 2018
Finland 55,275 36,963
Sweden 114,499 74,461
Norway 9,448 7,350
Denmark 21,510 18,725
Germany 15,481 14,489
Total 216,213 151,988
1 Net sales are presented based on the location of clients.
Assets 1 by geographical areaEUR thousands 2019 2018
Finland 116,459 93,062
Sweden 429,004 441,290
Norway 17,904 16,037
Denmark 51,362 47,100
Germany 38,109 34,825
Total 652,837 632,314
1 Net sales are presented based on the location of clients.
ANNUAL REPORT WITH BOARD OF DIRECTORS’ REPORT AND FINANCIAL STATEMENTS 67
CONSOLIDATED FINANCIAL STATEMENTS
Adapteo provides modular space solutions that are either rented or sold to public sector customers, such as munic-ipalities and private sector customers, such as industrial companies and private enterprises. Net sales include the rental of modular space solutions, assembly and other services and the sale of new modules. Rental sales are rec-ognised in accordance with IFRS 16 and assembly and other services as well as sale of new modules are recognised in accordance with IFRS 15.
Rental salesThe majority of Adapteo’s net sales consists of rental sales generated from leases of temporary modular space solu-tions with contract lengths varying from short-term event business rentals to longer-term, several year contracts to both municipalities and private customers. The primary cus-tomer segments include schools, daycares, offices, health and social care and exhibitions and fairs. Rental sales are derived from both modular space solutions and accessories.
Assembly and other servicesAssembly and other services include short-term services related to on- and off- site transportations, assembly and disassembly of modules, customisations as well as design, planning activities and other smaller service components such as seasonal services during the rental period. The duration of assembly and disassembly services of modular space varies from a few days to several months. Other rev-enue generating services include repair and maintenance services.
Sales, new modulesSales, new modules consist of sale of new modular space solutions. Adapteo provides tailor-made turn-key modu-lar space solutions to both public and private customers. Customers can either buy or enter into a long-term leasing contract with an option to buy the modular space solution after the lease period. Sales, new modules also include the sale recognised in connection with these long-term rental agreements fullfilling the criteria for finance leasing. Inter-est income related to finance leasing is presented as other operating income in note 4.
Accounting policyRevenue recognition
Leases (IFRS 16 for 2019 and IAS 17 for 2018)Rental revenue derived from operational leases is recog-nised on a straight-line basis during the rental period.
A part of Adapteo’s operations include manufacturer/lessor arrangements. Lease agreements that transfer substantially all of the risks and rewards of ownership to the lessee are classified as finance leases. A finance lease of an asset by a manufacturer/lessor gives rise to two types of income: finance income over the lease term (see note 21) and a profit or loss equivalent to that arising on a sale of the leased asset. The sale is recognised when the risks and rewards of ownership of the asset have transferred to the customer. The revenue recognised is the lower of the asset’s fair value or the present value of the minimum lease payments computed at a market rate of interest. The cost of sale is the cost of the leased asset (or carrying amount of the asset, if different) less the present value of any un-guaranteed residual value. The finance income derived from finance lease agreements is allocated to each period during the lease term so as to produce a constant periodic rate of interest on the asset and presented as operating income.
Revenue from Contracts with Customers (IFRS 15)Adapteo’s contracts with customers include both lease and service components. Lease components are treated as leases in accordance with IFRS 16 (as described above). Services are accounted for as revenue under IFRS 15 when considered as separate performance obligations. The con-sideration is allocated to a lease and non-lease component (i.e. services) on the basis of the relative stand-alone prices of the components.
Assemblies of modular spaces or other items and their related transports are generally viewed as a combined customer promise, i.e. the customer is unable to use the temporary modular spaces without the assembly and other services. Therefore, the services seen as an integral part of Adapteo’s rental obligation to provide temporary modular space to a customer and they are not treated as separate performance obligations. Other rental related services are separate performance obligations.
3 SOURCES OF REVENUE
The following table summarises the net sales breakdowns:
EUR thousands 2019 2018
Rental sales 132,728 99,966
Assembly and other services 55,774 45,824
Sales, new modules 27,711 6,198
Total net sales 216,213 151,988
Timing of revenue recognition:
EUR thousands 2019 2018
Products and services transferred at point in time 29,253 6,825
Services transferred over time 54,232 45,196
Total 83,485 52,022
ANNUAL REPORT WITH BOARD OF DIRECTORS’ REPORT AND FINANCIAL STATEMENTS 68
CONSOLIDATED FINANCIAL STATEMENTS
Transaction price is total amount of consideration to which an entity expects to be entitled to in exchange of transfer-ring goods or services to a customer, excluding amounts collected on behalf of third parties (VAT). The total con-sideration may include variable consideration e.g. annual discounts, which are included in the amount recognised as revenue only to the extent that is highly probable that revenue is not reversed later. In some customer agreements a delay due to Adapteo is sanctioned by a penalty fee which constitutes a variable consideration. However, variable considerations related to penalty fees are included in the transaction price as it is highly probable at the inception of the contract that a penalty fee due to delay will not arise. In baked-in contracts the transaction price is also adjusted with a financing component i.e. the timing of payments provides a significant financing benefit either to the vendor or to the customer when it is seen as significant. In general, these financing components are seen as immaterial and therefore transaction prices are not adjusted. In baked-in contracts, assembly and disassembly invoicing is included in the monthly rental charge invoicing for the total contract duration and the contract price is allocated to the lease components and service components due to the fact that services are separate performance obligations.
Transaction price is mainly allocated to each perfor-mance obligation by their observable stand-alone selling prices. Adapteo’s business is based on combined pricing and delivery, thus, discount is evenly allocated on all items.
Revenue from assembly and other services is recognised over time when Adapteo satisfies the performance obliga-
Trade receivables contain receivables from revenue recog-nised in accordance with IFRS 16 and IFRS 15. Contract lia-bilities contain advances received from contracts account-ed for in accordance with IFRS 16 and IFRS 15. Contract
tion by transferring the service to the customer. As a main rule, Adapteo satisfies performance obligations over time during which the services are rendered. Revenue from as-sembly and disassembly services in the beginning and at the end of modular space leasing contracts are recognised over time. Measure of progress is determined by comparing in-curred costs to total costs. Other short-term rental related services are recognised at a point in time upon completion of the services as the time of transferring the control to the customer is relatively short.
Revenue from sales, new modules is recognised when control over the goods or services to a customer are transferred either over time or at a point in time. Sale of new and used equipment constitutes a single performance obligation, containing either a single component or several components such as planning and customisation activities.
Contract balances The contract assets are presented in line accrued income on assembly and accrued income on self-manufactured projects in current trade and other receivables on the balance sheet. The contract liabilities are presented as advances received in current trade and other payables. The following table provides information about receivables, contract assets and liabilities from contracts with custom-ers. The contract liabilities consist of advances arising from customer agreements, as invoicing is often done in advance compared to when the performance obligations of the contracts are satisfied.
assets include accrued income from partially completed as-sembly performance obligations and accrued income from partially completed self-manufacturing projects. These balances are specified in notes 16 and 17.
EUR thousands 31 Dec 2019 31 Dec 2018
Trade receivables 37,858 33,350
Contract assets 25,046 14,280
Contract liabilities 45,595 24,429
Significant change in contract assets and contract liabilities during the financial year are as follows:
EUR thousandsContract
assetsContract liabilities
At 1 Jan 2019 14,280 24,429
Revenue recognised that was included in the contract liability balance at the beginning of the period -16,414
Increases due to new customer agreements including payment schedule arrangements, net of revenue recognised during the period 17,282 37,581
Transfers from contract assets recognised at the beginning of the period to receivables -6,516
At 31 Dec 2019 25,046 45,596
ANNUAL REPORT WITH BOARD OF DIRECTORS’ REPORT AND FINANCIAL STATEMENTS 69
CONSOLIDATED FINANCIAL STATEMENTS
The customer is typically inv oiced with payment term of 14 to 60 days when the service or product is delivered. Part of the service revenue arising from assembly and disas-sembly services is invoiced in advance. Rental revenues are usually invoiced during the same month as the performance obligation is satisfied or one month in advance. Contract assets primarily relate to customer agreements partially completed performance obligations or payment arrange-ments. According to them, the customer is permitted to pay completed assembly services during the rental period as monthly amortisations. Contract liabilities consist of prepayments from customers. A net amount (i.e. a contract
asset or liability) is recognised when the agreed payment schedule for a completed assembly performance obliga-tion and advances from a future disassembly performance obligation relate to the same customer agreement.
Transaction price allocated to the remaining perfor-mance obligationsThe following table includes revenue expected to be recog-nised in the future related to performance obligations that are unsatisfied or partially unsatisfied at the reporting date, including revenue in accordance with IFRS 16.
2019
EUR thousands 20202021 &
subsequent Total
Rental sales 9,586 9,586 19,172
Assembly and other services 9,586 1,965 11,551
Total 19,172 11,551 30,722
2018
EUR thousands 20192020 &
subsequent Total
Rental sales 111,429 89,141 200,570
Assembly and other services 28,123 22,139 50,262
Total 139,552 111,280 250,832
All consideration from contracts with customers is included in the amounts presented above, except for the practical expe-dient in paragraph 121 of IFRS 15. Therefore, Adapteo does not disclose information about remaining performance obligations that have original expected durations of one year or less.
EUR thousandsContract
assetsContract liabilities
At 1 Jan 2018 11,497 17,250
Revenue recognised that was included in the contract liability balance at the beginning of the period -8,699
Increases due to new customer agreements including payment schedule arrangements, net of revenue recognised during the period 9,898 15,878
Transfers from contract assets recognised at the beginning of the period to receivables -10,534
Increases as a result of changes in the measure of progress 2,9471
Business combinations 472
At 31 Dec 2018 14,280 24,429
1 The amount of revenue recognised in 2018 from performance obligations satisfied (or partially satisfied) in previous periods, is mainly due to changes in the estimate of the measure of progress of rental related assembly.
ANNUAL REPORT WITH BOARD OF DIRECTORS’ REPORT AND FINANCIAL STATEMENTS 70
CONSOLIDATED FINANCIAL STATEMENTS
In 2019, administrative costs included EUR 8.1 million costs related to the listing and EUR 2.3 million related to integra-tion costs of NMG acquisition. In 2018, administrative costs included EUR 2.6 million direct transaction and integration costs related to the acquisition of NMG and expenses of
EUR 1.4 million relating to the preparations of the spin-off of Adapteo.
Audit fees included in other operating expenses are specified in note 28.
4 OTHER OPERATING INCOME
Other operating income mainly includes net gains on sale of used modular space and interest income from finance lease receivables.
EUR thousands 2019 2018
Net gains on sale of used modular space 3,293 847
Interest income from finance lease receivables 1,053 200
Insurance compensation 359 130
Other income 690 392
Total 5,395 1,569
5 MATERIALS AND SERVICES
Materials and services include costs incurred related to rental of fleet such as leased furniture and accessories, maintenance and repair costs. Materials and services include also assembly and disassembly cost related to the rental fleet. In addition, materials and services include costs of goods sold related to manufacturing of new modular space solutions.
EUR thousands 2019 2018
Cost of sub-rental -1,483 -3,318
Production related costs 1 -5,152 -2,465
Repair and maintenance cost -11,940 -7,972
Cost of external services 2 -60,326 -43,249
Total -78,901 -57,004
1 Employee benefit expenses not included. 2 Include mainly assembly and disassembly costs.
6 OTHER OPERATING EXPENSES
EUR thousands 2019 2018
Premises expenses -3,129 -3,687
Sales and marketing -1,525 -795
Administrative costs -28,411 -12,821
Other costs -474 -2,227
Total -33,539 -19,531
The Group has recognised the following amounts relating to leases:
EUR thousands 2019
Expense relating to short-term leases -190
Expense relating to leases of low value that are not shown above as short-term leases -94
Total -284
ANNUAL REPORT WITH BOARD OF DIRECTORS’ REPORT AND FINANCIAL STATEMENTS 71
CONSOLIDATED FINANCIAL STATEMENTS
Share-based payments
Effect of share-based incentives on the result and financial position
EUR thousands 2019 2018
Expenses, share-based payments 760 369
of which equity-settled share-based payments 342 200
liabilities arising from share-based payments 31 December 418 169
Employee benefit expenses comprise mainly of salaries, so-cial costs, share-based payments and other fees, pension costs and fringe benefits. Fringe benefits consist employee health care services, car benefits, phone benefits and other fringe benefits.
In 2019, employee benefit expenses included EUR 2.1 million restructuring costs consisting of redundancy payments. Average number of personnel in 2019 was 375 (2018: 187). Information on key management compensation is presented in note 27.
Accounting policy – Employee benefitsShort-term benefits Short-term employee benefits include wages and sala-ries, including non-monetary benefits and annual leave expected to be settled within 12 months of the reporting date. Short-term benefits are recognised in other payables
The total amount of expenses recognised related to ex-isting share-based payment plans from 1 July 2019 to 31 December 2019 were EUR 392 thousand, of which EUR 147 thousand related to equity-settled plans.
Estimated amount of taxes to be paid in the net settle-ment in the plans is EUR 648 thousand.
The nature and extent of the existing share-based payment plans are disclosed below. The accounting treat-ment of plans which were launched by Cramo and which continued after the demerger changed because of the demerger. Before the demerger all the plans were treated fully as equity-settled. After the demerger, all rewards for the Cramo's share-based incentive plans are paid out in both Cramo's and Adapteo's shares and therefore, the plans are treated partly as equity-settled and partly as cash-set-tled. The participants are entitled to get a gross amount of shares, but a portion of shares is withheld to cover
applicable taxes arising from the rewards to the partici-pants. Taxes are paid on behalf of the participants and the employees receive a net amount of shares. At the demerger date, the portion of Cramo's share-based incentive plans to be settled with Cramo's shares were classified as cash-set-tled incentive plans and a liability was recognised on the balance sheet. As the accounting treatment of the plans changed due to the demerger, the information disclosed below describes only the nature and extent as well as the accounting treatment of the plans after the demerger.
Share-based payments – share plans Adapteo’s key personnel have historically participated in Cramo's share-based incentive plans. In the plans, selected employees have an opportunity to earn shares based on the achievement of performance criteria set for a one-year discretionary period. Each discretionary period will
based on the accrued employee benefit expenses up to the reporting date and are measured at the amounts expected to be paid when the liabilities are settled.
Post-employment benefitsAdapteo has retirement benefit plans in accordance with local conditions and practices in the countries in which it operates.
Pension plans are classified as defined benefit or defined contribution plans. In defined contribution plans, Adapteo makes fixed payments to separate entities. Adapteo has no legal or constructive obligation to make additional payments if the party receiving them is unable to pay the beneficiaries. All arrangements that do not fulfil these conditions are considered defined benefit pension plans. All Adapteo’s pension benefit plans are considered as defined contribution plans.
7 EMPLOYEE BENEFIT EXPENSES
Employee benefit expenses and other personnel costs are as follows:
EUR thousands 2019 2018
Salaries and fees -23,687 -14,865
Share-based payments 1 -760 -369
Social security costs -5,561 -2,624
Pension costs - defined contribution plans -3,081 -1,961
Total -33,089 -19,819
1 Share-based payments include both the costs recognised for the share-based compensation plans related to Adapteo’s personnel and a portion of Cramo Group management’s share-based payments costs which have been allocated to the carve-out financial information for the year 2018 and for the period 1 January - 30 June 2019 based on centrally provided services allocation.
ANNUAL REPORT WITH BOARD OF DIRECTORS’ REPORT AND FINANCIAL STATEMENTS 72
CONSOLIDATED FINANCIAL STATEMENTS
31 Dec 2019
Plan
Performance Share Plan 2015
of Cramo Plc
Performance Share Plan 2018
of Cramo Plc
Performance Share Plan 2019
of Cramo Plc
Performance Share Plan 2019
of Adapteo Plc
InstrumentDiscretionary
Period 2017Discretionary
Period 2018Discretionary
Period H1 2019Discretionary
Period H2 2019
Grant date 19.5.2017 15.8.2018 25.4.2019 12.8.2019
Beginning of earning period 1.1.2017 1.1.2018 1.1.2019 1.7.2019
End of earning period 31.12.2017 31.12.2018 30.6.2019 31.12.2019
End of restriction period 31.3.2020 16.1.2021 18.2.2022 19.2.2022
Vesting conditionsEPS, ROE,
Service periodEPS, ROE,
Service periodEPS, ROE,
Service periodEPS, ROCE,
Service period
Maximum contractual life, years 2.9 2.4 2.8 2.5
Remaining contractual life, years 0.2 1.0 2.1 2.1
Number of persons at the end of the reporting year 7 8 12 20
Payment method Equity and cash Equity and cash Equity and cash Equity
The changes in the amounts of share ownership plans during the period between 1 July 2019 and 31 December 2019 are presented in the tables below. The plans launched before the demerger shall be paid both in Adapteo and Cramo shares, meaning that against each Adapteo share amount represented in the below table an equivalent number of Cramo shares shall be paid out. The amounts are presented in gross terms before deduction of the applicable taxes arising from the reward to the employee.
immediately be followed by a two-year vesting period, after which any earned reward will be paid out to participants. As a main rule, no reward will be paid, if a key employee's employment or service ends before the reward payment.
The aim of the plans is to align the objectives of the shareholders and the employees, to retain the employees and to offer them continuity to Cramo share plans after the demerger. The plans in operation during the period were launched by the Board of Directors of Cramo and continue after the demerger. The rewards pending at the time of the demerger will be paid out in the original schedule in both Cramo and Adapteo shares, so that for each earned share, originally granted in terms of Cramo shares, the partici-pants receive one additional Adapteo share. As the reward is subject to taxes and tax-related payments, net shares after deduction of the applicable taxes arising from the reward are paid.
The new Performance Share Plan 2019 was established for Adapteo Group employees. In the plan, the participants
have an opportunity to earn Adapteo shares based on the achievement of Board-established performance criteria. The plan includes three discretionary periods, 1 July-31 December 2019 and calendar years 2020 and 2021. Each discretionary period is followed by a two-year vesting period. Each discretionary period is conditional to the Board's resolution. A participant's participation in the plan is contingent upon his or her participation in the Adapteo Plc Employee Share Savings Plan. Any rewards will be paid out after the vesting period in Adapteo shares. The partici-pants are entitled to get a gross number of shares if all the vesting conditions are met. However, a portion of shares is withheld to cover applicable taxes arising from the rewards to the participants and a net number of shares is paid.
The key data and changes in the amounts of share own-ership plans during the period are presented in the tables below.
ANNUAL REPORT WITH BOARD OF DIRECTORS’ REPORT AND FINANCIAL STATEMENTS 73
CONSOLIDATED FINANCIAL STATEMENTS
Fair value determination of the new Performance Share Plan 2019The fair value of share-based incentives has been deter-mined at the grant date and is expensed until vesting. The inputs to the fair value of the rewards granted the reporting period are presented in the table below. The fair value of the rewards is based on an estimate by the company on the quantity of shares on which a right is expected to be gained.
Valuation parameters for instruments granted during periodShare price at grant, EUR 10.73Expected dividends, EUR (discounted) 0.20Fair value 31 December 2019, EUR 267,415
Share-based incentives – employee share savings plans Adapteo employees have historically been offered an opportunity to participate in One Cramo share savings plan. In the plan, the participants have been offered a possibil-ity to save 2 to 5% of their gross salary for purchasing the shares in Cramo. Shares are acquired with the accumulated savings at market price quarterly. Each participant receives one free matching share for each two savings share ac-quired and held during the plan. The matching shares will be paid after a holding period of approximately three years, provided that the participant is still employed.
The plans in operation during the period were launched by the Board of Directors of Cramo and continue after the
demerger. The matching rights under the plans pending at the time of the demerger will be paid out in the original schedule in both Cramo and Adapteo shares, so that for each two (2) savings share in Cramo, one matching share in Cramo is paid and for each two (2) savings share in Adapteo, one matching share in Adapteo is paid. As the matching shares are subject to taxes and tax-related payments, they will be paid in net shares after deduction of the applicable taxes arising from the reward to the employee. The match-ing rights subject to the savings share acquired after the demerger will be paid in Adapteo shares.
The new Employee Share Savings Plan was offered to all Adapteo Group employees. In the plan, the employees were offered an opportunity to voluntarily save a propor-tion of their regular salary to be used for the purchase of Adapteo shares. The plan period is 1 July-31 December 2019, during which savings from the participants’ salaries have been deducted monthly. The minimum savings amount per participant during one month is 2 % of gross salary and the maximum is 5 %. The total amount of all savings may not exceed EUR 0.8 million. Each participant will receive one free matching share for every two purchased savings shares after the designated holding period, which ends on May 2022, assuming the preconditions of shareholding and employment have been met.
The key data and changes in the amounts of One Cramo share plans as well as Adapteo’s Employee Share Savings Plan (Piece of Adapteo) during the period are presented in the tables below.
Employee share savings plan as at 31 December 2019
InstrumentOne Cramo 2016-2017
One Cramo 2017-2018
One Cramo 2019
Piece of Adapteo 2019
Initial grant date 21.02.2017 23.2.2018 16.5.2019 29.8.2019
Vesting date 15.5.2020 16.5.2021 16.5.2022 16.5.2022
Maximum contractual life, years 3.2 3.2 3.0 2.7
Remaining contractual life, years 0.4 1.4 2.4 2.4
Number of persons at the end of the reporting year 23 40 31 163
Payment method Equity and cash Equity and cash Equity and cash Equity
Changes during the period
Discretionary Period 2017
(Adapteo and Cramo shares)
Discretionary Period 2018
(Adapteo and Cramo shares)
Discretionary Period H1 2019
(Adapteo and Cramo shares)
Discretionary Period H2 2019
(Adapteo shares)
1 July 2019
Outstanding at the beginning of the reporting period, pcs 11,268 21,301 44,500 0
Changes during the period
Granted 0 0 0 50,781
Forfeited 0 0 19,623 0
Exercised 0 0 0 0
31 Dec 2019
Outstanding at the end of the period, pcs 11,268 21,301 24,877 50,781
ANNUAL REPORT WITH BOARD OF DIRECTORS’ REPORT AND FINANCIAL STATEMENTS 74
CONSOLIDATED FINANCIAL STATEMENTS
The changes in the amounts of employee share savings plans during the period between 1 July 2019 and 31 December 2019 are presented in the tables below. The amounts are presented in gross terms before deduction of the applicable taxes arising from the reward to the employee.
Changes during the period
One Cramo 2016-2017
(Adapteo and Cramo shares)
One Cramo 2017-2018
(Adapteo and Cramo shares)
One Cramo 2019
(Adapteo and Cramo shares)
Piece of Adapteo 2019
(Adapteo shares)
1 July 2019
Outstanding in the beginning of the reporting period, Cramo pcs 1,360 3,382 838 0
Outstanding in the beginning of the reporting period, Adapteo pcs 1,360 3,382 838 0
Changes during the period
Granted 0 0 0 4,345
Forfeited, Cramo pcs 104 191 68 0
Forfeited, Adapteo pcs 104 191 74 22
Exercised 0 0 0 0
31 December 2019
Outstanding at the end of the reporting period, Cramo pcs 1,256 3,191 770 0
Outstanding at the end of the reporting period, Adapteo pcs 1,256 3,191 764 4,324
Fair value determination of Piece of Adapteo 2019The fair value of equity-settled share-based incentives has been determined at grant date and the fair value is expensed over the three-year plan period between the share acquisition date and matching share delivery. The acquisition date of the Savings shares required for the plan participation is considered as the grant date. The fair value of the rewards is based on an estimate by the company on the quantity of shares on which a right is expected to be gained. The pricing of the share-based incentives granted during the period was determined by the following inputs and had the following effect:
Valuation parameters for instruments granted during periodShare price at grant, EUR 10.72Cost of equity 5.30%Holding period, years 2.7Interest expense (one share), EUR 0.6Expected dividends, EUR 0.59FMV of equity component, EUR 8.99Fair value 31 December 2019, EUR 40,021
Accounting policyAdapteo has performance share plans and share savings plans. In performance share plans the target group has an opportunity to earn company shares as a reward on the basis of achievement of targets established for the per-formance criteria for each calendar year. Participants are entitled to get a gross number of shares if all the vesting conditions are met. However, a portion of shares is withheld to cover applicable taxes arising from the rewards to the participants and a net number of shares is paid. Adapteo’s new performance share plan 2019 is treated fully as equi-
ty-settled. Plans transferred from Cramo are treated partly as equity-settled and partly as cash-settled, because the rewards are paid in both Adapteo’s and Cramo’s shares. At the demerger date, the portion of Cramo's share-based incentive plans to be settled with Cramo's shares were classified as cash-settled incentive plans and a liability was recognised on the balance sheet.
In share savings plans the employees can save 2-5% of their monthly gross salaries during the 12 months plan periods and the savings are automatically used to purchase company shares for the participants quarterly after each publication date of the interim results during the plan peri-od. The participant will receive one free matching share for every two acquired savings shares, if the participant holds the acquired shares until the end of the designated holding period. An additional requirement for receiving the match-ing shares is that the participant’s employment has not been terminated before the end of the designated holding period. As the rewards are subject to taxes and tax-related payments, net number of shares after deduction of the applicable taxes arising from the reward are paid. The new share savings plan (Piece of Adapteo 2019) is treated fully as equity-settled, but the old plans transferred from Cramo are treated partly as equity-settled and partly as cash-set-tled, because the rewards are paid in both Adapteo’s and Cramo’s shares.
Expenses of the performance and share savings plans are recognised over the vesting period, from the grant date until they vest, i.e. are paid.
The fair value of the equity-settled payment is deter-mined at the grant date and expensed over the vesting period, the corresponding amount being credited to equity. The fair value of the equity-settled reward is not remeas-ured. The impact of non-market vesting conditions (EPS,
ANNUAL REPORT WITH BOARD OF DIRECTORS’ REPORT AND FINANCIAL STATEMENTS 75
CONSOLIDATED FINANCIAL STATEMENTS
ROE target) are not taken into account when determining the grant date fair value, but they are taken into account by adjusting the number of shares that are included in the measurement of the transaction. So that, ultimately, the amount recognised as expense shall be based on the number of shares that eventually vest. At each reporting date Adapteo revises its estimate on the number of shares that are expected to vest. The impact of the revision of the original estimates is recognised in the consolidated income statement.
The fair value of the cash-settled payment is expensed over the vesting period, the corresponding amount being recognised as a liability. The cash-settled payment is valued at each reporting date and at the date of settlement. At each reporting date Adapteo revises its estimate on the number of shares that are expected to vest and adjusts the amount recognised as expense.
Key judgement and estimates – Share-based payments The fair value of reward shares in the performance share plan is based on the share price on the grant date and the valuation does not involve high degree of estimation. Instead, the determination of the fair value of match-ing shares in the One Cramo Share savings plan includes certain assumptions relating to expected dividend yield and cost of equity and debt. These variables include estimation uncertainty.
8 DEPRECIATION, AMORTISATION AND IMPAIRMENT
Intangible assets and property, plant and equipment are stated in the balance sheet at cost less accumulated depreciation, amortisation and impairment losses.
EUR thousands 2019 2018
Depreciation on buildings -2,952 -319
Depreciation on rental equipment -30,028 -20,546
Depreciation on rental accessories -6,070 -4,154
Depreciation on other machinery and equipment -1,676 -372
Depreciation of property, plant and equipment -40,726 -25,391
Amortisation on software and other intangible assets -185 -365
Amortisation of intangible assets resulting from acquisitions -2,639 -7411
Amortisation of intangible assets -2,824 -1,106
Total depreciation and amortisation -43,551
Impairment on property, plant and equipment -10,150 -1,392
Impairment on intangible assets -254
Total impairment losses -10,404 -1,392
Total depreciation, amortisation and impairment losses -53,954 -27,890
1 Amortisation of intangible assets recognised in connection with the business acquisitions in year 2018 consisted of brand, customer relationships and non-competition agreements.
Impairment losses relate mainly to the write-down of old rental equipment.
Depreciation of right-of-use property, plant and equipment included in the depreciation of property, plant and equipment:
EUR thousands 2019
Buildings -2,667
Rental equipment -573
Other machinery and equipment -883
Total -4,123
Depreciation and amortisation periods are presented in notes 11 and 13.
ANNUAL REPORT WITH BOARD OF DIRECTORS’ REPORT AND FINANCIAL STATEMENTS 76
CONSOLIDATED FINANCIAL STATEMENTS
9 FINANCE INCOME AND COSTS
EUR thousands 2019 2018
Interest income 411 29
Exchange rate gains 2,529 1,346
Other finance income 96 282
Finance income 3,037 1,657
Interest expenses on loans from Cramo Group -865 -1,821
Interest expenses on bank loans, convertible loan and collateralised loan -6,611 -1,450
Interest expenses on leases -357
Interest expenses on finance leases -16
Exchange rate losses -2,821 -1,602
Other finance costs -133 -178
Finance costs -10,787 -5,066
Finance costs, net -7,750 -3,410
Other finance income consists of amounts related to prolonged contract terms and changes in residual value guarantee of the collateralised loan.
Accounting policyTransaction costs related to loans are expensed in profit or loss using effective interest rate method. The effective interest rate is the rate that discounts the estimated future payments during the expected maturity of a loan to the net carrying amount of the financial liability. The calculation includes transaction costs and all fees directly attributable
to the transaction paid by the contracting parties. Inter-est income is recognised using the effective interest rate, unless the receipt of interest is uncertain. In such cases the interest income is accounted for on a cash basis. Foreign exchange gains and losses on financing activities are rec-ognised within finance income or costs. Foreign exchange risk arising from internal funding and recognised assets and liabilities is managed primarily through forward contracts. Hedge accounting is not applied for these derivatives and the change in the fair value of derivatives is recognised in finance items in consolidated income statement.
10 TAXES
This note explains Adapteo’s income tax expense and other balances presented as tax items in the financial statements. The deferred tax section provides information on expected future tax payments.
Income taxes in the consolidated income statement comprise of current income tax expense and change in deferred taxes and are recognised as follows:
EUR thousands 2019 2018
Current year tax -4,653 -1,189
Adjustment for prior years 10 -455
Change in deferred taxes -1,358 -3,335
Total -6,001 -4,978
ANNUAL REPORT WITH BOARD OF DIRECTORS’ REPORT AND FINANCIAL STATEMENTS 7 7
CONSOLIDATED FINANCIAL STATEMENTS
The difference between income taxes at the Finnish domestic tax rate 20% (during all periods presented) and income taxes recognised in the consolidated income statement is reconciled as follows:
EUR thousands 2019 2018
Profit before tax 14,392 25,891
Tax calculated with domestic corporate tax rate -2,879 -5,178
Foreign subsidiaries divergent tax rate -506 -170
Tax from the previous financial periods 10 -455
Change in tax rates 545
Non-deductible expenses -291 -65
Utilisation of previously unrecognised tax losses 843 301
Recognition of previously unrecognised tax losses 45
Current year losses for which no deferred tax assets was recognised -2,954
Other items -223
Taxes in income statement -6,001 -4,978
Group's effective tax rate, % 41.7 19.2
Deferred tax assets and liabilities as presented in the consolidated balance sheet:
EUR thousands 31 Dec 2019 31 Dec 2018
Deferred tax assets 7,414 3,109
Deferred tax liabilities 48,025 43,138
Deferred tax liabilities, net 40,611 40,030
Movements in deferred tax assets and liabilities during 2019:
Valuation of assets to fair value in business combinations 350 -253 12,101 277 12,475
Other temporary differences 244 15 -141 118
Total 23,618 3,145 17,344 -970 43,138
Deferred tax liabilities, net 21,104 3,335 16,528 -938 40,030
Deferred tax assets are recognised for tax loss carryfor-wards to the extent that the realisation of the related tax benefit through future taxable profits is probable. Deferred tax assets of EUR 6.9 million in respect of tax losses have not been recognised in 2019 (2018: EUR 4.4 million). Of the tax losses for which Adapteo has not recognised deferred tax assets in 2019, EUR 2.7 million (2018: EUR 0.0 million) will expire during the next ten years and EUR 4.2 million (2018: EUR 4.4 million) have no expiry date. Unrecognised tax losses relate to Finland and Denmark. For Finland the amount of unrecognised deferred tax asset is EUR 2.7 million and relates to the portion of the tax loss incurred in 2019 for which the realisation of the tax benefit is not probable. Adapteo’s legal entity in Denmark, Adapteo A/S (formerly Cramo A/S), has tax loss carry-forwards of EUR 4.2 million which have mainly arisen from the losses generated by Cramo’s Equipment Rental business prior its disposal in 2017. For the carve-out period, any changes in recognised deferred tax assets relating to Adapteo A/S tax loss carry-forwards arisen from the disposed Equipment Rental business have been recognised through invested equity, as they are deemed to be contributions from Cramo Group. The other temporaty deferred tax assets and lia-bilities are mainly related to transfer of assets carried out between entities within the Group during 2019.
Accounting policyIncome tax expense/benefit consists of the current tax and change in deferred taxes for the period, together with tax adjustments for previous periods. Taxes are recognised through profit and loss, except when they relate directly to equity or the items recognised in the other comprehensive income items. In such cases, tax is also charged to these items. Current taxes are calculated based on the tax rate of each country. Tax assets and liabilities reflect uncertainty related to income taxes, if any.
Deferred taxes are calculated for temporary differences between the book values of assets and liabilities and the tax basis of assets and liabilities. Deferred tax liabilities are not recognised, however, if they are attributable to the ini-tial recognition of an asset or liability in a transaction other
than business combination and the transaction, at the time it occurs, does not affect the accounting profit or taxable profit. The deferred tax for investments in subsidiaries and joint ventures is recognised, except when the timing of the reversal of the temporary difference is controlled by the Group and it is probable that the temporary difference will not be reversed in the foreseeable future.
Deferred taxes are calculated using the tax rates enact-ed, or substantially enacted by the last day of the reporting period. Deferred tax assets are recognised to the extent that it is probable that future taxable profit will be available against which the temporary differences can be utilised.
Key judgement and estimates – Recogni-tion of deferred tax assets and liabilitiesAdapteo is subject to tax in several countries. Determining Adapteo’s income tax requires significant assessment and judgement. Adapteo estimates tax positions in accordance with tax returns with respect to situations in which applica-ble tax regulation is subject to interpretation. If necessary, the amounts recorded are adjusted to amounts expected to be paid to the tax authorities.
Management judgement is required in assessing whether certain deferred tax assets and deferred tax liabilities are recognised on the balance sheet. Deferred tax assets are recognised only where it is considered probable that they will be recovered, which is dependent on the generation of sufficient future taxable profits. Assumptions about the generation of future taxable profits depend on manage-ment’s estimates of future cash flows. Estimates of these future cash flows are dependent on the management’s estimates that relate among others to the amount of future net sales, operating costs, finance costs and taxes. In addi-tion, Adapteo’s ability to generate taxable income depends on factors related to general economy, finance, competi-tiveness and regulations that Adapteo is unable to control. These estimates and assumptions are subject to risk and un-certainty, hence it is possible that changes in circumstances will alter expectations, which may impact the amount of deferred tax assets and deferred tax liabilities recognised on the balance sheet and the amount of temporary differences.
ANNUAL REPORT WITH BOARD OF DIRECTORS’ REPORT AND FINANCIAL STATEMENTS 79
CONSOLIDATED FINANCIAL STATEMENTS
PROPERTY, PLANT AND EQUIPMENT, ACQUISITIONS, INTANGIBLE ASSETS AND INVESTMENTS IN JOINT VENTURES
This section presents the information on Adapteo’s property, plant and equipment, business acquisitions, intangible assets and investments in joint ventures.
11 PROPERTY, PLANT AND EQUIPMENT
Adapteo’s property, plant and equipment mainly consists of rental equipment including modules used in modular space leases and rental accessories. Other property, plant and equipment assets comprise of buildings including offices and production facilities, capitalised costs of leasehold improvements, other machinery and equipment including mainly production machinery, office equipment and leased assets as well as assets under construction.
Until the 2018 financial year, leases of property, plant and equipment were classified as either finance leases or op-erating leases. From 1 January 2019, leases are recognised as a right-of-use asset (RoU assets) and a corresponding liability at the date at which the leased asset is available for use by the group. In 2019, right-of-use assets are included in the asset classes in the following table.
EUR thousands Land BuildingsRental
equipmentRental
accessories
Other machinery and equip-
ment
Assets under
construc-tion
Total property, plant and
equipment
Acquisition cost
At 1 Jan 2019 831 5,879 515,691 66,695 7,336 4,664 601,099
IFRS 16 transition 5,798 6,855 1,212 2,252 16,118
At 1 Jan 2019 adjusted 6,629 12,734 516,903 66,695 9,588 4,664 617,217
Business acquisitions 831 3,793 85,336 4,794 2,263 1,541 98,557
Disposals -265 -18,726 -3 -401 -19,395
Reclassification between asset categories 208 -19 2,961 -2,359 -631 160
At 31 Dec 2018 831 5,879 515,691 66,695 7,336 4,664 601,097
Accumulated depreciation and impairment
At 1 Jan 2018 -1,168 -118,945 -36,999 -4,989 -162,100
Exchange differences -14 2,477 1,365 88 3,915
Disposals 250 6,587 525 3 7,365
Depreciation -319 -20,546 -4,154 -372 -25,391
Impairments -1,392 -1,392
Reclassification between asset categories -27 -685 -483 1,035 -160
At 31 Dec 2018 -1,278 -132,505 -39,746 -4,235 -177,763
Net book value at 31 Dec 2018 831 4,602 383,186 26,949 3,101 4,664 423,334
Net book value of right-of-use assets included in the property, plant and equipment:
EUR thousands 31 Dec 2019
Land 4,642
Buildings 6,363
Rental equipment 711
Other machinery and equipment 1,768
Total 13,484
Additions to the right-of-use assets during the 2019 financial year were EUR 1.7 million.Depreciation of right-of-use assets recognised in the income statement, see note 8.
Accounting policy Property, plant and equipment is measured at cost less accumulated depreciation and any impairment losses. This cost includes expenditure that is directly attributable to the acquisition. Property, plant and equipment acquired in the business combinations is measured at fair value at the date of acquisition. Subsequent costs are included in the asset’s carrying amount or recognised as a separate asset when it is probable that it will generate future economic benefits, and the cost can be measured reliably. The expenditure on repairs and maintenance of property, plant and equipment are recognised as expense when incurred.
Depreciation of an asset is started when the asset is available for use or rental, i.e. in the location and con-dition necessary to operate in a manner intended by the management. Residual values, depreciation methods and
useful lives of the assets are reviewed at the end of each reporting period and, if necessary, adjusted to reflect any changes in expectations of economic value.
Property, plant and equipment assets are depreciated on a straight-line basis over the estimated economic useful lives as follows:
Buildings 10-35 yearsRoU buildings 1-10 yearsRental equipment 10-20 yearsRoU Rental equipment 1-5 yearsRental accessories 3-10 yearsOther machinery and equipment 3-10 yearsRoU Other machinery and equipment 1-5 years
ANNUAL REPORT WITH BOARD OF DIRECTORS’ REPORT AND FINANCIAL STATEMENTS 81
CONSOLIDATED FINANCIAL STATEMENTS
An item of property, plant and equipment is derecognised upon disposal or when no future economic benefits are expected from its use. Gains and losses on disposals are determined by comparing disposal proceeds with the carry-ing amount of the disposed asset and are recognised within other operating income or other operating expenses in the consolidated income statement when the asset is disposed. Adapteo’s leasing activities and how these are accounted forAdapteo leases rental machinery, vehicles and premises. Contracts for rental machinery and vehicles are typically made with maximum maturity of five years and premises with maximum maturity of 20 years but may have extension options. Lease terms are negotiated on an individual basis and contain a wide range of different terms and conditions. The lease agreements do not impose any covenants, but leased assets may not be used as security for borrowing purposes.
Until 2018, leases of property, plant and equipment were classified as either finance or operating leases. Payments made under operating leases (net of any incentives re-ceived from the lessor) were charged to profit or loss on a straight-line basis over the period of the lease.
From 1 January 2019 under IFRS 16, leases are recog-nised as a right-of-use asset and a corresponding liability at the date at which the leased asset is available for use by Adapteo. Each lease payment is allocated between the lia-bility and finance cost. The finance cost is charged to profit or loss over the lease period so as to produce a constant periodic rate of interest on the remaining balance of the liability for each period. The right-of-use asset is depreci-ated over the shorter of the asset’s useful life and the lease term on a straight-line basis.
Assets and liabilities arising from a lease are initially measured on a present value basis. The lease payments are discounted using the interest rate implicit in the lease. If that rate cannot be determined, the lessee’s incremental borrowing rate is used.
Right-of-use assets are measured at cost comprising the following: the amount of the initial measurement of lease liability, any lease payments made at or before the commencement date less any lease incentives received, any initial direct costs, and restoration costs.
Payments associated with short-term leases and leases of low-value assets are recognised on a straight-line basis as an expense in profit or loss. Short-term leases are leases with a lease term of 12 months or less. Low-value assets comprise IT equipment and small items of office furniture.Lease liabilities are presented in note 19.
Impairment of assetsProperty, plant and equipment and other intangible assets (see note 13) and are tested for impairment whenever events or changes in circumstances indicate that the car-rying amount may not be recoverable. An impairment loss is recognised for the amount by which the asset’s carrying amount exceeds its recoverable amount. The recoverable amount is the higher of an asset’s fair value less costs of disposal and value in use.
For the purposes of assessing impairment, assets are grouped at the lowest levels for which there are separately identifiable cash inflows which are largely independent of the cash inflows from other assets or groups of assets (cash generating units). Non-financial assets other than good-will that suffered an impairment are reviewed for possible reversal of the impairment at the end of each reporting period.
Key judgement and estimates – Useful lives and valuation of property, plant and equipmentDepreciation is based on management’s estimates of the residual value of the assets, depreciation methods and the useful life of assets. The estimates may change due to technological development, the competitive situation, changes in market conditions and other factors, and this may lead to changes in the estimated useful lives and the amount of depreciation recognised in the consolidated income statement.
The useful lives of property, plant and equipment are reviewed periodically considering the factors mentioned above and all other relevant factors.
Optimal rental fleet’s utilisation levels are managed cen-trally at Adapteo’s group level. Testing of the value of the rental fleet is based on calculations of value in use, taking into account the possibility of transferring it to another entity of the group. The preparation of these calculations requires management estimate.
ANNUAL REPORT WITH BOARD OF DIRECTORS’ REPORT AND FINANCIAL STATEMENTS 82
CONSOLIDATED FINANCIAL STATEMENTS
Details of the purchase consideration, the net assets acquired and goodwill were as follows:
EUR thousands 2018
Cash 108,523
Convertible loan 52,877
Repayment of shareholder loans 32,574
Total purchase consideration 193,974
Recognised amounts of identifiable assets acquired Identifiable assets
Non-current assets
Intangible assets (excl. goodwill)
Customer relationships 23,285
Brands 2,744
Total intangible assets 26,029
Property, plant and equipment
Rental equipment 85,336
Other property, plant and equipment 13,221
Total property, plant and equipment 98,557
Other non-current assets
Investments in joint ventures 1,236
Deferred tax assets 816
Loan receivables 221
Finance lease receivables 5,662
Total other non-current assets 7,935
Total non-current assets 132,521
12 ACQUISITIONS
In 2019, Adapteo did not have any acquisitions.
2018 Nordic Modular Group HoldingAs announced on 26 June 2018, Cramo signed an agree-ment to acquire 100% of Nordic Modular Group Holding AB (“NMG”) from Strukturfonden HC11 AB, a subsidiary of Nalka Invest AB, and certain minority shareholders. Cramo completed the transaction at the end of October 2018. The enterprise value of the transaction was approximately SEK 2.725 billion. Alongside the goodwill, the intangible assets identified in the purchase price allocation were related to customer relationships and trademarks. The table below summarises the total consideration for NMG and amounts for the fair value of the acquired assets and liabilities as at the acquisition date.
NMG, well established player in the modular space mar-ket in the Nordics, was founded in 1956. NMG’s main market
is Sweden with operations also in Norway, Denmark and Finland and it employs 230 persons. NMG serves municipal customers, county councils and private companies with a primary focus on schools, pre-schools, elderly housing solutions and offices. It develops, manufactures, sells and rents relocatable buildings through its three subsidiaries Temporent AB, Nordic Modular Leasing AB and Flexator AB. Temporent rents out modular solutions with a fleet con-sisting of approximately 6 500 modules, serving primarily municipalities and large private companies. Nordic Modular Leasing leases out modular units with a primary focus on longer term contracts. Flexator designs, manufactures and sells professional modular buildings based on standardised building systems from site huts to advanced solutions.
The acquisition strengthens the existing modular space business and expands Adapteo’s business model to include inhouse development and production of modular solutions.
ANNUAL REPORT WITH BOARD OF DIRECTORS’ REPORT AND FINANCIAL STATEMENTS 83
CONSOLIDATED FINANCIAL STATEMENTS
Current assets
Inventories 3,497
Finance lease receivables 5,469
Trade and other receivables 18,993
Income tax receivables 421
Cash and cash equivalents 2,007
Total current assets 30,387
Total identifiable assets 162,908
Non-current liabilities
Borrowings 65,826
Deferred tax liabilities 17,344
Other non-current liabilities 1 1,340
Total non-current liabilities 84,511
Current liabilities
Trade and other payables 22,981
Income tax liabilities 1,064
Provisions 221
Total current liabilities 24,266
Total liabilities 108,777
Total identifiable net assets 54,131
Goodwill 139,843
1 Include EUR 50 thousand non-current provisions
The acquired businesses contributed sales of EUR 13 million and operating profit of EUR 2 million to Adapteo for the pe-riod from 1 November to 31 December 2018. Adapteo’s net sales would have increased by EUR 69 million and operating profit (EBIT) would have increased by EUR 13 million, if the acquisition had been completed on 1 January 2018. These amounts have been calculated using NMG's results and adjusting them for differences in the accounting policies between Adapteo and NMG, as well as the additional de-preciation and amortisation that would have been charged assuming the fair value adjustments to property, plant and equipment and intangible assets would have been applied from 1 January 2018.
Purchase consideration and cash out flowThe acquisition was financed with a convertible loan from the sellers as well as bank financing.
SEK 550.0 million (EUR 52.9 million at the acquisition date) of the purchase consideration was paid by entering into a convertible loan agreement whereby the sellers may at Cramo's discretion reinvest this amount to the shares is-sued by Adapteo Plc after the demerger. If Adapteo had not separated from Cramo or a minority owner holding a part of
the convertible loan has been given notice of termination of employment before the spin-off is made, Cramo should have been repaid each holder’s loan in cash. In case the convertible loan holder would have been declined the offer of Adapteo Plc’s shares, they would have been received a reduced amount of the convertible loan. The contingent reduction of the convertible loan of EUR 4.8 million (SEK 50.0 million) is considered to be contingent consideration under IFRS. At the time of the acquisition the contingent consideration was recognised in full and Cramo expected to settle the whole convertible note of EUR 52.9 million. The convertible loan was repaid in April 2019 at the amount EUR 51.8 million (SEK 550 million) and accrued interests EUR 1.3 million.
Cramo agreed a contingent upwards adjustment to the purchase consideration up to EUR 8.7 million (SEK 90.0 million) if there would have been a disposal of NMG or the combined business of NMG and Adapteo within eighteen months following the closing date and certain other criteria would have been met. Cramo expected that this contingent consideration will not materialise.
ANNUAL REPORT WITH BOARD OF DIRECTORS’ REPORT AND FINANCIAL STATEMENTS 84
CONSOLIDATED FINANCIAL STATEMENTS
The table below represents the details of the purchase consideration and outflow of cash to acquire NMG.
EUR thousands
Cash consideration 1 141,097
Convertible loan 52,877
Total consideration 193,974
Convertible loan -52,877
Cash and cash equivalents acquired -2,007
Withheld cash related to purchase price -257
Adjustment to the preliminary purchase consideration -504
Net outflow of cash - investing activities 138,330
1 Including repayment of shareholder loans. The cash consideration was financed by bridge financing, which was also used to refinance the bank loans of NMG. The bridge loan amounted to EUR 210 million. Cash flows related to financing of the acquisition and refinancing of NMG's loans are reported in net cash flow from financing activities in consolidated cash flow statement.The fair value of the acquired trade receivables was EUR 10.5 million and finance lease receivables EUR 11.4 million. The gross trade receivables amount for trade receivables EUR 10.5 million of which EUR 48 thousand is expected to be uncollectable. The finance lease receivable is expected to be collectable in full.
The goodwill amounted to EUR 139.8 million. The good-will consists of workforce, synergies and strong market position in Sweden. None of the goodwill is expected to be deductible for tax purposes.
Acquisition related costs of EUR 1.8 million are included in other operating expenses in the consolidated income statement and in net cash flow from operating activities in the consolidated statement of cash flows.
Accounting policyBusiness combinations are accounted for using the acqui-sition method. The consideration transferred in a business combination is the fair value of the assets transferred, the liabilities incurred, and the equity instruments issued at the acquisition date. Any contingent consideration is recog-nised at fair value at the acquisition date and classified as a liability or equity. Contingent considerations classified as a liability are measured at fair value on each reporting date with changes recognised in the consolidated income statement. Identifiable assets acquired, and liabilities and contingent liabilities assumed in a business combination are measured initially at their fair values at the acquisition date. The excess of the consideration transferred, the amount of any non-controlling interest in the acquiree and the acqui-sition date fair value of any previous equity interest in the acquiree over the fair value of the identifiable net assets of the subsidiary acquired is recorded as goodwill. If this is less than the fair value of the net assets of the subsidiary acquired in the case of a bargain purchase, the difference is recognised directly in the consolidated income statement.
Key judgement and estimates – Fair values of contingent consideration and net assets acquired in a business combinationThe purchase consideration transferred and net assets ac-quired in business combinations are measured at fair value. The fair value of the contingent consideration included in the purchase consideration for an acquisition has been estimated on the basis of the present value of the expected cash flows. The measurement of fair value of acquired net assets is based on fair values of similar assets (property, plant and equipment), estimated future cash flow (intan-gible assets, such as customer relationships and brands) or an estimate of the payments required for fulfilling an obligation. Related to property, plant and equipment, the management makes comparisons to the market prices of corresponding assets, as well as estimates of the decrease in value attributable to the age, wear and tear and other similar factors of acquired assets. The determination of the fair value of intangible assets is based on assessments concerning the cash flows of assets, because information on the sales of similar assets has not been available. There-fore, the valuation exercise, which is based on repurchase values, expected cash flows or estimated payments re-quires management’s judgments and assumptions. Manage-ment believes that the estimates and assumptions used are sufficiently reliable for determining fair values.
ANNUAL REPORT WITH BOARD OF DIRECTORS’ REPORT AND FINANCIAL STATEMENTS 85
CONSOLIDATED FINANCIAL STATEMENTS
13 GOODWILL AND OTHER INTANGIBLE ASSETS
Intangible assets comprise of goodwill and other intangible assets consisting of brand, customer relationships, software and other intangibles. Other intangibles mainly include non-competition agreements.
EUR thousands Goodwill BrandCustomer
relationships SoftwareOther
intangibles
Other intangible
assets total
Acquisition cost
At 1 Jan 2019 174,506 2,782 26,136 1,889 1,766 32,573
Exchange differences -2,872 -51 -458 -3 -1 -513
Additions 424 424
At 31 Dec 2019 171,634 2,731 25,678 2,310 1,765 32,483
Accumulated amortisation and impairment
At 1 Jan 2019 -615 -102 -1,182 -1,552 -1,712 -4,548
Amortisation -179 -2,431 -179 -35 -2,824
Impairment -254 -254
At 31 Dec 2019 -615 -281 -3,613 -1,985 -1,747 -7,626
Net book value at 31 Dec 2019 171,019 2,450 22,064 325 18 24,858
EUR thousands Goodwill BrandCustomer
relationships SoftwareOther
intangibles
Other intangible
assets total
Acquisition cost
At 1 Jan 2018 33,266 2,526 1,581 1,772 5,879
Exchange differences 1,398 38 325 -36 -7 321
Additions 358 358
Business acquisitions 139,843 2,744 23,285 26,029
Disposals -14 -14
At 31 Dec 2018 174,506 2,782 26,136 1,889 1,766 32,573
Accumulated amortisation and impairment
At 1 Jan 2018 -615 -574 -1,162 -1,684 -3,420
Exchange differences 1 2 25 6 34
Disposals -56 -56
Amortisation -103 -610 -359 -35 -1,106
At 31 Dec 2018 -615 -102 -1,182 -1,552 -1,712 -4,548
Net book value at 31 Dec 2018 173,891 2,680 24,955 337 53 28,025
ANNUAL REPORT WITH BOARD OF DIRECTORS’ REPORT AND FINANCIAL STATEMENTS 86
CONSOLIDATED FINANCIAL STATEMENTS
Goodwill
Accounting policyGoodwill represents the consideration that has been paid when acquiring a business in excess of the fair value of the assets and liabilities acquired.
Goodwill is not amortised but it is tested annually for impairment, or more frequently if events or changes in circumstances indicate that goodwill might be impaired. Goodwill is carried at cost less any accumulated impair-ment losses. Previously recognised impairment loss of goodwill is not reversed.
Goodwill is allocated to cash-generating units for the purpose of impairment testing.
Basis for impairment testingPrior to the demerger from Cramo, the Modular Space (Adapteo) segment was determined as one CGU and the goodwill was tested for impairment at that level. The 2018 financial statements have been prepared on a carve-out basis from historical Cramo’s consolidated financial state-ments, the goodwill impairment testing results for 2018 is based on the historical impairment tests performed by Cramo for its Modular Space CGU.
Since the demerger from Cramo, Adapteo has report-ed two operating segments: Rental Space and Permanent Space. As a result of the new segment structure, Adapteo reallocated the goodwill to the new CGU's: Rental Space EUR 158 million and Permanent Space EUR 9 million as at 31 October 2019 in accordance with IFRS.
Goodwill is tested for impairment annually, or on a more frequent basis should there be an indication of a potential impairment. The impairment test is done annually based on
Management has determined the values assigned to each of the above key assumptions as follows:
EBITDA marginEBITDA is defined as operating profit (EBIT) less deprecia-tion and amortisation.
Adapteo’s profitability slightly decreased in 2019 and 2018 and the profitability level used in terminal value calculation reflects the long-term historical EBITDA level.
the balance sheet as at 31 October. Due to NMG acqui-sition the goodwill impairment test for the year 2018 was performed based on the balance sheet as at 31 December 2018.
In the impairment testing the assets of the two CGUs are compared to their recoverable amount. The recoverable amount is the higher of CGU’s fair value less costs of dis-posal and value in use. The recoverable amount of the CGU has been determined in the 2019 testing based on assess-ing the fair value less cost of disposal (FVLCOD) which is calculated by using the discounted cash flow method (Level 3). In 2018, the testing was performed using the value in use approach. The approach was changed to better reflect the business plan of Adapteo, which requires significant invest-ments to the module fleet.
The cash flow projections used in the calculations are based on the next year's financial budget and the forecasts for the subsequent four years. The cash flow projections, covering altogether a period of five years, are based on actual results and management’s estimates on future sales, cost development, investments, applicable tax regulations and management’s expectations of market development as well as the future development of the markets. The projec-tions are in line with the external information to the extent such information is available. Adapteo’s Board and Group Management have approved cash flow forecasts upon which the impairment tests are based.
Key assumptions used in impairment testingThe key assumptions related to impairment test for the year 2019:
Growth rate for the five-year periodFuture growth estimates are mainly based on forecasted utilisation rates and forecasted price development in the CGUs. The overall sales are expected to reach an annual average growth rate of 9.5% for Rental Space and 9.9% for Permanent Space during the forecasted period.
Growth rate beyond the five yearsThe growth rate beyond five years is estimated to be 1.5% per year for both CGUs. This is predicted to reflect the long-term inflation forecast.
ANNUAL REPORT WITH BOARD OF DIRECTORS’ REPORT AND FINANCIAL STATEMENTS 87
CONSOLIDATED FINANCIAL STATEMENTS
Test resultsBased on the impairment test results, no impairment was recognised in 2019 and 2018.
Key judgement and estimates – Key assumption used in goodwill impairment testingThe management makes significant estimates and judge-ments in determining the level at which the goodwill is tested and whether there are any indications of impairment. The recoverable amount of cash generating unit is deter-mined based on value in use calculations which require the use of estimates. Cash flow forecasts are based on Adapteo’s actual results and the management’s best esti-mates on future sales, cost development, general market conditions and applicable tax rates. Cash flow forecasts include budgets and forecasts approved by the Board of for a period of five years and cash flows for the periods after five years are extrapolated using the estimated growth rates mentioned in this note under key assumptions used in impairment testing. The growth rates are based on the management’s estimates on future growth in the CGUs.Management tests the impacts of changes in significant estimates used in forecasts by sensitivity analyses as described above in this note under key assumptions used in impairment testing.
Discount rateForecasted cash flows are discounted with a specific discount rate. Adapteo's weighted average cost of capital (WACC) constitutes the basis for the determination of the discount rate. Cost of capital includes assumptions for capital structure, risk-free interest rate, risk premium, cost of debt and equity and equity beta. In determining the discount rates, the weighted average cost of capital is in-creased by specific risk factor, which includes assumptions for country, currency and price risks inherent to the CGU.
Other intangible assets
Accounting policy Other intangible assets are recorded in the balance sheet initially at cost, when it is probable that the assets will generate future economic benefits and the cost can be measured reliably. Other intangible assets include brands, customer relationships, software and other intangibles comprising mainly of non-competition agreements.
Adapteo’s brands, customer relationships and non-com-petition agreement are recognised in connection with the business acquisitions. Brands, customer relationships and non-competition agreements acquired in the business combinations are measured at fair value on the date of the acquisition and subsequently amortised on a straight-line basis over the estimated useful lives.
Intangible assets that are separately identifiable or arising from contractual or other legal rights relate to IT systems. The capitalised cost related to IT systems consist of external service expenses and fees paid for licenses.Amortisation periods for other intangible assets are:
Brands 3-15 yearsCustomer relationships 3-15 yearsSoftware and other intangibles 2-10 years
Research costs are expensed as incurred. Development costs are capitalised when it is probable that a develop-ment project will generate future economic benefits, and the cost can be measured reliably. Other development costs are expensed. Currently the development projects of Adapteo do not fulfil the criteria of capitalisation and thus the development costs are expensed as incurred.
Sensitivity analysis of the main assumptionsThe figures below represent the changes of the main assumptions, for each assumption separately, after which the carrying amount of the Adapteo equals its recovera-ble amount. In the sensitivity analysis, each parameter is adjusted independently whilst holding the other parameters constant.
Rental Space
Annual change in profitability -
Max. decrease in %-units
Growth rate beyond five- year period -
Max. decrease in %-units
The amount by which the recoverable
amount exceeds the carrying
amount - EUR million
The amount by which the recoverable
amount exceeds the carrying
amount -%
Discount rate - Max. increase in
%-units
2019 -2.6% -0.8% 84.1 13.4% 0.7%
Permanent Space
Annual change in profitability-
Max. decrease in %-units
Growth rate beyond five- year period-
Max. decrease in %-units
The amount by which the recoverable
amount exceeds the carrying
amount - EUR million
The amount by which the recoverable
amount exceeds the carrying
amount -%
Discount rate - Max. increase in
%-units
2019 -2.4% >1.5% 13.6 43.4% 2.7%
ANNUAL REPORT WITH BOARD OF DIRECTORS’ REPORT AND FINANCIAL STATEMENTS 88
CONSOLIDATED FINANCIAL STATEMENTS
14 INVESTMENTS IN JOINT VENTURES
Ungabostäder Haninge AB, a Swedish company and owned and controlled jointly by Adapteo with 50% ownership, has been part of Adapteo since the acquisition of NMG in October 2018. The financial information on Adapteo’s joint venture Unga-bostäder Haninge AB is summarised as follows:
EUR thousands 2019
Carrying amount of investment at 1 January 1,241
Profit/loss for the period 16
Other comprehensive income items -18
Carrying amount of investment at 31 December 1,239
EUR thousands Nov-Dec 2018
Carrying amount of investment at 31 October 1,236
Profit/loss for the period -13
Other comprehensive income items 18
Carrying amount of investment at 31 December 1,241
The table below provides summarised financial information for Ungabostäder Haninge AB. The information disclosed reflects the amounts presented in the financial statements of Ungabostäder Haninge AB and not Adapteo’s share of those amounts.
Summarised balance sheet
EUR thousands 31 Dec 2019 31 Dec 2018
Rental equipment 2,620 3,106
Total non-current assets 2,620 3,106
Cash and cash equivalents 232 162
Other current assets (excluding cash) 66 77
Total current assets 298 239
Borrowings 1,449 1,875
Total non-current liabilities 1,449 1,875
Total current liabilities 753 736
Net assets 716 734
Adapteo’s subsidiary Flexator Leasing AB has granted loan to Ungabostäder Haninge AB and the book value of the loan was EUR 220 thousand as at 31 December 2019 (2018: EUR 224 thousand).
Accounting policy Investments in entities which Adapteo has a joint control are accounted for under the equity method of accounting. Adapteo’s share of the profit or the loss from joint ventures is presented as a separate line item before operating profit
in the consolidated income statement. Adapteo’s invest-ments in the joint ventures are presented in the consoli-dated balance sheet under “Investments in joint ventures. Investments in the joint ventures are initially recognised on the balance sheet at the acquisition cost and subsequent-ly, the value of investment is adjusted in accordance with changes in the net assets of the investee in proportion to Adapteo’s ownership. Investments in the joint ventures are derecognised when Adapteo no longer has joint control over the investee.
ANNUAL REPORT WITH BOARD OF DIRECTORS’ REPORT AND FINANCIAL STATEMENTS 89
CONSOLIDATED FINANCIAL STATEMENTS
Write-downs of inventories recognised during the financial years 2019 and 2018 were immaterial.
Accounting policy Inventories are measured at the lower of cost and net real-isable value. Cost is determined using the first-in, first-out (FIFO) method. The cost of inventories shall comprise all costs of purchase including transportation, handling and
other costs directly attributable to the acquisition. Net realisable value is the estimated selling price in the ordinary course of business, less the cost of selling.
If the net realisable value of inventory is deemed lower than the cost, then allowance is established for inventory obsolescence. The amount to be allocated to inventory obsolescence is based on an estimation of the net realisa-ble value of inventory.
NET WORKING CAPITAL
This section describes components of net working capital of Adapteo. Adapteo defines net working capital as a net of non-current other receivables, non-current other liabilities, non-current and current provisions, inventories, trade and other receivables and trade and other payables. Net working capital consist of the following:
EUR thousands Note 31 Dec 2019 31 Dec 2018
Non-current
Other receivables 16 746 345
Other liabilities 17 -406
Provisions 18 -263 -50
Current
Inventories 15 4,372 6,838
Trade and other receivables 16 70,707 55,585
Trade and other payables 17 -91,828 -68,330
Provisions 18 -338
Total net working capital -16,671 -5,950
15 INVENTORIES
Adapteo has in-house production of modules. Inventories mainly consist of materials and supplies, which include raw materi-als and spare parts. Work in progress relates to unfinished modular space solutions.
EUR thousands 31 Dec 2019 31 Dec 2018
Materials and supplies 4,372 6,838
Total 4,372 6,838
ANNUAL REPORT WITH BOARD OF DIRECTORS’ REPORT AND FINANCIAL STATEMENTS 90
CONSOLIDATED FINANCIAL STATEMENTS
16 TRADE AND OTHER RECEIVABLES
EUR thousands 31 Dec 2019 31 Dec 2018
Non-current
Other receivables 746 345
Non-current other receivables 746 345
Current
Trade receivables 37,858 33,350
Accrued income on assembly 1 14,974 9,706
Accrued income on self-manufactured projects 1 10,071 4,574
Other accrued income 589 599
Other prepaid expenses 1,019 5,900
VAT receivables 3,502 108
Other receivables 2,693 1,348
Current trade and other receivables 70,707 55,585
Total trade and other receivables 71,453 55,931
1 Accrued income on assembly and self-manufactured projects relate to revenue recognition according to IFRS 15 and are treated as contract assets.
Trade receivables comprise of the following provisions for impairment:
EUR thousands 31 Dec 2019 31 Dec 2018
Trade receivables 39,226 33,540
Provision for impairment -1,368 -191
Total 37,858 33,350
Refer also to note 24 Financial risk management, Credit and counterparty risk.
A total amount of EUR 76 thousand in 2019, trade re-ceivables has been recognised in the income statement as impairment losses (2018: EUR 184 thousand).
Accounting policy Trade and other receivables represent amounts that Adapt-eo expects to collect from other parties. Trade receivables are non-interest-bearing and are generally on 14-60 days payment terms.
The classification of trade receivables is based on the business model's objective and on the contractual cash flow characteristics. Cash flows of trade receiva-bles consist solely of payments of principal and interest. Adapteo holds the trade receivables with the objective to
collect the contractual cash flows. Trade receivables are initially recognised at their transaction price as they do not have significant financing component. Subsequently, they are measured at amortised cost. Credit loss allowance is deducted from the receivables. The credit loss allow-ance is recognised using the simplified approach, under which allowance equal to lifetime expected credit losses is recognised. Trade receivables are included in current assets, except for maturities greater than 12 months after the balance sheet date. These are classified as non-current assets. Trade receivables are derecognised when the rights to receive cash flows from the investment have expired or have been transferred, and Adapteo has substantially transferred all risks and rewards of ownership.
For credit risk disclosures including ageing of trade receivables and description of the expected credit loss model, please see note 24.
ANNUAL REPORT WITH BOARD OF DIRECTORS’ REPORT AND FINANCIAL STATEMENTS 91
CONSOLIDATED FINANCIAL STATEMENTS
17 TRADE AND OTHER PAYABLES
EUR thousands 31 Dec 2019 31 Dec 2018
Non-current
Other liabilities 406
Non-current other liabilities 406
Current
Trade payables 25,998 18,196
Advances received 1 45,595 24,429
Accrued expenses 15,343 21,143
VAT liability 4,538 2,419
Other payables 353 2,143
Current trade and other payables 91,828 68,330
Total trade and other payables 92,234 68,330
1 Advances received consist of advances arising from customer agreements and are treated as contract liabilities in revenue recognition according to IFRS 15.
Material items included in accrued expenses relate mainly to personnel expenses and advances received. Accrued expenses include also accrued interests.
Accounting policy Trade and other payables mainly consist of amounts owed to suppliers, employees and customers. Trade and other payables represent liabilities for goods and services pro-
vided to Adapteo prior to the end of financial year which are unpaid. The amounts are unsecured and are usually paid within 30 days of recognition. Trade and other payables are presented as current liabilities unless payment is not due within 12 months after the reporting period. Accounting policy for share-based payments is presented in note 7 Employee benefit expenses.
ANNUAL REPORT WITH BOARD OF DIRECTORS’ REPORT AND FINANCIAL STATEMENTS 92
CONSOLIDATED FINANCIAL STATEMENTS
18 PROVISIONS
EUR thousandsGuarantee
provisionOther
provisionsTotal
provisions
At 1 Jan 2019 271 117 388
Unused provisions reversed -8 -117 -125
At 31 Dec 2019 263 263
of which
current
non-current 263 263
Total 263 263
EUR thousandsGuarantee
provisionOther
provisionsTotal
provisions
At 1 Jan 2018 544 544
Additions 87 87
Acquisitions 271 271
Unused provisions reversed -514 -514
At 31 Dec 2018 271 117 388
of which
current 221 117 338
non-current 50 50
Total 271 117 388
Other provisions include provisions related to onerous con-tracts and renovation.
Accounting policyProvisions are recognised when Adapteo has a present legal or constructive obligation as a result of past events, it is probable that a cash outflow will be required to settle the obligation and the amount can be estimated reliably. The unwinding of the discount to present value is included as interest expense within finance cost. Provisions are split between amounts expected to be settled within 12 months of the balance sheet date (current) and amounts expected to be settled later (non-current).
Guarantee provisions are made for estimated warranty claims in respect of products sold which are still under warranty at the end of the reporting period. Management estimates the provisions based on historical warranty claim information and any recent trends that may suggest future claims could differ from historical amounts. Provisions are booked for onerous contracts when the obligatory expendi-ture required to meet obligations exceeds the benefits yielded by the contract. Provisions are not recognised for any estimated future operating losses.
ANNUAL REPORT WITH BOARD OF DIRECTORS’ REPORT AND FINANCIAL STATEMENTS 93
CONSOLIDATED FINANCIAL STATEMENTS
FINANCING AND CAPITAL MANAGEMENT
This section summarises Adapteo’s net debt and how Adapteo manages its capital including liquidity management. Adapteo’s capital consists of equity and borrowings as shown on the balance sheet.
Adapteo's net debt items are presented in the following table:
EUR thousands Note 31 Dec 2019 31 Dec 2018
Borrowings 19 412,052 380,561
Loan receivables 23 -220 -224
Finance lease receivables 21 -8,233 -10,721
Cash and cash equivalents 20 -3,760 -2,377
Net debt 399,839 367,238
The following sets out an analysis of net debt and the movements in net debt:
Borrowings
EUR thousands
Cash and cash equi-
valents
Finance lease
recei- vables
Loan recei- vables
Bank loans
Loans from
Cramo Group
Repay-ments of
demerger related
liabilities to Cramo
PlcLease
liabilities
Other borro- wings Total
Net debt at 1 Jan 2019 -2,377 -10,721 -224 209,663 106,529 684 63,685 367,238
Net debt at 31 Dec 2018 -2,377 -10,721 -224 209,663 106,529 684 63,685 367,238
1 Included in the net cash inflow from operating activities.
ANNUAL REPORT WITH BOARD OF DIRECTORS’ REPORT AND FINANCIAL STATEMENTS 94
CONSOLIDATED FINANCIAL STATEMENTS
19 BORROWINGS
As at 31 December 2019 Adapteo’s borrowings consisted of bank loans, lease liabilities and a collateralised loan. Loans from Cramo Group presented as related party loans until the completion of the demerger were eliminated after the demerger as the corresponding intercompany loan receivable balances were transferred to Adapteo Plc in the demerger.
The carrying values of Adapteo’s borrowings are presented in the following table:
EUR thousands 31 Dec 2019 31 Dec 2018
Non-current
Bank loans 398,171 209,663
Convertible loan 53,633
Loans from Cramo Group 86,327
Collateralised loan 405
Lease liabilities 11,912
Finance lease liabilities 469
Total non-current borrowings 410,488 350,093
Current
Credit facility 3,577
Loans from Cramo Group 20,202
Collateralised loan 45 6,475
Lease liabilities 1,519
Finance lease liabilities 215
Total current borrowings 1,564 30,468
Total borrowings 412,052 380,561
Bank loans and credit facility after the DemergerAfter the demerger, a new term loan of EUR 400 million was drawn on 1 July 2019. The loan was used to repay the loans transferred in the demerger. The loans repaid on 1 July 2019 consist of the EUR 243 million bank loan attributable to the acquisition of NMG, and the EUR 125 million bank loan transferred as a general debt allocation in accordance with the demerger plan.
In addition, a loan to Cramo Plc of EUR 19.4 million was transferred as the general debt allocation and a receiva-ble from Cramo Plc of EUR 1.0 million was transferred as cash allocation in accordance with the demerger plan. In connection with the demerger Cramo has also invoiced Adapteo EUR 10.1 million of costs related to the listing and commencement of Adapteo's operations. These balances with Cramo Plc have been paid in full.
Adapteo has EUR 100 million revolving credit facility maturing in 2022 but, at the consent of the lenders, the maturity can be extended by twelve months. EUR 100 million revolving credit facility EUR million was unused on 31 De-cember 2019. In addition, Adapteo has EUR 10 million facility agreement until further notice and SEK 98 million multi-op-tion facility agreement valid until 30 June 2020. Both were unused on 31 December 2019.
Bank loans and convertible loan prior to the DemergerThe acquisition of Nordic Modular Group in October 2018 was financed with a new EUR 210 million bridge loan and a SEK 550 million (EUR 52.9 million) convertible loan, refer to note 12. The bridge loan has a maturity of two years and the interest is Euribor + 0.8% (0.8% interest rate floor).
In June 2019 Cramo made a partial repayment of the bridge loan at the amount of EUR 20 million. The convert-ible loan was repaid in April 2019 at the amount EUR 51.8 million (SEK 550 million) and accrued interests EUR 1.3 million and at the same time, a new loan with the amount of EUR 53 million was withdrawn. These loans were repaid in full in connection with the demerger.
The convertible loan had a maturity of 18 months and 5% fixed interest rate which was capitalised into loan principal. Adapteo measured the convertible instrument at amortised cost.
Covenants on bridge loan were monitored quarterly. The covenants were calculated from Cramo Group’s consolidat-ed financials.
ANNUAL REPORT WITH BOARD OF DIRECTORS’ REPORT AND FINANCIAL STATEMENTS 95
CONSOLIDATED FINANCIAL STATEMENTS
Collateralised loanIn 2010, Adapteo entered into an arrangement whereby Adapteo received an advance payment for future lease payments related to a number of lease contracts, togeth-er with financing which is collateralised by a guaranteed residual value of the leased modules at the end of the lease terms. The arrangement has been recognised as a liability consisting of the received advance payments and the pres-ent value of the guaranteed residual value.
Loans from Cramo Group prior to the DemergerLoans from Cramo Group represent loan balances owed by Adapteo entities to Cramo Plc that have been sepa-rately negotiated for Adapteo to meet its financing needs including cash pooling liabilities representing cash owed to Cramo as part of the centralised cash pool arrange-ments. These loan balances are considered as related party loans in the carve-out financial information. All loans from Cramo Group are at floating rate and the weighted average interest rate of these related party loans was at a 2% level during 2018.
At the date of the demerger, these related party liability balances were settled through the corresponding balances transferring from Cramo Plc to a new Adapteo parent com-pany. In addition, pursuant to the demerger plan a portion of Cramo Plc’s external were transferred to Adapteo parent company in connection with the demerger. The carve-out financial information has not been adjusted to reflect such additional portion of Cramo Plc’s external debt.
Lease liabilities 2019Adapteo leases rental machinery, vehicles and premises. Contracts for rental machinery and vehicles are typically made with maximum maturity of five years and premises with maximum maturity of 20 years but may have extension options.
Adapteo’s lease liabilities are included in the borrowings in the balance sheet as follows:
EUR thousands 31 Dec 2019
Non-current 11,912
Current 1,519
Total 13,431
Finance lease liabilities 2018In 2018 Adapteo had finance leases on certain vehicles and items of machinery. The length of these leases varies between three and five years. Finance lease liabilities main-ly had floating rates based on market rates between one and three months. Adapteo’s finance lease arrangements were located in Sweden and denominated in SEK. Table below reconciles the future minimum lease payments under finance leases by maturity as at 31 December 2018 to the present value of the total future minimum lease payments.
Later than one year but not later than five years 469
Total 684
Future finance charges on finance leases 2
Present value of minimum future finance lease payments 682
ANNUAL REPORT WITH BOARD OF DIRECTORS’ REPORT AND FINANCIAL STATEMENTS 96
CONSOLIDATED FINANCIAL STATEMENTS
Accounting policy
Financial liabilitiesBorrowings are recognised initially at fair value. Transac-tion costs are included in the initial measurement of the borrowings. Subsequently, borrowings are measured at amortised cost using the effective interest method. In the effective interest method, transaction costs related to bor-rowings are amortised over the term of the borrowings and recognised as finance costs as part of interest expense. Borrowings are derecognised when loan has been repaid or liability has been extinguished for example in connection with refinancing.
Adapteo classifies a liability as current if it the liability is due to be settled within twelve months after the reporting period; or it does not have an unconditional right to defer settlement of the liability for at least twelve months after the reporting period.
Fees related to loan commitments are recognised as transaction costs to the extent that it is probable that the total loan commitment or a part of it will be raised. This means that the fee is recognised in the balance sheet until the loan is raised. In connection with the drawdown, the fee related to loan is recognised as part of the transaction costs against the loan balance. To the extent there is no evidence that it is probable that the loan will be raised, the fee is recognised as prepaid expense in respect of the liquidity related services and is accrued over the term of the commitment.
For the measurement policies of the fair values of all financial assets and liabilities, see note 23.
Lease liabilities 2019Lease liabilities include the net present value of the following lease payments:
fixed payments (including in-substance fixed payments), less any lease incentives receivable
variable lease payment that are based on an index or a rate
amounts expected to be payable by the group under residual value guarantees
the exercise price of a purchase option if the group is reasonably certain to exercise that option, and
payments of penalties for terminating the lease, if the lease term reflects the group exercising that option.
There are no significant variable lease payments or options included in the Adapteo’s lease arrangements.
Lease payments are allocated between principal and finance cost. The finance cost is charged to profit or loss over the lease period so as to produce a constant periodic rate of interest on the remaining balance of the liability for each period.
Finance lease liabilities 2018The rental agreements concerning property, plant and equipment where Adapteo carries a significant share of the risks and rewards incidental to ownership are classified as finance lease contracts. Assets acquired through finance lease are capitalised at the lease’s commencement at the lower of the fair value of the leased asset and the present value of the minimum lease payments. Property, plant and equipment acquired under finance leases are depreciated over the economic useful life of the asset or the lease term, if there is uncertainty about the acquisition of ownership at the end of the rental period. Lease payments are allocated between the liability and finance costs so as to produce a constant periodic rate of interest on the remaining balance of the liability for each period. Lease liabilities are included in financial liabilities.
Key judgement and estimates – lease termAccounting for leases require the use of judgement from different aspects of which determining the discount rate and determining the lease term have been assessed as the most critical ones. Discount rates used are centrally es-tablished as the Group’s calculated incremental borrowing rate for each entity. The lease term is determined based on the information available in the lease agreement and other relevant facts and circumstances. For example, for leases valid until further notice, the lease term is often estimated based on the experience and estimation about how long the contract is expected to be valid.
20 CASH AND CASH EQUIVALENTS
Cash and cash equivalents amounted to EUR 3 760 thou-sand on 31 December 2019 (31 December 2018: EUR 2 377 thousand).
Accounting policy Cash and cash equivalents include cash in hand and de-mand deposits available at call. Cash and cash equivalents have original maturities of three months or less. Cash at banks earns interest at floating rates based on daily bank deposit rates. Cash and cash equivalents are measured at amortised cost.
ANNUAL REPORT WITH BOARD OF DIRECTORS’ REPORT AND FINANCIAL STATEMENTS 97
CONSOLIDATED FINANCIAL STATEMENTS
During the financial year 2019, the impact of change in lease terms due to lessees exercising extension options resulted as an increase of EUR 1 269 thousand in net sales (2018: EUR 178 thousand).
Other information about leases where Adapteo is a lessor:
EUR thousands 2019
Rental revenue from operative leases (note 3) 132,728
Interest income from finance lease receivables (note 4) 1,053
Selling profit from finance lease receivables 33
21 FINANCE LEASE RECEIVABLES
Adapteo offers long-term leasing as an alternative to buying. These leases are classified as finance leases where Adapteo is as a lessor. The customers consist mainly of Swedish municipalities. The following table shows how the amount of the net investment in a finance lease (finance lease receivable) is determined:
EUR thousands 31 Dec 2019 31 Dec 2018
Minimum lease payments 8,207 10,623
Unguaranteed residual value 2,268 2,969
Gross investment 10,476 13,592
Unearned finance income -2,242 -2,871
Net investment (finance lease receivable) 8,233 10,721
The following table presents the maturity of the gross investment amounts and the present value of minimum lease payments.
31 Dec 2019
EUR thousandsGross
payments
Present value of lease (finance lease
receivables)
Within 1 year 4,268 4,235
1-5 years 4,723 3,604
After 5 years 1,485 395
Total 10,476 8,233
31 Dec 2018
EUR thousandsGross
payments
Present value of lease (finance lease
receivables)
Within 1 year 5,388 5,243
1-5 years 6,354 4,913
After 5 years 1,850 565
Total 13,592 10,721
Accounting policy For those lease agreements of property, plant and equip-ment where Adapteo acts as lessor, that transfer to the lessee substantially all the risks and rewards of ownership are classified as finance leases and recognised as receiva-ble in the balance sheet. The receivable is measured initially at an amount equal to the present value of the minimum lease payments. The rental income derived from these finance lease agreements is recognised on a straight-line basis for each period during the lease term so as to produce a constant periodic rate of interest on the asset. The inter-est income is presented as other operating income in the income statement.
Key judgement and estimates – Determining the lease term for finance leases where Adapteo is a lessorIn determining the lease term, management considers all facts and circumstances that create an economic incentive to exercise an extension option. Extension options are only included in the lease term if the lease is reasonably certain to be extended. The assessment is reviewed if a signifi-cant event or a significant change in circumstances occurs which affects this assessment.
ANNUAL REPORT WITH BOARD OF DIRECTORS’ REPORT AND FINANCIAL STATEMENTS 98
CONSOLIDATED FINANCIAL STATEMENTS
22 EQUITY
Adapteo Plc was established as a result of the partial demerger of Cramo Plc on 30 June 2019. Thus it is not possible to present share capital or equity reserves for the periods prior to the demerger.
On the demerger date 30 June 2019, Adapteo issued 44,682,697 new shares and the shareholders of Cramo
Adapteo has one class of shares with equal voting rights. All the issued and subscribed shares have been fully paid to the company. Shares do not have a nominal value. The company has no treasury shares.
Invested equity As Adapteo has not formed a separate legal group nor pre-sented any stand-alone consolidated financial statements prior to the completion of the demerger, it has not been feasible to present share capital or an analysis of equity reserves prior to the demerger. Until 30 June 2019 the net assets of Adapteo are represented by capital invested in Adapteo and shown as “Invested equity” in the consolidat-ed balance sheet comprising of cumulative translation dif-ferences as well as invested equity and retained earnings.
received as demerger consideration one Adapteo share for each Cramo share that they hold. Shares and share capital have been registered in the Finnish Trade Register on 30 June 2019.
The total equity has decreased from EUR 214.6 million as at 31 December 2018 to EUR 187.4 million as at the demerger date 30 June 2019 mainly due to portion of Cramo's exter-nal general debt transferred to Adapteo in the demerger as at 30 June 2019 in accordance with the demerger plan as well as decreases in allocated carve-out debt balances prior to the demerger. Net of these items has increased the amount of borrowings and decreased the amount of total equity.
Translation differencesTranslation differences arise from the consolidation of the financial statements of subsidiaries outside the Euro zone.
Number of shares, share capital and reserve for invested unrestricted equity
EUR thousandsOutstanding shares (pcs)
Share capital (EUR thousands)
Reserve for invested unrestricted equity
(EUR thousands)
30 June 2019 44,682,697 10,000 67,799
31 Dec 2019 44,682,697 10,000 67,799
ANNUAL REPORT WITH BOARD OF DIRECTORS’ REPORT AND FINANCIAL STATEMENTS 99
CONSOLIDATED FINANCIAL STATEMENTS
Accounting policy
Determination of fair valuesFor borrowings, when the fair value is calculated for disclo-sure purposes, the fair value is based on discounted cash flows. The rate used for measurement is the rate which would apply for the Adapteo’s new external financing and investments. The overall rate consists of a risk-free rate and the risk premium for the company. The fair value of lease contracts is computed by discounting the cash flows with a rate corresponding to similar contracts at the meas-urement date.
The fair value of trade receivables and trade payables corresponds to the cost. The effect of discounting is imma-terial due to short maturity of these items. For borrowings, the fair values are not materially different to their carrying amounts, since the contractual interest on borrowings is close to current market rates. For other financial assets and liabilities, carrying values correspond to fair values.
23 CLASSIFICATION OF FINANCIAL ASSETS AND LIABILITIES
The following table presents Adapteo’s financial assets and liabilities during the years presented:
EUR thousands Note 31 Dec 2019 31 Dec 2018
Non-current financial assets at amortised cost
Finance lease receivables 21 3,919 5,478
Loan receivables 14 220 224
Total 4,139 5,702
Current financial assets at amortised cost
Finance lease receivables 21 4,314 5,244
Trade receivables 16 37,858 33,350
Cash and cash equivalents 20 3,760 2,377
Total 45,932 40,971
Current derivative financial instruments at fair value 201
Total financial assets 50,273 46,673
Non-current financial liabilities at amortised cost
Borrowings 19 410,488 350,093
Total 410,488 350,093
Current financial liabilities at amortised cost
Borrowings 19 1,564 30,468
Trade payables 17 25,998 18,196
Total 27,563 48,664
Current derivative financial instruments at fair value 718
Total financial liabilities 438,768 398,757
Derivative financial instrumentsDerivatives are initially recognised at fair value on the date a derivative contract is entered into and are subsequent-ly re-measured at their fair value. Derivatives, for which hedge accounting is not applied, are classified as a current asset or liability. Derivatives, which are entered in with hedging purposes, but for which hedge accounting is not applied or cannot be applied are measured at fair value through profit and loss. Changes in the fair value of these derivative instruments are recognised immediately through profit or loss and presented in the income statement within finance items.
In the fair value hierarchy, derivative contracts are classified on level 2. The fair value of financial instruments that are not traded in an active market is determined using valuation techniques which maximise the use of observable market data and rely as little as possible on entity-specific estimates. If all significant inputs required to fair value an instrument are observable, the instrument is included in level 2.
ANNUAL REPORT WITH BOARD OF DIRECTORS’ REPORT AND FINANCIAL STATEMENTS 100
CONSOLIDATED FINANCIAL STATEMENTS
24 FINANCIAL RISK MANAGEMENT
The objective of the financial risk management is to min-imise the negative effects on Adapteo’s financial perfor-mance caused by changes in financial markets and thus help to secure profitability. The Group´s financial risks consist of credit risk, funding risk, liquidity risk and market risk (including currency risk and interest rate risk). Adapteo has set its own centralised treasury function and treasury policy which is approved by the Board of Adapteo. The Board has the overall responsibility for managing financial risks. Operational management of financial risks is carried out centrally by the Group Treasury in co-operation with operating units under the Treasury Policy where the objec-tives and limits for financing activities are defined. Respon-sibilities in between the Group Treasury and operating units are defined in the Group´s treasury policy.
Interest rate riskFluctuations in market interest rates have an effect on interest outflows and the fair value of interest-bearing re-ceivables and loans payable. The objective of interest rate risk management is to mitigate the impact of interest rate changes in the consolidated income statement, balance sheet and cash flow, while also taking into an account the market value of net debt.
Adapteo’s borrowings are with variables interest rate which expose Adapteo to cash flow interest rate risk. Lease liabilities and receivables are at fixed rates and expose Adapteo to fair value interest rate risk.
If interest rates had been 1 percentage points higher with all other variables held constant, the impact to pre-tax profit for the year would have been EUR 1 412 thousand lower on 31 December 2019 calculated from the facility of EUR 400 million. Interest rate level is so low that the decrease in interest rates would not have had any material impact on Adapteo’s profit.
Adapteo’s borrowings are presented in note 19 Borrow-ings.
Currency riskAdapteo operates internationally and is exposed to risks arising from foreign exchange rate fluctuations, primarily from exposures with respect to the Swedish krona. Foreign exchange risk arises from internal funding as well as recog-nised assets and liabilities in other than functional currency of the group entity, and from net investments in foreign operations.
The objective of the foreign exchange risk manage-ment is to limit the uncertainties associated with foreign exchange rate fluctuations and their effect on Adapteo’s consolidated profit, cash flows and balance sheet.
Foreign exchange risk arising from internal funding and recognised assets and liabilities is managed primarily through derivative contracts.
Sales of local entities are mainly carried out in the func-tional currency of those entities. Purchases are carried out mainly in local currencies but also in euros. The currency risk arising from sales and purchases is considered insignif-icant. Hence, according to the Treasury Policy, future sales and purchases are not hedged.
Translation risk is caused by the parent company’s for-eign currency denominated net investments in foreign sub-sidiaries. Translation differences are recognised in equity on consolidation. The most significant foreign currency net investments are denominated in Swedish krona. Other cur-rencies do not create significant translation risk. Adapteo does not hedge translation risk.
Credit and counterparty riskAdapteo´s credit and counterparty risk arise mainly from credit exposures to customers, including outstanding trade and finance lease receivables and committed transactions, as well as cash and cash equivalents, derivative financial instruments and deposits with banks and financial in-stitutions. The Group Treasury is monitoring closely the outstanding receivable balances and local entities are responsible for managing the credit risk related to operat-ing items, such as trade receivables. Adapteo constantly monitors the credit status of its clients and when neces-sary, guarantees are required and client´s paying behavior is monitored actively. Most of Adapteo’s clients are munic-ipalities and other public sector, low credit risk entities in stable economies.
The Group Treasury is responsible for managing the Group’s financial credit risk through counterparty limits. A list defining all permitted external counterparties with cor-responding limits is defined in Adapteo treasury policy. No impairment has been recognised on derivative instruments or investment products in the reporting period.
The balance sheet values of receivables and cash and cash equivalents best correspond to the amount which is the maximum credit risk exposure without taking into account the value of any collateral. Trade receivables or finance lease receivables do not contain any significant concentration of credit risk.
Impairment of trade receivables The maturity structure of trade receivables, credit losses and change of provision for bad debt is presented below. Trade receivables are arising from large number of custom-ers and are mainly denominated in EUR and SEK and there-fore considered mitigating the concentration of risk.
ANNUAL REPORT WITH BOARD OF DIRECTORS’ REPORT AND FINANCIAL STATEMENTS 101
CONSOLIDATED FINANCIAL STATEMENTS
Movements in the provision for impairment of trade receivables:
EUR thousands 2019
At 1 Jan 191
Increase in loan loss allowance recognised in profit or loss during the year 1,253
Receivables written off during the year as uncollectible -76
At 31 Dec 1,368
EUR thousands 2018
At 1 Jan – calculated under IAS 39 249
Amounts restated through opening retained earnings 12
Opening loss allowance as at 1 January 2018 – calculated under IFRS 9 261
Increase in loan loss allowance recognised in profit or loss during the year 184
Receivables written off during the year as uncollectible -301
Business acquisitions 48
At 31 Dec 191
Adapteo applies the simplified approach to providing for expected credit losses, which requires the use of the life-time expected credit loss provision for all trade receivables. To measure the expected credit losses, trade receivables have been grouped on shared credit risk characteristics based on geographical areas and the days past due.
The loss allowance as at 31 December is determined based on expected credit losses (“ECL) as a combination of statistical model (collective assessment) and specific review (case-by-case analysis). The collective assessment applied uses external Probability of Default factors taking into consideration statistical data and forward-looking
macroeconomic factors. Allowances in past due trade receivables relatively reflect the age of the receivable and applied Probability of Default factors. Allowances in ageing categories are followed-up on a statistical basis where indications of material changes exist. Secondly, Adapteo conducts a specific review, which is takes into account local, client specific consideration of collectability of the receivable. The specific review focuses on the expected credit losses on material trade receivables taking into con-sideration all relevant indications known.
Credit losses are recognised as an expense in other operating expenses.
ANNUAL REPORT WITH BOARD OF DIRECTORS’ REPORT AND FINANCIAL STATEMENTS 102
CONSOLIDATED FINANCIAL STATEMENTS
Trade receivables are written off as uncollectible when there is no reasonable expectation of recovery. Indicators that there is no reasonable expectation of recovery include, amongst others, the debtor’s insolvency, bankruptcy, liqui-dation or a failure to make contractual payments. If there are such indicators, Adapteo analyses the collectability of trade receivables case by case.
A default on a financial asset is when the counterparty fails to make contractual payments within 90 days of when they fall due.
Impairment of loan receivables, finance lease receivables and cash and cash equivalentsAdapteo uses general model to assess impairment loss for loan receivables, finance lease receivables and cash and cash equivalents.
Adapteo recognises lifetime ECL when there has been a significant increase in credit risk since initial recognition. However, if the credit risk on the financial instrument has not increased significantly since initial recognition, Adap-teo measures the loss allowance for that financial instru-ment at an amount equal to 12-month ECL.
Lifetime ECL represents the expected credit losses that will result from all possible default events over the expect-ed life of a financial instrument. In contrast, 12-month ECL represents the portion of lifetime ECL that is expected to result from default events on a financial instrument that are possible within 12 months after the reporting date.
Despite the foregoing, Adapteo assumes that the credit risk on a financial asset has not increased significantly since initial recognition if the financial instrument is determined to have low credit risk at the reporting date. Adapteo has assessed that loan receivables, finance lease receivables and cash and cash equivalents have low credit risk, and the loss allowance recognised during the period was therefore limited to 12 months expected losses. Management consid-er instruments to be ‘low credit risk’ when they have a low risk of default and the counterparty has a strong capacity to meet its contractual cash flow obligations in the near term. To be concluded to be ‘low credit risk’ the counter-party should have a strong financial position and there should not be past due amounts. Based on the management assessment, credit loss allowance for loan receivables, finance lease receivables and cash and cash equivalents is insignificant. For that reason, no credit loss allowance for them is recognised. The credit loss allowance need is followed-up on a regular basis.
Adapteo regularly monitors the effectiveness of the cri-teria used to identify whether there has been a significant increase in credit risk and revises them as appropriate to ensure that the criteria are capable of identifying signif-icant increase in credit risk before the amount becomes past due. Adapteo considers the probability of default upon initial recognition of asset and whether there has been a significant increase in credit risk on an ongoing basis throughout each reporting period. To assess that Adapteo compares the risk of a default occurring on the asset as at
Ageing analysis of trade receivables at 31 December 2019:
EUR thousandsWeighted
average loss rateGross carrying
amountImpairment
loss allowance Total
Trade receivables, not due at reporting date 0.1% 26,207 -35 26,172
Due 1-30 days 1.1% 5,113 -56 5,056
Due 31-60 days 2.4% 1,591 -38 1,552
Due 61-90 days 4.9% 1,866 -91 1,775
Due 91-120 days 18.7% 3,233 -604 2,629
Due 121-180 days 25.2% 502 -127 375
Due 181-365 days 39.4% 192 -76 116
Due over 365 days 65.1% 522 -340 182
Total 39,226 -1,368 37,858
Ageing analysis of trade receivables at 31 December 2018:
EUR thousandsWeighted
average loss rateGross carrying
amountImpairment
loss allowance Total
Trade receivables, not due at reporting date 0.01% 26,924 -1 26,922
Due 1-30 days 0.04% 3,220 -1 3,219
Due 31-60 days 0.05% 21 0 21
Due 61-90 days 1.13% 2,366 -27 2,340
Due 91-120 days 4.89% 435 -21 414
Due 121-180 days 5.02% 88 -4 84
Due 181-365 days 17.98% 211 -38 173
Due over 365 days 35.56% 274 -97 177
Total 33,540 -191 33,350
ANNUAL REPORT WITH BOARD OF DIRECTORS’ REPORT AND FINANCIAL STATEMENTS 103
CONSOLIDATED FINANCIAL STATEMENTS
the reporting date with the risk of default as at the date of initial recognition. It considers available reasonable and supportive forwarding-looking information.
Regardless of the above, a significant increase in credit risk is presumed if a debtor is more than 30 days past due in making a contractual payment. A default on a financial asset is when the counterparty fails to make contractual payments within 90 days of when they fall due. Financial assets are written off when there is no reasonable expecta-tion of recovery.
Adapteo has not historically had loan receivables, finance lease receivables or cash and cash equivalents with increased credit risk or which would have been written off due to events of default.
Funding risk and liquidity riskAdapteo´s management evaluates and monitors con-tinuously the amount of funding required in the Group´s business activities to ensure it has adequate liquidity to fund its operations, repay its loans at maturity, pay annual dividends and meet other financial obligations. Adapteo’s Group Treasury is responsible for maintaining sufficient funding and control maturity profile of external loans. In order to optimise the use of liquid funds within Adapteo, cash management and funding is centralised to Adapteo’s Group Treasury.
Capital management Adapteo’s objective for managing capital are to enable the ability to operate effectively in capital markets and main-tain optimal returns to shareholders and benefits for other stakeholders.
In order to maintain or adjust the capital structure, the Group may adjust the amount of dividends paid to share-holders, return capital to shareholders, issue new shares or sell assets to reduce debt. Borrowings activities are
Adapteo’s Group Treasury manages the funding risk by using cash and cash equivalents, Group accounts with overdraft facility and credit facility. Adapteo’s cash and cash equivalents amounted to EUR 3.8 million at the end of December 2019. Adapteo has undrawn EUR 10 million overdraft facility and undrawn SEK 98 million committed credit facility. In addition, Adapteo has EUR 100 million committed revolving credit facility maturing in 2022 but, at the consent of the lenders, the maturity can be extended by twelve months. This revolving credit facility was unused on 31 December 2019.
EUR 400 million term loan facility has been fully drawn upon the registration of the partial demerger on 1 of July 2019 and is maturing in June 2022. Adapteo´s external loans contain two financial covenants based on the ratio of the Group´s net debt to EBITDA and interest coverage ratio. During the reporting period the Group was in full compli-ance with the covenants of its financing agreements
In order to decrease the funding risk the Group aims to diversify the maturity structure of its interest-bearing debt and negotiates new committed credit facilities well in advance of need.
The table below analyses Adapteo’s financial liabilities into relevant maturity groupings based on the remain-ing period at the balance sheet date to the contractual maturity date. The amounts disclosed in the table are the contractual undiscounted cash flows.
centralised to the parent to the extent possible and cash resources are distributed within the group by the treasury department.
Adapteo monitors capital structure based on the ratio of net interest-bearing liability to EBITDA (Net Debt/Com-parable EBITDA). The Group has set the long-term financial target for net debt to comparable EBITDA ratio of 3.5x– 4.5x.
Maturities of financial liabilities at 31 Dec 2019
Maturities of financial liabilities at 31 Dec 2018
Less than 1 year
1-2 years
2-5 years Total
Carrying value
Bank loans 1,677 211,341 213,018 209,663
Convertible loan 57,656 57,656 53,633
Credit facility 3,605 3,605 3,577
Loans from Cramo Group 22,503 18,018 73,727 114,248 106,529
Collateralised loan 6,657 6,657 6,475
Finance lease liabilities 215 235 235 684 684
Trade payables 18,196 18,196 18,196
Total 52,853 287,249 73,962 414,063 398,757
ANNUAL REPORT WITH BOARD OF DIRECTORS’ REPORT AND FINANCIAL STATEMENTS 104
CONSOLIDATED FINANCIAL STATEMENTS
Accounting policy A contingent liability is a possible obligation, incurred as a result of earlier events, whose existence is confirmed only
when an uncertain event outside the control of Adapteo is realised. An existing liability that is not likely to require the fulfilment of the payment obligation or whose amount cannot be reliably measured is also considered a contingent liability.
OTHER NOTES
This section includes other information that must be disclosed to comply with accounting standards and pronouncements.
25 COLLATERALS AND CONTINGENT LIABILITIES
Adapteo has the following off–balance sheet commitments:
EUR thousands 31 Dec 2019 31 Dec 2018
Guarantees and commitments given on behalf of Group companies 1,254 843
Investments 12,260 17,559
Debts, secured by collateral
Collateralised loan 450 5,806
Finance lease liabilities 684
Collateral given
Pledges, collateralised loan 482 4,727
Pledges, finance lease liabilities 682
Operating lease commitments 2018Adapteo has entered into commercial lease agreements on rental machinery and vehicles with the maximum maturity of five years, and premises with the maximum maturity of twenty years.
The future aggregate minimum lease payments under non-cancellable operating leases as at 31 December 2018:
EUR thousands 31 Dec 2018
Within one year 2,608
Later than one year but not later than five years 12,113
Later than five years 1,080
Total 15,801
Risk related to Covid-19 Since Covid-19 came to Northern Europe in early 2020, Adapteo is monitoring its impact on markets, employees, and business processes inside and outside of the company on a daily basis. Continuity plans to mitigate its effects are being continuously reviewed.
Adapteo has seen a decrease in demand for event busi-ness and other projects with short rental periods. There has also been time lags, and thus lower demand, for offices in the private sector as expansion plans have been pushed out
in time.In the core business, social infrastructure, Adapteo has entered the important peak season for new order intake from mid-February to the end of April. The escalation of Covid-19 will affect Adapteo's customers in their deci-sion-making processes and thus the company. The total effects of this cannot be quantified today.
However, the long-term needs in the public sector re-main and Adapteo’s view of market development over time stays unchanged.
ANNUAL REPORT WITH BOARD OF DIRECTORS’ REPORT AND FINANCIAL STATEMENTS 105
CONSOLIDATED FINANCIAL STATEMENTS
26 ADAPTEO ENTITIES AND FOREIGN CURRENCY TRANSLATION
Adapteo's legal entities as at 31 December 2019 are as follows.
Name Domicile Ownership of
parent company Ownership of
the Group
Adapteo Oyj Finland 100%
Adapteo Finland Oy Finland 100% 100%
Adapteo AB Sweden 100% 100%
Adapteo Holding AB Sweden 100% 100%
Adapteo AS Norway 100% 100%
Adapteo A/S Denmark 100% 100%
Adapteo GmbH Germany 100% 100%
Adapteo Services AB Sweden 100%
Temporent AB Sweden 100%
Flexator AB Sweden 100%
Flexator Leasing AB Sweden 100%
Flexihus Rent i Sverige AB Sweden 100%
Flexator Oy Finland 100%
Temporent AS Norway 100%
Temporent A/S Denmark 100%
Accounting policy
SubsidiariesAdapteo has control of an entity when it is exposed, or has rights, to variable returns from its involvement with the investee and Adapteo has ability to affect those returns through its power over the investee. All the facts and circumstances shall be considered when assessing the control. The investor shall reassess whether it controls an investee if facts and circumstances indicate that there are changes of the elements of control. Control means that the investor has existing rights that give it the current ability to direct the relevant activities, i.e. the activities that signif-icantly affect the investee’s return. Acquired subsidiaries are consolidated from the date on which control is trans-ferred to the group and are no longer consolidated from the date that control ceases. Adapteo has 100% control over all its subsidiaries.
Intercompany itemsAll Adapteo’s intercompany transactions, receivables, liabilities and unrealised gains, as well as its internal profit distribution are eliminated; unrealised losses are also elimi-nated unless the costs cannot be recovered.
Foreign currency translationItems concerning the performance and financial position of Adapteo entities are measured using the currency of the primary economic environment in which the entities operate (functional currency). The financial information is presented in euros, which is the functional and presentation currency of the parent company.
Foreign currency transactions are recorded in the functional currency using the rate of exchange prevailing at the transaction date. In practice, it is often necessary to use a rate that is close to the rate of the transaction date. Foreign currency monetary items are translated into the functional currency using the rates of the last trading day of the reporting period. Foreign currency non-mone-tary items, which have been recognised at fair value, are translated into the functional currency using the rate of fair value measurement date. Otherwise, non-monetary items are translated using the rate of the transaction date. Gains and losses resulting from the settlement of such transactions and from the translation of monetary assets and liabilities are recognised in the consolidated statement of comprehensive income. The foreign exchange gains and losses from operating activities are included in the respec-tive items above operating profit. The foreign exchange gains and losses related to financing items are included in the finance income and finance costs.
Adapteo has ownership in the following joint venture as at 31 December 2019. See more in note 14. Adapteo has no associat-ed companies.
Joint venture Domicile Ownership of
parent company Ownership of
the Group
Ungabostäder Haninge AB Sweden 50%
ANNUAL REPORT WITH BOARD OF DIRECTORS’ REPORT AND FINANCIAL STATEMENTS 106
CONSOLIDATED FINANCIAL STATEMENTS
27 RELATED PARTY TRANSACTIONS
Until the demerger date 30 June 2019, Adapteo’s related parties included the parent company Cramo Plc, Cramo Group companies other than Adapteo entities and a joint venture. Related parties also include key management personnel and their close family members as well as entities controlled by these persons.
As from the demerger date 30 June 2019 Adapteo’s related parties include the parent company Adapteo Plc and its subsidiaries as well as a joint venture. Related parties also include key management personnel and their close family members as well as entities controlled by these persons. Key management personnel include Adapteo's group management team and the members of the Board of Directors.
Adapteo’s transactions with Cramo Group companiesAt the date and after the demerger, transactions with Cra-mo Group are not classified as related party transactions.
Loans to related parties At 31 December 2019 Adapteo had a EUR 220 thousand loan receivable from a joint venture Ungabostäder Haninge AB (31 December 2018: EUR 224 thousand). Information on joint ventures is presented in note 14.
Translating the financial statements of foreign entities Income statements of foreign entities are translated into euros at the weighted average exchange rates for the year, while balance sheets are translated using the exchange rates of the last trading day of the reporting period. The translation of the profit (loss) for the period using different rates in the consolidated income statement and the bal-ance sheet causes a translation difference, which is recog-nised in equity and whose adjustment is recognised in other comprehensive income items. Translation differences aris-
ing from the elimination of the acquisition cost of foreign subsidiaries and the translation of the accumulated equity items after the acquisition are recognised in other com-prehensive income items. When the control over subsidi-ary changes, the accumulated translation differences are recognised as part of gain or loss. Fair value adjustments and goodwill arising from acquisitions of foreign entities are treated as assets and liabilities of the foreign entities in their functional currency. They are translated into euros at the rate of the last trading day of the reporting period.
Transactions with Cramo Group before the demerger date are presented as related party transactions.
Adapteo’s sales to Cramo Group companies comprise of sales of modular buildings. Adapteo’s purchase from Cramo Group companies comprise purchase of modular build-ings and leasing of centrally owned fleet. Trade and other receivables and trade and other payables comprise of items arising in the ordinary course of business.
In addition, prior to the demerger, Cramo Plc had equity and financing transactions with Adapteo which led to recognition of receivables and payables with Cramo Group as presented in the table above. Short-term and long-term borrowings represent loan balances owed by Adapteo to Cramo Plc that have been arranged for Adapteo to meet its financing needs. Interest expenses comprise interest on Cramo’s financing to Adapteo.
Equity transactions made with Cramo Group have been presented in the statement of changes in equity.
Related party transactions
EUR thousands 2019 1 2018
Net sales 100 1,053
Purchases 333 457
Interest expenses -865 -1,821
1 For the period 1 January to 30 June 2019.
EUR thousands 31 Dec 2019 31 Dec 2018
Loans from Cramo Group 106,529
Receivables 361
Payables 1,150
ANNUAL REPORT WITH BOARD OF DIRECTORS’ REPORT AND FINANCIAL STATEMENTS 107
CONSOLIDATED FINANCIAL STATEMENTS
Remuneration for Group Management Team and the BoardAdapteo’s Group Management Team and the Board were appointed after completion of demerger 30 June 2019. Thus remuneration information is presented only for periods after the demerger.
President and CEO
EUR thousands1 July to
31 Dec 2019
Salaries, bonuses and fringe benefits 182
Post-employment benefits 31
Share-based payments 99
Total 313
Other Group Management Team
EUR thousands1 July to
31 Dec 2019 2018 1
Salaries, bonuses and fringe benefits 346 350
Termination benefits 38 77
Post-employment benefits 75 42
Share-based payments 66 116
Total 525 585
Total compensation to President and CEO and other Group Management Team 838
1 Since Adapteo did not have separate management team prior to the demerger 30 June 2019, the table above presents the share of employee benefits of Cramo’s key management allocated to Adapteo and recognised in carve-out financial information.
Board members
EUR thousands1 July to
31 Dec 2019
Peter Nilsson, Chairman 43
Carina Edblad 20
Outi Henriksson 26
Andreas Philipson 20
Joakim Rubin 24
Total 133
28 AUDIT FEES
EUR thousands 2019 2018
Authorised Public Accountants KPMG
Audit fees 411 117
Tax consultation 4
Other services 55
Total 411 177
Other audit companies
Audit fees 8
Other services 1
Total 8
Total audit fees 411 185
ANNUAL REPORT WITH BOARD OF DIRECTORS’ REPORT AND FINANCIAL STATEMENTS 108
CONSOLIDATED FINANCIAL STATEMENTS
Accounting policy Basic earnings per share are calculated by dividing the net profit attributable to the owners of the parent company by the weighted average number of shares outstanding during the period. Diluted earnings per share are calculated
in relation to leases which had previously been classified as operating leases under the principles of IAS 17 Leases. These liabilities were measured at the present value of the remaining lease payments. Average incremental borrowing rate used was 2.5% as of 1 January 2019.
For leases previously classified as finance leases, the entity recognised the carrying amount of the lease asset and lease liability immediately before transition as the carrying amount of the right-of-use asset and the lease liability at the date of initial application. The measurement principles of IFRS 16 are only applied after that date. The remeasurements to the lease liabilities were recognised as adjustments to the related right-of-use assets immediately after the date of initial application.
The following table presents the reconciliation of oper-ating lease commitments disclosed as at 31 December 2018 and the lease liability recognised as at 1 January 2019:
29 EARNINGS PER SHARE
2019
Profit for the year attributable to the owners of the parent company, EUR thousands 8,392
Basic weighted average number of shares outstanding, thousands of shares 44,683
Basic earnings per share, EUR 0.19
Dilution effect of share-based incentive plans, thousands of shares 69
Diluted weighted average number of shares outstanding, thousands of shares 44,752
Diluted earnings per share, EUR 0.19
EUR thousands
Operating lease commitments disclosed as at 31 December 2018 15,801
Discounted using the lessee’s incremental borrowing rate at the date of initial application 14,789
Finance lease liabilities recognised as at 31 December 2018 684
Short-term/low-value leases recognised on a straight-line basis as expense -1,101
Lease liability recognised as at 1 January 2019 14,372
by adjusting the weighted average number of all shares to assume conversion of all potentially dilutive shares. The Group has share plans with a dilutive effect, which increas-es the number of shares.
30 NEW AND FORTHCOMING ACCOUNTING STANDARDS
New and amended standards applied Adapteo has applied the following new and amended standards that have come into effect as from 1 January 2019.
IFRS 16 LeasesThe new standard replaced IAS 17 standard and related interpretations. IFRS 16 requires the lessees to recognise the lease agreements on the balance sheet as right-of-use assets and lease liabilities. There are two exceptions availa-ble; these relate to either short-term contracts in which the lease term is 12 months or less, or to low value items. Adapteo has adopted IFRS 16 using the modified retrospec-tive approach from 1 January 2019 and has not restated comparatives for the 2018 reporting period, as permitted under the specific transitional provisions in the standard. On adoption of IFRS 16, Adapteo recognised lease liabilities
The right-of-use assets were measured at the amount equal to the lease liability, adjusted by the amount of any prepaid or accrued lease payments relating to that lease recognised in the balance sheet as at 31 December 2018. There were no onerous lease contracts that would have required an adjustment to the right-of-use assets at the date of initial application.
The recognised right-of-use assets are included in the property, plant and equipment as described in note 11.
The transition of IFRS 16 increased property, plant and equipment by EUR 16.1 million and lease liabilities by EUR 14.4 million and decreased finance lease liabilities by EUR 0.7 million in the opening balance on 1 January 2019. The difference between opening balance of property, plant
ANNUAL REPORT WITH BOARD OF DIRECTORS’ REPORT AND FINANCIAL STATEMENTS 109
CONSOLIDATED FINANCIAL STATEMENTS
and equipment and lease liabilities was due to prepay-ments made before the effective date of the standard. Prepayments have not impact on items on property, plant and equipment as they were recognised to decrease the opening balance of the lease liability.
In applying IFRS 16 for the first time, Adapteo has used the following practical expedients permitted by the stand-ard: for the short-term contracts in which the lease term is 12 months or less (except depot and premises contracts which are capitalised in the balance sheet to land and buildings although short-term), and to low value items.
the use of a single discount rate to a portfolio of leases with reasonably similar characteristics
reliance on previous assessments on whether leases are onerous
the exclusion of initial direct costs for the measurement of the right-of-use asset at the date of initial application, and
the use of hindsight in determining the lease term where the contract contains options to extend or terminate the lease.
Adapteo has also elected not to reassess whether a con-tract is or contains a lease at the date of initial application. Instead, for contracts entered into before the transition date, Adapteo has relied on its assessment made by ap-plying IAS 17 and IFRIC 4 to determine if an Arrangement contains a Lease.
The lessor accounting remained mostly similar to previ-ous IAS 17 accounting.
OtherIFRIC 23 Uncertainty over Income Tax Treatments. The in-terpretation clarifies the accounting treatment in situations where the tax treatment is not yet approved by the tax au-thorities. The essential question is to evaluate whether the tax authorities will accept each tax treatment that is used or planned to be used in the income tax filing. The interpre-tation has no material impacts on Adapteo’s consolidated financial statements. Amendments to IFRS 9 Prepayment Features with Nega-tive Compensation. The changes allow instruments with symmetric prepayment to qualify for amortised cost or fair value through other comprehensive income. The interpre-tation has no material impacts on Adapteo’s consolidated financial statements.
Annual Improvements to IFRS standards (2015-2017 Cycle). The annual improvements process provides a mech-anism for minor and non-urgent amendments to IFRSs to be grouped together and issued in one package annually. The cycle contains amendments to the following standards: IFRS 3, IFRS 11, IFRS 2, IAS 12 and IAS 23. The standards have no material impact on Adapteo’s financial statements.
Adoption of new and amended standards and interpretations applicable in future financial yearsAdapteo has not yet adopted the following new and amended standards and interpretations already issued by the IASB. Adapteo will adopt them as of the effective date or, if the date is other than the first day of the financial year, from the beginning of the subsequent financial year.
IFRS 17 Insurance Contracts (effective 1 January 2021) will replace IFRS 4 Insurance Contracts. It requires a current measurement model where estimates are re-measured in each reporting period. IFRS 17 is not yet endorsed by the EU.
Definition of Material - Amendments to IAS 1 and IAS 8 (effective 1 January 2020). The IASB has made amendments to IAS 1 Presentation of Financial Statements and IAS 8 Accounting Policies, Changes in Accounting Estimates and Errors which use a consistent definition of materiality throughout International Financial Reporting Standards and the Conceptual Framework for Financial Reporting, clarify when information is material and incorporate some of the guidance in IAS 1 about immaterial information.
Definition of a Business - Amendments to IFRS 3 (effec-tive 1 January 2020). The amended definition of a business requires an acquisition to include an input and a substantive process that together significantly contribute to the ability to create outputs. The definition of the term ‘outputs’ is amended to focus on goods and services provided to cus-tomers, generating investment income and other income, and it excludes returns in the form of lower costs and other economic benefits. The amendments will likely result in more acquisitions being accounted for as asset acquisi-tions. The amendments are not yet endorsed by the EU.
Adapteo estimates that the new standards will not have a material impact on future financial statements.
31 EVENTS AFTER THE BALANCE SHEET DATE
Since Covid-19 came to Northern Europe in early 2020, Adapteo is monitoring its impact on markets, employees, and business processes inside and outside of the company on a daily basis. Continuity plans to mitigate its effects are being continuously reviewed.
Adapteo has seen a decrease in demand for event busi-ness and other projects with short rental periods. There has also been time lags, and thus lower demand, for offices in the private sector as expansion plans have been pushed out in time.
In the core business, social infrastructure, Adapteo has entered the important peak season for new order intake from mid-February to the end of April. The escalation of Covid-19 will affect Adapteo’s customers in their deci-sion-making processes and thus the company. The total effects of this cannot be quantified today.
However, the long-term needs in the public sector re-main and Adapteo’s view of market development over time stays unchanged.
ANNUAL REPORT WITH BOARD OF DIRECTORS’ REPORT AND FINANCIAL STATEMENTS 110
FINANCIAL STATEMENTS OF THE PARENT COMPANY
Income statement of the parent company, FAS
EUR thousands30 June–
31 December 2019Net sales 2,870Other operating income 845Materials and services -2,870Employee benefit expenses -1,835Other operating expenses -3,654Depreciation, amortisation and impairments -8Operating profit (EBIT) -4,652 Finance income 19,178Finance costs -16,826Finance costs, net 2,352 Profit before taxes -2,299 Income taxes 600Profit for the period -1,699
FINANCIAL STATEMENTS OF THE PARENT COMPANY
ANNUAL REPORT WITH BOARD OF DIRECTORS’ REPORT AND FINANCIAL STATEMENTS 111
FINANCIAL STATEMENTS OF THE PARENT COMPANY
Balance sheet of the parent company, FAS
EUR thousands 31 Dec 2019ASSETSNon-current assetsOther intangible assets 97Shares in Group companies 273,285Loan receivables from Group companies 187,378Total non-current assets 460,760
Current assets Inventories 4,077Cash pool receivables 6,976Loan receivables from Group companies 6,214Trade and other receivables 17,460Corporate income tax receivables 600Derivative financial instruments 201Cash and cash equivalents 3,464Total current assets 38,991TOTAL ASSETS 499,752
EQUITY AND LIABILITIESEquity Share capital 10,000Reserve for invested unrestricted equity 67,799Profit for the period -1,699Total equity 76,101
Non-current liabilities Bank loans 400,000Total non-current liabilities 400,000
Current liabilities Trade and other payables 7,426Cash pool liabilities 15,508Derivative financial instruments 718Total current liabilities 23,651Total liabilities 423,651TOTAL INVESTED EQUITY AND LIABILITIES 499,752
ANNUAL REPORT WITH BOARD OF DIRECTORS’ REPORT AND FINANCIAL STATEMENTS 112
FINANCIAL STATEMENTS OF THE PARENT COMPANY
Statement of cash flows of the parent company, FAS
EUR thousands30 June–
31 December 2019Cash flow from operating activitiesProfit before taxes -2,299Adjustments:
Depreciation 8Finance income and costs -2,352
Cash generated from operations before changes in working capital -4,643
Change in working capitalIncrease (-) / decrease (+) in current receivables -827Increase (-) / decrease (+) in inventory -513Increase (+) / decrease (-) in current liabilities 2,121Cash generated from operations before financial items and tax -3,862Payments of listing costs -10,075Interest and other finance costs paid -4,732Interests received 4,783Net cash from operating activities -13,886
Cash flow from investing activitiesPayments for intangible assets -99Cash flow used in investing activities -99
Cash flow from financing activitiesProceeds from bank loans 400,000Repayments of bank loans -368,000Repayment of debt to Cramo -18,439Change in loan receivables from Group companies 6,435Change in cash pool receivables and liabilities -2,546Cash flow from financing activities 17,449
Change in cash and cash equivalents 3,464Cash and cash equivalents at beginning of period 0Cash and cash equivalents at end of period 3,464
ANNUAL REPORT WITH BOARD OF DIRECTORS’ REPORT AND FINANCIAL STATEMENTS 113
FINANCIAL STATEMENTS OF THE PARENT COMPANY
Notes to the financial statements of the parent company, FAS
Adapteo Plc was established through the partial demerger (“Demerger”) of Cramo Plc on 30 June 2019 when all the assets, debts and liabilities belonging to Cramo’s Modular Space business transferred to Adapteo Plc. The company’s shares are listed on the Main Market of Nasdaq Stockholm AB as of 1 July 2019.
Adapteo Plc is domiciled in Vantaa, and its registered address is Äyritie 12 B, 01510 Vantaa, Finland. The consoli-dated financial statements and the financial statements of the Parent company were authorised for issue by the Board of Directors on 27 March 2020.
The financial statements have been prepared in accord-ance with the Finnish accounting standards (FAS).
Parent company’s accounting policies
Foreign currency transactionsAssets and liabilities denominated in currencies other than those of the euro zone are translated into euros at the exchange rates prevailing at the date of the transactions. Exchange gains and losses are recognised through profit and loss.
RevenuesParent company’s net sales consists of sales of fleet pool. Parent company buys modules which it sells to Group companies. The final place of location of the modules will be determined according to the demand. The full costs of modules are charged from a Group company in a time of delivery.
Parent company provides certain services to Group companies. Income from service charges is reported in other operating income. The income is recognised once the services have been provided.
Income taxesIncome taxes relating to the financial year are recognised in the income statement. Parent company has not recognised deferred taxes.
InventoryParent company’s inventory consists of fleet pool. Inven-tory is recognised at acquisition cost, re-aquisition cost, or probable selling price, whichever lower. Acquisition cost includes related variable costs.
Cash and cash equivalents Cash and cash equivalents include cash in hand, bank de-posits withdrawable on demand and other liquid short-term investments with original maturities of three months or less.
Accrual of pension costsThe pension cover of the parent company is handled by external pension insurance companies. Pension costs are recognised in the income statement in the year to which these contributions relate.
Valuation of assetsIntangible assets are recognised in the balance sheet at original acquisition cost less planned depreciation and amortisation and possible impairment. An amortisation ac-cording to plan is calculated using the straight-line method over the estimated useful lives of the assets. The estimated useful life for software is 2-10 years.
Investments in subsidiaries as well as other investments are recognised at original acquisition cost or at fair value if fair value is lower than acquisition cost.
Related party transactionsRelated party transactions are described in note 27 of the consolidated financial statements.
1 NET SALES
EUR thousands 2019
Fleet pool revenue 2,870
Total 2,870
2 OTHER OPERATING INCOME
EUR thousands 2019
Administrative service charged from Group companies 845
Total 845
3 MATERIALS AND SERVICES
EUR thousands 2019
Purchases and change of inventory -2,870
Total -2,870
ANNUAL REPORT WITH BOARD OF DIRECTORS’ REPORT AND FINANCIAL STATEMENTS 114
FINANCIAL STATEMENTS OF THE PARENT COMPANY
4 EMPLOYEE BENEFIT EXPENSES
EUR thousands 2019
Salaries -1,574
Pension expenses -128
Other employee benefit expenses -133
Total -1,835
Number of personnel in the end of 2019 15
Key management remuneration, see consolidated financial statements, note Related party transactions.
5 OTHER OPERATING EXPENSES
EUR thousands 2019
Consulting services -2,494
Administrative costs -758
Other costs -223
Total -3,474
Audit fees
EUR thousands 2019
Auditing -161
Total -161
6 FINANCE INCOME AND FINANCE COSTS
EUR thousands 2019
Finance income, internal
Dividend income 14,358
Interest income 2,266
Finance income, external
Exchange rate gains 2,553
Finance income 19,178
Finance costs, external
Interest expenses -3,824
Exchange rate losses -2,431
Listing costs -10,075
Other finance costs -496
Finance costs -16,826
Finance income and costs, net 2,352
Listing costs include direct costs related to the listing of Adapteo’s shares on the Main Market of Nasdaq Stockholm AB and the commencement of Adapteo’s operations.
7 INTANGIBLE ASSETS
EUR thousands Software Total
Acquisition cost
At 30 June 2019 6 6
Additions 99 99
At 31 Dec 2019 105 105
Accumulated amortisation and impairment
At 30 June 2019
Amortisation -8 -8
At 31 Dec 2019 -8 -8
Net book value at 31 Dec 2019 97 97
8 TRADE AND OTHER RECEIVABLES
EUR thousands 31 Dec 2019
Receivables from Group companies
Trade receivables 101
Dividend receivable 14,358
Receivables from others
Accrued income 1,989
Other receivables 1,012
Total 17,460
Accrued income consists of:
Accrued financial expenses 1,737
Other receivables 252
Total 1,989
9 TRADE AND OTHER PAYABLES
EUR thousands 31 Dec 2019
Liabilities to Group companies
Trade payables 1,030
Liabilities to others
Trade payables 611
Accrued expenses 5,496
VAT liability 123
Other 166
Total 7,426
Accrued expenses consist of:
Personnel expenses 1,061
Interest expenses 3,712
Other expenses 723
Total 5,496
ANNUAL REPORT WITH BOARD OF DIRECTORS’ REPORT AND FINANCIAL STATEMENTS 115
FINANCIAL STATEMENTS OF THE PARENT COMPANY
10 EQUITY
On the demerger date 30 June 2019, Adapteo issued 44,682,697 new shares and the shareholders of Cramo received as demerger consideration one Adapteo share for each Cramo share that they hold. Shares and share capital have been registered in the Finnish Trade Register on 30 June 2019. Adapteo has one class of shares with equal vot-ing rights. All the issued and subscribed shares have been fully paid to the company. Shares do not have a nominal value. The company has no treasury shares. Adapteo Plc’s equity was formed in the demerger 30 June 2019.
Changes in the equity during the financial year are as follows:
EUR thousands 2019
Share capital at 30 June 10,000
Share capital at 31 December 10,000
Reserve for invested unrestricted equity at 30 June 67,799
Reserve for invested unrestricted equity at 31 December 67,799
Retained earnings at 30 June -
Retained earnings at 31 December -
Profit for the period -1,699
Total equity at 31 December 76,101
Distributable funds at 31 December 2019
Reserve for invested unrestricted equity 67,799
Profit for the period -1,699
Total 66,101
31 Dec 2019
Pcs EUR
Shares 44,682,697 10,000,000
Details about current share incentive plans are disclosed in the consolidated financial statements, note 7.
11 BORROWINGS
EUR thousands 31 Dec 2019
Bank loans 400,000
Total 400,000
After the demerger, a new 3-year term loan of EUR 400 million was drawn on 1 July 2019. The loan was used to repay the loans transferred in the demerger. Transaction costs for a loan have been accrued as expense during the loan maturity.
The loans repaid on 1 July 2019 consisted of the EUR 243 million bank loan attributable to the acquisition of NMG, and the EUR 125 million bank loan transferred as a general debt allocation in accordance with the demerger plan.
In addition, a loan to Cramo Plc of EUR 19.4 million was transferred as the general debt allocation and a receiva-ble from Cramo Plc of EUR 1.0 million was transferred as cash allocation in accordance with the demerger plan. In connection with the demerger Cramo has also invoiced Adapteo EUR 10.1 million of costs related to the listing and commencement of Adapteo's operations. These balances with Cramo Plc have been paid.
Adapteo Plc has EUR 100 million revolving credit facility maturing in 2022 but, at the consent of the lenders, the maturity can be extended by twelve months. EUR 100 million revolving credit facility EUR million was unused on 31 December 2019. In addition, Adapteo Plc has EUR 10 million facility agreement until further notice which was unused on 31 December 2019.
12 DERIVATIVE FINANCIAL INSTRUMENTS
EUR thousands 31 Dec 2019
Currency forward contracts
Positive fair value 201
Negative fair value -718
Value of underlying instruments 78 933
Adapteo operates internationally and is exposed to risks arising from foreign exchange rate fluctuations, primarily from exposures with respect to the Swedish krona. Foreign exchange risk arises from internal funding as well as recog-nised assets and liabilities and net investments in foreign operations.
The objective of the foreign exchange risk manage-ment is to limit the uncertainties associated with foreign exchange rate fluctuations and their effect on Adapteo’s profit, cash flows and balance sheet.
Foreign exchange risk arising from internal funding and recognised assets and liabilities is managed primarily through forward contracts. Hedge accounting is not ap-plied for these derivatives and the change in the fair value of derivatives is recognised in finance items.
Further detail about Adapteo’s financial risk manage-ment are disclosed in the consolidated financial state-ments, note 24.
13 COMMITMENTS
EUR thousands 31 Dec 2019
Guarantees given by parent company on behalf of subsidiaries 249
ANNUAL REPORT WITH BOARD OF DIRECTORS’ REPORT AND FINANCIAL STATEMENTS 116
FINANCIAL STATEMENTS OF THE PARENT COMPANY
Board of Director’s Proposal for Distribution of Profits
The distributable funds of Adapteo Oyj are EUR 66,100,776 of which EUR 1,698,938 represents the loss for the financial year. The Board of Directors proposes to the Annual Gener-al Meeting to be held on 23 April 2020 that the loss for the financial year 2019 be placed in retained earnings and no dividend be paid.
The Board of Directors and CEO
In Vantaa, 30 March 2020
Peter Nilsson Carina Edblad Outi Henriksson
Chairman of the Board
Andreas Philipson Joakim Rubin Philip Isell Lind af Hageby
President and CEO
The Auditor’s NoteAuditor’s Report has been issued today.
In Vantaa, 30 March 2020
KPMG Oy AbAuthorised Public Accountants
Toni AaltonenAuthorised Public Accountant
SIGNATURES
ANNUAL REPORT WITH BOARD OF DIRECTORS’ REPORT AND FINANCIAL STATEMENTS 117
AUDITOR’S REPORT
AUDITOR’S REPORT TO THE ANNUAL GENERAL MEETING OF ADAPTEO PLCReport on the Audit of the Financial Statements
Opinion
We have audited the financial statements of Adapteo Plc (business identity code 2982221-9) for the period 30 June – 31 December 2019. The financial statements comprise the consolidated balance sheet as at 31 December 2019, income statement, statement of comprehensive income, statement of changes in equity, statement of cash flows and notes for the period 1 January – 31 December 2019, including a summary of significant accounting policies, as well as the parent company’s balance sheet as at 31 De-cember 2019, income statement, statement of cash flows and notes for the period 30 June – 31 December 2019.
In our opinion— the consolidated financial statements give a true and
fair view of the group’s financial position, financial per-formance and cash flows in accordance with Interna-tional Financial Reporting Standards (IFRS) as adopted by the EU
— the financial statements give a true and fair view of the parent company’s financial performance and financial position in accordance with the laws and regulations governing the preparation of financial statements in Finland and comply with statutory requirements.
Our opinion is consistent with the additional report submit-ted to the Audit Committee.
Basis for Opinion
We conducted our audit in accordance with good auditing practice in Finland. Our responsibilities under good auditing practice are further described in the Auditor’s Responsibili-ties for the Audit of the Financial Statements section of our report.
We are independent of the parent company and of the group companies in accordance with the ethical require-ments that are applicable in Finland and are relevant to our audit, and we have fulfilled our other ethical responsibilities in accordance with these requirements.
In our best knowledge and understanding, the non-audit services that we have provided to the parent company and group companies are in compliance with laws and regula-tions applicable in Finland regarding these services, and we have not provided any prohibited non-audit services referred to in Article 5(1) of regulation (EU) 537/2014. We have only provided the company with audit services.
We believe that the audit evidence we have obtained is sufficient and appropriate to provide a basis for our opinion.
Emphasis of Matter – Basis of Prepa-ration and Principles of Combination
We draw attention to Note 1 to the financial statements, which describes the accounting principles applied in the consolidated financial statements. As described in the notes Adapteo did not form a legal group until 30 June 2019, when the parent company was formed by a partial demerger of Cramo Plc. The carve-out financial informa-tion does not necessarily reflect what the combined results of operations and financial position would have been had Adapteo existed as a separate independent legal entity. The carve-out financial information may not be indicative of Adapteo’s future financial performance, financial position and cash flows.
Materiality
The scope of our audit was influenced by our application of materiality. The materiality is determined based on our professional judgement and is used to determine the nature, timing and extent of our audit procedures and to evaluate the effect of identified misstatements on the financial statements as a whole. The level of materiality we set is based on our assessment of the magnitude of misstatements that, individually or in aggregate, could reasonably be expected to have influence on the economic decisions of the users of the financial statements. We have also taken into account misstatements and/or possible mis-statements that in our opinion are material for qualitative reasons for the users of the financial statements.
ANNUAL REPORT WITH BOARD OF DIRECTORS’ REPORT AND FINANCIAL STATEMENTS 118
AUDITOR’S REPORT
Key Audit Matters
Key audit matters are those matters that, in our profession-al judgment, were of most significance in our audit of the financial statements of the current period. These matters were addressed in the context of our audit of the financial statements as a whole, and in forming our opinion thereon, and we do not provide a separate opinion on these matters. The significant risks of material misstatement referred to in
the EU Regulation No 537/2014 point (c) of Article 10(2) are included in the description of key audit matters below.
We have also addressed the risk of management override of internal controls. This includes consideration of whether there was evidence of management bias that represented a risk of material misstatement due to fraud.
The key audit matter
— The consolidated net sales during the financial year totaled EUR 216.2 million and was derived from many revenue sources, such as rental income, sales of new modules and provision of assembly and other services.
— In general, the Group enters into long-term lease contracts, and each contractual phase is accounted for under different accounting standards. IFRS 15 is applied to recognition of revenues from assembly and other services and sales of new modules, and IFRS 16 to recognition of rental income.
— The identification of contractual phases and perfor-mance obligations is critical in respect of the accurate timing and amount of revenue recognition. This requires management judgement.
How the matter was addressed in the audit
— We evaluated the internal control environment and tested the operating effectiveness of relevant con-trols, as well as performed substantive procedures in order to assess the accuracy of the timing and amount of revenues recognised in the consolidated financial statements.
— As part of our year-end audit procedures we assessed the balance sheet items related to sales accruals for their completeness and existence. Our audit procedures also included testing of the valuation of trade receiva-bles and other balance sheet items related to net sales.
— We read the key customer agreements and verified the consistency of the accounting with the terms of sales agreements.
Revenue recognition (Refer to notes 2 and 3 to the consolidated financial statements)
ANNUAL REPORT WITH BOARD OF DIRECTORS’ REPORT AND FINANCIAL STATEMENTS 119
AUDITOR’S REPORT
— Tangible assets totaled EUR 451.1 million, representing approximately 60% of the consolidated total assets at 31 December 2019.
— The business of the Group is highly dependent on the condition and availability of the rental equipment.
— There is a risk that the judgments made by management when evaluating the depreciation periods of the rental equipment and around the annual impairment review of the Group’s rental equipment are not appropriate and that the carrying values of these assets are misstated.
— We tested key controls of the monitoring environment of rental equipment management. In addition, we per-formed audit procedures on tangible assets leased out using data analyses.
— In particular, we focused our audit procedures on the following areas: rental equipment purchases, assess-ment of depreciation periods and rental equipment residual values. We also attended physical counts to ensure the existence of the rental equipment.
— Furthermore, we considered the appropriateness of the Group’s disclosures in respect of tangible assets.
Existence and valuation of tangible assets (Refer to notes 8 and 11 to the consolidated financial statements)
— At 31 December 2019 goodwill amounted to EUR 171.0 million and other acquisition related intangible assets EUR 24.9 million in the consolidated balance sheet.
— Impairment testing of goodwill and other intangible assets is based on cash flow forecasts prepared by management.
— Determination of key assumptions underlying the future cash flow forecasts used in impairment tests requires management to make judgments over gross margin, growth rates and discount rate, among others. Due to the high level of judgment related to the forecasts used, and the significant carrying values involved, valuation of goodwill and other intangible assets is considered a key audit matter.
— We evaluated and analysed the assumptions applied, such as profitability levels, discount rates and long-term growth rate.
— We also assessed the appropriateness of the methods used in testing.
— We involved KPMG valuation specialists when assess-ing the technical and mathematical accuracy of the calculations and to compare the assumptions applied to external and industry data.
— Furthermore, we considered the appropriateness of the Group’s disclosures in respect of goodwill, other intan-gible assets and impairment testing.
Valuation of goodwill and other intangible assets (Refer to note 13 to the consolidated financial statements)
ANNUAL REPORT WITH BOARD OF DIRECTORS’ REPORT AND FINANCIAL STATEMENTS 120
AUDITOR’S REPORT
Responsibilities of the Board of Directors and the Managing Director for the Financial Statements
The Board of Directors and the Managing Director are responsible for the preparation of consolidated financial statements that give a true and fair view in accordance with International Financial Reporting Standards (IFRS) as adopted by the EU, and of financial statements that give a true and fair view in accordance with the laws and regula-tions governing the preparation of financial statements in Finland and comply with statutory requirements. The Board of Directors and the Managing Director are also responsible for such internal control as they determine is necessary to enable the preparation of financial statements that are free from material misstatement, whether due to fraud or error.
In preparing the financial statements, the Board of Directors and the Managing Director are responsible for assessing the parent company’s and the group’s ability to continue as a going concern, disclosing, as applicable, mat-ters relating to going concern and using the going concern basis of accounting. The financial statements are prepared using the going concern basis of accounting unless there is an intention to liquidate the parent company or the group or cease operations, or there is no realistic alternative but to do so.
Auditor’s Responsibilities for the Audit of the Financial Statements
Our objectives are to obtain reasonable assurance about whether the financial statements as a whole are free from material misstatement, whether due to fraud or error, and to issue an auditor’s report that includes our opinion. Reasonable assurance is a high level of assurance but is not a guarantee that an audit conducted in accordance with good auditing practice will always detect a material misstatement when it exists. Misstatements can arise from fraud or error and are considered material if, individually or in the aggregate, they could reasonably be expected to in-fluence the economic decisions of users taken on the basis of the financial statements.
As part of an audit in accordance with good auditing practice, we exercise professional judgment and maintain professional scepticism throughout the audit. We also:
— Identify and assess the risks of material misstatement of the financial statements, whether due to fraud or error, design and perform audit procedures responsive to those risks, and obtain audit evidence that is sufficient and appropriate to provide a basis for our opinion. The risk of not detecting a material misstatement resulting from fraud is higher than for one resulting from error, as fraud may involve collusion, forgery, intentional omis-sions, misrepresentations, or the override of internal control.
— Obtain an understanding of internal control relevant to the audit in order to design audit procedures that are appropriate in the circumstances, but not for the purpose of expressing an opinion on the effectiveness of the parent company’s or the group’s internal control.
— Evaluate the appropriateness of accounting policies used and the reasonableness of accounting estimates and related disclosures made by management.
— Conclude on the appropriateness of the Board of Directors’ and the Managing Director’s use of the going concern basis of accounting and based on the audit ev-idence obtained, whether a material uncertainty exists related to events or conditions that may cast significant doubt on the parent company’s or the group’s ability to continue as a going concern. If we conclude that a material uncertainty exists, we are required to draw attention in our auditor’s report to the related disclo-sures in the financial statements or, if such disclosures are inadequate, to modify our opinion. Our conclusions are based on the audit evidence obtained up to the date of our auditor’s report. However, future events or conditions may cause the parent company or the group to cease to continue as a going concern.
— Evaluate the overall presentation, structure and content of the financial statements, including the disclosures, and whether the financial statements represent the underlying transactions and events so that the financial statements give a true and fair view.
— Obtain sufficient appropriate audit evidence regarding the financial information of the entities or business activities within the group to express an opinion on the consolidated financial statements. We are responsible for the direction, supervision and performance of the group audit. We remain solely responsible for our audit opinion.
We communicate with those charged with governance regarding, among other matters, the planned scope and timing of the audit and significant audit findings, includ-ing any significant deficiencies in internal control that we identify during our audit.
We also provide those charged with governance with a statement that we have complied with relevant ethical re-quirements regarding independence, and communicate with them all relationships and other matters that may reason-ably be thought to bear on our independence, and where applicable, related safeguards.
ANNUAL REPORT WITH BOARD OF DIRECTORS’ REPORT AND FINANCIAL STATEMENTS 121
AUDITOR’S REPORT
From the matters communicated with those charged with governance, we determine those matters that were of most significance in the audit of the financial statements of the current period and are therefore the key audit matters. We describe these matters in our auditor’s report unless law or regulation precludes public disclosure about the matter or when, in extremely rare circumstances, we determine that a matter should not be communicated in our report because the adverse consequences of doing so would reasonably be expected to outweigh the public interest benefits of such communication.
Other Reporting Requirements
Information on our audit engagement
Adapteo Plc was formed at the time of the completion of the partial demerger from Cramo Plc according to the demerger plan. We have been appointed as auditors since 30 June 2019, when the demerger came into effect and the company was registered.
Other Information
The Board of Directors and the Managing Director are responsible for the other information. The other informa-tion comprises the report of the Board of Directors and the information included in the Annual Report, but does not include the financial statements and our auditor’s report thereon.
Our opinion on the financial statements does not cover the other information.
In connection with our audit of the financial statements, our responsibility is to read the other information identified above and, in doing so, consider whether the other informa-tion is materially inconsistent with the financial statements or our knowledge obtained in the audit, or otherwise ap-pears to be materially misstated. With respect to the report of the Board of Directors, our responsibility also includes considering whether the report of the Board of Directors has been prepared in accordance with the applicable laws and regulations.
In our opinion, the information in the report of the Board of Directors is consistent with the information in the finan-cial statements and the report of the Board of Directors has been prepared in accordance with the applicable laws and regulations.
If, based on the work we have performed on the other information that we obtained prior to the date of this audi-tor’s report, we conclude that there is a material misstate-ment of this other information, we are required to report that fact. We have nothing to report in this regard.
Helsinki, 30 March 2020
KPMG OY AB
TONI AALTONENAuthorised Public Accountant, KHT
ANNUAL REPORT WITH BOARD OF DIRECTORS’ REPORT AND FINANCIAL STATEMENTS 122
DEFINITIONS
Definitions for the key figuresKey figure Definition Reason for the use
Operating profit (EBIT) 1 Operating profit (EBIT) as presented in the con-solidated income statement
Operating profit (EBIT) shows result generated by the operating activities.
EBITA 1 Operating profit (EBIT) + amortisation and impairment on intangible assets resulting from acquisitions
EBITA is a result metric adjusted for amortisa-tions and impairments resulting from acquisi-tions and better reflects the underlying business performance.
EBITDA 1 Operating profit (EBIT) + depreciation, amortisation and impairments
EBITDA is the indicator to measure the perfor-mance of Adapteo. EBITDA also provides a proxy for cash flow generated by operations.
Comparable EBIT, comparable EBITA and com-parable EBITDA are presented in addition to EBIT, EBITA and EBITDA to reflect the underlying business performance and to enhance com-parability from period to period. The Company believes that these comparable performance measures provide meaningful supplemental information by excluding items outside normal business, which reduce comparability between the periods. Additionally, comparable EBITDA is one of Adapteo’s long-term financial targets.
Material items outside ordinary course of busi-ness, such as costs related to the listing, acqui-sition and integration related expenses, restruc-turing expenses including redundancy payments, impairment losses on goodwill and intangible assets recognised in business acquisitions, and gains and losses on business disposals.
Capital employed Property, plant and equipment + goodwill + other intangible assets + investments in joint ventures + net working capital
Capital employed presents the capital require-ments of Adapteo’s business.
Net capex Additions to property, plant and equipment + additions to other intangible assets - disposals of rental equipment and rental accessories at net book value
Net capex presents the net amount of invest-ments made.
Net fleet capex Additions to rental equipment + additions to rental accessories – disposals of rental equip-ment and rental accessories at net book value
Net fleet capex presents investments into new modules net of disposals.
Growth capex Additions to rental equipment + additions to rental accessories – reinvestment capex
Growth capex distinguishes investments related to growing the rental fleet.
Maintenance capex distinguishes the portion of net investments to the fleet required to maintain the size of the fleet after disposals, as well as to maintain technical quality to meet regulatory and customer requirements.
Non-fleet capex distinguishes investments into the operating platform.
M&A capex distinguishes investments related to business acquisitions.
Capex breakdowns provide further transpar-ency and enable better evaluation of company’s cash flows and earnings.
Maintenance capex Reinvestment capex + capex relating to module upgrades - disposals of rental equipment and rental accessories at net book value
Non-fleet capex Additions to land, buildings, other machinery and equipment and assets under construction + additions to other intangible assets
M&A capex Enterprise value of the business acquisitions
Reinvestment capex Disposed square meters of modules multiplied by average investments in modules per square meter for the period
ANNUAL REPORT WITH BOARD OF DIRECTORS’ REPORT AND FINANCIAL STATEMENTS 123
DEFINITIONS
Key figure Definition Reason for the use
Operating cash flow before growth capex
Comparable EBITDA +/– change in net working capital as presented in cash flow statement – maintenance capex – non-fleet capex
Operating cash flow before growth capex indi-cates the amount of operational cash flow that is largely available for value creative invest-ments, such as growing the fleet.
Cash conversion before growth capex
Operating cash flow before growth capex / comparable EBITDA
Cash conversion before growth capex indicates the proportion of comparable EBITDA, which remains after maintenance capex, non-fleet capex and investments to working capital are accounted for.
Free cash flow indicates the cash flow that is largely available for e.g. paying dividends.
Net debt Non-current and current borrowings - cash and cash equivalents – loan receivables - non-cur-rent and current
Net debt is an indicator to measure the total external debt financing of Adapteo
Net debt / Comparable EBITDA
Net debt as at the balance sheet date / Compa-rable EBITDA for the last 12 months
The ratio of net debt to comparable EBITDA helps to show financial risk level and it is a useful measure for management to monitor the com-pany’s indebtedness in relation to its earnings and is one of Adapteo’s long-term financial targets.
Operative ROCE Comparable EBITA for the last 12 months / prop-erty, plant and equipment + investment in joint ventures + net working capital as at the balance sheet date Net working capital = Non-current other receivables + inventories + trade and other receivables – non-current other liabilities – non-current and current provisions – trade and other payables
Internal measure to evaluate return on capital employed and to analyse and compare differ-ent businesses and opportunities taking into account capital required. This ratio is also one of Adapteo’s long-term financial targets.
Utilisation rate Average rented fleet during the period divided by total fleet available
Utilisation rate presents how large a portion of the fleet has on average been on rent. Utilisation rate is a useful indicator to monitor the efficien-cy of fleet management.
Average rent per sqm Rental revenue / average amount of sqm’s on rent
Average rent per sqm provides further transpar-ency to the revenue generation of the company.
Number of modules - Number of modules is a useful indicator to moni-tor the size of the rental fleet.
Total sqm of modules - Total sqm of modules is a useful indicator to monitor the size of the rental fleet.
Comparable earnings per share
Profit for the period excluding items affecting comparability, net of taxes and material impair-ment losses on property, plant and equipment, net of taxes / average number of Adapteo’s outstanding shares (number of Adapteo shares issued as a demerger consideration (44,682,697 pcs) used for all periods presented prior to the demerger date)
1 Corresponding margin has been calculated by dividing the measure with net sales
ANNUAL REPORT WITH BOARD OF DIRECTORS’ REPORT AND FINANCIAL STATEMENTS 124
GRI indexComplementing facts and figures to our qualitative sustainability report according Global Reporting Initiative
Disclosure number Disclosure title Page Comments and delimitations
Organisational profile
102-1 Name of the organisation
62 Adapteo Plc, corporate identity number FI29822219
102-2 Activities, brands, products, and services
4, 19
102-3 Location of headquarters
4, 62
102-4 Location of operations
4, 62 Adapteo runs operations and provides products and services in 5 countries; Finland, Sweden, Norway, Denmark and Germany.
102-5 Ownership and legal form
40, 105
102-6 Markets served 4 For geographic locations see disclosure 102-4.
102-7 Scale of the organisation
5, 21, 24, 27, 38 Adapteo consists of 9 different organisations: Adapteo Plc, Adapteo Finland Oy, Adapteo Ser-vices AB, Adapteo AB, Adapteo AS, Adapteo A/S, Adapteo GmbH, Flexator AB and Flexator Oy. The group as whole has 408 employees.
102-8 In formation on employees and other workers
38 The employee data has been provided by a repre-sentative from each region. Most of the employees at Adapteo have permanent employment contracts although some temporary employments occur (mainly in production or warehouses). The division between men and women in the whole compa-ny is 62 women and 346 men. The distribution of employees varies across the different regions and operations. Sweden has 96 employees, Norway has 7, Flexator 202 (Sweden), Finland 44, Denmark 25 and Germany 34. Within the operational organisation the division be-tween men and women is 265 men and 27 women. Amongst managers the division between men and women is 48 men and 11 women.
In the local management teams the division be-tween men and women is 23 men and 10 women.
102-9 Supply chain 37
102-10 Significant changes to the organisation and its supply chain
7
102-11 Precautionary Prin-ciple or approach
37, 51
102-12 External initiatives 35 ISO14001, ISO9001, OHSAS18001, SCC certi-fication and the Working Environment Agency's (Arbetsmiljöverket) regulations.
102-13 Membership of associations
Member of DGNB e.V. (Deutsche Gesellschaft für Nachhaltiges Bauen), regional Rental Associations, The Wood Foundation (Stiftelsen Träcentrum), ProWood and Smart Housing.
GRI INDEX
ANNUAL REPORT WITH BOARD OF DIRECTORS’ REPORT AND FINANCIAL STATEMENTS 125
Disclosure number Disclosure title Page Comments and delimitations
Strategy
102-14 Statement from sen-ior decision-maker
7, 31
Ethics and integrity
102-16 Values, principles, standards, and norms of behaviour
4, 27, 37
Governance
102-18 Governance structure
37, 40-47
Stakeholder engagement
102-40 List of stakeholder groups
Customers and their tenants Employees Owners Management Investors Suppliers
102-41 Collective bargaining agreements
Most of our employees in our Scandinavian opera-tions are covered by collective bargaining agree-ments. For Sweden, Norway and Finland the rate is 100%, with an exception for the Finnish headquar-ters where the employees are covered by alterna-tive agreements in line with the collective bargain-ing agreements. In Denmark and Germany the rate is lower as collective bargaining agreements are not custom in these countries, but we are compliant with local customs and market conditions.
102-42 Identifying and selecting stakeholders
For this report, we conducted a sustainability stakeholder dialogue with three groups, which we considered most relevant: customers, investors and management.
102-43 Approach to stakeholder engagement
37 Prior to the preparation of this report customers, investors as well as representatives from the top management were interviewed about Adapteo's sustainability commitments; 6 interviews with customers; 3 interviews with investors; 8 interviews with top management Engagement with other stakeholders, mentioned in disclosure 102-40, takes place in conjunction with contact in the ongoing operations.
GRI INDEX
ANNUAL REPORT WITH BOARD OF DIRECTORS’ REPORT AND FINANCIAL STATEMENTS 126
Disclosure number Disclosure title Page Comments and delimitations
102-44 Key topics and concerns raised
Adapteo has conducted interviews with stakehold-er groups; customers, management and investors. The customers highlighted the importance of incor-porating sustainability in the communication from the beginning to build greater trust. The investors raised the issue of SDGs linked to investors and science based targets. The under-standing of the importance of sustaianbility and development of sustainable products. Management raised topics such as using sustaina-bility as a differentiator from competitors and the importance of integrating sustainability in the over-all strategy. It was also mentioned that we need to have a holistic perspective on sustainability, includ-ing both environmental as well as social aspect, e.g. employee and customer perspectives.
Reporting practice
102-45 Entities included in the consolidated financial statements
27, 105
102-46 Defining report content and topic Boundaries
37 This integrated sustainability report is Adapteo's first sustainability report and has been prepared in accordance with the Global Reporting Initiative's (GRI) standards. The content of the sustainability report and the GRI index have been defined by the compulsory information set by GRI and by the implemented materiality analysis.
102-47 List of material topics
Sustainable solutions Product health and safety Customer satisfaction Anti-corruption Employee lifecycle Diversity Health and safety Sustainable supply and sub-contracting Human rights Energy efficiency
102-48 Restatements of information
Not applicable. This is the first report.
102-49 Changes in reporting Not applicable. This is the first report.
102-50 Reporting period 2019
102-51 Date of most recent report
Not applicable. This is the first report.
102-52 Reporting cycle Yearly
102-53 Contact point for questions regarding the report
Hanna Wennberg, SVP Marketing, Communication and Sustainability E-mail: [email protected] Tel: +46859099440 Web: adapteogroup.com
GRI INDEX
ANNUAL REPORT WITH BOARD OF DIRECTORS’ REPORT AND FINANCIAL STATEMENTS 127
Disclosure number Disclosure title Page Comments and delimitations
102-54 Claims of reporting in accordance with the GRI Standards
This report has been prepared in accordance with the GRI Standards: Core option
102-55 GRI content index 124-129
102-56 External assurance This Sustainability Report has not been externally verified.
Management approach
103-1 - 103-3 Management approach
37, 41
Economic
205-1 Operations assessed for risks related to corruption
During the latest group risk assessment in Decem-ber 2019, the risk of corruption within all operations was considered low in relation to potential financial impact and likelihood. Moving forward, continuousmonitoring of key policies as well as managementand employee training will take place. Additionally, the topic was included as a key item in GRCE (Gov-ernance, Risk, Compliance & Ethics) trainings held during Q3 2019.
205-3 Confirmed incidents of corruption and actions taken
No incidents or legal proceedings of corruption.
Environmental
301-3 Reclaimed products and their packaging materials
33 Our modules are rented out in several rounds and thus they are fully reclaimed. However, we do not yet have figures for how much of the material from an end of life module is reused in new modules.
302-1 Energy consumption within the organi-sation
Scope 1 and 2 calculations of the organisation's en-ergy consumption were made in collaboration with Cemasys. Base year for the calculation is 2019. Scope 1 (energy consumption for company cars and stationary fuel combustion): 3,610 MWh (non-re-newable energy) and 630.5 MWh (renewable energy)
302-2 Energy consump-tion outside of the organisation
Scope 2 (electricity used from external source): 4,541.1 MWh (non-renewable energy)
302-4 Reduction of energy consumption
Not applicable in this report due to this being the first report, base year 2019. We intend to follow up on this in next year's report.
305-1 Direct (Scope 1) GHG emissions
Scope 1, 2 and 3 calculations of the organisation's GHG emissions were made in collaboration with Cemasys. Base year for the calculation is 2019. Scope 1 (emissions from company cars and station-ary fuel combustion): 865.7 tCO2e
305-2 Energy indirect (Scope 2) GHG emissions
Scope 2 (emission caused by electricity used from external source): 231.8 tCO2e
GRI INDEX
ANNUAL REPORT WITH BOARD OF DIRECTORS’ REPORT AND FINANCIAL STATEMENTS 128
Disclosure number Disclosure title Page Comments and delimitations
305-3 Other indirect (Scope 3) GHG emissions
Included in the scope 3 calculations for this year's report is emissions caused by waste management. Calculations on emissions caused by the trans-portation and distribution, which is the part of our operations which contributes the most to our negative climate impact, will be included in next year's report. Scope 3: 440.2 tCO2e
305-4 Reduction of GHG emissions
Not applicable in this report due to this being the first report, base year 2019. The organisation intend to follow up on this in next year's report.
308-1 New suppliers that were screened using environmental criteria
From 1 July 2019, when Adapteo was formed, all new suppliers have signed our code of conduct.
Social
403-9 Work-related injuries 38, 124 During the 647 584 hours worked in 2019 the num-ber of recorded work-related injuries was 16, none of which resulted in fatalities or other high-con-sequence injuries. The injuries mainly consisted of minor injuries including: squeezes, falls and cuts.
404-3 Percentage of employees receiving regular performance and career develop-ment reviews
38 In Sweden, Norway, Denmark and Finland 100% of our employees have received performance and career development reviews. Germany has a rate of 44%.
405-1 Diversity of gov-ernance bodies and employees
38 The organisations' board of directors consist of 60% men and 40% women. The local management teams consists of 70% men and 30% women and the management teams (incl. GMT) consists of 72% men and 28% women. Information on the gender division for other employee categories is provided in disclosure 102-8.
406-1 Incidents of discrimi-nation and corrective actions taken
No incidents of discrimination and therefore no legal proceedings.
407-1 Operations and suppliers in which the right to freedom of association and collective bargaining may be at risk
Flexator mainly purchases the components and materials used in our modules from European suppliers, predominately from Sweden, Finland, Estonia and the Czech Republic. As these countries are members of the EU we see a low risk of human rights violations for first tier suppliers. However, we do not have a system in place to review the condi-tions for the involved parties further down the value chain at this point in time.
412-2 Employee training on human rights policies or procedures
Code of Conduct training conducted for all employees, including Management and the Board of Directors. The participation rate was at least 80-90%.
GRI INDEX
ANNUAL REPORT WITH BOARD OF DIRECTORS’ REPORT AND FINANCIAL STATEMENTS 129
Disclosure number Disclosure title Page Comments and delimitations
412-3 Significant invest-ment agreements and contracts that include human rights clauses or that underwent human rights screening
All our framework agreement templates include clauses on human rights through the addition of our Supplier Code of Conduct as an appendix. Thus, all of our new agreements and contracts include clauses on human rights. However, we do have some contracts that are yet to be updated to the new template. Analyses and follow-up in our business systems are ongoing to make sure all contracts are up to date, but presently the exact figure is unknown.
414-1 New suppliers that were screened using social criteria
Since 1 July 2019, when Adapteo was formed, all new suppliers have signed our code of conduct.
416-2 Incidents of non-compliance concerning the health and safety impacts of products and services
No instances of non-compliance reported. Fault reporting in properties is managed continuously by a fault reporting system and service organisation.