XXXXXXXXXXXXXXX XXXXXXXXXXXX XXXXXXXXXXXXX XXXXXXXXXXX September 5, 2017 Ms. Johanna Fabian-Marks Special Deputy & Acting Director Bureau of Life, Accident & Health Insurance 1326 Strawberry Square Harrisburg, PA 17120 Re: Aetna HealthAssurance of PA NAIC #: 18527 Market: Small Group Exchange: Off-Exchange Effective Date: 01/01/2018 Avg rate change requested: -1.7% Range of rate change requested: -20.4% to +30.5% Products: PPO Rating Areas & Change over 2017: Rating Areas 1-3 and 5-9, certain counties excluded Metal Levels: Silver Current # covered lives: 9,989 Current # policyholders: 5,701 Number of plans offered vs 2017: 1; 14 in 2017 HIOS Issuer ID / Binder #: 18939 Binder # AETN-PA18-125071663 Rate Filing Tracking Number: AETN-131033573 Policy Form(s): AHASPA SG HCOC-2018-PPO 02 Form Filing Tracking Number: AETN-130914613 Dear Ms. Fabian-Marks: The purpose of this filing revision is to provide details of the premium rate development and resulting proposed monthly premium rates for Small Group policies which will be offered off-Exchange in the State of PA for effective dates of January 1, 2018 and later. This filing is being provided to comply with regulatory rate filing requirements, and is not intended to be used for other purposes. The health benefit plans proposed in this filing are in compliance with all state-specific benefit requirements and rating regulations, as well as the benefit plan requirements of the Patient Protection and Affordability Act (P.L. 111-148). This rate filing is intended for new business issued through the State of PA off-Exchange marketplace effective January 1, 2018. All products and associated proposed monthly premium rates contained within this rate filing will be available to existing business upon their request. Existing business that is
Transcript
XXXXXXXXXXXXXXX XXXXXXXXXXXX
XXXXXXXXXXXXX XXXXXXXXXXX
September 5, 2017 Ms. Johanna Fabian-Marks Special Deputy & Acting Director Bureau of Life, Accident & Health Insurance 1326 Strawberry Square Harrisburg, PA 17120 Re: Aetna HealthAssurance of PA NAIC #: 18527 Market: Small Group Exchange: Off-Exchange Effective Date: 01/01/2018 Avg rate change requested: -1.7% Range of rate change requested: -20.4% to +30.5% Products: PPO Rating Areas & Change over 2017: Rating Areas 1-3 and 5-9, certain counties excluded Metal Levels: Silver Current # covered lives: 9,989 Current # policyholders: 5,701 Number of plans offered vs 2017: 1; 14 in 2017 HIOS Issuer ID / Binder #: 18939 Binder # AETN-PA18-125071663 Rate Filing Tracking Number: AETN-131033573 Policy Form(s): AHASPA SG HCOC-2018-PPO 02 Form Filing Tracking Number: AETN-130914613 Dear Ms. Fabian-Marks: The purpose of this filing revision is to provide details of the premium rate development and resulting proposed monthly premium rates for Small Group policies which will be offered off-Exchange in the State of PA for effective dates of January 1, 2018 and later. This filing is being provided to comply with regulatory rate filing requirements, and is not intended to be used for other purposes. The health benefit plans proposed in this filing are in compliance with all state-specific benefit requirements and rating regulations, as well as the benefit plan requirements of the Patient Protection and Affordability Act (P.L. 111-148). This rate filing is intended for new business issued through the State of PA off-Exchange marketplace effective January 1, 2018. All products and associated proposed monthly premium rates contained within this rate filing will be available to existing business upon their request. Existing business that is
XXXXXXXXXXXXXXX XXXXXXXXXXXX
XXXXXXXXXXXXX XXXXXXXXXXX
not considered grandfathered under PPACA regulation will be converted to the plans and rates in this filing upon renewal. We have tried to present this information in a manner that will facilitate your Department’s review. If there are changes we can make to improve the process or you would like us to present the information differently in the future, please let us know. Please feel free to contact me at the above listed telephone number and/or e-mail address if you have any additional questions. Sincerely, XXXXXXX, FSA, MAAA Aetna
1
2018 Pennsylvania Actuarial Memorandum 1. Basic Information and Data A. Company Information Company Legal Name: Aetna Health Assurance of PA NAIC #: 18527 Market: Small Group Off-Exchange Effective Date: 01/01/2018 Avg rate change requested: -1.7% Range of rate change requested: -20.4% to +30.5% Products: PPO Rating Areas: Rating Areas 1-3 and 5-9, certain counties excluded Metal Levels: Silver Current # covered lives: 9,989 Current # policyholders: 5,701 Number of plans offered: 1 HIOS Issuer ID / Binder #: 18939 Rate Filing Tracking Number: AETN-131033573 Policy Form(s): AHASPA SG HCOC-2018-PPO 02 Form Filing Tracking Number: AETN-130914613 B. Rate History and Proposed Variations in Rate Changes
• April 1, 2016 o Introduction of legal entity o AETN-130242360
• October 1, 2016 o Increased previously filed 4Q16 rates by 7.4% o AETN-130565231
• January 1, 2017 o Filed a 27.3% rate increase o AETN-130533528
C. Average Rate Change The average rate change, as noted in cell AC15 of Table 10 and the percent change rate requested on the SERFF Rate Review Detail screen, is -1.7%. The change in the 21 year old non-tobacco premium pmpm as stated in cell AN13 on Table 11 is 0.3%. D. Membership Count Total current membership by age bucket is shown on Table 1. E. Benefit Changes The products included in this filing include benefits necessary to comply with the Essential Health Benefit requirements. The experience data includes experience for both Single Risk Pool products that have essentially identical benefits and coverage issued outside the Single Risk Pool which does not cover
2
all EHBs. The projection factor reflects the pro-rated impact of these additional benefits, as well as any changes in 2017 State Benchmark EHBs, and newly mandated benefits. The change in projected utilization due to changes in benefits is also considered. As cost sharing decreases (measured by increasing Actuarial Value), utilization increases. This pattern is reflected in the factors that are built into the federal risk adjustment mechanism that started in 2014. The federal risk adjustment program factors and other proprietary models were considered in the development of the utilization change. The average cost sharing in the experience period was compared with the average cost sharing in the projection period. From the average cost sharing change, an expected utilization change was derived. F. Experience Period Claims and Premium The experience data reported in Worksheet 1, Section I of the Part I Unified Rate Review Template reflects incurred claims from January 1, 2016 through December 31, 2016 and paid through February 28, 2017, for Aetna Health Assurance of PA. Allowed and incurred claims are sourced from our actuarial experience databases. These databases provide member-level detail on total allowed and incurred claims but do not include unit cost or utilization metrics. We allocate claims to cost categories and estimate the corresponding unit costs and utilization metrics by using an alternate reporting system that calculates unit cost and utilization metrics by medical cost category but only permits inclusion/exclusion of experience at the market and segment levels. A reconciliation of aggregate data in our actuarial experience databases is performed to ensure that data is consistent with the experience data contained in our enterprise-wide data warehouse. Total incurred claims are developed by estimating the incurred but not paid (IBNP) reserves using aggregate block of business paid claims. Paid claims are adjusted using the IBNP completion factors. More specifically, historical claim payment patterns are used to predict the ultimate incurred claims for each date-of-service month. The IBNP is estimated using actuarial principles and assumptions which consider historical claim submission and adjudication patterns, unit cost and utilization trends, claim inventory levels, changes in membership and product mix, seasonality, and other relevant factors including a review of large claims. This same process is used to develop IBNP estimates for allowed claims. Experience period premiums are date-of-service premiums from our actuarial experience databases for Small Group business in Pennsylvania. Our internal projections indicate that no MLR rebate is expected to be paid in 2017 (for 2016 experience) for the Small Group MLR Pool in Pennsylvania. As such, no adjustment was made to premiums to account for expected rebates. The products discussed in this filing provide coverage for only those benefits defined as Essential Health Benefits (EHB). No adjustments to the experience period data have been made for capitation arrangements because we expect little to no capitation services to be provided in 2018. Transitional Reinsurance recoveries do not apply to Small Group business. Risk Adjustment transfer is accrued at the issuer and market level based on 2016 Wakely data and our internal projections of how our risk relative to market has changed since that report was issued. The transfer is allocated to the member-level based by applying the HHS risk transfer calculation to each member relative to the imputed market-average, such that members with higher resulting relative transfers scores may have a receivable and members with lower resulting scores may have a payable, regardless of the net market risk transfer result.
3
The resulting member transfers are summed to the HIOS plan level and adjusted for 2016 Risk Adjustment fees of $0.15 PMPM in Worksheet 2. G. Credibility of Data No credibility is assigned to the experience data. This is due to the use of alternate experience data that more accurately captures the essential characteristics of the market for which we are developing rates. The source data for our manual rate is the experience incurred from January 1, 2016 to December 31, 2016 and paid through February, 2017 for Aetna and Coventry community-rated policies in the Pennsylvania Small Group (HMO / PPO) market. The Small Group market experience is considered an appropriate source for the manual rate. The Small Group experience used as the basis for the manual rate was adjusted in a similar manner as the base period experience for changes in population risk morbidity, benefits, and demographic and area normalizations. The data is further adjusted for projected changes in network, provider contract rates, and claims adjudication, in addition to unit cost and utilization trend. H. Trend Identification Medical trend factors are based on our Medical Economics Unit’s local trend and network experience, based on analysis of a continuous normalized population, excluding catastrophic claims. Allowed medical trend includes known and anticipated changes in provider contract rates, severity and medical technology impacts, and expected changes in utilization. The impact of benefit leveraging is accounted for separately in the projected paid to allowed ratio. Pharmacy trends are based on national commercial group Rx trend analysis. Pharmacy trend considers the impact of formulary changes, patent expirations, new drugs, other general market share shifts, and overall utilization trend. Pharmacy Trend is expressed in terms of allowed trend less rebates. Our internal systems assign claims to several benefit categories. We have mapped these categories to the categories described in the Unified Rate Review Instructions released in March, 2017. Inpatient Hospital consists of care delivered at an inpatient facility and associated expenses, including day-based mental health services. Outpatient Hospital includes outpatient surgical, outpatient mental health, and emergency care and associated expenses. Professional includes both specialty physician and primary care physician expenses, including office-based mental health services. Other includes dental, home health care, medical pharmacy expenses, laboratory expenses, and radiology expenses. Non-capitated ambulance is included in the Outpatient Hospital category when billed by the facility and included in Specialist Physician otherwise. Prescription Drug includes drugs dispensed by a pharmacy. The utilization for these services are counted by service type, and aggregated for each benefit category. Inpatient Hospital utilization is counted as days; Outpatient Hospital, Professional, and Other Medical utilization are counted as visits. Prescription Drug utilization is counted per script. Trend factors are developed from annual forward trend and leveraging. A trend factor of 1.00 corresponds to a policy period that begins January 1, 2018. I. Historical Experience As described above, medical trend factors are based on our Medical Economics Unit’s local trend and network experience, and pharmacy trends are based on national commercial group Rx trend analysis. 2. Rate Development & Change
4
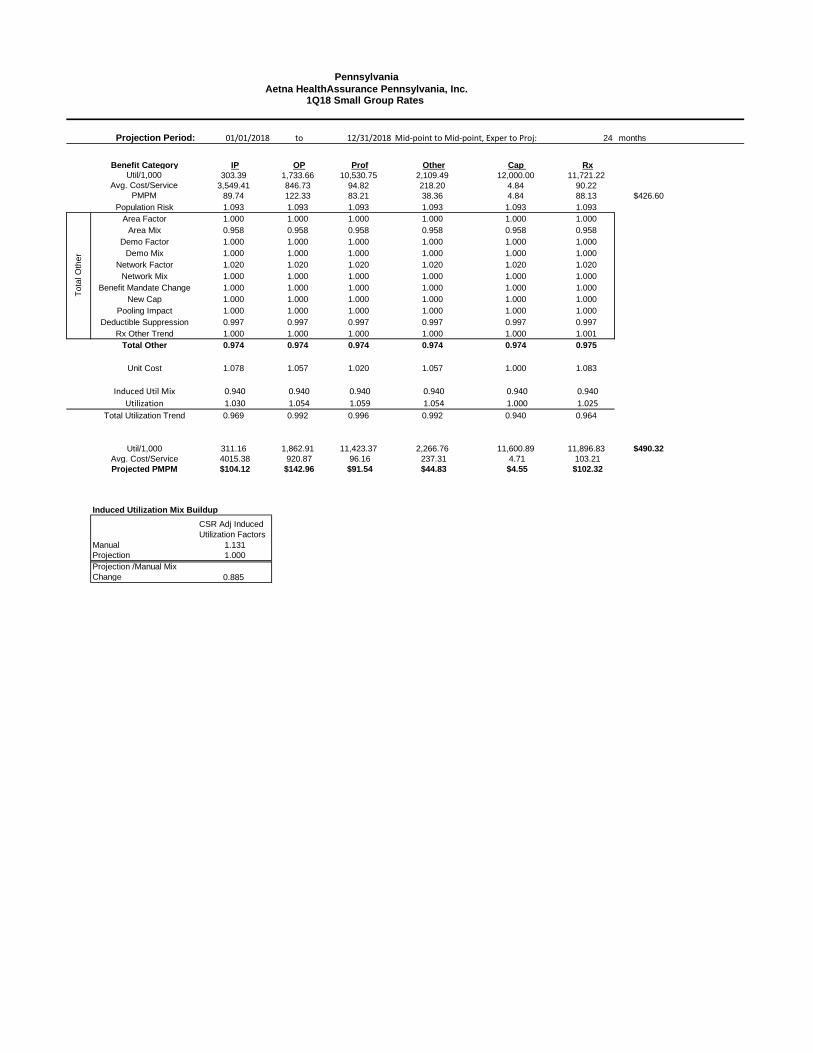
Please refer to the file titled 2018 PA SG AHASPA Exhibits.xlsx for any exhibits referenced in the sections below. A. Development of Projected Index Rate, Market-Adjusted Index Rate, & Total Allowed Claims The index rates for the experience and projection periods are set equal to the actual and projected allowed claims, respectively. The index rate reflects the projected mix of business by plan. The AV pricing values for each plan are based on our internal company modeling of plan cost-sharing designs, the plan’s provider network, delivery system characteristics, and utilization management practices, the impacts (as applicable) of benefits in addition to EHBs and catastrophic eligibility criteria, and the distribution and administrative costs applicable to the plan/product. Rates do not differ for any characteristic other than those allowable under the regulations as described in 45 CFR 156 §156.80(d)(2). Exhibit 12 illustrates the quarterly trend factors, the resulting index rate for effective dates during each calendar quarter, the projected membership distribution by effective date, and the weighted-average index rate. Trend factors are developed from annual forward trend and leveraging. A trend factor of 1.00 corresponds to a policy period that begins January 1, 2018. Exhibit E-1 illustrates the development of the Market Adjusted Index Rate. The market-wide adjustment for Risk Adjustment was discussed, previously. The risk adjustment on is displayed on a paid-basis and the exchange user fee is estimated as a PMPM based on the target premium rate on Worksheet 1 of the URRT. These values have been have each been converted to percent of allowed claims in this Exhibit. Single Risk Pool Adjustment Factors: Change in Morbidity => The experience period data includes experience for community-rated policies issued to small employers in 2016 and medically underwritten policies renewed under the Transitional Policy. We considered the expected relationships between the morbidity of each of these populations and the likely population that will be covered by Small Group Single Risk Pool policies in 2018. Change in Demographics => Experience data was normalized for projected changes in the age/gender mix and area mix using internally-developed factors. Exhibits 5 and 6 contain detail on the calculations of the impact of demographic mix shifts. Change in Network => Included in ‘Change in Other’ below. Change in Benefits => Discussed in Section 1E above. Change in Other => The ‘Other’ adjustment includes, but is not limited to, the projected impact of changes in network composition, provider contracts, deductible suppression, and pooling. Paid-to-Allowed Ratio => The projected paid to allowed ratio is 84.5%. Paid to allowed ratios are based on 2016 experience that is adjusted for the impact of any plan benefit changes based on our internal pricing models and trend deductible-leveraging. Risk Adjustment – Projection Period => We used the projected Risk Adjustment Transfer amounts provided by the Pennsylvania Insurance Department on May 12, 2017, which incorporated carrier data as of May 1, 2017, to develop our initial projected risk adjustment transfer assumption.
5
In addition, the projected risk adjustment transfer includes changes that were outlined in the 2018 Notice of Benefit and Payment Parameters. The 2018 projected market average premium used in the payment transfer formula is also reduced by 14% to remove administrative cost. We subtracted from that Risk Adjustment transfer .5% of premiums for National High Risk pool funding, and added our anticipated High Risk Pool recoveries. High Risk Pool recoveries were estimated based on the average of member-level recoveries that we would have received under this program for 2014-2016 claims as a percent of premium, for Silver Off-Exchange plans. As a result, we project a risk adjustment payable, net of the 2018 user fee of $0.14 PBMPM. Reinsurance – Projection Period => There will be no reinsurance recoveries in 2018. Exchange User Fee => The EUF is not applicable for this filing. Projected Allowed non-EHB Claims PMPM => The products discussed in this filing provides coverage for only those benefits defined as Essential Health Benefits (EHB). B. Retention Items The retention portion of the projected premium is illustrated in Exhibit 10. The prospective general and administrative expenses are set to achieve the 80% MLR threshold requirement. Actual general and administrative expenses are based on historical corporate Small Group market expense levels, 2017 projections, and projected changes in expenses, inflation, and membership for 2018 for our National book of Small Group business. The commission expense factor covers anticipated sales and marketing expenses. Those may include, without limitation, purchase of television, internet and other advertising; payments of commissions and other incentive compensation to Company’s internal sales force; and payment of commissions to external brokers. The exact amounts and distribution among the categories of sales and marketing expenses will depend on a variety of factors including competitive conditions, business strategy, consumer behaviors, and legal and regulatory requirements. The consumer behaviors would capture whether they use a particular distribution channel, commissioned or not, as well as their experience. Federal taxes include PPACA Taxes and Fees are based on the Notice of Benefit and Payment Parameters for 2018, as well as Federal income tax and State Premium taxes. The risk adjustment user fee is applied to the projected risk adjustment transfer and therefore, excluded from the taxes and fees shown under non-benefit expenses. State premium taxes are estimated on most current known levels and include any known assessments. The profit and risk load is consistent with the target used in the initial pricing of our 2017 plans. C. Normalized Market-Adjusted Projected Allowed Total Claims The age factors are based on the HHS Default Standard Age curve. The factors are shown in Exhibit C-2. Exhibit C-2 demonstrates the determination of the Plan-Level Average Age Factor. Plan membership is based on issuer’s similar January 2017 plan membership and projected changes in the market. To Age-Calibrate the Plan-Adjusted Index Rates, We project a premium-weighted average age factor for the 2018 membership using the prescribed age curve and the projected age for each plan, as illustrated on Exhibit C-2, The overall Age Calibration factor is developed in Column B of Exhibit C-1. This factor is based on the weighting of plan-adjusted index rate and membership weighted by each plan’s average age factor membership. The Age-Calibrated Plan Adjusted Index Rate is determined multiplying each Plan
6
Adjusted Index Rate by the Plan-Level Average Age Factor and then dividing by the weighted over-all average age factor. The age that most closely corresponds to the premium weighted overall average age factor is the average age for the single risk pool. Exhibit C-2 summarizes the rating area definitions and factors, and displays the projected premium by area to develop the projected average area factor. The geographic calibration factor is the reciprocal of the projected average area factor, and is applied in column F of Exhibit C-1. Projected area factors are shown in Exhibits 6 and C-2. Unit cost trend studies were used to evaluate whether there were significant changes to network costs that would require changes from previously filed rating area factors. The rates in this filing do not differ based on tobacco usage. As such, no adjustment is needed to remove the impact of rating for tobacco. D. Components of Rate Change The overall change in the weighted average Calibrated Plan Adjusted Index Rate is -1.7%, as indicated in Table 8 row A. The components of this rate change are as follows:
• The change in normalized allowed claims is worth -6% • The change in allowable plan adjusted level components is worth 1% • The change in retention components is worth 3% • The remainder is driven primarily by the 2017 covered lives that are not being mapped to 2018
plans. 3. Plan Rate Development The following briefly describes how each set of adjustments was determined. Pricing AV / Benefit Richness: These adjustments are discussed in Section 2C above. Benefits in addition to EHBs: The products discussed in this filing provide coverage for only those benefits defined as Essential Health Benefits (EHB). The factor for the impact of benefits in addition to EHBs is a 1.00. Provider Network: This adjustment reflects the impact of differences in the network size, efficiency, and provider contract terms. We worked with our contracting area and other subject matter experts to review the impact of these differences and the expected impact on allowed claims. Catastrophic Eligibility: This filing does not include catastrophic plans. Tobacco Surcharge Adjustment: The rates in this filing do not differ based on tobacco usage. As such, no adjustment is needed to remove the impact of rating for tobacco. Admin Costs / Taxes & Fees / Profit or Contingency: These factors reflect the adjustment for projected administrative costs, including sales, marketing, and any commission expense, and profit & risk. These are discussed above in the Retention section. An AV Certification is included in this filing, titled PA_SG_18939_AVCert_Off_2018_v1.pdf.
7
4. Plan Premium Development for 21-Year-Old Non-Tobacco User The Calibrated Plan Adjusted Index Rates for 2017 and 2018 are shown in Columns Z and AA. The 2018 rates in Column AA differ from the Calibrated Plan Adjusted Index Rates on Exhibit E-2 for two reasons: (1) The CPAIR on Exhibit E-2 are 1/1/2018 rates while the rates in Column AA are average 2018 rates, and (2) our internal modeling incorporates the average trend to develop a Net Risk Adjustment factor as indicated on Exhibit E-1 to go from the Projected Index Rate to the Market Adjusted Index Rate. This is not accounted for in Table 5. 5. Plan Factors A. Age and Tobacco Factors The age factors are based on the HHS Default Standard Age curve. The rates in this filing do not differ based on tobacco usage. As such, no adjustment is needed for tobacco rating and factors of 1.0 have been entered. B. Geographic Factors The proposed geographic factors are the same as the current approved 2017 factors. C. Network Factors There is only one network included in this filing. D. Service Area Composition The Service Area composition for this rate filing is the same as the current approved 2017 rate filing. E. Composite Rating While PA allows composite rating, we are not offering this option at this time. However, the member level rates in this filing would not be impacted if we allow the composite rating option at a later time.
8
6. Actuarial Certifications Reliance While I have reviewed the reasonableness of the assumptions and data in support of both the preparation of the Part I Unified Rate Review Template and the rate development applicable to the products discussed in this filing, I relied on the expertise of other Aetna employees, along with work products produced at their direction, for the following items:
• Risk Adjustment Transfer • Actuarial Value, Modifications, and Benefit Relativities • Supplemental EHB Pricing • Population Risk Morbidity • Medical Cost and Utilization Trend • Rx Cost and Utilization Trend • Components of Retention/Administrative Fees • Value of Network Arrangements • Experience Period Data – Small Group
Certification While this memorandum discusses both our development of rates for these products and the completion of the Part I Unified Rate Review Template (URRT), the Part I URRT does not demonstrate the process used by Aetna to develop the rates. Rather, it represents information required by Federal regulation to be provided in support of the review of rate increases, for certification of qualified health plans for Federally-facilitated marketplaces, and for certification that the index rate is developed in accordance with Federal regulation, is used consistently, and is only adjusted by the allowable modifiers. The information provided above is intended to comply with these requirements. I, XXXXXXXX am a Fellow of the Society of Actuaries, a member of the American Academy of Actuaries, and am qualified in the area of health insurance. I hereby certify that to the best of my knowledge and judgment:
1. This rate filing is in compliance with the applicable laws and regulations of Pennsylvania, the requirements under federal law and regulation, and all applicable Actuarial Standards of Practice, including but not limited to:
a. ASOP No. 5, Incurred Health and Disability Claims b. ASOP No. 8, Regulatory Filings for Health Benefits, Accident and Health Insurance, and
Entities Providing Health c. ASOP No. 12, Risk Classification d. ASOP No. 23, Data Quality e. ASOP No. 25, Credibility Procedures Applicable to Accident and Health, Group Term
Life, and Property/Casualty Coverages f. ASOP No. 26, Compliance with Statutory and Regulatory Requirements for the Actuarial
Certification of Small Employer Health Benefit Plans g. ASOP No. 41, Actuarial Communications h. ASOP No. 50, Determining Minimum Value and Actuarial Value under the Affordable
Care Act
2. The Projected Index Rate is:
9
a. In compliance with all applicable State and Federal Statutes and Regulations (45 CFR 156.80(d)(1) and 147.102),
b. Developed in compliance with the applicable Actuarial Standards of Practice, c. Reasonable in relation to the benefits provided and the population anticipated to be
covered, d. Neither excessive, deficient, nor unfairly discriminatory.
3. The Index Rate and only the allowable modifiers as described in 45 CFR 156.80(d)(1) and 45
CFR 156.80(d)(2) were used to generate plan-level rates.
4. The percent of total premium that represents essential health benefits included in Worksheet 2, Sections III and IV were calculated in accordance with actuarial standards of practice.
5. The geographic rating factors reflect only differences in the costs of delivery (which include unit costs and provider practice pattern differences) and do not include differences for population morbidity by geographic area.
6. The AV Calculator was used to determine the AV Metal Values shown in Worksheet 2 of the Part I Unified Rate Review Template for all plans. Adjustments made to reflect benefit features not handled by the AV Calculator are discussed in the attached certification required by 45 CFR Part 156, §156.135.
September 5, 2017 __________________________________ ___________________ XXXXXXXXX, FSA, MAAA Date Aetna
1
Actuarial Memorandum and Certification General Information Company Identifying Information: Company Legal Name: Aetna Health Assurance of PA State: Pennsylvania HIOS Issuer ID: 18939 Market: Small Group Effective Date: 01/01/2018 Rate Filing Tracking Number: AETN-131033573 Policy Form(s): AHASPA SG HCOC-2018-PPO 02 Form Filing Tracking Number: AETN-130914613 Company Contact Information: Name: zzzzzzzzzz Telephone Number: zzzzzzzzzzzzz Email Address: zzzzzzzzzzzzzzzzzzzz 1. Purpose, Scope, and Effective Date The purpose of this filing is to:
1) Provide support for the development of the Part I Unified Rate Review Template; 2) Provide support for the assumptions and premiums rate development for the products supported
by the policy forms referenced above; 3) Request approval of the proposed monthly premium rates; and 4) Provide benefit plan designs summaries for the products included in this filing.
The development of the rates reflects the impact of the market forces and rating requirements associated with the Patient Protection and Affordable Care Act (PPACA) and subsequent regulation. These rates are for plans issued in Pennsylvania beginning January 1, 2018. The rates comply with all rating guidelines under federal and state regulations. The filing covers plans that will be offered outside the public Marketplace in Pennsylvania. 2. Proposed Rate Increase This filing includes new benefit plans that will be marketed to Small Groups in Pennsylvania for coverage effective beginning January 1, 2018. 3. Experience Period Premium and Claims A. Paid Through Date: The experience data reported in Worksheet 1, Section I of the Part I Unified Rate Review Template reflects incurred claims from January 1, 2016 through December 31, 2016 and paid through February 28, 2017. B. Premiums (Net of MLR Rebate) in Experience Period:
2
Experience period premiums are date-of-service premiums from our actuarial experience databases for Small Group business in Pennsylvania. Our internal projections indicate that no MLR rebate is expected to be paid in 2017 (for 2016 experience) for the Small Group MLR Pool in Pennsylvania. As such, no adjustment was made to premiums to account for expected rebates. C. Allowed and Incurred Claims Incurred During the Experience Period: Allowed and incurred claims are sourced from our actuarial experience databases. These databases provide member-level detail on total allowed and incurred claims but do not include unit cost or utilization metrics. We allocate claims to cost categories and estimate the corresponding unit costs and utilization metrics by using an alternate reporting system that calculates unit cost and utilization metrics by medical cost category but only permits inclusion/exclusion of experience at the market and segment levels. A reconciliation of aggregate data in our actuarial experience databases is performed to ensure that data is consistent with the experience data contained in our enterprise-wide data warehouse. Total incurred claims are developed by estimating the incurred but not paid (IBNP) reserves using aggregate block of business paid claims. Paid claims are adjusted using the IBNP completion factors. More specifically, historical claim payment patterns are used to predict the ultimate incurred claims for each date-of-service month. The IBNP is estimated using actuarial principles and assumptions which consider historical claim submission and adjudication patterns, unit cost and utilization trends, claim inventory levels, changes in membership and product mix, seasonality, and other relevant factors including a review of large claims. This same process is used to develop IBNP estimates for allowed claims. In addition to the fee-for-service and capitation payments discussed above, some of our provider contracts include provisions under which we share claim cost differences with the provider relative to a pre-determined target amount. These adjustments serve to increase our claims cost when results are favorable to the target and decrease our claims costs when results are unfavorable. We adjust both allowed and incurred claims by our current estimate of the impact of provider risk sharing provisions. 4. Benefit Categories Our internal systems assign claims to several benefit categories. We have mapped these categories to the categories described in the Unified Rate Review Instructions released in March, 2017. Inpatient Hospital consists of care delivered at an inpatient facility and associated expenses, including day-based mental health services. Outpatient Hospital includes outpatient surgical, outpatient mental health, and emergency care and associated expenses. Professional includes both specialty physician and primary care physician expenses, including office-based mental health services. Other includes dental, home health care, medical pharmacy expenses, laboratory expenses, and radiology expenses. Non-capitated ambulance is included in the Outpatient Hospital category when billed by the facility and included in Specialist Physician otherwise. Prescription Drug includes drugs dispensed by a pharmacy. The utilization for these services are counted by service type, and aggregated for each benefit category. Inpatient Hospital utilization is counted as days; Outpatient Hospital, Professional, and Other Medical utilization are counted as visits. Prescription Drug utilization is counted per script. 5. Projection Factors A. Changes in the Morbidity of the Population Insured: The experience period data includes experience for:
• Community-rated policies issued to small employers in 2016 • Medically underwritten policies renewed under the Transitional Policy.
3
We considered the expected relationships between the morbidity of each of these populations and the likely population that will be covered by Small Group Single Risk Pool policies in 2018. B. Changes in Benefits: The products included in this filing include benefits necessary to comply with the Essential Health Benefit requirements. The experience data includes experience for both Single Risk Pool products that have essentially identical benefits and coverage issued outside the Single Risk Pool which does not cover all EHBs. The projection factor reflects the pro-rated impact of these additional benefits, as well as any changes in 2017 State Benchmark EHBs, and newly mandated benefits. The change in projected utilization due to changes in benefits is also considered. As cost sharing decreases (measured by increasing Actuarial Value), utilization increases. This pattern is reflected in the factors that are built into the federal risk adjustment mechanism that started in 2014. The federal risk adjustment program factors and other proprietary models were considered in the development of the utilization change. The average cost sharing in the experience period was compared with the average cost sharing in the projection period. From the average cost sharing change, an expected utilization change was derived. C. Changes in Demographics: Experience data was normalized for projected changes in the age/gender mix and area mix using internally-developed factors. Exhibits 5 and 6 contain detail on the calculations of the impact of demographic mix shifts. D. Other Adjustments: The ‘Other’ adjustment includes the projected impact of changes in network composition and provider contracts. E. Trend Factors (Cost/Utilization): Medical trend factors are based on our Medical Economics Unit’s local trend and network experience, based on analysis of a continuous normalized population, excluding catastrophic claims. Allowed medical trend includes known and anticipated changes in provider contract rates, severity and medical technology impacts, and expected changes in utilization. The impact of benefit leveraging is accounted for separately in the projected paid to allowed ratio. Pharmacy trends are based on national commercial group Rx trend analysis. Pharmacy trend considers the impact of formulary changes, patent expirations, new drugs, other general market share shifts, and overall utilization trend. Pharmacy Trend is expressed in terms of allowed trend less rebates.
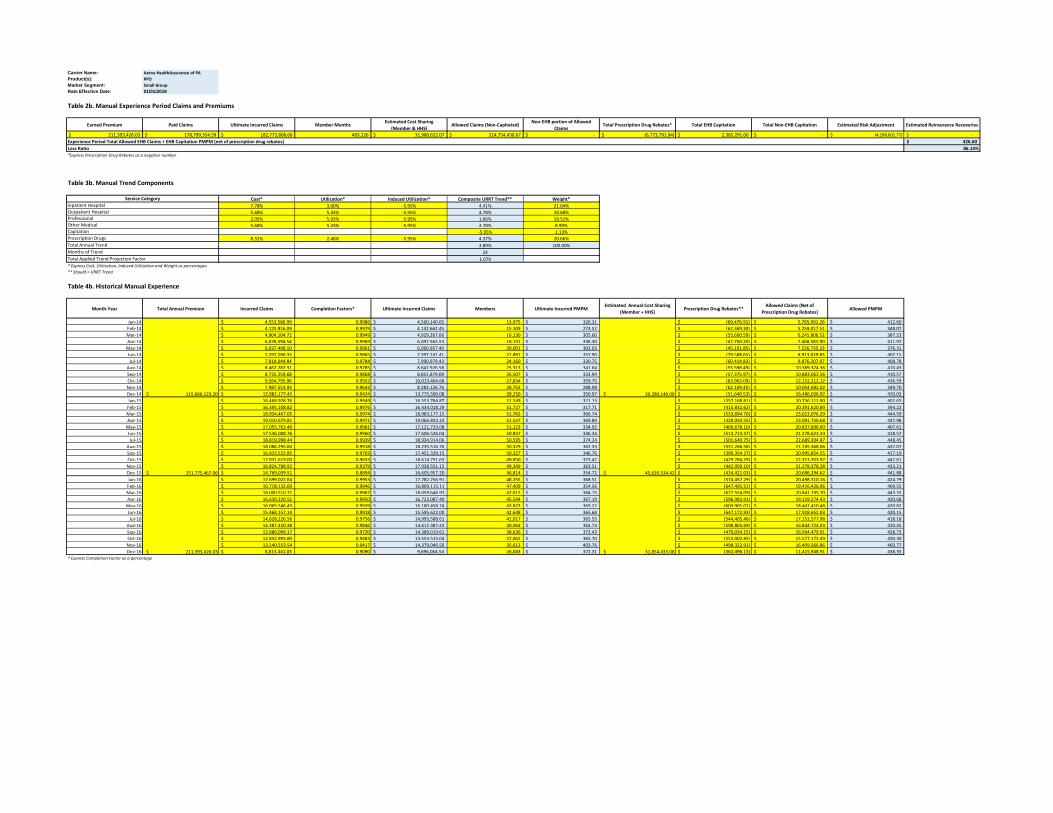
Exhibit 8 shows the anticipated annual trend from the experience period to the rating period.
6. Credibility Manual Rate Development A. Source and Appropriateness of Experience Data Used: The source data for our manual rate is the experience incurred from January 1, 2016 to December 31, 2016 and paid through February, 2017 for Aetna and Coventry community-rated policies in the Pennsylvania Small Group (HMO / PPO) market. The Small Group market experience is considered an appropriate source for the manual rate. B. Adjustments Made to the Data: The Small Group experience used as the basis for the manual rate was adjusted in a similar manner as the base period experience for changes in population risk morbidity, benefits, and demographic and area normalizations. The data is further adjusted for projected changes in network, provider contract rates, and
4
claims adjudication, in addition to unit cost and utilization trend, as discussed in the previously referenced exhibits. C. Inclusion of Capitation Payments: No adjustments to the experience period data have been made for capitation arrangements because we expect little to no capitation services to be provided in 2018. 7. Credibility of Experience No credibility is assigned to the experience data. This is due to the use of alternative experience data that more accurately captures the essential characteristics of the market for which we are developing rates. 8. Paid-to-Allowed Ratio The projected paid to allowed ratio is 84.5%. Paid to allowed ratios are based on 2016 experience that is adjusted for the impact of any plan benefit changes based on our internal pricing models and trend deductible-leveraging. 9. Reinsurance and Risk Adjustment A. Reinsurance – Experience Period Transitional Reinsurance recoveries do not apply to Small Group business. The experience period data reflects the Reinsurance Contribution of $2.25 PMPM assessed during 2016. B. Risk Adjustment – Experience Period Risk Adjustment transfer is accrued at the issuer and market level based on 2016 Wakely data and our internal projections of how our risk relative to market has changed since that report was issued. The transfer is allocated to the member-level based by applying the HHS risk transfer calculation to each member relative to the imputed market-average, such that members with higher resulting relative transfers scores may have a receivable and members with lower resulting scores may have a payable, regardless of the net market risk transfer result. The resulting member transfers are summed to the HIOS plan level and adjusted for 2016 Risk Adjustment fees of $0.15 PMPM in Worksheet 2. C. Risk Adjustment – Projection Period We used the projected Risk Adjustment Transfer amounts provided by the Pennsylvania Insurance Department on May 12, 2017, which incorporated carrier data as of May 1, 2017, to develop our initial projected risk adjustment transfer assumption. In addition, the projected risk adjustment transfer includes changes that were outlined in the 2018 Notice of Benefit and Payment Parameters. The 2018 projected market average premium used in the payment transfer formula is also reduced by 14% to remove administrative cost. We subtracted from that Risk Adjustment transfer .5% of premiums for National High Risk pool funding, and added our anticipated High Risk Pool recoveries. High Risk Pool recoveries were estimated based on the average of member-level recoveries that we would have received under this program for 2014-2016 claims as a percent of premium, for Silver Off-Exchange plans. As a result, we project a risk adjustment payable, net of the 2018 user fee of $0.14 PBMPM. 10. Non-Benefit Expenses and Profit & Risk The retention portion of the projected premium is illustrated in Exhibit 10. The prospective general and administrative expenses are set to achieve the 80% MLR threshold requirement. Actual general and administrative expenses are based on historical corporate Small Group market expense levels, 2017 projections, and projected changes in expenses, inflation, and membership
5
for 2018 for our National book of Small Group business. The commission expense factor covers anticipated sales and marketing expenses. Those may include, without limitation, purchase of television, internet and other advertising; payments of commissions and other incentive compensation to Company’s internal sales force; and payment of commissions to external brokers. The exact amounts and distribution among the categories of sales and marketing expenses will depend on a variety of factors including competitive conditions, business strategy, consumer behaviors, and legal and regulatory requirements. The consumer behaviors would capture whether they use a particular distribution channel, commissioned or not, as well as their experience.
Federal taxes include PPACA Taxes and Fees are based on the Notice of Benefit and Payment Parameters for 2018, as well as Federal income tax and State Premium taxes. The risk adjustment user fee, as previously mentioned in Section 9, is applied to the projected risk adjustment transfer and therefore, excluded from the taxes and fees shown under non-benefit expenses. State premium taxes are estimated on most current known levels and include any known assessments. The profit and risk load is consistent with the target used in the initial pricing of our 2017 plans. 11. Projected Loss Ratio The expected 2018 MLR for this filing, as defined by PPACA and before any credibility adjustment, is shown in Exhibit 11. 12. Single Risk Pool The plans and rates included in the Part I URRT are those for all plans we intend to offer in the Small Group market in Pennsylvania through Aetna Health Assurance of PA. The proposed rates comply with the Single Risk Pool requirements of 45 CFR §156.80(d). Rates for plans that may be renewed outside the Single Risk Pool (due to either being grandfathered or permissible transitional offerings) are not covered in this filing. 13. Index Rate The index rates for the experience and projection periods are set equal to the actual and projected allowed claims, respectively. The index rate reflects the projected mix of business by plan. The AV pricing values for each plan are based on our internal company modeling of plan cost-sharing designs, the plan’s provider network, delivery system characteristics, and utilization management practices, the impacts (as applicable) of benefits in addition to EHBs and catastrophic eligibility criteria, and the distribution and administrative costs applicable to the plan/product. Rates do not differ for any characteristic other than those allowable under the regulations as described in 45 CFR 156 §156.80(d)(2). Small Group Market Trend Adjustments: Exhibit 12 illustrates the quarterly trend factors, the resulting index rate for effective dates during each calendar quarter, the projected membership distribution by effective date, and the weighted-average index rate. Trend factors are developed from annual forward trend and leveraging. A trend factor of 1.00 corresponds to a policy period that begins January 1, 2018. 14. Market-Adjusted Index Rate Exhibit E-1 illustrates the development of the Market Adjusted Index Rate. The market-wide adjustment for Risk Adjustment was discussed, previously. The risk adjustment on is displayed on a paid-basis and the exchange user fee is estimated as a PMPM based on the target premium rate on Worksheet 1 of the URRT. These values have been have each been converted to percent of allowed claims in this Exhibit.
6
15. Plan-Adjusted Index Rates Exhibit E-2 illustrates the development of the Plan Adjusted Index Rates, and displays each plan-specific adjustment made to the Market Adjusted Index Rate. The 2018 Plan Adjusted Index Rates are displayed in Column 7. The following briefly describes how each set of adjustments was determined. A. Actuarial Value, Cost Sharing: The factors in Column 2 are the product of two separate adjustments:
1. We used internal models developed on large group claims experience to estimate the impact of different cost sharing designs. The combination of these two analyses is a projection of the relative paid to allowed ratio which also reflects the impact of out of network coverage.
2. We applied an adjustment for the impact different levels of cost sharing have on the use of medical services, which is based in part on the induced utilization factors used in the Risk Adjustment program. These adjustments are first normalized to result in an aggregate factor of 1.0 when applied to the projected 2018 membership.
B. Distribution and Administrative Costs: Exhibit E-2, Column 3, reflects the adjustment for projected administrative costs, including any sales, marketing, and profit & risk. These are discussed above in the ‘Non-Benefit Expenses and Profit & Risk’ section, and exclude the Risk Adjustment User Fee, and Exchange User Fee, which are reflected in the Market-Adjusted Index Rate. These expense and profit assumptions do not vary by plan. C. Provider Network, Delivery System, and Utilization Management: The factors in Column 4 reflect the impact of differences in the network size, efficiency, and provider contract terms. We worked with our contracting area and other subject matter experts to review the impact of these differences and the expected impact on allowed claims. D. Benefits in addition to EHBs: The factors in Column 5 adjust for the impact of benefits in addition to EHBs. The products discussed in this filing provide coverage for only those benefits defined as Essential Health Benefits (EHB). Hence, all factors in Column 5are 1.00. E. Catastrophic Plan Eligibility: This filing does not include catastrophic plans. 16. Calibration Exhibit C-1 shows an example of how calibration is applied to all plan adjusted index rates. A. Age Curve Calibration: The age factors are based on the HHS Default Standard Age curve. The factors are shown in Exhibit C-2. Exhibit C-2 demonstrates the determination of the Plan-Level Average Age Factor. Plan membership is based on issuer’s similar January 2017 plan membership and projected changes in the market. To Age-Calibrate the Plan-Adjusted Index Rates, We project a premium-weighted average age factor for the 2018 membership using the prescribed age curve and the projected age for each plan, as illustrated on Exhibit C-2, The overall Age Calibration factor is developed in Column B of Exhibit C-1. This factor is based on the weighting of plan-adjusted index rate and membership weighted by each plan’s average age factor membership. The Age-Calibrated Plan Adjusted Index Rate is determined multiplying each Plan Adjusted Index Rate by the Plan-Level Average Age Factor and then dividing by the weighted over-all average age factor.
7
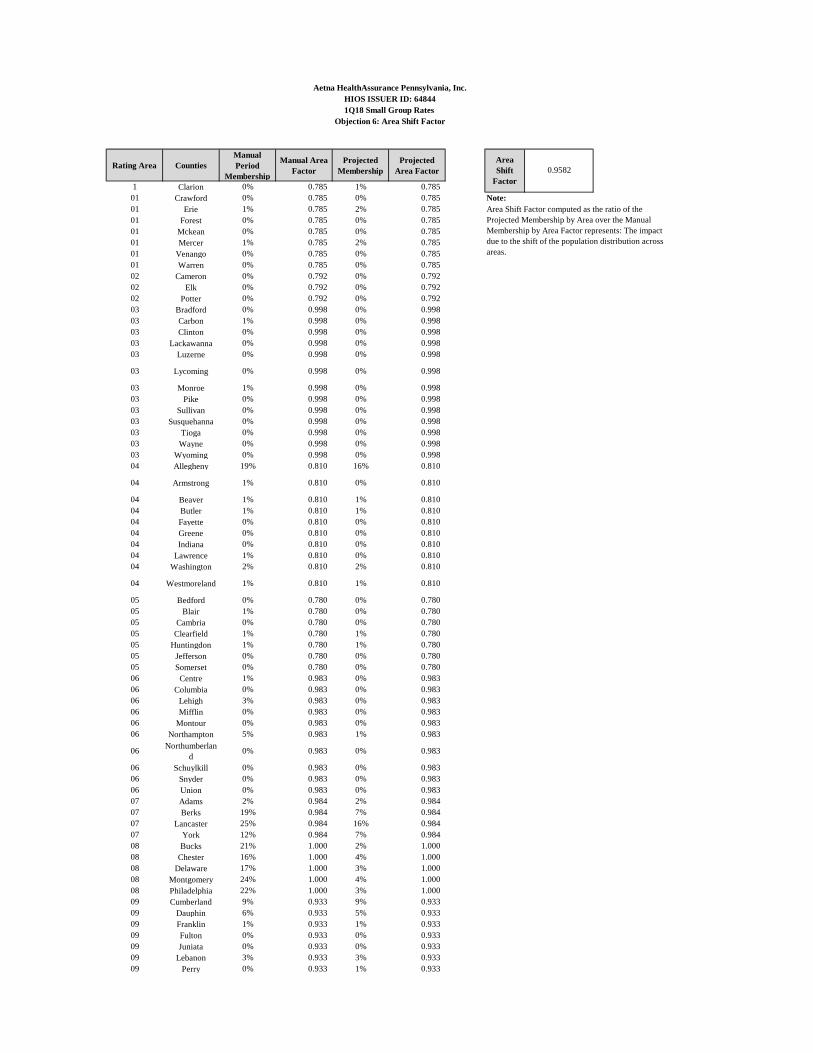
The age that most closely corresponds to the premium weighted overall average age factor is the average age for the single risk pool. B. Geographic Factor Calibration: Exhibit C-2 summarizes the rating area definitions and factors, and displays the projected premium by area to develop the projected average area factor. The geographic calibration factor is the reciprocal of the projected average area factor, and is applied in column F of Exhibit C-1. Projected area factors are shown in Exhibits 6 and C-2. Unit cost trend studies were used to evaluate whether there were significant changes to network costs that would require changes from previously filed rating area factors. C. Small Group Premium Rates: The development of the average projected trend factor is discussed above.
17. Consumer-Adjusted Premium Rate Development Rates are determined using the prescribed member build-up approach. In the event that a family includes more than three child dependents under age 21, only the three oldest child dependents will be considered in determining the family’s premium. Additional child dependents (non-billable members) will not be included in the rate calculation. The premium for each billable member is calculated as: Calibrated Plan Adjusted Index Rate * Age Factor * Area Factor * Trend Factor The resulting rate is rounded to the nearest cent, and rates are then summed for all billable family members. An example of a contract’s premium determined by the member build-up calculation for a family of six, with more than three dependents under age 21, is shown in Exhibit 14. 18. Composite Premiums Small employers will not be able to elect to have rates set using a composite approach as permitted by Pennsylvania. 19. AV Metal Values The AV Metal Values on Worksheet 2 were based on the AV 2018 Calculator. As applicable, entries were modified to reflect the plan appropriately and/or adjustments were made for plan design features that could not be entered in the calculator per 45 CFR Part 156, §156.135. The accompanying certification discusses how the benefits were modified to fit the parameters and the development of any adjustments. The AV screen shots provide detail on the modified entries and adjustments to AV, as applicable. 20. AV Pricing Values The AV Pricing Values are calculated as the ratio of the Plan Adjusted Index Rate to the Market Adjusted Index Rate. The adjustments reflected in the AV Pricing Values are discussed in Section 15. AV Pricing Values do not differ based on morbidity differences or benefit selection anticipated within the Single Risk Pool. 21. Membership Projections Exhibit 15/C-2 summarizes the membership projections by plan. Membership projections are based on historical experience, enrollment in ACA-compliant plans through January 2017, and our expectations for future sales as additional members move to these plans from grandfathered and transitional plans. (We assume that total enrollment will be similar to our current enrollment.)
8
Terminated Plans and Products Exhibit 16 provides a plan and product crosswalk from 2016 to 2018. The crosswalk includes the list of products that have experience in the single risk pool experience period, and products that were made available in 2017 and 2018. Consistent with the URRT instructions, experience for non-single risk pool terminated products is reported in aggregate under the terminated product with the largest membership in the experience period. 22. Plan Type All plans are consistent with the plan type indicated on Worksheet 2. 23. Warning Alerts The Experience Period Plan Adjusted Index Rate on Worksheet 2 differs from the Experience Period Premium PMPM on Worksheet 1 since 1) the Experience Period Premium reflects the actual enrollment mix for all non -grandfathered business in the market in 2016 while the average Plan Adjusted Index Rate reflects the projected (vs. actual) ACA mix for single risk pool experience and a zero rate for non-single risk pool experience , and 2) premiums reported on Worksheet 1 are net of estimated risk adjustment transfers and MLR rebates while the Plan Adjusted Index Rates on Worksheet 2 do not consider the impact of risk adjustment transfers or MLR rebates.
For the same reasons, the experience period Total Premium (TP) differs between Worksheets 1 and 2.
The Experience Period Incurred claims and Incurred Claims PMPM on Worksheet 2 adjust for the impacts of Reinsurance and Risk Adjustment. The Incurred Claims on Worksheet 1 are not adjusted for the impact of Reinsurance and Risk Adjustment. The warning alerts on rows 68 and 73 of Worksheet 2 result from the different treatment of Reinsurance and Risk Adjustment on the two worksheets.
The Projected Plan Adjusted Index Rate on Worksheet 2 differs from the Gross Premium Average Rate on Worksheet 1. This difference results from the value on Worksheet 1 being the rate that corresponds to claims incurred in the 12 months starting January 1, 2017, while the average on Worksheet 2 is the average rate for the market for coverage that begins between January 1, 2017 and December 31, 2017.
For the same reason, Total Premium (TP) differs between Worksheets 1 and 2.
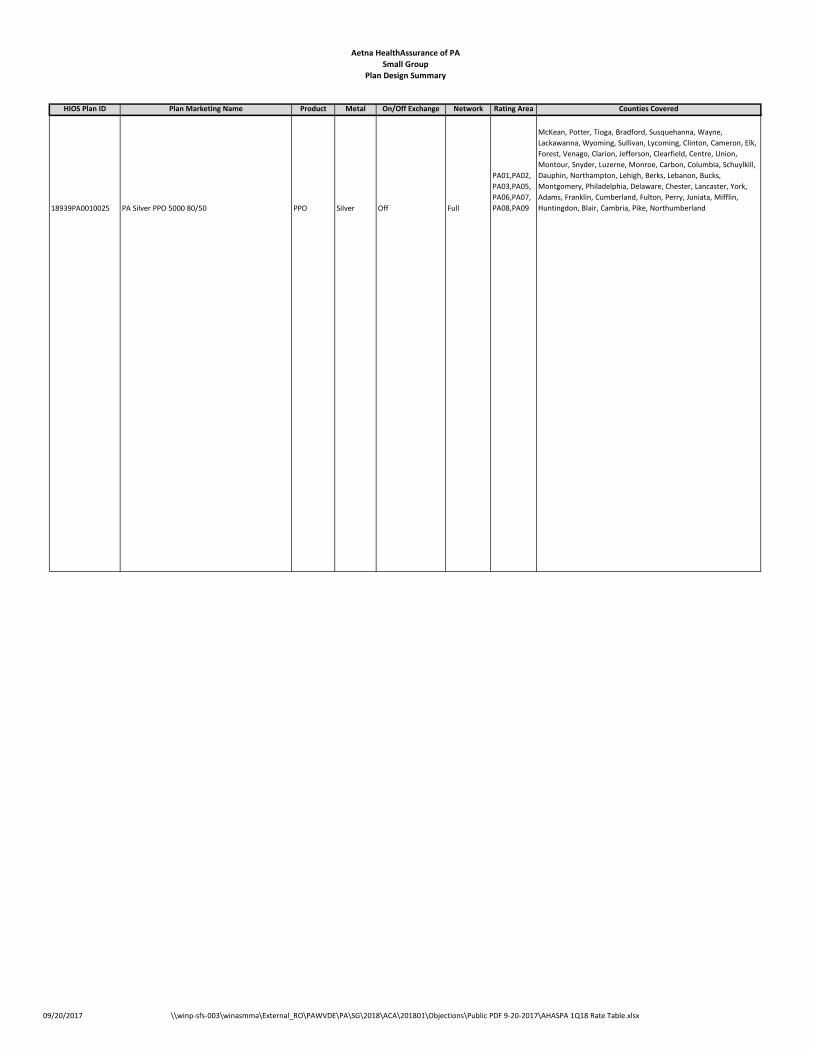
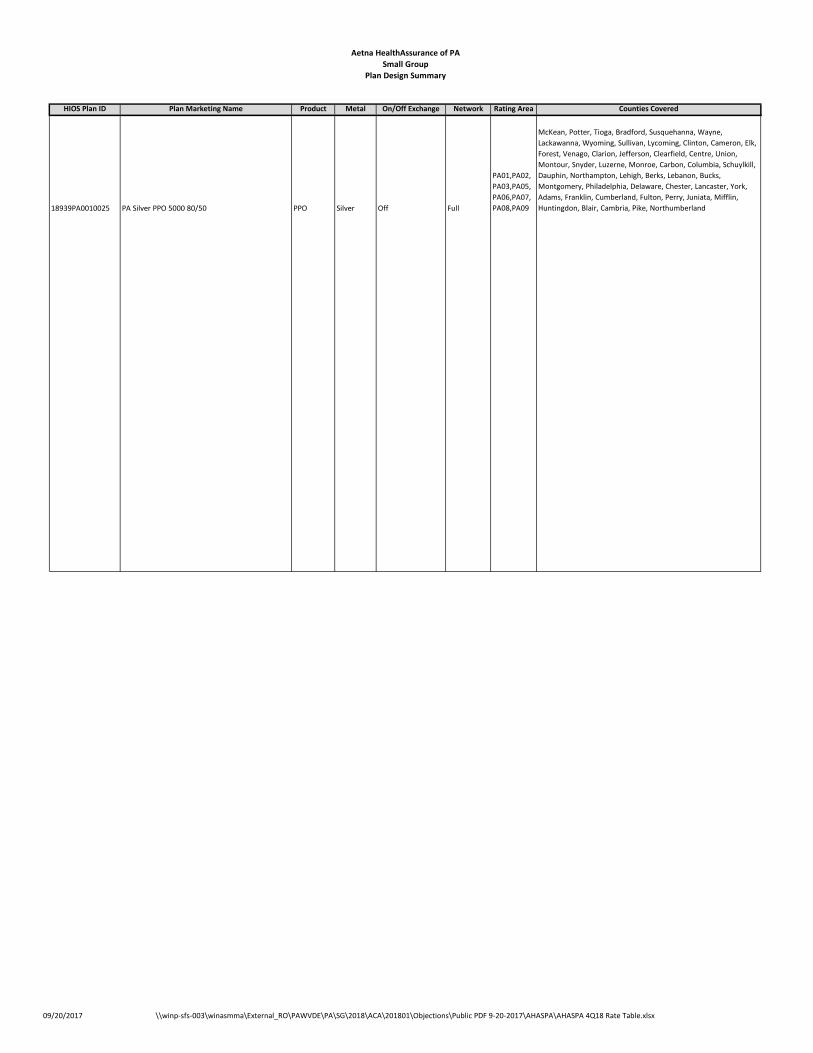
24. Benefit Design This filing includes one Silver plan.
Please refer to the corresponding policy forms for detailed benefit language. Information on the cost-sharing parameters of the covered benefit plans, including deductibles, copays, and Actuarial Values, is summarized in the supporting exhibits. All benefit and cost sharing parameters comply with Pennsylvania benefit mandates and the requirements of PPACA, including preventive care benefits, deductible limits, and Actuarial Value requirements. 25. Marketing Plans will be available outside of the public Marketplace. These plans may be marketed in a variety of means, including HHS Plan Finder and our own website. In addition, members of our 2017 plans will be mailed a discontinuance or renewal letter, in accordance with CMS guidelines. Marketing and distribution approaches may change from time to time at management’s discretion.
26. Underwriting Aetna will verify applicant eligibility for these plans based on any applicable age or geographic limitations.
9
27. Renewability These policies are guaranteed renewable as required under §2703 of the Public Health Service Act.
28. Company Financial Condition As of December 31, 2016, the capital and surplus held by Aetna Health Assurance of PA was approximately $10 million. This amount is disclosed in page 3, line 33 of the Company’s statutory financial statement dated December 31, 2016. The Company issues commercial and Medicare Advantage coverage in various states for multiple business segments, including to large employer, small employer, and individual purchasers.
10
Reliance While I have reviewed the reasonableness of the assumptions and data in support of both the preparation of the Part I Unified Rate Review Template and the rate development applicable to the products discussed in this filing, I relied on the expertise of other Aetna employees, along with work products produced at their direction, for the following items:
• Risk Adjustment Transfer • Actuarial Value, Modifications, and Benefit Relativities • Supplemental EHB Pricing • Population Risk Morbidity • Medical Cost and Utilization Trend • Rx Cost and Utilization Trend • Components of Retention/Administrative Fees • Value of Network Arrangements • Experience Period Data – Small Group
Certification While this memorandum discusses both our development of rates for these products and the completion of the Part I Unified Rate Review Template (URRT), the Part I URRT does not demonstrate the process used by Aetna to develop the rates. Rather, it represents information required by Federal regulation to be provided in support of the review of rate increases, for certification of qualified health plans for Federally-facilitated marketplaces, and for certification that the index rate is developed in accordance with Federal regulation, is used consistently, and is only adjusted by the allowable modifiers. The information provided above is intended to comply with these requirements. I, zzzzzzzzzz am a Fellow of the Society of Actuaries, a member of the American Academy of Actuaries, and am qualified in the area of health insurance. I hereby certify that to the best of my knowledge and judgment:
1. This rate filing is in compliance with the applicable laws and regulations of Pennsylvania, the requirements under federal law and regulation, and all applicable Actuarial Standards of Practice, including but not limited to:
a. ASOP No. 5, Incurred Health and Disability Claims b. ASOP No. 8, Regulatory Filings for Health Benefits, Accident and Health Insurance, and
Entities Providing Health c. ASOP No. 12, Risk Classification d. ASOP No. 23, Data Quality e. ASOP No. 25, Credibility Procedures Applicable to Accident and Health, Group Term
Life, and Property/Casualty Coverages f. ASOP No. 26, Compliance with Statutory and Regulatory Requirements for the Actuarial
Certification of Small Employer Health Benefit Plans g. ASOP No. 41, Actuarial Communications h. ASOP No. 50, Determining Minimum Value and Actuarial Value under the Affordable
Care Act
2. The Projected Index Rate is:
11
a. In compliance with all applicable State and Federal Statutes and Regulations (45 CFR156.80(d)(1) and 147.102),
b. Developed in compliance with the applicable Actuarial Standards of Practice,c. Reasonable in relation to the benefits provided and the population anticipated to be
covered,d. Neither excessive, deficient, nor unfairly discriminatory.
3. The Index Rate and only the allowable modifiers as described in 45 CFR 156.80(d)(1) and 45CFR 156.80(d)(2) were used to generate plan-level rates.
4. The percent of total premium that represents essential health benefits included in Worksheet 2,Sections III and IV were calculated in accordance with actuarial standards of practice.
5. The geographic rating factors reflect only differences in the costs of delivery (which include unitcosts and provider practice pattern differences) and do not include differences for populationmorbidity by geographic area.
6. The AV Calculator was used to determine the AV Metal Values shown in Worksheet 2 of the PartI Unified Rate Review Template for all plans. Adjustments made to reflect benefit features nothandled by the AV Calculator are discussed in the attached certification required by 45 CFR Part156, §156.135.
__________________________________ August 8, 2017 ___________________
Aetna Health Assurance of PA – Small Group Plans Rate request filing ID # AETN-131033573 - This document is prepared by the insurance company submitting the rate filing as a consumer tool to help explain the rate filing. It is not intended to describe or include all factors or information considered in the review process. For more information, see the filing at http://www.insurance.pa.gov/Consumers/ACARelatedFilings/
Overview Initial requested average rate change: +1.8% Revised requested average rate change: -1.7% Range of requested rate change: -20.4% to +30.5% Effective date: January 1, 2018 People impacted: 9,989 Available in: Rating Areas 1-3 and 5-9, certain counties excluded Key information Jan. 2016-Dec. 2016 financial experience1
Premiums $54M Claims $45M Administrative expenses $6M Taxes & fees $4M Company made (after taxes) -$1M The company expects its annual medical costs to increase 4%.
Explanation of requested rate change Medical costs are going up, and we are changing our rates to reflect this increase. Medical costs go up for two reasons – providers raise their prices and members get more medical care. Rate increases differ by plan. The exact rate change depends on what benefit plan the group chooses, where the group is located, when the group’s contract renews, and the ages and family sizes of enrolling employees. Rates charged to employees also depend upon any change in the amount of premium paid by the employer.
1 Note that due to data limitations, the experience for ALIC and AHASPA was combined for the reporting of this document.
How it plans to spend your premium This is how the insurance company plans to spend the premium it collects in 2018:
A B C D E F G H I J K L M N O P Q R S T U V W X YAc Unified Rate Review v4.2
Company Legal Name: Aetna HealthAssurance Pennsy State: PAHIOS Issuer ID: 18939 Market: Small GroupEffective Date of Rate Change(s):
Market Level Calculations (Same for all Plans)
Section I: Experience period dataExperience Period: 01/01/2016 to 12/31/2016
Experience Period Aggregate Amount PMPM % of Prem
Premiums (net of MLR Rebate) in Experience Period: $54,215,349 $439.90 100.00%Incurred Claims in Experience Period $45,230,915 367.00 83.43%Allowed Claims: $55,081,888 446.93 101.60%Index Rate of Experience Period $446.93Experience Period Member Months 123,245
Section II: Allowed Claims, PMPM basisExperience Period Projection Period: 01/00/1900 to 12/30/1900 Mid-point to Mid-point, Experience to Projection: -1393 months
on Actual Experience AllowedAdj't. from Experience to
Projection Period Projections, before credibility Adjustment Credibility Manual
Benefit CategoryUtilization
DescriptionUtilization per
1,000Average
Cost/Service PMPMPop'l risk Morbidity Other Cost Util
After Credibility Projected Period TotalsSection III: Projected Experience: Projected Allowed Claims PMPM (w/applied credibility if applicable) 0.00% 100.00% $490.32 $9,795,620
Paid to Allowed Average Factor in Projection Period 0.845Projected Incurred Claims, before ACA rein & Risk Adj't, PMPM $414.50 $8,280,831Projected Risk Adjustments PMPM -28.82 (575,793) Projected Incurred Claims, before reinsurance recoveries, net of rein prem, PMPM $443.32 $8,856,623Projected ACA reinsurance recoveries, net of rein prem, PMPM 0.00 0
% increase over Experience Period 22.03%% Increase, annualized: -0.17%
Projected Member Months 19,978
Information Not Releasable to the Public Unless Authorized by Law: This information has not been publically disclosed and may be privileged and confidential. It is for internal government use only and must not be disseminated, distributed, or copied to persons not authorized to receive the information. Unauthorized disclosure may result in prosecution to the full extent of the law.
Annualized Trend Factors
Product-Plan Data Collection
Company Legal Name: Aetna HealthAssurance Pennsylvania, Inc. State: PAHIOS Issuer ID: 18939 Market: Small GroupEffective Date of Rate Change(s):
PA Rate Template Part IData Relevant to the Rate Filing
Table 0. Identifying Information
Carrier Name: Aetna HealthAssurance of PAProduct(s): PPOMarket Segment: Small GroupRate Effective Date: 01/01/2018 to 12/31/2018Base Period Start Date 01/01/2016 to 12/31/2016Date of Most Recent Membership 02/01/2017
Table 1. Number of Members
Member-months Members Member-months
Experience PeriodCurrent Period
(as of 02-01-2017)Projected Rating Period
Average Age 35.51 34.55 34.55
Total 46,405 9,989 19,978 <18 8,389 2,234 4,419 18-24 4,041 974 1,861 25-29 4,035 832 1,712 30-34 4,049 831 1,716 35-39 3,870 796 1,596 40-44 2,735 625 1,220 45-49 5,857 1,028 2,095 50-54 4,761 894 1,776 55-59 4,649 876 1,778 60-63 2,925 581 1,184 64+ 1,094 318 621 *Tables 1, 2 and 4 must include data for all non-grandfathered business (ACA compliant and Transitional)
Total Prescription Drug Rebates* Total EHB Capitation Total Non-EHB Capitation Estimated Risk Adjustment Estimated Reinsurance Recoveries
$ 21,292,659.43 $ 16,704,308.29 $ 17,493,128.49 46,405 $ 4,996,436.66 $ 18,038,716.91 $ - $ (545,588.42) $ 5,380.25 $ - (3,217,032.75)$ -$ Experience Period Total Allowed EHB Claims + EHB Capitation PMPM (net of prescription drug rebates) 377.08$ Loss Ratio 93.79%*Express Prescription Drug Rebates as a negative number
Allowed Claims (Non-Capitated) Non-EHB portion of Allowed Claims
Total Prescription Drug Rebates* Total EHB Capitation Total Non-EHB Capitation Estimated Risk Adjustment Estimated Reinsurance Recoveries
$ 211,393,426.03 $ 178,799,354.59 $ 182,773,808.60 493,126 $ 31,980,622.07 $ 214,754,430.67 $ - $ (6,773,791.94) $ 2,385,291.00 $ - (4,298,601.77)$ -$ Experience Period Total Allowed EHB Claims + EHB Capitation PMPM (net of prescription drug rebates) 426.60$ Loss Ratio 86.14%*Express Prescription Drug Rebates as a negative number
Service CategoryInpatient HospitalOutpatient HospitalProfessionalOther Medical
$ 211,393,426.03 $ 31,854,433.08
Prescription DrugsTotal Annual Trend
Total Applied Trend Projection Factor
$ 115,666,123.20 $ 20,280,140.09
$ 251,775,467.96 $ 45,630,534.42
Months of Trend
PA Rate Template Part IIRate Development and ChangeCarrier Name: Aetna HealthAssurance of PAProduct(s): PPO
Market Segment: Small Group
Rate Effective Date: 01/01/2018
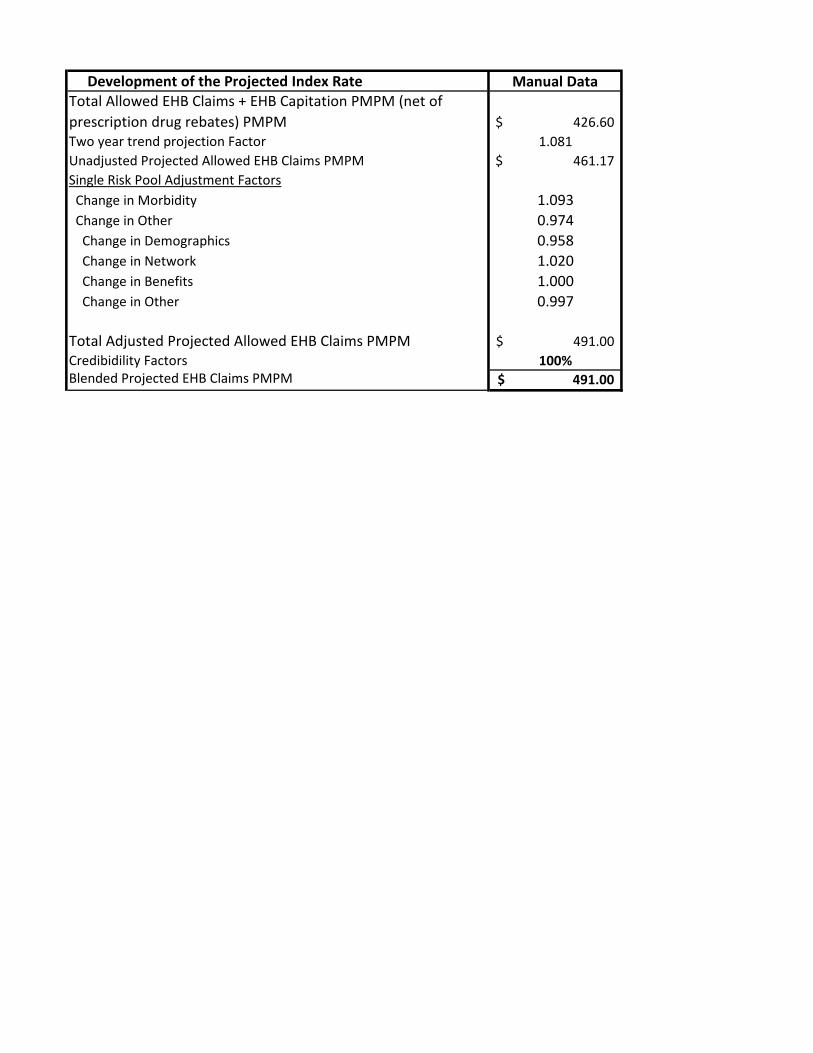
Table 5. Development of the Projected Index Rate, Market-Adjusted Index Rate, and Total Allowed Claims
Development of the Projected Index Rate Actual Experience Data
Manual Data
Total Allowed EHB Claims + EHB Capitation PMPM (net of prescription drug rebates) PMPM 377.08$ 426.60$ <- Actual Experience PMPM should be consistent with the Index Rate for Experience Period on URRT
Two year trend projection Factor 0.981 1.079
Unadjusted Projected Allowed EHB Claims PMPM 369.82$ 460.43$ For Informational Purposes only - No input required.Single Risk Pool Adjustment Factors
Change in Morbidity 1.194 1.093 <- See URRT Instructions Blended Base Period Unadjusted Claims before Normalization 426.60$ <- Index Rate of Experience Period on URRT Change in Other 0.983 0.974 Blended Earned Premium 211,393,426.03$ Change in Demographics 0.977 0.958 <- See URRT Instructions Blended Loss Ratio 86.14% Change in Network 1.009 1.020 <- See URRT Instructions
Change in Benefits 1.000 1.000 <- See URRT Instructions
Change in Other 0.997 0.997 <- See URRT Instructions
Total Adjusted Projected Allowed EHB Claims PMPM 433.86$ 490.32$
Credibidility Factors 0% 100% <- See InstructionsBlended Projected EHB Claims PMPM 490.32$ <- Projected Index Rate Development of the Market-Adjusted Index Rate and Total Allowed Claims
Adjusted Projected Allowed EHB Claims PMPM 490.32$ <- Index Rate for Projection Period on URRT - Individual or First Quarter Small Group Table 5A. Small Group Projected Index Rate with Quarterly TrendAdjusted Projected Allowed EHB Claims PMPM [will only populate for small group filings] 512.34$ <- Index Rate for Projection Period on URRT - Small Group Projected Paid to Allowed Ratio 0.845 <- Paid to Allowed Average Factor in Projection Period on URRT Effective Date 01/01/2018 04/01/2018 07/01/2018 10/01/2018 Total Single Risk PoolProjected Paid EHB Claims PMPM 433.11$ # of Member Months Renewing in Quarter 104,802 143,796 127,367 117,161 493,126 Market-wide Adjustments Adjusted Projected Allowed EHB Claims PMPM Q1 490.32$ 490.32$ 490.32$ 490.32$ 490.32$ Projected Risk Adjustment PMPM ($30.12) Months of Trend - 3 6 9 Projected Paid Exchange User Fees PMPM $0.00 Annual Trend 12.11% 12.11% 12.11% 12.11%
H. Sum of Components of Rate Change (should approximate the change shown in line A) 668.82$ 659.88$ (8.95)$ -2%
PA Rate Template Part IIITable 10. Plan Rates
Age Calibration Factor 1.430Carrier Name: Aetna HealthAssurance of PA Geographic Calibration Factor 0.921Product(s): PPO Aggregate Calibration Factor 1.317Market Segment: Small GroupRate Effective Date: 01/01/2018Base Period Start Date 01/01/2016Date of Most Recent Membership 02/01/2017Market Adjusted Index Rate 547.96$
Company Name: Aetna HealthAssurance of PAMarket: Small GroupProduct: PPOEffective Date of Rates: Ending date of Rates: 31-Mar-18
HIOS Plan ID (On Exchange)=>HIOS Plan ID (Off Exchange)=> 18939PA0010025 18939PA0010025 18939PA0010025 18939PA0010025 18939PA0010025 18939PA0010025 18939PA0010025 18939PA0010025 18939PA0010025
Company Name: Aetna HealthAssurance of PAMarket: Small GroupProduct: PPOEffective Date of Rates: Ending date of Rates:
HIOS Plan ID (On Exchange)=>HIOS Plan ID (Off Exchange)=> 18939PA0010025 18939PA0010025 18939PA0010025 18939PA0010025 18939PA0010025 18939PA0010025 18939PA0010025 18939PA0010025 18939PA0010025
\\winp-sfs-003\winasmma\External_RO\PAWVDE\PA\SG\2018\ACA\201801\Objections\Public PDF 9-20-2017\AHASPA\AHASPA 4Q18 Rate Table.xlsx
Company Name Aetna HealthAssurance of PAMarket Small GroupRATES FOR AGE 21, NON-TOBACCO USER, BY RATING AREA AND COUNTY
RATING AREA 1 RATING AREA 2 RATING AREA 3 RATING AREA 4 RATING AREA 5 RATING AREA 6 RATING AREA 7 RATING AREA 8 RATING AREA 9
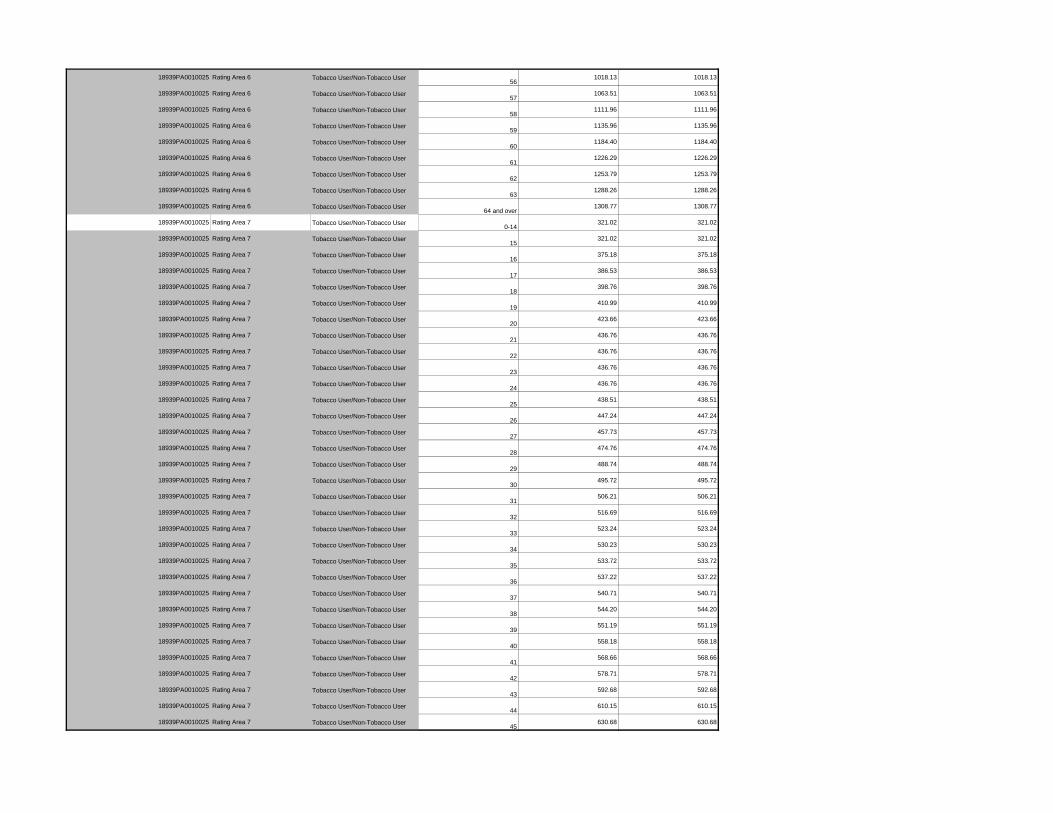
HIOS Plan ID Plan Marketing Name Product Metal On/Off Exchange Crawford Clarion Erie Forest Mckean Mercer Venango Warren Elk Cameron Potter Bradford Carbon Clinton Lackawanna Luzerne Lycoming Monroe Pike Sullivan Susquehanna Tioga Wayne Wyoming Allegheny Armstrong Beaver Butler Fayette Greene Indiana Lawrence Washington Westmoreland Bedford Blair Clearfield Cambria Huntingdon Jefferson Somerset Centre Columbia Lehigh Mifflin Montour Northampton Northumberland Schuylkill Snyder Union Adams Berks Lancaster York Bucks Chester Delaware Montogomery Philadelphia Cumberland Dauphin Franklin Fulton Juniata Lebanon Perry18939PA0010025 PA Silver PPO 5000 80/50 PPO Silver Off 348.51 348.51 348.51 348.51 351.53 351.53 351.53 443.15 443.15 443.15 443.15 443.15 443.15 443.15 443.15 443.15 443.15 443.15 443.15 443.15 346.28 346.28 346.28 346.28 346.28 436.4 436.4 436.4 436.4 436.4 436.4 436.4 436.4 436.4 436.4 436.76 436.76 436.76 436.76 443.95 443.95 443.95 443.95 443.95 414.31 414.31 414.31 414.31 414.31 414.31 414.31
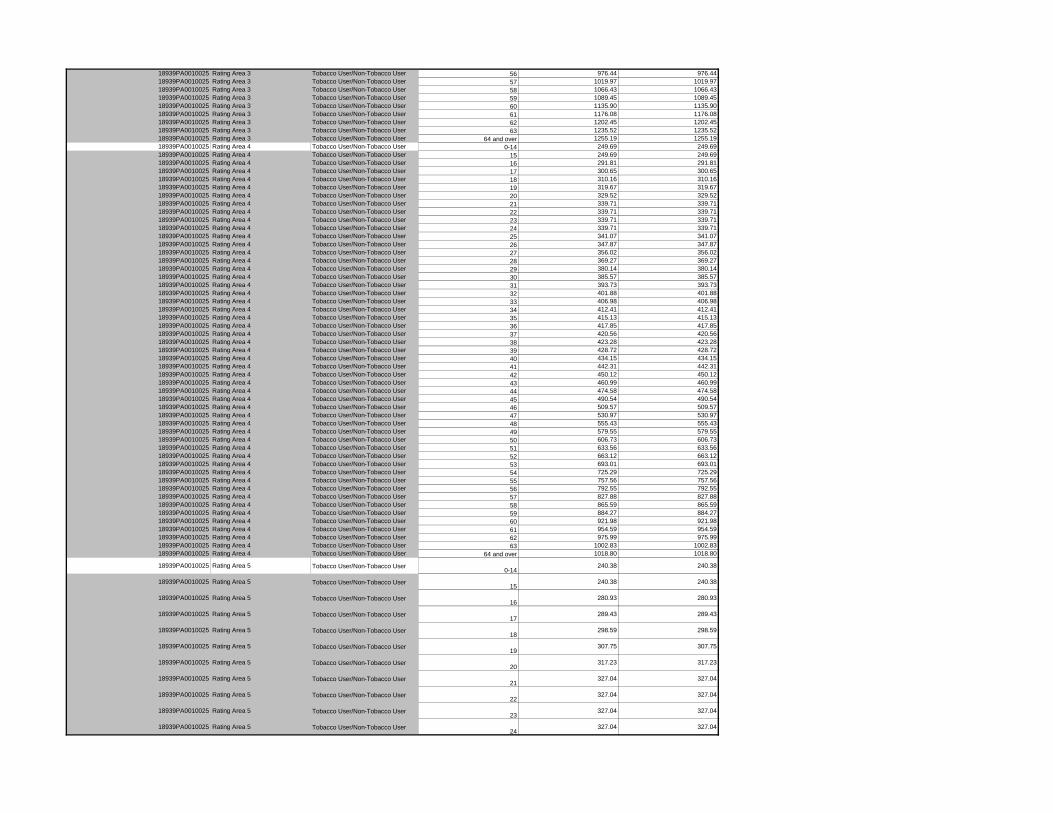
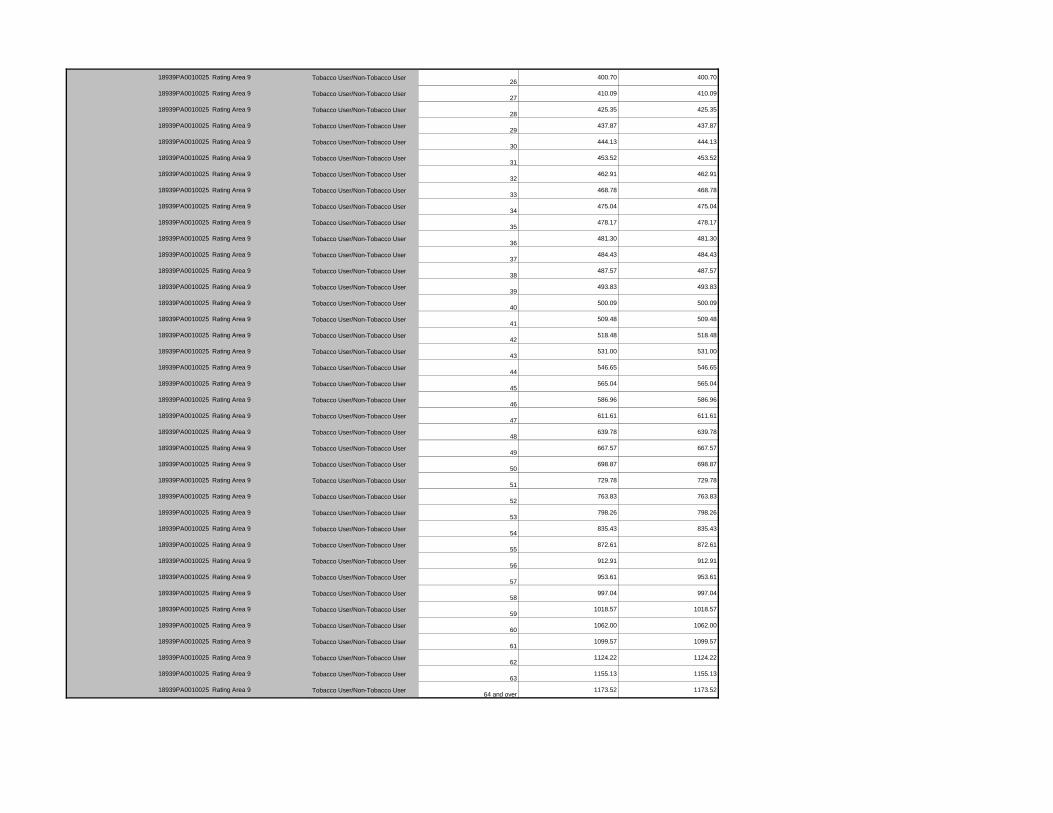
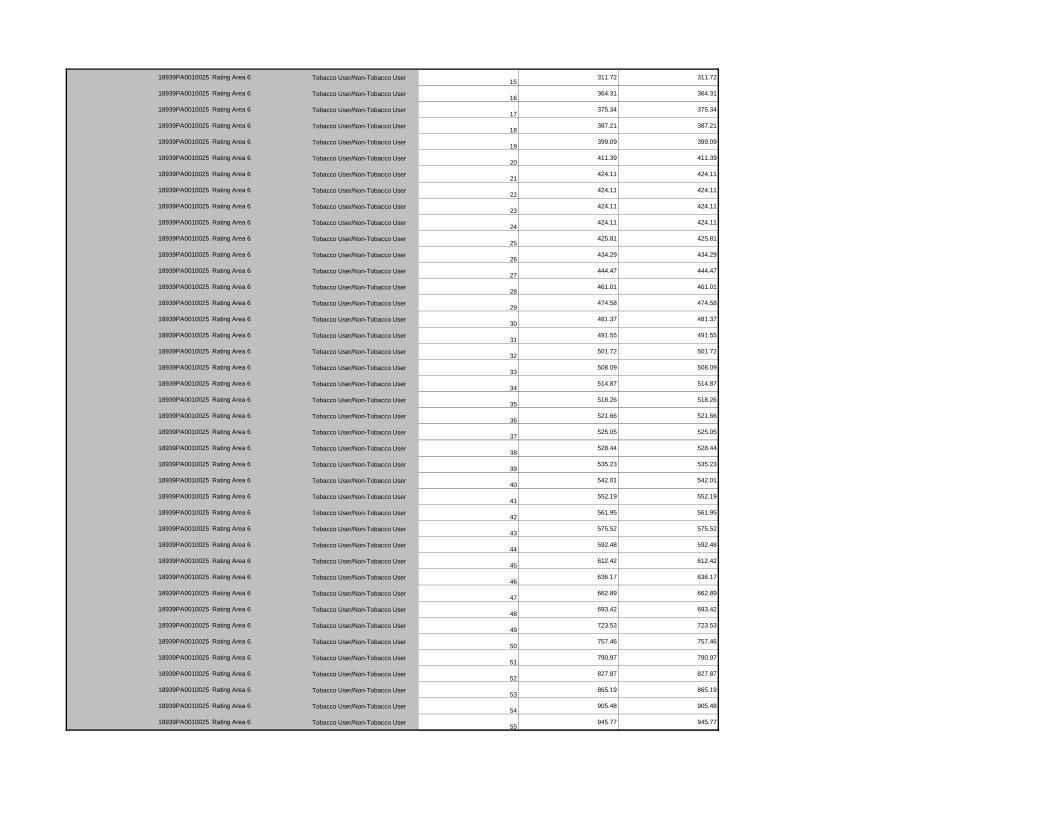
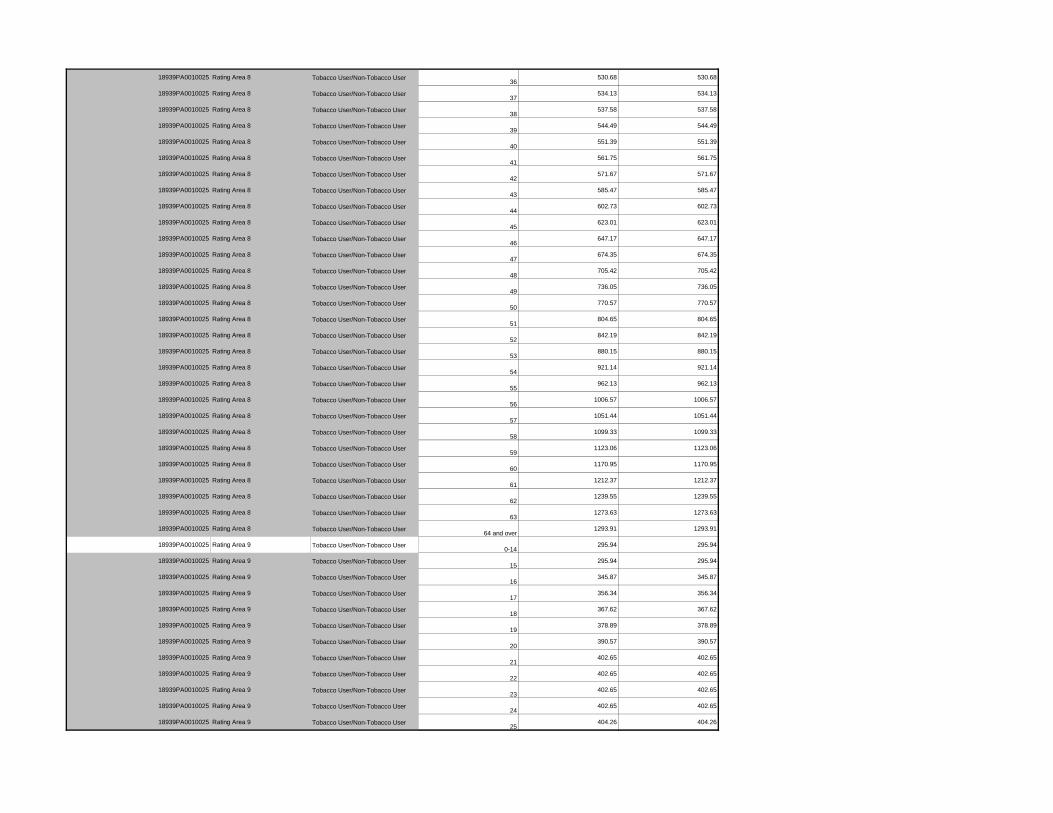
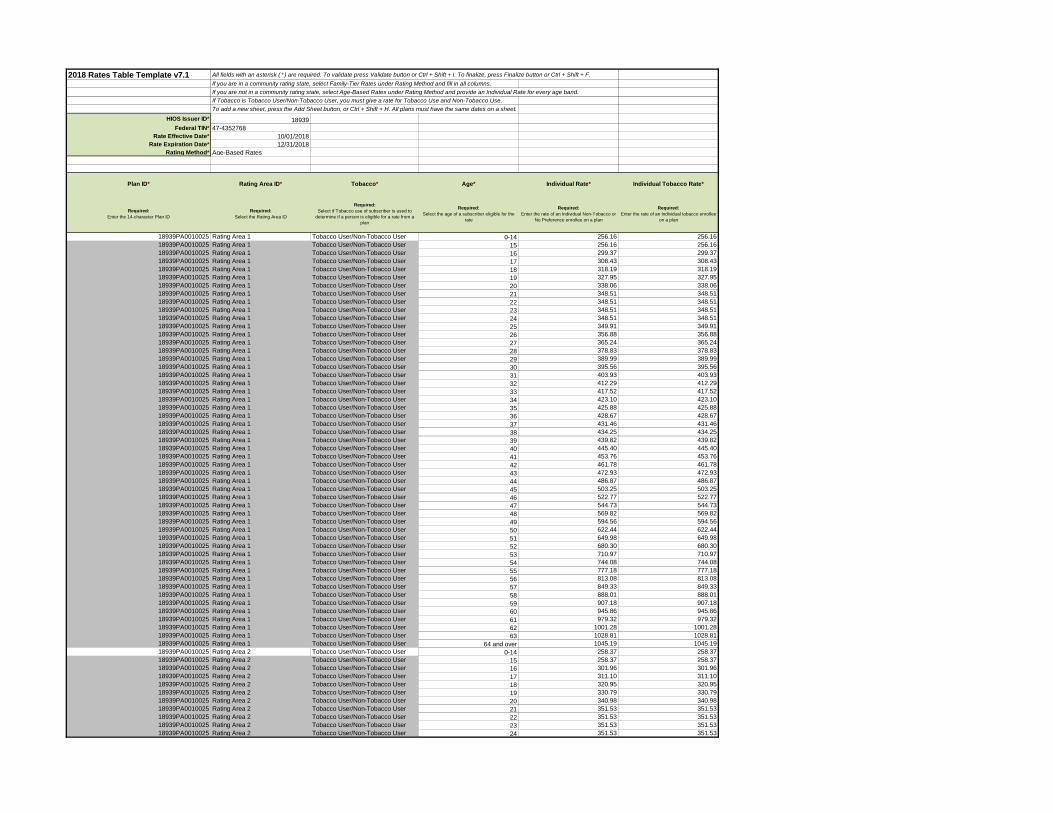
2018 Rates Table Template v7.1 All fields with an asterisk ( * ) are required. To validate press Validate button or Ctrl + Shift + I. To finalize, press Finalize button or Ctrl + Shift + F.
If macros are disabled, press and hold the ALT key and press t If you are in a community rating state, select Family-Tier Rates under Rating Method and fill in all columns.If you are not in a community rating state, select Age-Based Rates under Rating Method and provide an Individual Rate for every age band.If Tobacco is Tobacco User/Non-Tobacco User, you must give a rate for Tobacco Use and Non-Tobacco Use.To add a new sheet, press the Add Sheet button, or Ctrl + Shift + H. All plans must have the same dates on a sheet.
Plan ID* Rating Area ID* Tobacco* Age* Individual Rate* Individual Tobacco Rate*
Required:Enter the 14-character Plan ID
Required:Select the Rating Area ID
Required:Select if Tobacco use of subscriber is used to
determine if a person is eligible for a rate from a plan
Required:Select the age of a subscriber eligible for the
rate
Required:Enter the rate of an Individual Non-Tobacco or
No Preference enrollee on a plan
Required:Enter the rate of an Individual tobacco enrollee
on a plan
18939PA0010025 Rating Area 1 Tobacco User/Non-Tobacco User 0-14 235.12 235.1218939PA0010025 Rating Area 1 Tobacco User/Non-Tobacco User 15 235.12 235.1218939PA0010025 Rating Area 1 Tobacco User/Non-Tobacco User 16 274.78 274.7818939PA0010025 Rating Area 1 Tobacco User/Non-Tobacco User 17 283.10 283.1018939PA0010025 Rating Area 1 Tobacco User/Non-Tobacco User 18 292.06 292.0618939PA0010025 Rating Area 1 Tobacco User/Non-Tobacco User 19 301.01 301.0118939PA0010025 Rating Area 1 Tobacco User/Non-Tobacco User 20 310.29 310.2918939PA0010025 Rating Area 1 Tobacco User/Non-Tobacco User 21 319.89 319.8918939PA0010025 Rating Area 1 Tobacco User/Non-Tobacco User 22 319.89 319.8918939PA0010025 Rating Area 1 Tobacco User/Non-Tobacco User 23 319.89 319.8918939PA0010025 Rating Area 1 Tobacco User/Non-Tobacco User 24 319.89 319.8918939PA0010025 Rating Area 1 Tobacco User/Non-Tobacco User 25 321.17 321.1718939PA0010025 Rating Area 1 Tobacco User/Non-Tobacco User 26 327.56 327.5618939PA0010025 Rating Area 1 Tobacco User/Non-Tobacco User 27 335.24 335.2418939PA0010025 Rating Area 1 Tobacco User/Non-Tobacco User 28 347.72 347.7218939PA0010025 Rating Area 1 Tobacco User/Non-Tobacco User 29 357.95 357.9518939PA0010025 Rating Area 1 Tobacco User/Non-Tobacco User 30 363.07 363.0718939PA0010025 Rating Area 1 Tobacco User/Non-Tobacco User 31 370.75 370.7518939PA0010025 Rating Area 1 Tobacco User/Non-Tobacco User 32 378.43 378.4318939PA0010025 Rating Area 1 Tobacco User/Non-Tobacco User 33 383.22 383.2218939PA0010025 Rating Area 1 Tobacco User/Non-Tobacco User 34 388.34 388.3418939PA0010025 Rating Area 1 Tobacco User/Non-Tobacco User 35 390.90 390.9018939PA0010025 Rating Area 1 Tobacco User/Non-Tobacco User 36 393.46 393.4618939PA0010025 Rating Area 1 Tobacco User/Non-Tobacco User 37 396.02 396.0218939PA0010025 Rating Area 1 Tobacco User/Non-Tobacco User 38 398.58 398.5818939PA0010025 Rating Area 1 Tobacco User/Non-Tobacco User 39 403.70 403.7018939PA0010025 Rating Area 1 Tobacco User/Non-Tobacco User 40 408.81 408.8118939PA0010025 Rating Area 1 Tobacco User/Non-Tobacco User 41 416.49 416.4918939PA0010025 Rating Area 1 Tobacco User/Non-Tobacco User 42 423.85 423.8518939PA0010025 Rating Area 1 Tobacco User/Non-Tobacco User 43 434.09 434.0918939PA0010025 Rating Area 1 Tobacco User/Non-Tobacco User 44 446.88 446.8818939PA0010025 Rating Area 1 Tobacco User/Non-Tobacco User 45 461.92 461.9218939PA0010025 Rating Area 1 Tobacco User/Non-Tobacco User 46 479.83 479.8318939PA0010025 Rating Area 1 Tobacco User/Non-Tobacco User 47 499.98 499.9818939PA0010025 Rating Area 1 Tobacco User/Non-Tobacco User 48 523.01 523.0118939PA0010025 Rating Area 1 Tobacco User/Non-Tobacco User 49 545.73 545.7318939PA0010025 Rating Area 1 Tobacco User/Non-Tobacco User 50 571.32 571.3218939PA0010025 Rating Area 1 Tobacco User/Non-Tobacco User 51 596.59 596.5918939PA0010025 Rating Area 1 Tobacco User/Non-Tobacco User 52 624.42 624.4218939PA0010025 Rating Area 1 Tobacco User/Non-Tobacco User 53 652.57 652.5718939PA0010025 Rating Area 1 Tobacco User/Non-Tobacco User 54 682.96 682.9618939PA0010025 Rating Area 1 Tobacco User/Non-Tobacco User 55 713.35 713.3518939PA0010025 Rating Area 1 Tobacco User/Non-Tobacco User 56 746.29 746.2918939PA0010025 Rating Area 1 Tobacco User/Non-Tobacco User 57 779.56 779.5618939PA0010025 Rating Area 1 Tobacco User/Non-Tobacco User 58 815.07 815.0718939PA0010025 Rating Area 1 Tobacco User/Non-Tobacco User 59 832.66 832.6618939PA0010025 Rating Area 1 Tobacco User/Non-Tobacco User 60 868.17 868.1718939PA0010025 Rating Area 1 Tobacco User/Non-Tobacco User 61 898.88 898.8818939PA0010025 Rating Area 1 Tobacco User/Non-Tobacco User 62 919.03 919.0318939PA0010025 Rating Area 1 Tobacco User/Non-Tobacco User 63 944.30 944.3018939PA0010025 Rating Area 1 Tobacco User/Non-Tobacco User 64 and over 959.34 959.3418939PA0010025 Rating Area 2 Tobacco User/Non-Tobacco User 0-14 237.15 237.1518939PA0010025 Rating Area 2 Tobacco User/Non-Tobacco User 15 237.15 237.1518939PA0010025 Rating Area 2 Tobacco User/Non-Tobacco User 16 277.16 277.1618939PA0010025 Rating Area 2 Tobacco User/Non-Tobacco User 17 285.55 285.5518939PA0010025 Rating Area 2 Tobacco User/Non-Tobacco User 18 294.58 294.5818939PA0010025 Rating Area 2 Tobacco User/Non-Tobacco User 19 303.62 303.6218939PA0010025 Rating Area 2 Tobacco User/Non-Tobacco User 20 312.97 312.9718939PA0010025 Rating Area 2 Tobacco User/Non-Tobacco User 21 322.65 322.6518939PA0010025 Rating Area 2 Tobacco User/Non-Tobacco User 22 322.65 322.6518939PA0010025 Rating Area 2 Tobacco User/Non-Tobacco User 23 322.65 322.6518939PA0010025 Rating Area 2 Tobacco User/Non-Tobacco User 24 322.65 322.65
18939PA0010025 Rating Area 2 Tobacco User/Non-Tobacco User 25 323.94 323.9418939PA0010025 Rating Area 2 Tobacco User/Non-Tobacco User 26 330.40 330.4018939PA0010025 Rating Area 2 Tobacco User/Non-Tobacco User 27 338.14 338.1418939PA0010025 Rating Area 2 Tobacco User/Non-Tobacco User 28 350.73 350.7318939PA0010025 Rating Area 2 Tobacco User/Non-Tobacco User 29 361.05 361.0518939PA0010025 Rating Area 2 Tobacco User/Non-Tobacco User 30 366.21 366.2118939PA0010025 Rating Area 2 Tobacco User/Non-Tobacco User 31 373.96 373.9618939PA0010025 Rating Area 2 Tobacco User/Non-Tobacco User 32 381.70 381.7018939PA0010025 Rating Area 2 Tobacco User/Non-Tobacco User 33 386.54 386.5418939PA0010025 Rating Area 2 Tobacco User/Non-Tobacco User 34 391.70 391.7018939PA0010025 Rating Area 2 Tobacco User/Non-Tobacco User 35 394.28 394.2818939PA0010025 Rating Area 2 Tobacco User/Non-Tobacco User 36 396.86 396.8618939PA0010025 Rating Area 2 Tobacco User/Non-Tobacco User 37 399.45 399.4518939PA0010025 Rating Area 2 Tobacco User/Non-Tobacco User 38 402.03 402.0318939PA0010025 Rating Area 2 Tobacco User/Non-Tobacco User 39 407.19 407.1918939PA0010025 Rating Area 2 Tobacco User/Non-Tobacco User 40 412.35 412.3518939PA0010025 Rating Area 2 Tobacco User/Non-Tobacco User 41 420.10 420.1018939PA0010025 Rating Area 2 Tobacco User/Non-Tobacco User 42 427.52 427.5218939PA0010025 Rating Area 2 Tobacco User/Non-Tobacco User 43 437.84 437.8418939PA0010025 Rating Area 2 Tobacco User/Non-Tobacco User 44 450.75 450.7518939PA0010025 Rating Area 2 Tobacco User/Non-Tobacco User 45 465.91 465.9118939PA0010025 Rating Area 2 Tobacco User/Non-Tobacco User 46 483.98 483.9818939PA0010025 Rating Area 2 Tobacco User/Non-Tobacco User 47 504.31 504.3118939PA0010025 Rating Area 2 Tobacco User/Non-Tobacco User 48 527.54 527.5418939PA0010025 Rating Area 2 Tobacco User/Non-Tobacco User 49 550.45 550.4518939PA0010025 Rating Area 2 Tobacco User/Non-Tobacco User 50 576.26 576.2618939PA0010025 Rating Area 2 Tobacco User/Non-Tobacco User 51 601.75 601.7518939PA0010025 Rating Area 2 Tobacco User/Non-Tobacco User 52 629.82 629.8218939PA0010025 Rating Area 2 Tobacco User/Non-Tobacco User 53 658.21 658.2118939PA0010025 Rating Area 2 Tobacco User/Non-Tobacco User 54 688.87 688.8718939PA0010025 Rating Area 2 Tobacco User/Non-Tobacco User 55 719.52 719.5218939PA0010025 Rating Area 2 Tobacco User/Non-Tobacco User 56 752.75 752.7518939PA0010025 Rating Area 2 Tobacco User/Non-Tobacco User 57 786.31 786.3118939PA0010025 Rating Area 2 Tobacco User/Non-Tobacco User 58 822.12 822.1218939PA0010025 Rating Area 2 Tobacco User/Non-Tobacco User 59 839.87 839.8718939PA0010025 Rating Area 2 Tobacco User/Non-Tobacco User 60 875.68 875.6818939PA0010025 Rating Area 2 Tobacco User/Non-Tobacco User 61 906.66 906.6618939PA0010025 Rating Area 2 Tobacco User/Non-Tobacco User 62 926.99 926.9918939PA0010025 Rating Area 2 Tobacco User/Non-Tobacco User 63 952.48 952.4818939PA0010025 Rating Area 2 Tobacco User/Non-Tobacco User 64 and over 967.64 967.6418939PA0010025 Rating Area 3 Tobacco User/Non-Tobacco User 0-14 298.96 298.9618939PA0010025 Rating Area 3 Tobacco User/Non-Tobacco User 15 298.96 298.9618939PA0010025 Rating Area 3 Tobacco User/Non-Tobacco User 16 349.40 349.4018939PA0010025 Rating Area 3 Tobacco User/Non-Tobacco User 17 359.97 359.9718939PA0010025 Rating Area 3 Tobacco User/Non-Tobacco User 18 371.36 371.3618939PA0010025 Rating Area 3 Tobacco User/Non-Tobacco User 19 382.75 382.7518939PA0010025 Rating Area 3 Tobacco User/Non-Tobacco User 20 394.54 394.5418939PA0010025 Rating Area 3 Tobacco User/Non-Tobacco User 21 406.75 406.7518939PA0010025 Rating Area 3 Tobacco User/Non-Tobacco User 22 406.75 406.7518939PA0010025 Rating Area 3 Tobacco User/Non-Tobacco User 23 406.75 406.7518939PA0010025 Rating Area 3 Tobacco User/Non-Tobacco User 24 406.75 406.7518939PA0010025 Rating Area 3 Tobacco User/Non-Tobacco User 25 408.37 408.3718939PA0010025 Rating Area 3 Tobacco User/Non-Tobacco User 26 416.51 416.5118939PA0010025 Rating Area 3 Tobacco User/Non-Tobacco User 27 426.27 426.2718939PA0010025 Rating Area 3 Tobacco User/Non-Tobacco User 28 442.13 442.1318939PA0010025 Rating Area 3 Tobacco User/Non-Tobacco User 29 455.15 455.1518939PA0010025 Rating Area 3 Tobacco User/Non-Tobacco User 30 461.66 461.6618939PA0010025 Rating Area 3 Tobacco User/Non-Tobacco User 31 471.42 471.4218939PA0010025 Rating Area 3 Tobacco User/Non-Tobacco User 32 481.18 481.1818939PA0010025 Rating Area 3 Tobacco User/Non-Tobacco User 33 487.28 487.2818939PA0010025 Rating Area 3 Tobacco User/Non-Tobacco User 34 493.79 493.7918939PA0010025 Rating Area 3 Tobacco User/Non-Tobacco User 35 497.04 497.0418939PA0010025 Rating Area 3 Tobacco User/Non-Tobacco User 36 500.30 500.3018939PA0010025 Rating Area 3 Tobacco User/Non-Tobacco User 37 503.55 503.5518939PA0010025 Rating Area 3 Tobacco User/Non-Tobacco User 38 506.81 506.8118939PA0010025 Rating Area 3 Tobacco User/Non-Tobacco User 39 513.31 513.3118939PA0010025 Rating Area 3 Tobacco User/Non-Tobacco User 40 519.82 519.8218939PA0010025 Rating Area 3 Tobacco User/Non-Tobacco User 41 529.58 529.5818939PA0010025 Rating Area 3 Tobacco User/Non-Tobacco User 42 538.94 538.9418939PA0010025 Rating Area 3 Tobacco User/Non-Tobacco User 43 551.96 551.9618939PA0010025 Rating Area 3 Tobacco User/Non-Tobacco User 44 568.23 568.2318939PA0010025 Rating Area 3 Tobacco User/Non-Tobacco User 45 587.34 587.3418939PA0010025 Rating Area 3 Tobacco User/Non-Tobacco User 46 610.12 610.1218939PA0010025 Rating Area 3 Tobacco User/Non-Tobacco User 47 635.75 635.7518939PA0010025 Rating Area 3 Tobacco User/Non-Tobacco User 48 665.03 665.0318939PA0010025 Rating Area 3 Tobacco User/Non-Tobacco User 49 693.91 693.9118939PA0010025 Rating Area 3 Tobacco User/Non-Tobacco User 50 726.45 726.4518939PA0010025 Rating Area 3 Tobacco User/Non-Tobacco User 51 758.58 758.5818939PA0010025 Rating Area 3 Tobacco User/Non-Tobacco User 52 793.97 793.9718939PA0010025 Rating Area 3 Tobacco User/Non-Tobacco User 53 829.76 829.7618939PA0010025 Rating Area 3 Tobacco User/Non-Tobacco User 54 868.40 868.4018939PA0010025 Rating Area 3 Tobacco User/Non-Tobacco User 55 907.05 907.05
18939PA0010025 Rating Area 3 Tobacco User/Non-Tobacco User 56 948.94 948.9418939PA0010025 Rating Area 3 Tobacco User/Non-Tobacco User 57 991.24 991.2418939PA0010025 Rating Area 3 Tobacco User/Non-Tobacco User 58 1036.39 1036.3918939PA0010025 Rating Area 3 Tobacco User/Non-Tobacco User 59 1058.76 1058.7618939PA0010025 Rating Area 3 Tobacco User/Non-Tobacco User 60 1103.91 1103.9118939PA0010025 Rating Area 3 Tobacco User/Non-Tobacco User 61 1142.96 1142.9618939PA0010025 Rating Area 3 Tobacco User/Non-Tobacco User 62 1168.58 1168.5818939PA0010025 Rating Area 3 Tobacco User/Non-Tobacco User 63 1200.72 1200.7218939PA0010025 Rating Area 3 Tobacco User/Non-Tobacco User 64 and over 1219.83 1219.8318939PA0010025 Rating Area 4 Tobacco User/Non-Tobacco User 0-14 242.66 242.6618939PA0010025 Rating Area 4 Tobacco User/Non-Tobacco User 15 242.66 242.6618939PA0010025 Rating Area 4 Tobacco User/Non-Tobacco User 16 283.59 283.5918939PA0010025 Rating Area 4 Tobacco User/Non-Tobacco User 17 292.18 292.1818939PA0010025 Rating Area 4 Tobacco User/Non-Tobacco User 18 301.42 301.4218939PA0010025 Rating Area 4 Tobacco User/Non-Tobacco User 19 310.67 310.6718939PA0010025 Rating Area 4 Tobacco User/Non-Tobacco User 20 320.24 320.2418939PA0010025 Rating Area 4 Tobacco User/Non-Tobacco User 21 330.14 330.1418939PA0010025 Rating Area 4 Tobacco User/Non-Tobacco User 22 330.14 330.1418939PA0010025 Rating Area 4 Tobacco User/Non-Tobacco User 23 330.14 330.1418939PA0010025 Rating Area 4 Tobacco User/Non-Tobacco User 24 330.14 330.1418939PA0010025 Rating Area 4 Tobacco User/Non-Tobacco User 25 331.46 331.4618939PA0010025 Rating Area 4 Tobacco User/Non-Tobacco User 26 338.07 338.0718939PA0010025 Rating Area 4 Tobacco User/Non-Tobacco User 27 345.99 345.9918939PA0010025 Rating Area 4 Tobacco User/Non-Tobacco User 28 358.87 358.8718939PA0010025 Rating Area 4 Tobacco User/Non-Tobacco User 29 369.43 369.4318939PA0010025 Rating Area 4 Tobacco User/Non-Tobacco User 30 374.71 374.7118939PA0010025 Rating Area 4 Tobacco User/Non-Tobacco User 31 382.64 382.6418939PA0010025 Rating Area 4 Tobacco User/Non-Tobacco User 32 390.56 390.5618939PA0010025 Rating Area 4 Tobacco User/Non-Tobacco User 33 395.51 395.5118939PA0010025 Rating Area 4 Tobacco User/Non-Tobacco User 34 400.79 400.7918939PA0010025 Rating Area 4 Tobacco User/Non-Tobacco User 35 403.44 403.4418939PA0010025 Rating Area 4 Tobacco User/Non-Tobacco User 36 406.08 406.0818939PA0010025 Rating Area 4 Tobacco User/Non-Tobacco User 37 408.72 408.7218939PA0010025 Rating Area 4 Tobacco User/Non-Tobacco User 38 411.36 411.3618939PA0010025 Rating Area 4 Tobacco User/Non-Tobacco User 39 416.64 416.6418939PA0010025 Rating Area 4 Tobacco User/Non-Tobacco User 40 421.92 421.9218939PA0010025 Rating Area 4 Tobacco User/Non-Tobacco User 41 429.85 429.8518939PA0010025 Rating Area 4 Tobacco User/Non-Tobacco User 42 437.44 437.4418939PA0010025 Rating Area 4 Tobacco User/Non-Tobacco User 43 448.01 448.0118939PA0010025 Rating Area 4 Tobacco User/Non-Tobacco User 44 461.21 461.2118939PA0010025 Rating Area 4 Tobacco User/Non-Tobacco User 45 476.73 476.7318939PA0010025 Rating Area 4 Tobacco User/Non-Tobacco User 46 495.22 495.2218939PA0010025 Rating Area 4 Tobacco User/Non-Tobacco User 47 516.01 516.0118939PA0010025 Rating Area 4 Tobacco User/Non-Tobacco User 48 539.79 539.7918939PA0010025 Rating Area 4 Tobacco User/Non-Tobacco User 49 563.23 563.2318939PA0010025 Rating Area 4 Tobacco User/Non-Tobacco User 50 589.64 589.6418939PA0010025 Rating Area 4 Tobacco User/Non-Tobacco User 51 615.72 615.7218939PA0010025 Rating Area 4 Tobacco User/Non-Tobacco User 52 644.44 644.4418939PA0010025 Rating Area 4 Tobacco User/Non-Tobacco User 53 673.49 673.4918939PA0010025 Rating Area 4 Tobacco User/Non-Tobacco User 54 704.86 704.8618939PA0010025 Rating Area 4 Tobacco User/Non-Tobacco User 55 736.22 736.2218939PA0010025 Rating Area 4 Tobacco User/Non-Tobacco User 56 770.23 770.2318939PA0010025 Rating Area 4 Tobacco User/Non-Tobacco User 57 804.56 804.5618939PA0010025 Rating Area 4 Tobacco User/Non-Tobacco User 58 841.21 841.2118939PA0010025 Rating Area 4 Tobacco User/Non-Tobacco User 59 859.36 859.3618939PA0010025 Rating Area 4 Tobacco User/Non-Tobacco User 60 896.01 896.0118939PA0010025 Rating Area 4 Tobacco User/Non-Tobacco User 61 927.70 927.7018939PA0010025 Rating Area 4 Tobacco User/Non-Tobacco User 62 948.50 948.5018939PA0010025 Rating Area 4 Tobacco User/Non-Tobacco User 63 974.58 974.5818939PA0010025 Rating Area 4 Tobacco User/Non-Tobacco User 64 and over 990.10 990.10
18939PA0010025 Rating Area 5 Tobacco User/Non-Tobacco User 0-14233.61 233.61
18939PA0010025 Rating Area 5 Tobacco User/Non-Tobacco User 15233.61 233.61
18939PA0010025 Rating Area 5 Tobacco User/Non-Tobacco User 16273.02 273.02
18939PA0010025 Rating Area 5 Tobacco User/Non-Tobacco User 17281.28 281.28
18939PA0010025 Rating Area 5 Tobacco User/Non-Tobacco User 18290.18 290.18
18939PA0010025 Rating Area 5 Tobacco User/Non-Tobacco User 19299.08 299.08
18939PA0010025 Rating Area 5 Tobacco User/Non-Tobacco User 20308.30 308.30
18939PA0010025 Rating Area 5 Tobacco User/Non-Tobacco User 21317.83 317.83
18939PA0010025 Rating Area 5 Tobacco User/Non-Tobacco User 22317.83 317.83
18939PA0010025 Rating Area 5 Tobacco User/Non-Tobacco User 23317.83 317.83
18939PA0010025 Rating Area 5 Tobacco User/Non-Tobacco User 24317.83 317.83
18939PA0010025 Rating Area 5 Tobacco User/Non-Tobacco User 25319.10 319.10
18939PA0010025 Rating Area 5 Tobacco User/Non-Tobacco User 26325.46 325.46
18939PA0010025 Rating Area 5 Tobacco User/Non-Tobacco User 27333.09 333.09
18939PA0010025 Rating Area 5 Tobacco User/Non-Tobacco User 28345.48 345.48
18939PA0010025 Rating Area 5 Tobacco User/Non-Tobacco User 29355.66 355.66
18939PA0010025 Rating Area 5 Tobacco User/Non-Tobacco User 30360.74 360.74
18939PA0010025 Rating Area 5 Tobacco User/Non-Tobacco User 31368.37 368.37
18939PA0010025 Rating Area 5 Tobacco User/Non-Tobacco User 32376.00 376.00
18939PA0010025 Rating Area 5 Tobacco User/Non-Tobacco User 33380.76 380.76
18939PA0010025 Rating Area 5 Tobacco User/Non-Tobacco User 34385.85 385.85
18939PA0010025 Rating Area 5 Tobacco User/Non-Tobacco User 35388.39 388.39
18939PA0010025 Rating Area 5 Tobacco User/Non-Tobacco User 36390.94 390.94
18939PA0010025 Rating Area 5 Tobacco User/Non-Tobacco User 37393.48 393.48
18939PA0010025 Rating Area 5 Tobacco User/Non-Tobacco User 38396.02 396.02
18939PA0010025 Rating Area 5 Tobacco User/Non-Tobacco User 39401.11 401.11
18939PA0010025 Rating Area 5 Tobacco User/Non-Tobacco User 40406.19 406.19
18939PA0010025 Rating Area 5 Tobacco User/Non-Tobacco User 41413.82 413.82
18939PA0010025 Rating Area 5 Tobacco User/Non-Tobacco User 42421.13 421.13
18939PA0010025 Rating Area 5 Tobacco User/Non-Tobacco User 43431.30 431.30
18939PA0010025 Rating Area 5 Tobacco User/Non-Tobacco User 44444.01 444.01
18939PA0010025 Rating Area 5 Tobacco User/Non-Tobacco User 45458.95 458.95
18939PA0010025 Rating Area 5 Tobacco User/Non-Tobacco User 46476.75 476.75
18939PA0010025 Rating Area 5 Tobacco User/Non-Tobacco User 47496.77 496.77
18939PA0010025 Rating Area 5 Tobacco User/Non-Tobacco User 48519.66 519.66
18939PA0010025 Rating Area 5 Tobacco User/Non-Tobacco User 49542.22 542.22
18939PA0010025 Rating Area 5 Tobacco User/Non-Tobacco User 50567.65 567.65
18939PA0010025 Rating Area 5 Tobacco User/Non-Tobacco User 51592.76 592.76
18939PA0010025 Rating Area 5 Tobacco User/Non-Tobacco User 52620.41 620.41
18939PA0010025 Rating Area 5 Tobacco User/Non-Tobacco User 53648.38 648.38
18939PA0010025 Rating Area 5 Tobacco User/Non-Tobacco User 54678.57 678.57
18939PA0010025 Rating Area 5 Tobacco User/Non-Tobacco User 55708.77 708.77
18939PA0010025 Rating Area 5 Tobacco User/Non-Tobacco User 56741.51 741.51
18939PA0010025 Rating Area 5 Tobacco User/Non-Tobacco User 57774.56 774.56
18939PA0010025 Rating Area 5 Tobacco User/Non-Tobacco User 58809.84 809.84
18939PA0010025 Rating Area 5 Tobacco User/Non-Tobacco User 59827.32 827.32
18939PA0010025 Rating Area 5 Tobacco User/Non-Tobacco User 60862.60 862.60
18939PA0010025 Rating Area 5 Tobacco User/Non-Tobacco User 61893.11 893.11
18939PA0010025 Rating Area 5 Tobacco User/Non-Tobacco User 62913.14 913.14
18939PA0010025 Rating Area 5 Tobacco User/Non-Tobacco User 63938.24 938.24
18939PA0010025 Rating Area 5 Tobacco User/Non-Tobacco User 64 and over953.18 953.18
18939PA0010025 Rating Area 6 Tobacco User/Non-Tobacco User 0-14294.41 294.41
18939PA0010025 Rating Area 6 Tobacco User/Non-Tobacco User 15294.41 294.41
18939PA0010025 Rating Area 6 Tobacco User/Non-Tobacco User 16344.08 344.08
18939PA0010025 Rating Area 6 Tobacco User/Non-Tobacco User 17354.49 354.49
18939PA0010025 Rating Area 6 Tobacco User/Non-Tobacco User 18365.71 365.71
18939PA0010025 Rating Area 6 Tobacco User/Non-Tobacco User 19376.92 376.92
18939PA0010025 Rating Area 6 Tobacco User/Non-Tobacco User 20388.54 388.54
18939PA0010025 Rating Area 6 Tobacco User/Non-Tobacco User 21400.56 400.56
18939PA0010025 Rating Area 6 Tobacco User/Non-Tobacco User 22400.56 400.56
18939PA0010025 Rating Area 6 Tobacco User/Non-Tobacco User 23400.56 400.56
18939PA0010025 Rating Area 6 Tobacco User/Non-Tobacco User 24400.56 400.56
18939PA0010025 Rating Area 6 Tobacco User/Non-Tobacco User 25402.16 402.16
18939PA0010025 Rating Area 6 Tobacco User/Non-Tobacco User 26410.17 410.17
18939PA0010025 Rating Area 6 Tobacco User/Non-Tobacco User 27419.78 419.78
18939PA0010025 Rating Area 6 Tobacco User/Non-Tobacco User 28435.41 435.41
18939PA0010025 Rating Area 6 Tobacco User/Non-Tobacco User 29448.22 448.22
18939PA0010025 Rating Area 6 Tobacco User/Non-Tobacco User 30454.63 454.63
18939PA0010025 Rating Area 6 Tobacco User/Non-Tobacco User 31464.25 464.25
18939PA0010025 Rating Area 6 Tobacco User/Non-Tobacco User 32473.86 473.86
18939PA0010025 Rating Area 6 Tobacco User/Non-Tobacco User 33479.87 479.87
18939PA0010025 Rating Area 6 Tobacco User/Non-Tobacco User 34486.28 486.28
18939PA0010025 Rating Area 6 Tobacco User/Non-Tobacco User 35489.48 489.48
18939PA0010025 Rating Area 6 Tobacco User/Non-Tobacco User 36492.69 492.69
18939PA0010025 Rating Area 6 Tobacco User/Non-Tobacco User 37495.89 495.89
18939PA0010025 Rating Area 6 Tobacco User/Non-Tobacco User 38499.09 499.09
18939PA0010025 Rating Area 6 Tobacco User/Non-Tobacco User 39505.50 505.50
18939PA0010025 Rating Area 6 Tobacco User/Non-Tobacco User 40511.91 511.91
18939PA0010025 Rating Area 6 Tobacco User/Non-Tobacco User 41521.53 521.53
18939PA0010025 Rating Area 6 Tobacco User/Non-Tobacco User 42530.74 530.74
18939PA0010025 Rating Area 6 Tobacco User/Non-Tobacco User 43543.56 543.56
18939PA0010025 Rating Area 6 Tobacco User/Non-Tobacco User 44559.58 559.58
18939PA0010025 Rating Area 6 Tobacco User/Non-Tobacco User 45578.40 578.40
18939PA0010025 Rating Area 6 Tobacco User/Non-Tobacco User 46600.84 600.84
18939PA0010025 Rating Area 6 Tobacco User/Non-Tobacco User 47626.07 626.07
18939PA0010025 Rating Area 6 Tobacco User/Non-Tobacco User 48654.91 654.91
18939PA0010025 Rating Area 6 Tobacco User/Non-Tobacco User 49683.35 683.35
18939PA0010025 Rating Area 6 Tobacco User/Non-Tobacco User 50715.39 715.39
18939PA0010025 Rating Area 6 Tobacco User/Non-Tobacco User 51747.04 747.04
18939PA0010025 Rating Area 6 Tobacco User/Non-Tobacco User 52781.89 781.89
18939PA0010025 Rating Area 6 Tobacco User/Non-Tobacco User 53817.14 817.14
18939PA0010025 Rating Area 6 Tobacco User/Non-Tobacco User 54855.19 855.19
18939PA0010025 Rating Area 6 Tobacco User/Non-Tobacco User 55893.24 893.24
18939PA0010025 Rating Area 6 Tobacco User/Non-Tobacco User 56934.50 934.50
18939PA0010025 Rating Area 6 Tobacco User/Non-Tobacco User 57976.16 976.16
18939PA0010025 Rating Area 6 Tobacco User/Non-Tobacco User 581020.62 1020.62
18939PA0010025 Rating Area 6 Tobacco User/Non-Tobacco User 591042.65 1042.65
18939PA0010025 Rating Area 6 Tobacco User/Non-Tobacco User 601087.11 1087.11
18939PA0010025 Rating Area 6 Tobacco User/Non-Tobacco User 611125.57 1125.57
18939PA0010025 Rating Area 6 Tobacco User/Non-Tobacco User 621150.80 1150.80
18939PA0010025 Rating Area 6 Tobacco User/Non-Tobacco User 631182.44 1182.44
18939PA0010025 Rating Area 6 Tobacco User/Non-Tobacco User 64 and over1201.27 1201.27
18939PA0010025 Rating Area 7 Tobacco User/Non-Tobacco User 0-14294.65 294.65
18939PA0010025 Rating Area 7 Tobacco User/Non-Tobacco User 15294.65 294.65
18939PA0010025 Rating Area 7 Tobacco User/Non-Tobacco User 16344.36 344.36
18939PA0010025 Rating Area 7 Tobacco User/Non-Tobacco User 17354.78 354.78
18939PA0010025 Rating Area 7 Tobacco User/Non-Tobacco User 18366.01 366.01
18939PA0010025 Rating Area 7 Tobacco User/Non-Tobacco User 19377.23 377.23
18939PA0010025 Rating Area 7 Tobacco User/Non-Tobacco User 20388.86 388.86
18939PA0010025 Rating Area 7 Tobacco User/Non-Tobacco User 21400.89 400.89
18939PA0010025 Rating Area 7 Tobacco User/Non-Tobacco User 22400.89 400.89
18939PA0010025 Rating Area 7 Tobacco User/Non-Tobacco User 23400.89 400.89
18939PA0010025 Rating Area 7 Tobacco User/Non-Tobacco User 24400.89 400.89
18939PA0010025 Rating Area 7 Tobacco User/Non-Tobacco User 25402.49 402.49
18939PA0010025 Rating Area 7 Tobacco User/Non-Tobacco User 26410.51 410.51
18939PA0010025 Rating Area 7 Tobacco User/Non-Tobacco User 27420.13 420.13
18939PA0010025 Rating Area 7 Tobacco User/Non-Tobacco User 28435.76 435.76
18939PA0010025 Rating Area 7 Tobacco User/Non-Tobacco User 29448.59 448.59
18939PA0010025 Rating Area 7 Tobacco User/Non-Tobacco User 30455.00 455.00
18939PA0010025 Rating Area 7 Tobacco User/Non-Tobacco User 31464.63 464.63
18939PA0010025 Rating Area 7 Tobacco User/Non-Tobacco User 32474.25 474.25
18939PA0010025 Rating Area 7 Tobacco User/Non-Tobacco User 33480.26 480.26
18939PA0010025 Rating Area 7 Tobacco User/Non-Tobacco User 34486.67 486.67
18939PA0010025 Rating Area 7 Tobacco User/Non-Tobacco User 35489.88 489.88
18939PA0010025 Rating Area 7 Tobacco User/Non-Tobacco User 36493.09 493.09
18939PA0010025 Rating Area 7 Tobacco User/Non-Tobacco User 37496.30 496.30
18939PA0010025 Rating Area 7 Tobacco User/Non-Tobacco User 38499.50 499.50
18939PA0010025 Rating Area 7 Tobacco User/Non-Tobacco User 39505.92 505.92
18939PA0010025 Rating Area 7 Tobacco User/Non-Tobacco User 40512.33 512.33
18939PA0010025 Rating Area 7 Tobacco User/Non-Tobacco User 41521.95 521.95
18939PA0010025 Rating Area 7 Tobacco User/Non-Tobacco User 42531.17 531.17
18939PA0010025 Rating Area 7 Tobacco User/Non-Tobacco User 43544.00 544.00
18939PA0010025 Rating Area 7 Tobacco User/Non-Tobacco User 44560.04 560.04
18939PA0010025 Rating Area 7 Tobacco User/Non-Tobacco User 45578.88 578.88
18939PA0010025 Rating Area 7 Tobacco User/Non-Tobacco User 46601.33 601.33
18939PA0010025 Rating Area 7 Tobacco User/Non-Tobacco User 47626.58 626.58
18939PA0010025 Rating Area 7 Tobacco User/Non-Tobacco User 48655.45 655.45
18939PA0010025 Rating Area 7 Tobacco User/Non-Tobacco User 49683.91 683.91
18939PA0010025 Rating Area 7 Tobacco User/Non-Tobacco User 50715.98 715.98
18939PA0010025 Rating Area 7 Tobacco User/Non-Tobacco User 51747.65 747.65
18939PA0010025 Rating Area 7 Tobacco User/Non-Tobacco User 52782.53 782.53
18939PA0010025 Rating Area 7 Tobacco User/Non-Tobacco User 53817.81 817.81
18939PA0010025 Rating Area 7 Tobacco User/Non-Tobacco User 54855.89 855.89
18939PA0010025 Rating Area 7 Tobacco User/Non-Tobacco User 55893.97 893.97
18939PA0010025 Rating Area 7 Tobacco User/Non-Tobacco User 56935.26 935.26
18939PA0010025 Rating Area 7 Tobacco User/Non-Tobacco User 57976.96 976.96
18939PA0010025 Rating Area 7 Tobacco User/Non-Tobacco User 581021.46 1021.46
18939PA0010025 Rating Area 7 Tobacco User/Non-Tobacco User 591043.50 1043.50
18939PA0010025 Rating Area 7 Tobacco User/Non-Tobacco User 601088.00 1088.00
18939PA0010025 Rating Area 7 Tobacco User/Non-Tobacco User 611126.49 1126.49
18939PA0010025 Rating Area 7 Tobacco User/Non-Tobacco User 621151.74 1151.74
18939PA0010025 Rating Area 7 Tobacco User/Non-Tobacco User 631183.41 1183.41
18939PA0010025 Rating Area 7 Tobacco User/Non-Tobacco User 64 and over1202.25 1202.25
18939PA0010025 Rating Area 8 Tobacco User/Non-Tobacco User 0-14299.50 299.50
18939PA0010025 Rating Area 8 Tobacco User/Non-Tobacco User 15299.50 299.50
18939PA0010025 Rating Area 8 Tobacco User/Non-Tobacco User 16350.03 350.03
18939PA0010025 Rating Area 8 Tobacco User/Non-Tobacco User 17360.63 360.63
18939PA0010025 Rating Area 8 Tobacco User/Non-Tobacco User 18372.03 372.03
18939PA0010025 Rating Area 8 Tobacco User/Non-Tobacco User 19383.44 383.44
18939PA0010025 Rating Area 8 Tobacco User/Non-Tobacco User 20395.26 395.26
18939PA0010025 Rating Area 8 Tobacco User/Non-Tobacco User 21407.49 407.49
18939PA0010025 Rating Area 8 Tobacco User/Non-Tobacco User 22407.49 407.49
18939PA0010025 Rating Area 8 Tobacco User/Non-Tobacco User 23407.49 407.49
18939PA0010025 Rating Area 8 Tobacco User/Non-Tobacco User 24407.49 407.49
18939PA0010025 Rating Area 8 Tobacco User/Non-Tobacco User 25409.12 409.12
18939PA0010025 Rating Area 8 Tobacco User/Non-Tobacco User 26417.27 417.27
18939PA0010025 Rating Area 8 Tobacco User/Non-Tobacco User 27427.05 427.05
18939PA0010025 Rating Area 8 Tobacco User/Non-Tobacco User 28442.94 442.94
18939PA0010025 Rating Area 8 Tobacco User/Non-Tobacco User 29455.98 455.98
18939PA0010025 Rating Area 8 Tobacco User/Non-Tobacco User 30462.50 462.50
18939PA0010025 Rating Area 8 Tobacco User/Non-Tobacco User 31472.28 472.28
18939PA0010025 Rating Area 8 Tobacco User/Non-Tobacco User 32482.06 482.06
18939PA0010025 Rating Area 8 Tobacco User/Non-Tobacco User 33488.17 488.17
18939PA0010025 Rating Area 8 Tobacco User/Non-Tobacco User 34494.69 494.69
18939PA0010025 Rating Area 8 Tobacco User/Non-Tobacco User 35497.95 497.95
18939PA0010025 Rating Area 8 Tobacco User/Non-Tobacco User 36501.21 501.21
18939PA0010025 Rating Area 8 Tobacco User/Non-Tobacco User 37504.47 504.47
18939PA0010025 Rating Area 8 Tobacco User/Non-Tobacco User 38507.73 507.73
18939PA0010025 Rating Area 8 Tobacco User/Non-Tobacco User 39514.25 514.25
18939PA0010025 Rating Area 8 Tobacco User/Non-Tobacco User 40520.77 520.77
18939PA0010025 Rating Area 8 Tobacco User/Non-Tobacco User 41530.55 530.55
18939PA0010025 Rating Area 8 Tobacco User/Non-Tobacco User 42539.92 539.92
18939PA0010025 Rating Area 8 Tobacco User/Non-Tobacco User 43552.96 552.96
18939PA0010025 Rating Area 8 Tobacco User/Non-Tobacco User 44569.26 569.26
18939PA0010025 Rating Area 8 Tobacco User/Non-Tobacco User 45588.41 588.41
18939PA0010025 Rating Area 8 Tobacco User/Non-Tobacco User 46611.23 611.23
18939PA0010025 Rating Area 8 Tobacco User/Non-Tobacco User 47636.90 636.90
18939PA0010025 Rating Area 8 Tobacco User/Non-Tobacco User 48666.24 666.24
18939PA0010025 Rating Area 8 Tobacco User/Non-Tobacco User 49695.17 695.17
18939PA0010025 Rating Area 8 Tobacco User/Non-Tobacco User 50727.77 727.77
18939PA0010025 Rating Area 8 Tobacco User/Non-Tobacco User 51759.96 759.96
18939PA0010025 Rating Area 8 Tobacco User/Non-Tobacco User 52795.41 795.41
18939PA0010025 Rating Area 8 Tobacco User/Non-Tobacco User 53831.27 831.27
18939PA0010025 Rating Area 8 Tobacco User/Non-Tobacco User 54869.98 869.98
18939PA0010025 Rating Area 8 Tobacco User/Non-Tobacco User 55908.69 908.69
18939PA0010025 Rating Area 8 Tobacco User/Non-Tobacco User 56950.66 950.66
18939PA0010025 Rating Area 8 Tobacco User/Non-Tobacco User 57993.04 993.04
18939PA0010025 Rating Area 8 Tobacco User/Non-Tobacco User 581038.27 1038.27
18939PA0010025 Rating Area 8 Tobacco User/Non-Tobacco User 591060.69 1060.69
18939PA0010025 Rating Area 8 Tobacco User/Non-Tobacco User 601105.92 1105.92
18939PA0010025 Rating Area 8 Tobacco User/Non-Tobacco User 611145.04 1145.04
18939PA0010025 Rating Area 8 Tobacco User/Non-Tobacco User 621170.71 1170.71
18939PA0010025 Rating Area 8 Tobacco User/Non-Tobacco User 631202.90 1202.90
18939PA0010025 Rating Area 8 Tobacco User/Non-Tobacco User 64 and over1222.05 1222.05
18939PA0010025 Rating Area 9 Tobacco User/Non-Tobacco User 0-14279.51 279.51
18939PA0010025 Rating Area 9 Tobacco User/Non-Tobacco User 15279.51 279.51
18939PA0010025 Rating Area 9 Tobacco User/Non-Tobacco User 16326.66 326.66
18939PA0010025 Rating Area 9 Tobacco User/Non-Tobacco User 17336.55 336.55
18939PA0010025 Rating Area 9 Tobacco User/Non-Tobacco User 18347.20 347.20
18939PA0010025 Rating Area 9 Tobacco User/Non-Tobacco User 19357.85 357.85
18939PA0010025 Rating Area 9 Tobacco User/Non-Tobacco User 20368.87 368.87
18939PA0010025 Rating Area 9 Tobacco User/Non-Tobacco User 21380.28 380.28
18939PA0010025 Rating Area 9 Tobacco User/Non-Tobacco User 22380.28 380.28
18939PA0010025 Rating Area 9 Tobacco User/Non-Tobacco User 23380.28 380.28
18939PA0010025 Rating Area 9 Tobacco User/Non-Tobacco User 24380.28 380.28
18939PA0010025 Rating Area 9 Tobacco User/Non-Tobacco User 25381.80 381.80
18939PA0010025 Rating Area 9 Tobacco User/Non-Tobacco User 26389.41 389.41
18939PA0010025 Rating Area 9 Tobacco User/Non-Tobacco User 27398.54 398.54
18939PA0010025 Rating Area 9 Tobacco User/Non-Tobacco User 28413.37 413.37
18939PA0010025 Rating Area 9 Tobacco User/Non-Tobacco User 29425.54 425.54
18939PA0010025 Rating Area 9 Tobacco User/Non-Tobacco User 30431.62 431.62
18939PA0010025 Rating Area 9 Tobacco User/Non-Tobacco User 31440.75 440.75
18939PA0010025 Rating Area 9 Tobacco User/Non-Tobacco User 32449.87 449.87
18939PA0010025 Rating Area 9 Tobacco User/Non-Tobacco User 33455.58 455.58
18939PA0010025 Rating Area 9 Tobacco User/Non-Tobacco User 34461.66 461.66
18939PA0010025 Rating Area 9 Tobacco User/Non-Tobacco User 35464.71 464.71
18939PA0010025 Rating Area 9 Tobacco User/Non-Tobacco User 36467.75 467.75
18939PA0010025 Rating Area 9 Tobacco User/Non-Tobacco User 37470.79 470.79
18939PA0010025 Rating Area 9 Tobacco User/Non-Tobacco User 38473.83 473.83
18939PA0010025 Rating Area 9 Tobacco User/Non-Tobacco User 39479.92 479.92
18939PA0010025 Rating Area 9 Tobacco User/Non-Tobacco User 40486.00 486.00
18939PA0010025 Rating Area 9 Tobacco User/Non-Tobacco User 41495.13 495.13
18939PA0010025 Rating Area 9 Tobacco User/Non-Tobacco User 42503.88 503.88
18939PA0010025 Rating Area 9 Tobacco User/Non-Tobacco User 43516.04 516.04
18939PA0010025 Rating Area 9 Tobacco User/Non-Tobacco User 44531.26 531.26
18939PA0010025 Rating Area 9 Tobacco User/Non-Tobacco User 45549.13 549.13
18939PA0010025 Rating Area 9 Tobacco User/Non-Tobacco User 46570.42 570.42
18939PA0010025 Rating Area 9 Tobacco User/Non-Tobacco User 47594.38 594.38
18939PA0010025 Rating Area 9 Tobacco User/Non-Tobacco User 48621.76 621.76
18939PA0010025 Rating Area 9 Tobacco User/Non-Tobacco User 49648.76 648.76
18939PA0010025 Rating Area 9 Tobacco User/Non-Tobacco User 50679.19 679.19
18939PA0010025 Rating Area 9 Tobacco User/Non-Tobacco User 51709.23 709.23
18939PA0010025 Rating Area 9 Tobacco User/Non-Tobacco User 52742.31 742.31
18939PA0010025 Rating Area 9 Tobacco User/Non-Tobacco User 53775.78 775.78
18939PA0010025 Rating Area 9 Tobacco User/Non-Tobacco User 54811.90 811.90
18939PA0010025 Rating Area 9 Tobacco User/Non-Tobacco User 55848.03 848.03
18939PA0010025 Rating Area 9 Tobacco User/Non-Tobacco User 56887.20 887.20
18939PA0010025 Rating Area 9 Tobacco User/Non-Tobacco User 57926.75 926.75
18939PA0010025 Rating Area 9 Tobacco User/Non-Tobacco User 58968.96 968.96
18939PA0010025 Rating Area 9 Tobacco User/Non-Tobacco User 59989.88 989.88
18939PA0010025 Rating Area 9 Tobacco User/Non-Tobacco User 601032.09 1032.09
18939PA0010025 Rating Area 9 Tobacco User/Non-Tobacco User 611068.60 1068.60
18939PA0010025 Rating Area 9 Tobacco User/Non-Tobacco User 621092.55 1092.55
18939PA0010025 Rating Area 9 Tobacco User/Non-Tobacco User 631122.60 1122.60
18939PA0010025 Rating Area 9 Tobacco User/Non-Tobacco User 64 and over1140.47 1140.47
2018 Rates Table Template v7.1 All fields with an asterisk ( * ) are required. To validate press Validate button or Ctrl + Shift + I. To finalize, press Finalize button or Ctrl + Shift + F.
If macros are disabled, press and hold the ALT key and press t If you are in a community rating state, select Family-Tier Rates under Rating Method and fill in all columns.If you are not in a community rating state, select Age-Based Rates under Rating Method and provide an Individual Rate for every age band.If Tobacco is Tobacco User/Non-Tobacco User, you must give a rate for Tobacco Use and Non-Tobacco Use.To add a new sheet, press the Add Sheet button, or Ctrl + Shift + H. All plans must have the same dates on a sheet.
Plan ID* Rating Area ID* Tobacco* Age* Individual Rate* Individual Tobacco Rate*
Required:Enter the 14-character Plan ID
Required:Select the Rating Area ID
Required:Select if Tobacco use of subscriber is used to
determine if a person is eligible for a rate from a plan
Required:Select the age of a subscriber eligible for the
rate
Required:Enter the rate of an Individual Non-Tobacco or
No Preference enrollee on a plan
Required:Enter the rate of an Individual tobacco enrollee
on a plan
18939PA0010025 Rating Area 1 Tobacco User/Non-Tobacco User 0-14 241.93 241.9318939PA0010025 Rating Area 1 Tobacco User/Non-Tobacco User 15 241.93 241.9318939PA0010025 Rating Area 1 Tobacco User/Non-Tobacco User 16 282.75 282.7518939PA0010025 Rating Area 1 Tobacco User/Non-Tobacco User 17 291.30 291.3018939PA0010025 Rating Area 1 Tobacco User/Non-Tobacco User 18 300.52 300.5218939PA0010025 Rating Area 1 Tobacco User/Non-Tobacco User 19 309.74 309.7418939PA0010025 Rating Area 1 Tobacco User/Non-Tobacco User 20 319.28 319.2818939PA0010025 Rating Area 1 Tobacco User/Non-Tobacco User 21 329.16 329.1618939PA0010025 Rating Area 1 Tobacco User/Non-Tobacco User 22 329.16 329.1618939PA0010025 Rating Area 1 Tobacco User/Non-Tobacco User 23 329.16 329.1618939PA0010025 Rating Area 1 Tobacco User/Non-Tobacco User 24 329.16 329.1618939PA0010025 Rating Area 1 Tobacco User/Non-Tobacco User 25 330.47 330.4718939PA0010025 Rating Area 1 Tobacco User/Non-Tobacco User 26 337.06 337.0618939PA0010025 Rating Area 1 Tobacco User/Non-Tobacco User 27 344.96 344.9618939PA0010025 Rating Area 1 Tobacco User/Non-Tobacco User 28 357.79 357.7918939PA0010025 Rating Area 1 Tobacco User/Non-Tobacco User 29 368.33 368.3318939PA0010025 Rating Area 1 Tobacco User/Non-Tobacco User 30 373.59 373.5918939PA0010025 Rating Area 1 Tobacco User/Non-Tobacco User 31 381.49 381.4918939PA0010025 Rating Area 1 Tobacco User/Non-Tobacco User 32 389.39 389.3918939PA0010025 Rating Area 1 Tobacco User/Non-Tobacco User 33 394.33 394.3318939PA0010025 Rating Area 1 Tobacco User/Non-Tobacco User 34 399.60 399.6018939PA0010025 Rating Area 1 Tobacco User/Non-Tobacco User 35 402.23 402.2318939PA0010025 Rating Area 1 Tobacco User/Non-Tobacco User 36 404.86 404.8618939PA0010025 Rating Area 1 Tobacco User/Non-Tobacco User 37 407.50 407.5018939PA0010025 Rating Area 1 Tobacco User/Non-Tobacco User 38 410.13 410.1318939PA0010025 Rating Area 1 Tobacco User/Non-Tobacco User 39 415.40 415.4018939PA0010025 Rating Area 1 Tobacco User/Non-Tobacco User 40 420.66 420.6618939PA0010025 Rating Area 1 Tobacco User/Non-Tobacco User 41 428.56 428.5618939PA0010025 Rating Area 1 Tobacco User/Non-Tobacco User 42 436.13 436.1318939PA0010025 Rating Area 1 Tobacco User/Non-Tobacco User 43 446.67 446.6718939PA0010025 Rating Area 1 Tobacco User/Non-Tobacco User 44 459.83 459.8318939PA0010025 Rating Area 1 Tobacco User/Non-Tobacco User 45 475.30 475.3018939PA0010025 Rating Area 1 Tobacco User/Non-Tobacco User 46 493.74 493.7418939PA0010025 Rating Area 1 Tobacco User/Non-Tobacco User 47 514.47 514.4718939PA0010025 Rating Area 1 Tobacco User/Non-Tobacco User 48 538.17 538.1718939PA0010025 Rating Area 1 Tobacco User/Non-Tobacco User 49 561.54 561.5418939PA0010025 Rating Area 1 Tobacco User/Non-Tobacco User 50 587.87 587.8718939PA0010025 Rating Area 1 Tobacco User/Non-Tobacco User 51 613.88 613.8818939PA0010025 Rating Area 1 Tobacco User/Non-Tobacco User 52 642.51 642.5118939PA0010025 Rating Area 1 Tobacco User/Non-Tobacco User 53 671.48 671.4818939PA0010025 Rating Area 1 Tobacco User/Non-Tobacco User 54 702.75 702.7518939PA0010025 Rating Area 1 Tobacco User/Non-Tobacco User 55 734.02 734.0218939PA0010025 Rating Area 1 Tobacco User/Non-Tobacco User 56 767.92 767.9218939PA0010025 Rating Area 1 Tobacco User/Non-Tobacco User 57 802.16 802.1618939PA0010025 Rating Area 1 Tobacco User/Non-Tobacco User 58 838.69 838.6918939PA0010025 Rating Area 1 Tobacco User/Non-Tobacco User 59 856.80 856.8018939PA0010025 Rating Area 1 Tobacco User/Non-Tobacco User 60 893.33 893.3318939PA0010025 Rating Area 1 Tobacco User/Non-Tobacco User 61 924.93 924.9318939PA0010025 Rating Area 1 Tobacco User/Non-Tobacco User 62 945.67 945.6718939PA0010025 Rating Area 1 Tobacco User/Non-Tobacco User 63 971.67 971.6718939PA0010025 Rating Area 1 Tobacco User/Non-Tobacco User 64 and over 987.14 987.1418939PA0010025 Rating Area 2 Tobacco User/Non-Tobacco User 0-14 244.02 244.0218939PA0010025 Rating Area 2 Tobacco User/Non-Tobacco User 15 244.02 244.0218939PA0010025 Rating Area 2 Tobacco User/Non-Tobacco User 16 285.19 285.1918939PA0010025 Rating Area 2 Tobacco User/Non-Tobacco User 17 293.82 293.8218939PA0010025 Rating Area 2 Tobacco User/Non-Tobacco User 18 303.12 303.1218939PA0010025 Rating Area 2 Tobacco User/Non-Tobacco User 19 312.42 312.4218939PA0010025 Rating Area 2 Tobacco User/Non-Tobacco User 20 322.05 322.0518939PA0010025 Rating Area 2 Tobacco User/Non-Tobacco User 21 332.01 332.0118939PA0010025 Rating Area 2 Tobacco User/Non-Tobacco User 22 332.01 332.0118939PA0010025 Rating Area 2 Tobacco User/Non-Tobacco User 23 332.01 332.0118939PA0010025 Rating Area 2 Tobacco User/Non-Tobacco User 24 332.01 332.01
18939PA0010025 Rating Area 2 Tobacco User/Non-Tobacco User 25 333.33 333.3318939PA0010025 Rating Area 2 Tobacco User/Non-Tobacco User 26 339.97 339.9718939PA0010025 Rating Area 2 Tobacco User/Non-Tobacco User 27 347.94 347.9418939PA0010025 Rating Area 2 Tobacco User/Non-Tobacco User 28 360.89 360.8918939PA0010025 Rating Area 2 Tobacco User/Non-Tobacco User 29 371.51 371.5118939PA0010025 Rating Area 2 Tobacco User/Non-Tobacco User 30 376.83 376.8318939PA0010025 Rating Area 2 Tobacco User/Non-Tobacco User 31 384.79 384.7918939PA0010025 Rating Area 2 Tobacco User/Non-Tobacco User 32 392.76 392.7618939PA0010025 Rating Area 2 Tobacco User/Non-Tobacco User 33 397.74 397.7418939PA0010025 Rating Area 2 Tobacco User/Non-Tobacco User 34 403.05 403.0518939PA0010025 Rating Area 2 Tobacco User/Non-Tobacco User 35 405.71 405.7118939PA0010025 Rating Area 2 Tobacco User/Non-Tobacco User 36 408.37 408.3718939PA0010025 Rating Area 2 Tobacco User/Non-Tobacco User 37 411.02 411.0218939PA0010025 Rating Area 2 Tobacco User/Non-Tobacco User 38 413.68 413.6818939PA0010025 Rating Area 2 Tobacco User/Non-Tobacco User 39 418.99 418.9918939PA0010025 Rating Area 2 Tobacco User/Non-Tobacco User 40 424.30 424.3018939PA0010025 Rating Area 2 Tobacco User/Non-Tobacco User 41 432.27 432.2718939PA0010025 Rating Area 2 Tobacco User/Non-Tobacco User 42 439.91 439.9118939PA0010025 Rating Area 2 Tobacco User/Non-Tobacco User 43 450.53 450.5318939PA0010025 Rating Area 2 Tobacco User/Non-Tobacco User 44 463.81 463.8118939PA0010025 Rating Area 2 Tobacco User/Non-Tobacco User 45 479.42 479.4218939PA0010025 Rating Area 2 Tobacco User/Non-Tobacco User 46 498.01 498.0118939PA0010025 Rating Area 2 Tobacco User/Non-Tobacco User 47 518.92 518.9218939PA0010025 Rating Area 2 Tobacco User/Non-Tobacco User 48 542.83 542.8318939PA0010025 Rating Area 2 Tobacco User/Non-Tobacco User 49 566.40 566.4018939PA0010025 Rating Area 2 Tobacco User/Non-Tobacco User 50 592.96 592.9618939PA0010025 Rating Area 2 Tobacco User/Non-Tobacco User 51 619.19 619.1918939PA0010025 Rating Area 2 Tobacco User/Non-Tobacco User 52 648.07 648.0718939PA0010025 Rating Area 2 Tobacco User/Non-Tobacco User 53 677.29 677.2918939PA0010025 Rating Area 2 Tobacco User/Non-Tobacco User 54 708.83 708.8318939PA0010025 Rating Area 2 Tobacco User/Non-Tobacco User 55 740.37 740.3718939PA0010025 Rating Area 2 Tobacco User/Non-Tobacco User 56 774.57 774.5718939PA0010025 Rating Area 2 Tobacco User/Non-Tobacco User 57 809.10 809.1018939PA0010025 Rating Area 2 Tobacco User/Non-Tobacco User 58 845.95 845.9518939PA0010025 Rating Area 2 Tobacco User/Non-Tobacco User 59 864.21 864.2118939PA0010025 Rating Area 2 Tobacco User/Non-Tobacco User 60 901.06 901.0618939PA0010025 Rating Area 2 Tobacco User/Non-Tobacco User 61 932.94 932.9418939PA0010025 Rating Area 2 Tobacco User/Non-Tobacco User 62 953.85 953.8518939PA0010025 Rating Area 2 Tobacco User/Non-Tobacco User 63 980.08 980.0818939PA0010025 Rating Area 2 Tobacco User/Non-Tobacco User 64 and over 995.68 995.6818939PA0010025 Rating Area 3 Tobacco User/Non-Tobacco User 0-14 307.62 307.6218939PA0010025 Rating Area 3 Tobacco User/Non-Tobacco User 15 307.62 307.6218939PA0010025 Rating Area 3 Tobacco User/Non-Tobacco User 16 359.52 359.5218939PA0010025 Rating Area 3 Tobacco User/Non-Tobacco User 17 370.40 370.4018939PA0010025 Rating Area 3 Tobacco User/Non-Tobacco User 18 382.12 382.1218939PA0010025 Rating Area 3 Tobacco User/Non-Tobacco User 19 393.84 393.8418939PA0010025 Rating Area 3 Tobacco User/Non-Tobacco User 20 405.98 405.9818939PA0010025 Rating Area 3 Tobacco User/Non-Tobacco User 21 418.54 418.5418939PA0010025 Rating Area 3 Tobacco User/Non-Tobacco User 22 418.54 418.5418939PA0010025 Rating Area 3 Tobacco User/Non-Tobacco User 23 418.54 418.5418939PA0010025 Rating Area 3 Tobacco User/Non-Tobacco User 24 418.54 418.5418939PA0010025 Rating Area 3 Tobacco User/Non-Tobacco User 25 420.21 420.2118939PA0010025 Rating Area 3 Tobacco User/Non-Tobacco User 26 428.58 428.5818939PA0010025 Rating Area 3 Tobacco User/Non-Tobacco User 27 438.62 438.6218939PA0010025 Rating Area 3 Tobacco User/Non-Tobacco User 28 454.95 454.9518939PA0010025 Rating Area 3 Tobacco User/Non-Tobacco User 29 468.34 468.3418939PA0010025 Rating Area 3 Tobacco User/Non-Tobacco User 30 475.04 475.0418939PA0010025 Rating Area 3 Tobacco User/Non-Tobacco User 31 485.08 485.0818939PA0010025 Rating Area 3 Tobacco User/Non-Tobacco User 32 495.13 495.1318939PA0010025 Rating Area 3 Tobacco User/Non-Tobacco User 33 501.41 501.4118939PA0010025 Rating Area 3 Tobacco User/Non-Tobacco User 34 508.10 508.1018939PA0010025 Rating Area 3 Tobacco User/Non-Tobacco User 35 511.45 511.4518939PA0010025 Rating Area 3 Tobacco User/Non-Tobacco User 36 514.80 514.8018939PA0010025 Rating Area 3 Tobacco User/Non-Tobacco User 37 518.15 518.1518939PA0010025 Rating Area 3 Tobacco User/Non-Tobacco User 38 521.49 521.4918939PA0010025 Rating Area 3 Tobacco User/Non-Tobacco User 39 528.19 528.1918939PA0010025 Rating Area 3 Tobacco User/Non-Tobacco User 40 534.89 534.8918939PA0010025 Rating Area 3 Tobacco User/Non-Tobacco User 41 544.93 544.9318939PA0010025 Rating Area 3 Tobacco User/Non-Tobacco User 42 554.56 554.5618939PA0010025 Rating Area 3 Tobacco User/Non-Tobacco User 43 567.95 567.9518939PA0010025 Rating Area 3 Tobacco User/Non-Tobacco User 44 584.69 584.6918939PA0010025 Rating Area 3 Tobacco User/Non-Tobacco User 45 604.36 604.3618939PA0010025 Rating Area 3 Tobacco User/Non-Tobacco User 46 627.80 627.8018939PA0010025 Rating Area 3 Tobacco User/Non-Tobacco User 47 654.17 654.1718939PA0010025 Rating Area 3 Tobacco User/Non-Tobacco User 48 684.30 684.3018939PA0010025 Rating Area 3 Tobacco User/Non-Tobacco User 49 714.02 714.0218939PA0010025 Rating Area 3 Tobacco User/Non-Tobacco User 50 747.50 747.5018939PA0010025 Rating Area 3 Tobacco User/Non-Tobacco User 51 780.57 780.5718939PA0010025 Rating Area 3 Tobacco User/Non-Tobacco User 52 816.98 816.9818939PA0010025 Rating Area 3 Tobacco User/Non-Tobacco User 53 853.81 853.8118939PA0010025 Rating Area 3 Tobacco User/Non-Tobacco User 54 893.57 893.5718939PA0010025 Rating Area 3 Tobacco User/Non-Tobacco User 55 933.33 933.33
18939PA0010025 Rating Area 3 Tobacco User/Non-Tobacco User 56 976.44 976.4418939PA0010025 Rating Area 3 Tobacco User/Non-Tobacco User 57 1019.97 1019.9718939PA0010025 Rating Area 3 Tobacco User/Non-Tobacco User 58 1066.43 1066.4318939PA0010025 Rating Area 3 Tobacco User/Non-Tobacco User 59 1089.45 1089.4518939PA0010025 Rating Area 3 Tobacco User/Non-Tobacco User 60 1135.90 1135.9018939PA0010025 Rating Area 3 Tobacco User/Non-Tobacco User 61 1176.08 1176.0818939PA0010025 Rating Area 3 Tobacco User/Non-Tobacco User 62 1202.45 1202.4518939PA0010025 Rating Area 3 Tobacco User/Non-Tobacco User 63 1235.52 1235.5218939PA0010025 Rating Area 3 Tobacco User/Non-Tobacco User 64 and over 1255.19 1255.1918939PA0010025 Rating Area 4 Tobacco User/Non-Tobacco User 0-14 249.69 249.6918939PA0010025 Rating Area 4 Tobacco User/Non-Tobacco User 15 249.69 249.6918939PA0010025 Rating Area 4 Tobacco User/Non-Tobacco User 16 291.81 291.8118939PA0010025 Rating Area 4 Tobacco User/Non-Tobacco User 17 300.65 300.6518939PA0010025 Rating Area 4 Tobacco User/Non-Tobacco User 18 310.16 310.1618939PA0010025 Rating Area 4 Tobacco User/Non-Tobacco User 19 319.67 319.6718939PA0010025 Rating Area 4 Tobacco User/Non-Tobacco User 20 329.52 329.5218939PA0010025 Rating Area 4 Tobacco User/Non-Tobacco User 21 339.71 339.7118939PA0010025 Rating Area 4 Tobacco User/Non-Tobacco User 22 339.71 339.7118939PA0010025 Rating Area 4 Tobacco User/Non-Tobacco User 23 339.71 339.7118939PA0010025 Rating Area 4 Tobacco User/Non-Tobacco User 24 339.71 339.7118939PA0010025 Rating Area 4 Tobacco User/Non-Tobacco User 25 341.07 341.0718939PA0010025 Rating Area 4 Tobacco User/Non-Tobacco User 26 347.87 347.8718939PA0010025 Rating Area 4 Tobacco User/Non-Tobacco User 27 356.02 356.0218939PA0010025 Rating Area 4 Tobacco User/Non-Tobacco User 28 369.27 369.2718939PA0010025 Rating Area 4 Tobacco User/Non-Tobacco User 29 380.14 380.1418939PA0010025 Rating Area 4 Tobacco User/Non-Tobacco User 30 385.57 385.5718939PA0010025 Rating Area 4 Tobacco User/Non-Tobacco User 31 393.73 393.7318939PA0010025 Rating Area 4 Tobacco User/Non-Tobacco User 32 401.88 401.8818939PA0010025 Rating Area 4 Tobacco User/Non-Tobacco User 33 406.98 406.9818939PA0010025 Rating Area 4 Tobacco User/Non-Tobacco User 34 412.41 412.4118939PA0010025 Rating Area 4 Tobacco User/Non-Tobacco User 35 415.13 415.1318939PA0010025 Rating Area 4 Tobacco User/Non-Tobacco User 36 417.85 417.8518939PA0010025 Rating Area 4 Tobacco User/Non-Tobacco User 37 420.56 420.5618939PA0010025 Rating Area 4 Tobacco User/Non-Tobacco User 38 423.28 423.2818939PA0010025 Rating Area 4 Tobacco User/Non-Tobacco User 39 428.72 428.7218939PA0010025 Rating Area 4 Tobacco User/Non-Tobacco User 40 434.15 434.1518939PA0010025 Rating Area 4 Tobacco User/Non-Tobacco User 41 442.31 442.3118939PA0010025 Rating Area 4 Tobacco User/Non-Tobacco User 42 450.12 450.1218939PA0010025 Rating Area 4 Tobacco User/Non-Tobacco User 43 460.99 460.9918939PA0010025 Rating Area 4 Tobacco User/Non-Tobacco User 44 474.58 474.5818939PA0010025 Rating Area 4 Tobacco User/Non-Tobacco User 45 490.54 490.5418939PA0010025 Rating Area 4 Tobacco User/Non-Tobacco User 46 509.57 509.5718939PA0010025 Rating Area 4 Tobacco User/Non-Tobacco User 47 530.97 530.9718939PA0010025 Rating Area 4 Tobacco User/Non-Tobacco User 48 555.43 555.4318939PA0010025 Rating Area 4 Tobacco User/Non-Tobacco User 49 579.55 579.5518939PA0010025 Rating Area 4 Tobacco User/Non-Tobacco User 50 606.73 606.7318939PA0010025 Rating Area 4 Tobacco User/Non-Tobacco User 51 633.56 633.5618939PA0010025 Rating Area 4 Tobacco User/Non-Tobacco User 52 663.12 663.1218939PA0010025 Rating Area 4 Tobacco User/Non-Tobacco User 53 693.01 693.0118939PA0010025 Rating Area 4 Tobacco User/Non-Tobacco User 54 725.29 725.2918939PA0010025 Rating Area 4 Tobacco User/Non-Tobacco User 55 757.56 757.5618939PA0010025 Rating Area 4 Tobacco User/Non-Tobacco User 56 792.55 792.5518939PA0010025 Rating Area 4 Tobacco User/Non-Tobacco User 57 827.88 827.8818939PA0010025 Rating Area 4 Tobacco User/Non-Tobacco User 58 865.59 865.5918939PA0010025 Rating Area 4 Tobacco User/Non-Tobacco User 59 884.27 884.2718939PA0010025 Rating Area 4 Tobacco User/Non-Tobacco User 60 921.98 921.9818939PA0010025 Rating Area 4 Tobacco User/Non-Tobacco User 61 954.59 954.5918939PA0010025 Rating Area 4 Tobacco User/Non-Tobacco User 62 975.99 975.9918939PA0010025 Rating Area 4 Tobacco User/Non-Tobacco User 63 1002.83 1002.8318939PA0010025 Rating Area 4 Tobacco User/Non-Tobacco User 64 and over 1018.80 1018.80
18939PA0010025 Rating Area 5 Tobacco User/Non-Tobacco User 0-14240.38 240.38
18939PA0010025 Rating Area 5 Tobacco User/Non-Tobacco User 15240.38 240.38
18939PA0010025 Rating Area 5 Tobacco User/Non-Tobacco User 16280.93 280.93
18939PA0010025 Rating Area 5 Tobacco User/Non-Tobacco User 17289.43 289.43
18939PA0010025 Rating Area 5 Tobacco User/Non-Tobacco User 18298.59 298.59
18939PA0010025 Rating Area 5 Tobacco User/Non-Tobacco User 19307.75 307.75
18939PA0010025 Rating Area 5 Tobacco User/Non-Tobacco User 20317.23 317.23
18939PA0010025 Rating Area 5 Tobacco User/Non-Tobacco User 21327.04 327.04
18939PA0010025 Rating Area 5 Tobacco User/Non-Tobacco User 22327.04 327.04
18939PA0010025 Rating Area 5 Tobacco User/Non-Tobacco User 23327.04 327.04
18939PA0010025 Rating Area 5 Tobacco User/Non-Tobacco User 24327.04 327.04
18939PA0010025 Rating Area 5 Tobacco User/Non-Tobacco User 25328.35 328.35
18939PA0010025 Rating Area 5 Tobacco User/Non-Tobacco User 26334.89 334.89
18939PA0010025 Rating Area 5 Tobacco User/Non-Tobacco User 27342.74 342.74
18939PA0010025 Rating Area 5 Tobacco User/Non-Tobacco User 28355.50 355.50
18939PA0010025 Rating Area 5 Tobacco User/Non-Tobacco User 29365.96 365.96
18939PA0010025 Rating Area 5 Tobacco User/Non-Tobacco User 30371.20 371.20
18939PA0010025 Rating Area 5 Tobacco User/Non-Tobacco User 31379.04 379.04
18939PA0010025 Rating Area 5 Tobacco User/Non-Tobacco User 32386.89 386.89
18939PA0010025 Rating Area 5 Tobacco User/Non-Tobacco User 33391.80 391.80
18939PA0010025 Rating Area 5 Tobacco User/Non-Tobacco User 34397.03 397.03
18939PA0010025 Rating Area 5 Tobacco User/Non-Tobacco User 35399.65 399.65
18939PA0010025 Rating Area 5 Tobacco User/Non-Tobacco User 36402.27 402.27
18939PA0010025 Rating Area 5 Tobacco User/Non-Tobacco User 37404.88 404.88
18939PA0010025 Rating Area 5 Tobacco User/Non-Tobacco User 38407.50 407.50
18939PA0010025 Rating Area 5 Tobacco User/Non-Tobacco User 39412.73 412.73
18939PA0010025 Rating Area 5 Tobacco User/Non-Tobacco User 40417.96 417.96
18939PA0010025 Rating Area 5 Tobacco User/Non-Tobacco User 41425.81 425.81
18939PA0010025 Rating Area 5 Tobacco User/Non-Tobacco User 42433.33 433.33
18939PA0010025 Rating Area 5 Tobacco User/Non-Tobacco User 43443.80 443.80
18939PA0010025 Rating Area 5 Tobacco User/Non-Tobacco User 44456.88 456.88
18939PA0010025 Rating Area 5 Tobacco User/Non-Tobacco User 45472.25 472.25
18939PA0010025 Rating Area 5 Tobacco User/Non-Tobacco User 46490.57 490.57
18939PA0010025 Rating Area 5 Tobacco User/Non-Tobacco User 47511.17 511.17
18939PA0010025 Rating Area 5 Tobacco User/Non-Tobacco User 48534.72 534.72
18939PA0010025 Rating Area 5 Tobacco User/Non-Tobacco User 49557.94 557.94
18939PA0010025 Rating Area 5 Tobacco User/Non-Tobacco User 50584.10 584.10
18939PA0010025 Rating Area 5 Tobacco User/Non-Tobacco User 51609.94 609.94
18939PA0010025 Rating Area 5 Tobacco User/Non-Tobacco User 52638.39 638.39
18939PA0010025 Rating Area 5 Tobacco User/Non-Tobacco User 53667.17 667.17
18939PA0010025 Rating Area 5 Tobacco User/Non-Tobacco User 54698.24 698.24
18939PA0010025 Rating Area 5 Tobacco User/Non-Tobacco User 55729.31 729.31
18939PA0010025 Rating Area 5 Tobacco User/Non-Tobacco User 56763.00 763.00
18939PA0010025 Rating Area 5 Tobacco User/Non-Tobacco User 57797.01 797.01
18939PA0010025 Rating Area 5 Tobacco User/Non-Tobacco User 58833.31 833.31
18939PA0010025 Rating Area 5 Tobacco User/Non-Tobacco User 59851.30 851.30
18939PA0010025 Rating Area 5 Tobacco User/Non-Tobacco User 60887.60 887.60
18939PA0010025 Rating Area 5 Tobacco User/Non-Tobacco User 61919.00 919.00
18939PA0010025 Rating Area 5 Tobacco User/Non-Tobacco User 62939.60 939.60
18939PA0010025 Rating Area 5 Tobacco User/Non-Tobacco User 63965.44 965.44
18939PA0010025 Rating Area 5 Tobacco User/Non-Tobacco User 64 and over980.81 980.81
18939PA0010025 Rating Area 6 Tobacco User/Non-Tobacco User 0-14302.94 302.94
18939PA0010025 Rating Area 6 Tobacco User/Non-Tobacco User 15302.94 302.94
18939PA0010025 Rating Area 6 Tobacco User/Non-Tobacco User 16354.05 354.05
18939PA0010025 Rating Area 6 Tobacco User/Non-Tobacco User 17364.77 364.77
18939PA0010025 Rating Area 6 Tobacco User/Non-Tobacco User 18376.31 376.31
18939PA0010025 Rating Area 6 Tobacco User/Non-Tobacco User 19387.85 387.85
18939PA0010025 Rating Area 6 Tobacco User/Non-Tobacco User 20399.80 399.80
18939PA0010025 Rating Area 6 Tobacco User/Non-Tobacco User 21412.17 412.17
18939PA0010025 Rating Area 6 Tobacco User/Non-Tobacco User 22412.17 412.17
18939PA0010025 Rating Area 6 Tobacco User/Non-Tobacco User 23412.17 412.17
18939PA0010025 Rating Area 6 Tobacco User/Non-Tobacco User 24412.17 412.17
18939PA0010025 Rating Area 6 Tobacco User/Non-Tobacco User 25413.81 413.81
18939PA0010025 Rating Area 6 Tobacco User/Non-Tobacco User 26422.06 422.06
18939PA0010025 Rating Area 6 Tobacco User/Non-Tobacco User 27431.95 431.95
18939PA0010025 Rating Area 6 Tobacco User/Non-Tobacco User 28448.02 448.02
18939PA0010025 Rating Area 6 Tobacco User/Non-Tobacco User 29461.21 461.21
18939PA0010025 Rating Area 6 Tobacco User/Non-Tobacco User 30467.81 467.81
18939PA0010025 Rating Area 6 Tobacco User/Non-Tobacco User 31477.70 477.70
18939PA0010025 Rating Area 6 Tobacco User/Non-Tobacco User 32487.59 487.59
18939PA0010025 Rating Area 6 Tobacco User/Non-Tobacco User 33493.77 493.77
18939PA0010025 Rating Area 6 Tobacco User/Non-Tobacco User 34500.37 500.37
18939PA0010025 Rating Area 6 Tobacco User/Non-Tobacco User 35503.67 503.67
18939PA0010025 Rating Area 6 Tobacco User/Non-Tobacco User 36506.96 506.96
18939PA0010025 Rating Area 6 Tobacco User/Non-Tobacco User 37510.26 510.26
18939PA0010025 Rating Area 6 Tobacco User/Non-Tobacco User 38513.56 513.56
18939PA0010025 Rating Area 6 Tobacco User/Non-Tobacco User 39520.15 520.15
18939PA0010025 Rating Area 6 Tobacco User/Non-Tobacco User 40526.75 526.75
18939PA0010025 Rating Area 6 Tobacco User/Non-Tobacco User 41536.64 536.64
18939PA0010025 Rating Area 6 Tobacco User/Non-Tobacco User 42546.12 546.12
18939PA0010025 Rating Area 6 Tobacco User/Non-Tobacco User 43559.31 559.31
18939PA0010025 Rating Area 6 Tobacco User/Non-Tobacco User 44575.80 575.80
18939PA0010025 Rating Area 6 Tobacco User/Non-Tobacco User 45595.17 595.17
18939PA0010025 Rating Area 6 Tobacco User/Non-Tobacco User 46618.25 618.25
18939PA0010025 Rating Area 6 Tobacco User/Non-Tobacco User 47644.22 644.22
18939PA0010025 Rating Area 6 Tobacco User/Non-Tobacco User 48673.89 673.89
18939PA0010025 Rating Area 6 Tobacco User/Non-Tobacco User 49703.16 703.16
18939PA0010025 Rating Area 6 Tobacco User/Non-Tobacco User 50736.13 736.13
18939PA0010025 Rating Area 6 Tobacco User/Non-Tobacco User 51768.69 768.69
18939PA0010025 Rating Area 6 Tobacco User/Non-Tobacco User 52804.55 804.55
18939PA0010025 Rating Area 6 Tobacco User/Non-Tobacco User 53840.82 840.82
18939PA0010025 Rating Area 6 Tobacco User/Non-Tobacco User 54879.97 879.97
18939PA0010025 Rating Area 6 Tobacco User/Non-Tobacco User 55919.13 919.13
18939PA0010025 Rating Area 6 Tobacco User/Non-Tobacco User 56961.58 961.58
18939PA0010025 Rating Area 6 Tobacco User/Non-Tobacco User 571004.45 1004.45
18939PA0010025 Rating Area 6 Tobacco User/Non-Tobacco User 581050.20 1050.20
18939PA0010025 Rating Area 6 Tobacco User/Non-Tobacco User 591072.87 1072.87
18939PA0010025 Rating Area 6 Tobacco User/Non-Tobacco User 601118.62 1118.62
18939PA0010025 Rating Area 6 Tobacco User/Non-Tobacco User 611158.19 1158.19
18939PA0010025 Rating Area 6 Tobacco User/Non-Tobacco User 621184.15 1184.15
18939PA0010025 Rating Area 6 Tobacco User/Non-Tobacco User 631216.71 1216.71
18939PA0010025 Rating Area 6 Tobacco User/Non-Tobacco User 64 and over1236.09 1236.09
18939PA0010025 Rating Area 7 Tobacco User/Non-Tobacco User 0-14303.19 303.19
18939PA0010025 Rating Area 7 Tobacco User/Non-Tobacco User 15303.19 303.19
18939PA0010025 Rating Area 7 Tobacco User/Non-Tobacco User 16354.34 354.34
18939PA0010025 Rating Area 7 Tobacco User/Non-Tobacco User 17365.07 365.07
18939PA0010025 Rating Area 7 Tobacco User/Non-Tobacco User 18376.62 376.62
18939PA0010025 Rating Area 7 Tobacco User/Non-Tobacco User 19388.17 388.17
18939PA0010025 Rating Area 7 Tobacco User/Non-Tobacco User 20400.13 400.13
18939PA0010025 Rating Area 7 Tobacco User/Non-Tobacco User 21412.50 412.50
18939PA0010025 Rating Area 7 Tobacco User/Non-Tobacco User 22412.50 412.50
18939PA0010025 Rating Area 7 Tobacco User/Non-Tobacco User 23412.50 412.50
18939PA0010025 Rating Area 7 Tobacco User/Non-Tobacco User 24412.50 412.50
18939PA0010025 Rating Area 7 Tobacco User/Non-Tobacco User 25414.15 414.15
18939PA0010025 Rating Area 7 Tobacco User/Non-Tobacco User 26422.40 422.40
18939PA0010025 Rating Area 7 Tobacco User/Non-Tobacco User 27432.30 432.30
18939PA0010025 Rating Area 7 Tobacco User/Non-Tobacco User 28448.39 448.39
18939PA0010025 Rating Area 7 Tobacco User/Non-Tobacco User 29461.59 461.59
18939PA0010025 Rating Area 7 Tobacco User/Non-Tobacco User 30468.19 468.19
18939PA0010025 Rating Area 7 Tobacco User/Non-Tobacco User 31478.09 478.09
18939PA0010025 Rating Area 7 Tobacco User/Non-Tobacco User 32487.99 487.99
18939PA0010025 Rating Area 7 Tobacco User/Non-Tobacco User 33494.18 494.18
18939PA0010025 Rating Area 7 Tobacco User/Non-Tobacco User 34500.78 500.78
18939PA0010025 Rating Area 7 Tobacco User/Non-Tobacco User 35504.08 504.08
18939PA0010025 Rating Area 7 Tobacco User/Non-Tobacco User 36507.38 507.38
18939PA0010025 Rating Area 7 Tobacco User/Non-Tobacco User 37510.68 510.68
18939PA0010025 Rating Area 7 Tobacco User/Non-Tobacco User 38513.98 513.98
18939PA0010025 Rating Area 7 Tobacco User/Non-Tobacco User 39520.58 520.58
18939PA0010025 Rating Area 7 Tobacco User/Non-Tobacco User 40527.18 527.18
18939PA0010025 Rating Area 7 Tobacco User/Non-Tobacco User 41537.08 537.08
18939PA0010025 Rating Area 7 Tobacco User/Non-Tobacco User 42546.57 546.57
18939PA0010025 Rating Area 7 Tobacco User/Non-Tobacco User 43559.77 559.77
18939PA0010025 Rating Area 7 Tobacco User/Non-Tobacco User 44576.27 576.27
18939PA0010025 Rating Area 7 Tobacco User/Non-Tobacco User 45595.66 595.66
18939PA0010025 Rating Area 7 Tobacco User/Non-Tobacco User 46618.76 618.76
18939PA0010025 Rating Area 7 Tobacco User/Non-Tobacco User 47644.74 644.74
18939PA0010025 Rating Area 7 Tobacco User/Non-Tobacco User 48674.44 674.44
18939PA0010025 Rating Area 7 Tobacco User/Non-Tobacco User 49703.73 703.73
18939PA0010025 Rating Area 7 Tobacco User/Non-Tobacco User 50736.73 736.73
18939PA0010025 Rating Area 7 Tobacco User/Non-Tobacco User 51769.32 769.32
18939PA0010025 Rating Area 7 Tobacco User/Non-Tobacco User 52805.21 805.21
18939PA0010025 Rating Area 7 Tobacco User/Non-Tobacco User 53841.51 841.51
18939PA0010025 Rating Area 7 Tobacco User/Non-Tobacco User 54880.70 880.70
18939PA0010025 Rating Area 7 Tobacco User/Non-Tobacco User 55919.88 919.88
18939PA0010025 Rating Area 7 Tobacco User/Non-Tobacco User 56962.37 962.37
18939PA0010025 Rating Area 7 Tobacco User/Non-Tobacco User 571005.27 1005.27
18939PA0010025 Rating Area 7 Tobacco User/Non-Tobacco User 581051.06 1051.06
18939PA0010025 Rating Area 7 Tobacco User/Non-Tobacco User 591073.75 1073.75
18939PA0010025 Rating Area 7 Tobacco User/Non-Tobacco User 601119.53 1119.53
18939PA0010025 Rating Area 7 Tobacco User/Non-Tobacco User 611159.14 1159.14
18939PA0010025 Rating Area 7 Tobacco User/Non-Tobacco User 621185.12 1185.12
18939PA0010025 Rating Area 7 Tobacco User/Non-Tobacco User 631217.71 1217.71
18939PA0010025 Rating Area 7 Tobacco User/Non-Tobacco User 64 and over1237.10 1237.10
18939PA0010025 Rating Area 8 Tobacco User/Non-Tobacco User 0-14308.18 308.18
18939PA0010025 Rating Area 8 Tobacco User/Non-Tobacco User 15308.18 308.18
18939PA0010025 Rating Area 8 Tobacco User/Non-Tobacco User 16360.18 360.18
18939PA0010025 Rating Area 8 Tobacco User/Non-Tobacco User 17371.08 371.08
18939PA0010025 Rating Area 8 Tobacco User/Non-Tobacco User 18382.82 382.82
18939PA0010025 Rating Area 8 Tobacco User/Non-Tobacco User 19394.56 394.56
18939PA0010025 Rating Area 8 Tobacco User/Non-Tobacco User 20406.72 406.72
18939PA0010025 Rating Area 8 Tobacco User/Non-Tobacco User 21419.30 419.30
18939PA0010025 Rating Area 8 Tobacco User/Non-Tobacco User 22419.30 419.30
18939PA0010025 Rating Area 8 Tobacco User/Non-Tobacco User 23419.30 419.30
18939PA0010025 Rating Area 8 Tobacco User/Non-Tobacco User 24419.30 419.30
18939PA0010025 Rating Area 8 Tobacco User/Non-Tobacco User 25420.97 420.97
18939PA0010025 Rating Area 8 Tobacco User/Non-Tobacco User 26429.36 429.36
18939PA0010025 Rating Area 8 Tobacco User/Non-Tobacco User 27439.42 439.42
18939PA0010025 Rating Area 8 Tobacco User/Non-Tobacco User 28455.77 455.77
18939PA0010025 Rating Area 8 Tobacco User/Non-Tobacco User 29469.19 469.19
18939PA0010025 Rating Area 8 Tobacco User/Non-Tobacco User 30475.90 475.90
18939PA0010025 Rating Area 8 Tobacco User/Non-Tobacco User 31485.96 485.96
18939PA0010025 Rating Area 8 Tobacco User/Non-Tobacco User 32496.03 496.03
18939PA0010025 Rating Area 8 Tobacco User/Non-Tobacco User 33502.32 502.32
18939PA0010025 Rating Area 8 Tobacco User/Non-Tobacco User 34509.03 509.03
18939PA0010025 Rating Area 8 Tobacco User/Non-Tobacco User 35512.38 512.38
18939PA0010025 Rating Area 8 Tobacco User/Non-Tobacco User 36515.73 515.73
18939PA0010025 Rating Area 8 Tobacco User/Non-Tobacco User 37519.09 519.09
18939PA0010025 Rating Area 8 Tobacco User/Non-Tobacco User 38522.44 522.44
18939PA0010025 Rating Area 8 Tobacco User/Non-Tobacco User 39529.15 529.15
18939PA0010025 Rating Area 8 Tobacco User/Non-Tobacco User 40535.86 535.86
18939PA0010025 Rating Area 8 Tobacco User/Non-Tobacco User 41545.92 545.92
18939PA0010025 Rating Area 8 Tobacco User/Non-Tobacco User 42555.57 555.57
18939PA0010025 Rating Area 8 Tobacco User/Non-Tobacco User 43568.98 568.98
18939PA0010025 Rating Area 8 Tobacco User/Non-Tobacco User 44585.76 585.76
18939PA0010025 Rating Area 8 Tobacco User/Non-Tobacco User 45605.46 605.46
18939PA0010025 Rating Area 8 Tobacco User/Non-Tobacco User 46628.94 628.94
18939PA0010025 Rating Area 8 Tobacco User/Non-Tobacco User 47655.36 655.36
18939PA0010025 Rating Area 8 Tobacco User/Non-Tobacco User 48685.55 685.55
18939PA0010025 Rating Area 8 Tobacco User/Non-Tobacco User 49715.32 715.32
18939PA0010025 Rating Area 8 Tobacco User/Non-Tobacco User 50748.86 748.86
18939PA0010025 Rating Area 8 Tobacco User/Non-Tobacco User 51781.99 781.99
18939PA0010025 Rating Area 8 Tobacco User/Non-Tobacco User 52818.47 818.47
18939PA0010025 Rating Area 8 Tobacco User/Non-Tobacco User 53855.36 855.36
18939PA0010025 Rating Area 8 Tobacco User/Non-Tobacco User 54895.20 895.20
18939PA0010025 Rating Area 8 Tobacco User/Non-Tobacco User 55935.03 935.03
18939PA0010025 Rating Area 8 Tobacco User/Non-Tobacco User 56978.22 978.22
18939PA0010025 Rating Area 8 Tobacco User/Non-Tobacco User 571021.82 1021.82
18939PA0010025 Rating Area 8 Tobacco User/Non-Tobacco User 581068.37 1068.37
18939PA0010025 Rating Area 8 Tobacco User/Non-Tobacco User 591091.43 1091.43
18939PA0010025 Rating Area 8 Tobacco User/Non-Tobacco User 601137.97 1137.97
18939PA0010025 Rating Area 8 Tobacco User/Non-Tobacco User 611178.22 1178.22
18939PA0010025 Rating Area 8 Tobacco User/Non-Tobacco User 621204.64 1204.64
18939PA0010025 Rating Area 8 Tobacco User/Non-Tobacco User 631237.76 1237.76
18939PA0010025 Rating Area 8 Tobacco User/Non-Tobacco User 64 and over1257.47 1257.47
18939PA0010025 Rating Area 9 Tobacco User/Non-Tobacco User 0-14287.61 287.61
18939PA0010025 Rating Area 9 Tobacco User/Non-Tobacco User 15287.61 287.61
18939PA0010025 Rating Area 9 Tobacco User/Non-Tobacco User 16336.13 336.13
18939PA0010025 Rating Area 9 Tobacco User/Non-Tobacco User 17346.30 346.30
18939PA0010025 Rating Area 9 Tobacco User/Non-Tobacco User 18357.26 357.26
18939PA0010025 Rating Area 9 Tobacco User/Non-Tobacco User 19368.22 368.22
18939PA0010025 Rating Area 9 Tobacco User/Non-Tobacco User 20379.57 379.57
18939PA0010025 Rating Area 9 Tobacco User/Non-Tobacco User 21391.30 391.30
18939PA0010025 Rating Area 9 Tobacco User/Non-Tobacco User 22391.30 391.30
18939PA0010025 Rating Area 9 Tobacco User/Non-Tobacco User 23391.30 391.30
18939PA0010025 Rating Area 9 Tobacco User/Non-Tobacco User 24391.30 391.30
18939PA0010025 Rating Area 9 Tobacco User/Non-Tobacco User 25392.87 392.87
18939PA0010025 Rating Area 9 Tobacco User/Non-Tobacco User 26400.70 400.70
18939PA0010025 Rating Area 9 Tobacco User/Non-Tobacco User 27410.09 410.09
18939PA0010025 Rating Area 9 Tobacco User/Non-Tobacco User 28425.35 425.35
18939PA0010025 Rating Area 9 Tobacco User/Non-Tobacco User 29437.87 437.87
18939PA0010025 Rating Area 9 Tobacco User/Non-Tobacco User 30444.13 444.13
18939PA0010025 Rating Area 9 Tobacco User/Non-Tobacco User 31453.52 453.52
18939PA0010025 Rating Area 9 Tobacco User/Non-Tobacco User 32462.91 462.91
18939PA0010025 Rating Area 9 Tobacco User/Non-Tobacco User 33468.78 468.78
18939PA0010025 Rating Area 9 Tobacco User/Non-Tobacco User 34475.04 475.04
18939PA0010025 Rating Area 9 Tobacco User/Non-Tobacco User 35478.17 478.17
18939PA0010025 Rating Area 9 Tobacco User/Non-Tobacco User 36481.30 481.30
18939PA0010025 Rating Area 9 Tobacco User/Non-Tobacco User 37484.43 484.43
18939PA0010025 Rating Area 9 Tobacco User/Non-Tobacco User 38487.57 487.57
18939PA0010025 Rating Area 9 Tobacco User/Non-Tobacco User 39493.83 493.83
18939PA0010025 Rating Area 9 Tobacco User/Non-Tobacco User 40500.09 500.09
18939PA0010025 Rating Area 9 Tobacco User/Non-Tobacco User 41509.48 509.48
18939PA0010025 Rating Area 9 Tobacco User/Non-Tobacco User 42518.48 518.48
18939PA0010025 Rating Area 9 Tobacco User/Non-Tobacco User 43531.00 531.00
18939PA0010025 Rating Area 9 Tobacco User/Non-Tobacco User 44546.65 546.65
18939PA0010025 Rating Area 9 Tobacco User/Non-Tobacco User 45565.04 565.04
18939PA0010025 Rating Area 9 Tobacco User/Non-Tobacco User 46586.96 586.96
18939PA0010025 Rating Area 9 Tobacco User/Non-Tobacco User 47611.61 611.61
18939PA0010025 Rating Area 9 Tobacco User/Non-Tobacco User 48639.78 639.78
18939PA0010025 Rating Area 9 Tobacco User/Non-Tobacco User 49667.57 667.57
18939PA0010025 Rating Area 9 Tobacco User/Non-Tobacco User 50698.87 698.87
18939PA0010025 Rating Area 9 Tobacco User/Non-Tobacco User 51729.78 729.78
18939PA0010025 Rating Area 9 Tobacco User/Non-Tobacco User 52763.83 763.83
18939PA0010025 Rating Area 9 Tobacco User/Non-Tobacco User 53798.26 798.26
18939PA0010025 Rating Area 9 Tobacco User/Non-Tobacco User 54835.43 835.43
18939PA0010025 Rating Area 9 Tobacco User/Non-Tobacco User 55872.61 872.61
18939PA0010025 Rating Area 9 Tobacco User/Non-Tobacco User 56912.91 912.91
18939PA0010025 Rating Area 9 Tobacco User/Non-Tobacco User 57953.61 953.61
18939PA0010025 Rating Area 9 Tobacco User/Non-Tobacco User 58997.04 997.04
18939PA0010025 Rating Area 9 Tobacco User/Non-Tobacco User 591018.57 1018.57
18939PA0010025 Rating Area 9 Tobacco User/Non-Tobacco User 601062.00 1062.00
18939PA0010025 Rating Area 9 Tobacco User/Non-Tobacco User 611099.57 1099.57
18939PA0010025 Rating Area 9 Tobacco User/Non-Tobacco User 621124.22 1124.22
18939PA0010025 Rating Area 9 Tobacco User/Non-Tobacco User 631155.13 1155.13
18939PA0010025 Rating Area 9 Tobacco User/Non-Tobacco User 64 and over1173.52 1173.52
2018 Rates Table Template v7.1 All fields with an asterisk ( * ) are required. To validate press Validate button or Ctrl + Shift + I. To finalize, press Finalize button or Ctrl + Shift + F.
If macros are disabled, press and hold the ALT key and press t If you are in a community rating state, select Family-Tier Rates under Rating Method and fill in all columns.If you are not in a community rating state, select Age-Based Rates under Rating Method and provide an Individual Rate for every age band.If Tobacco is Tobacco User/Non-Tobacco User, you must give a rate for Tobacco Use and Non-Tobacco Use.To add a new sheet, press the Add Sheet button, or Ctrl + Shift + H. All plans must have the same dates on a sheet.
Plan ID* Rating Area ID* Tobacco* Age* Individual Rate* Individual Tobacco Rate*
Required:Enter the 14-character Plan ID
Required:Select the Rating Area ID
Required:Select if Tobacco use of subscriber is used to
determine if a person is eligible for a rate from a plan
Required:Select the age of a subscriber eligible for the
rate
Required:Enter the rate of an Individual Non-Tobacco or
No Preference enrollee on a plan
Required:Enter the rate of an Individual tobacco enrollee
on a plan
18939PA0010025 Rating Area 1 Tobacco User/Non-Tobacco User 0-14 248.94 248.9418939PA0010025 Rating Area 1 Tobacco User/Non-Tobacco User 15 248.94 248.9418939PA0010025 Rating Area 1 Tobacco User/Non-Tobacco User 16 290.94 290.9418939PA0010025 Rating Area 1 Tobacco User/Non-Tobacco User 17 299.75 299.7518939PA0010025 Rating Area 1 Tobacco User/Non-Tobacco User 18 309.23 309.2318939PA0010025 Rating Area 1 Tobacco User/Non-Tobacco User 19 318.71 318.7118939PA0010025 Rating Area 1 Tobacco User/Non-Tobacco User 20 328.54 328.5418939PA0010025 Rating Area 1 Tobacco User/Non-Tobacco User 21 338.70 338.7018939PA0010025 Rating Area 1 Tobacco User/Non-Tobacco User 22 338.70 338.7018939PA0010025 Rating Area 1 Tobacco User/Non-Tobacco User 23 338.70 338.7018939PA0010025 Rating Area 1 Tobacco User/Non-Tobacco User 24 338.70 338.7018939PA0010025 Rating Area 1 Tobacco User/Non-Tobacco User 25 340.05 340.0518939PA0010025 Rating Area 1 Tobacco User/Non-Tobacco User 26 346.83 346.8318939PA0010025 Rating Area 1 Tobacco User/Non-Tobacco User 27 354.95 354.9518939PA0010025 Rating Area 1 Tobacco User/Non-Tobacco User 28 368.16 368.1618939PA0010025 Rating Area 1 Tobacco User/Non-Tobacco User 29 379.00 379.0018939PA0010025 Rating Area 1 Tobacco User/Non-Tobacco User 30 384.42 384.4218939PA0010025 Rating Area 1 Tobacco User/Non-Tobacco User 31 392.55 392.5518939PA0010025 Rating Area 1 Tobacco User/Non-Tobacco User 32 400.68 400.6818939PA0010025 Rating Area 1 Tobacco User/Non-Tobacco User 33 405.76 405.7618939PA0010025 Rating Area 1 Tobacco User/Non-Tobacco User 34 411.18 411.1818939PA0010025 Rating Area 1 Tobacco User/Non-Tobacco User 35 413.89 413.8918939PA0010025 Rating Area 1 Tobacco User/Non-Tobacco User 36 416.60 416.6018939PA0010025 Rating Area 1 Tobacco User/Non-Tobacco User 37 419.31 419.3118939PA0010025 Rating Area 1 Tobacco User/Non-Tobacco User 38 422.02 422.0218939PA0010025 Rating Area 1 Tobacco User/Non-Tobacco User 39 427.44 427.4418939PA0010025 Rating Area 1 Tobacco User/Non-Tobacco User 40 432.85 432.8518939PA0010025 Rating Area 1 Tobacco User/Non-Tobacco User 41 440.98 440.9818939PA0010025 Rating Area 1 Tobacco User/Non-Tobacco User 42 448.77 448.7718939PA0010025 Rating Area 1 Tobacco User/Non-Tobacco User 43 459.61 459.6118939PA0010025 Rating Area 1 Tobacco User/Non-Tobacco User 44 473.16 473.1618939PA0010025 Rating Area 1 Tobacco User/Non-Tobacco User 45 489.08 489.0818939PA0010025 Rating Area 1 Tobacco User/Non-Tobacco User 46 508.05 508.0518939PA0010025 Rating Area 1 Tobacco User/Non-Tobacco User 47 529.38 529.3818939PA0010025 Rating Area 1 Tobacco User/Non-Tobacco User 48 553.77 553.7718939PA0010025 Rating Area 1 Tobacco User/Non-Tobacco User 49 577.82 577.8218939PA0010025 Rating Area 1 Tobacco User/Non-Tobacco User 50 604.91 604.9118939PA0010025 Rating Area 1 Tobacco User/Non-Tobacco User 51 631.67 631.6718939PA0010025 Rating Area 1 Tobacco User/Non-Tobacco User 52 661.14 661.1418939PA0010025 Rating Area 1 Tobacco User/Non-Tobacco User 53 690.94 690.9418939PA0010025 Rating Area 1 Tobacco User/Non-Tobacco User 54 723.12 723.1218939PA0010025 Rating Area 1 Tobacco User/Non-Tobacco User 55 755.29 755.2918939PA0010025 Rating Area 1 Tobacco User/Non-Tobacco User 56 790.18 790.1818939PA0010025 Rating Area 1 Tobacco User/Non-Tobacco User 57 825.40 825.4018939PA0010025 Rating Area 1 Tobacco User/Non-Tobacco User 58 863.00 863.0018939PA0010025 Rating Area 1 Tobacco User/Non-Tobacco User 59 881.63 881.6318939PA0010025 Rating Area 1 Tobacco User/Non-Tobacco User 60 919.22 919.2218939PA0010025 Rating Area 1 Tobacco User/Non-Tobacco User 61 951.74 951.7418939PA0010025 Rating Area 1 Tobacco User/Non-Tobacco User 62 973.08 973.0818939PA0010025 Rating Area 1 Tobacco User/Non-Tobacco User 63 999.83 999.8318939PA0010025 Rating Area 1 Tobacco User/Non-Tobacco User 64 and over 1015.75 1015.7518939PA0010025 Rating Area 2 Tobacco User/Non-Tobacco User 0-14 251.10 251.1018939PA0010025 Rating Area 2 Tobacco User/Non-Tobacco User 15 251.10 251.1018939PA0010025 Rating Area 2 Tobacco User/Non-Tobacco User 16 293.46 293.4618939PA0010025 Rating Area 2 Tobacco User/Non-Tobacco User 17 302.34 302.3418939PA0010025 Rating Area 2 Tobacco User/Non-Tobacco User 18 311.91 311.9118939PA0010025 Rating Area 2 Tobacco User/Non-Tobacco User 19 321.47 321.4718939PA0010025 Rating Area 2 Tobacco User/Non-Tobacco User 20 331.38 331.3818939PA0010025 Rating Area 2 Tobacco User/Non-Tobacco User 21 341.63 341.6318939PA0010025 Rating Area 2 Tobacco User/Non-Tobacco User 22 341.63 341.6318939PA0010025 Rating Area 2 Tobacco User/Non-Tobacco User 23 341.63 341.6318939PA0010025 Rating Area 2 Tobacco User/Non-Tobacco User 24 341.63 341.63
18939PA0010025 Rating Area 2 Tobacco User/Non-Tobacco User 25 342.99 342.9918939PA0010025 Rating Area 2 Tobacco User/Non-Tobacco User 26 349.83 349.8318939PA0010025 Rating Area 2 Tobacco User/Non-Tobacco User 27 358.03 358.0318939PA0010025 Rating Area 2 Tobacco User/Non-Tobacco User 28 371.35 371.3518939PA0010025 Rating Area 2 Tobacco User/Non-Tobacco User 29 382.28 382.2818939PA0010025 Rating Area 2 Tobacco User/Non-Tobacco User 30 387.75 387.7518939PA0010025 Rating Area 2 Tobacco User/Non-Tobacco User 31 395.95 395.9518939PA0010025 Rating Area 2 Tobacco User/Non-Tobacco User 32 404.15 404.1518939PA0010025 Rating Area 2 Tobacco User/Non-Tobacco User 33 409.27 409.2718939PA0010025 Rating Area 2 Tobacco User/Non-Tobacco User 34 414.74 414.7418939PA0010025 Rating Area 2 Tobacco User/Non-Tobacco User 35 417.47 417.4718939PA0010025 Rating Area 2 Tobacco User/Non-Tobacco User 36 420.20 420.2018939PA0010025 Rating Area 2 Tobacco User/Non-Tobacco User 37 422.94 422.9418939PA0010025 Rating Area 2 Tobacco User/Non-Tobacco User 38 425.67 425.6718939PA0010025 Rating Area 2 Tobacco User/Non-Tobacco User 39 431.13 431.1318939PA0010025 Rating Area 2 Tobacco User/Non-Tobacco User 40 436.60 436.6018939PA0010025 Rating Area 2 Tobacco User/Non-Tobacco User 41 444.80 444.8018939PA0010025 Rating Area 2 Tobacco User/Non-Tobacco User 42 452.66 452.6618939PA0010025 Rating Area 2 Tobacco User/Non-Tobacco User 43 463.59 463.5918939PA0010025 Rating Area 2 Tobacco User/Non-Tobacco User 44 477.25 477.2518939PA0010025 Rating Area 2 Tobacco User/Non-Tobacco User 45 493.31 493.3118939PA0010025 Rating Area 2 Tobacco User/Non-Tobacco User 46 512.44 512.4418939PA0010025 Rating Area 2 Tobacco User/Non-Tobacco User 47 533.96 533.9618939PA0010025 Rating Area 2 Tobacco User/Non-Tobacco User 48 558.56 558.5618939PA0010025 Rating Area 2 Tobacco User/Non-Tobacco User 49 582.82 582.8218939PA0010025 Rating Area 2 Tobacco User/Non-Tobacco User 50 610.15 610.1518939PA0010025 Rating Area 2 Tobacco User/Non-Tobacco User 51 637.14 637.1418939PA0010025 Rating Area 2 Tobacco User/Non-Tobacco User 52 666.86 666.8618939PA0010025 Rating Area 2 Tobacco User/Non-Tobacco User 53 696.92 696.9218939PA0010025 Rating Area 2 Tobacco User/Non-Tobacco User 54 729.38 729.3818939PA0010025 Rating Area 2 Tobacco User/Non-Tobacco User 55 761.83 761.8318939PA0010025 Rating Area 2 Tobacco User/Non-Tobacco User 56 797.02 797.0218939PA0010025 Rating Area 2 Tobacco User/Non-Tobacco User 57 832.55 832.5518939PA0010025 Rating Area 2 Tobacco User/Non-Tobacco User 58 870.47 870.4718939PA0010025 Rating Area 2 Tobacco User/Non-Tobacco User 59 889.26 889.2618939PA0010025 Rating Area 2 Tobacco User/Non-Tobacco User 60 927.18 927.1818939PA0010025 Rating Area 2 Tobacco User/Non-Tobacco User 61 959.97 959.9718939PA0010025 Rating Area 2 Tobacco User/Non-Tobacco User 62 981.50 981.5018939PA0010025 Rating Area 2 Tobacco User/Non-Tobacco User 63 1008.48 1008.4818939PA0010025 Rating Area 2 Tobacco User/Non-Tobacco User 64 and over 1024.54 1024.5418939PA0010025 Rating Area 3 Tobacco User/Non-Tobacco User 0-14 316.54 316.5418939PA0010025 Rating Area 3 Tobacco User/Non-Tobacco User 15 316.54 316.5418939PA0010025 Rating Area 3 Tobacco User/Non-Tobacco User 16 369.94 369.9418939PA0010025 Rating Area 3 Tobacco User/Non-Tobacco User 17 381.14 381.1418939PA0010025 Rating Area 3 Tobacco User/Non-Tobacco User 18 393.20 393.2018939PA0010025 Rating Area 3 Tobacco User/Non-Tobacco User 19 405.26 405.2618939PA0010025 Rating Area 3 Tobacco User/Non-Tobacco User 20 417.75 417.7518939PA0010025 Rating Area 3 Tobacco User/Non-Tobacco User 21 430.67 430.6718939PA0010025 Rating Area 3 Tobacco User/Non-Tobacco User 22 430.67 430.6718939PA0010025 Rating Area 3 Tobacco User/Non-Tobacco User 23 430.67 430.6718939PA0010025 Rating Area 3 Tobacco User/Non-Tobacco User 24 430.67 430.6718939PA0010025 Rating Area 3 Tobacco User/Non-Tobacco User 25 432.39 432.3918939PA0010025 Rating Area 3 Tobacco User/Non-Tobacco User 26 441.00 441.0018939PA0010025 Rating Area 3 Tobacco User/Non-Tobacco User 27 451.34 451.3418939PA0010025 Rating Area 3 Tobacco User/Non-Tobacco User 28 468.13 468.1318939PA0010025 Rating Area 3 Tobacco User/Non-Tobacco User 29 481.91 481.9118939PA0010025 Rating Area 3 Tobacco User/Non-Tobacco User 30 488.80 488.8018939PA0010025 Rating Area 3 Tobacco User/Non-Tobacco User 31 499.14 499.1418939PA0010025 Rating Area 3 Tobacco User/Non-Tobacco User 32 509.48 509.4818939PA0010025 Rating Area 3 Tobacco User/Non-Tobacco User 33 515.94 515.9418939PA0010025 Rating Area 3 Tobacco User/Non-Tobacco User 34 522.83 522.8318939PA0010025 Rating Area 3 Tobacco User/Non-Tobacco User 35 526.27 526.2718939PA0010025 Rating Area 3 Tobacco User/Non-Tobacco User 36 529.72 529.7218939PA0010025 Rating Area 3 Tobacco User/Non-Tobacco User 37 533.16 533.1618939PA0010025 Rating Area 3 Tobacco User/Non-Tobacco User 38 536.61 536.6118939PA0010025 Rating Area 3 Tobacco User/Non-Tobacco User 39 543.50 543.5018939PA0010025 Rating Area 3 Tobacco User/Non-Tobacco User 40 550.39 550.3918939PA0010025 Rating Area 3 Tobacco User/Non-Tobacco User 41 560.73 560.7318939PA0010025 Rating Area 3 Tobacco User/Non-Tobacco User 42 570.63 570.6318939PA0010025 Rating Area 3 Tobacco User/Non-Tobacco User 43 584.41 584.4118939PA0010025 Rating Area 3 Tobacco User/Non-Tobacco User 44 601.64 601.6418939PA0010025 Rating Area 3 Tobacco User/Non-Tobacco User 45 621.88 621.8818939PA0010025 Rating Area 3 Tobacco User/Non-Tobacco User 46 646.00 646.0018939PA0010025 Rating Area 3 Tobacco User/Non-Tobacco User 47 673.13 673.1318939PA0010025 Rating Area 3 Tobacco User/Non-Tobacco User 48 704.14 704.1418939PA0010025 Rating Area 3 Tobacco User/Non-Tobacco User 49 734.71 734.7118939PA0010025 Rating Area 3 Tobacco User/Non-Tobacco User 50 769.17 769.1718939PA0010025 Rating Area 3 Tobacco User/Non-Tobacco User 51 803.19 803.1918939PA0010025 Rating Area 3 Tobacco User/Non-Tobacco User 52 840.66 840.6618939PA0010025 Rating Area 3 Tobacco User/Non-Tobacco User 53 878.56 878.5618939PA0010025 Rating Area 3 Tobacco User/Non-Tobacco User 54 919.47 919.4718939PA0010025 Rating Area 3 Tobacco User/Non-Tobacco User 55 960.38 960.38
18939PA0010025 Rating Area 3 Tobacco User/Non-Tobacco User 56 1004.74 1004.7418939PA0010025 Rating Area 3 Tobacco User/Non-Tobacco User 57 1049.53 1049.5318939PA0010025 Rating Area 3 Tobacco User/Non-Tobacco User 58 1097.33 1097.3318939PA0010025 Rating Area 3 Tobacco User/Non-Tobacco User 59 1121.02 1121.0218939PA0010025 Rating Area 3 Tobacco User/Non-Tobacco User 60 1168.83 1168.8318939PA0010025 Rating Area 3 Tobacco User/Non-Tobacco User 61 1210.17 1210.1718939PA0010025 Rating Area 3 Tobacco User/Non-Tobacco User 62 1237.30 1237.3018939PA0010025 Rating Area 3 Tobacco User/Non-Tobacco User 63 1271.32 1271.3218939PA0010025 Rating Area 3 Tobacco User/Non-Tobacco User 64 and over 1291.56 1291.5618939PA0010025 Rating Area 4 Tobacco User/Non-Tobacco User 0-14 256.92 256.9218939PA0010025 Rating Area 4 Tobacco User/Non-Tobacco User 15 256.92 256.9218939PA0010025 Rating Area 4 Tobacco User/Non-Tobacco User 16 300.27 300.2718939PA0010025 Rating Area 4 Tobacco User/Non-Tobacco User 17 309.36 309.3618939PA0010025 Rating Area 4 Tobacco User/Non-Tobacco User 18 319.15 319.1518939PA0010025 Rating Area 4 Tobacco User/Non-Tobacco User 19 328.93 328.9318939PA0010025 Rating Area 4 Tobacco User/Non-Tobacco User 20 339.07 339.0718939PA0010025 Rating Area 4 Tobacco User/Non-Tobacco User 21 349.56 349.5618939PA0010025 Rating Area 4 Tobacco User/Non-Tobacco User 22 349.56 349.5618939PA0010025 Rating Area 4 Tobacco User/Non-Tobacco User 23 349.56 349.5618939PA0010025 Rating Area 4 Tobacco User/Non-Tobacco User 24 349.56 349.5618939PA0010025 Rating Area 4 Tobacco User/Non-Tobacco User 25 350.96 350.9618939PA0010025 Rating Area 4 Tobacco User/Non-Tobacco User 26 357.95 357.9518939PA0010025 Rating Area 4 Tobacco User/Non-Tobacco User 27 366.34 366.3418939PA0010025 Rating Area 4 Tobacco User/Non-Tobacco User 28 379.97 379.9718939PA0010025 Rating Area 4 Tobacco User/Non-Tobacco User 29 391.16 391.1618939PA0010025 Rating Area 4 Tobacco User/Non-Tobacco User 30 396.75 396.7518939PA0010025 Rating Area 4 Tobacco User/Non-Tobacco User 31 405.14 405.1418939PA0010025 Rating Area 4 Tobacco User/Non-Tobacco User 32 413.53 413.5318939PA0010025 Rating Area 4 Tobacco User/Non-Tobacco User 33 418.77 418.7718939PA0010025 Rating Area 4 Tobacco User/Non-Tobacco User 34 424.36 424.3618939PA0010025 Rating Area 4 Tobacco User/Non-Tobacco User 35 427.16 427.1618939PA0010025 Rating Area 4 Tobacco User/Non-Tobacco User 36 429.96 429.9618939PA0010025 Rating Area 4 Tobacco User/Non-Tobacco User 37 432.75 432.7518939PA0010025 Rating Area 4 Tobacco User/Non-Tobacco User 38 435.55 435.5518939PA0010025 Rating Area 4 Tobacco User/Non-Tobacco User 39 441.14 441.1418939PA0010025 Rating Area 4 Tobacco User/Non-Tobacco User 40 446.73 446.7318939PA0010025 Rating Area 4 Tobacco User/Non-Tobacco User 41 455.12 455.1218939PA0010025 Rating Area 4 Tobacco User/Non-Tobacco User 42 463.16 463.1618939PA0010025 Rating Area 4 Tobacco User/Non-Tobacco User 43 474.35 474.3518939PA0010025 Rating Area 4 Tobacco User/Non-Tobacco User 44 488.33 488.3318939PA0010025 Rating Area 4 Tobacco User/Non-Tobacco User 45 504.76 504.7618939PA0010025 Rating Area 4 Tobacco User/Non-Tobacco User 46 524.34 524.3418939PA0010025 Rating Area 4 Tobacco User/Non-Tobacco User 47 546.36 546.3618939PA0010025 Rating Area 4 Tobacco User/Non-Tobacco User 48 571.53 571.5318939PA0010025 Rating Area 4 Tobacco User/Non-Tobacco User 49 596.35 596.3518939PA0010025 Rating Area 4 Tobacco User/Non-Tobacco User 50 624.31 624.3118939PA0010025 Rating Area 4 Tobacco User/Non-Tobacco User 51 651.93 651.9318939PA0010025 Rating Area 4 Tobacco User/Non-Tobacco User 52 682.34 682.3418939PA0010025 Rating Area 4 Tobacco User/Non-Tobacco User 53 713.10 713.1018939PA0010025 Rating Area 4 Tobacco User/Non-Tobacco User 54 746.31 746.3118939PA0010025 Rating Area 4 Tobacco User/Non-Tobacco User 55 779.51 779.5118939PA0010025 Rating Area 4 Tobacco User/Non-Tobacco User 56 815.52 815.5218939PA0010025 Rating Area 4 Tobacco User/Non-Tobacco User 57 851.87 851.8718939PA0010025 Rating Area 4 Tobacco User/Non-Tobacco User 58 890.67 890.6718939PA0010025 Rating Area 4 Tobacco User/Non-Tobacco User 59 909.90 909.9018939PA0010025 Rating Area 4 Tobacco User/Non-Tobacco User 60 948.70 948.7018939PA0010025 Rating Area 4 Tobacco User/Non-Tobacco User 61 982.26 982.2618939PA0010025 Rating Area 4 Tobacco User/Non-Tobacco User 62 1004.28 1004.2818939PA0010025 Rating Area 4 Tobacco User/Non-Tobacco User 63 1031.89 1031.8918939PA0010025 Rating Area 4 Tobacco User/Non-Tobacco User 64 and over 1048.32 1048.32
18939PA0010025 Rating Area 5 Tobacco User/Non-Tobacco User 0-14247.34 247.34
18939PA0010025 Rating Area 5 Tobacco User/Non-Tobacco User 15247.34 247.34
18939PA0010025 Rating Area 5 Tobacco User/Non-Tobacco User 16289.07 289.07
18939PA0010025 Rating Area 5 Tobacco User/Non-Tobacco User 17297.82 297.82
18939PA0010025 Rating Area 5 Tobacco User/Non-Tobacco User 18307.25 307.25
18939PA0010025 Rating Area 5 Tobacco User/Non-Tobacco User 19316.67 316.67
18939PA0010025 Rating Area 5 Tobacco User/Non-Tobacco User 20326.43 326.43
18939PA0010025 Rating Area 5 Tobacco User/Non-Tobacco User 21336.52 336.52
18939PA0010025 Rating Area 5 Tobacco User/Non-Tobacco User 22336.52 336.52
18939PA0010025 Rating Area 5 Tobacco User/Non-Tobacco User 23336.52 336.52
18939PA0010025 Rating Area 5 Tobacco User/Non-Tobacco User 24336.52 336.52
18939PA0010025 Rating Area 5 Tobacco User/Non-Tobacco User 25337.87 337.87
18939PA0010025 Rating Area 5 Tobacco User/Non-Tobacco User 26344.60 344.60
18939PA0010025 Rating Area 5 Tobacco User/Non-Tobacco User 27352.68 352.68
18939PA0010025 Rating Area 5 Tobacco User/Non-Tobacco User 28365.80 365.80
18939PA0010025 Rating Area 5 Tobacco User/Non-Tobacco User 29376.57 376.57
18939PA0010025 Rating Area 5 Tobacco User/Non-Tobacco User 30381.95 381.95
18939PA0010025 Rating Area 5 Tobacco User/Non-Tobacco User 31390.03 390.03
18939PA0010025 Rating Area 5 Tobacco User/Non-Tobacco User 32398.11 398.11
18939PA0010025 Rating Area 5 Tobacco User/Non-Tobacco User 33403.15 403.15
18939PA0010025 Rating Area 5 Tobacco User/Non-Tobacco User 34408.54 408.54
18939PA0010025 Rating Area 5 Tobacco User/Non-Tobacco User 35411.23 411.23
18939PA0010025 Rating Area 5 Tobacco User/Non-Tobacco User 36413.92 413.92
18939PA0010025 Rating Area 5 Tobacco User/Non-Tobacco User 37416.62 416.62
18939PA0010025 Rating Area 5 Tobacco User/Non-Tobacco User 38419.31 419.31
18939PA0010025 Rating Area 5 Tobacco User/Non-Tobacco User 39424.69 424.69
18939PA0010025 Rating Area 5 Tobacco User/Non-Tobacco User 40430.08 430.08
18939PA0010025 Rating Area 5 Tobacco User/Non-Tobacco User 41438.15 438.15
18939PA0010025 Rating Area 5 Tobacco User/Non-Tobacco User 42445.89 445.89
18939PA0010025 Rating Area 5 Tobacco User/Non-Tobacco User 43456.66 456.66
18939PA0010025 Rating Area 5 Tobacco User/Non-Tobacco User 44470.12 470.12
18939PA0010025 Rating Area 5 Tobacco User/Non-Tobacco User 45485.94 485.94
18939PA0010025 Rating Area 5 Tobacco User/Non-Tobacco User 46504.78 504.78
18939PA0010025 Rating Area 5 Tobacco User/Non-Tobacco User 47525.99 525.99
18939PA0010025 Rating Area 5 Tobacco User/Non-Tobacco User 48550.22 550.22
18939PA0010025 Rating Area 5 Tobacco User/Non-Tobacco User 49574.11 574.11
18939PA0010025 Rating Area 5 Tobacco User/Non-Tobacco User 50601.03 601.03
18939PA0010025 Rating Area 5 Tobacco User/Non-Tobacco User 51627.62 627.62
18939PA0010025 Rating Area 5 Tobacco User/Non-Tobacco User 52656.89 656.89
18939PA0010025 Rating Area 5 Tobacco User/Non-Tobacco User 53686.51 686.51
18939PA0010025 Rating Area 5 Tobacco User/Non-Tobacco User 54718.48 718.48
18939PA0010025 Rating Area 5 Tobacco User/Non-Tobacco User 55750.45 750.45
18939PA0010025 Rating Area 5 Tobacco User/Non-Tobacco User 56785.11 785.11
18939PA0010025 Rating Area 5 Tobacco User/Non-Tobacco User 57820.11 820.11
18939PA0010025 Rating Area 5 Tobacco User/Non-Tobacco User 58857.46 857.46
18939PA0010025 Rating Area 5 Tobacco User/Non-Tobacco User 59875.97 875.97
18939PA0010025 Rating Area 5 Tobacco User/Non-Tobacco User 60913.32 913.32
18939PA0010025 Rating Area 5 Tobacco User/Non-Tobacco User 61945.63 945.63
18939PA0010025 Rating Area 5 Tobacco User/Non-Tobacco User 62966.83 966.83
18939PA0010025 Rating Area 5 Tobacco User/Non-Tobacco User 63993.42 993.42
18939PA0010025 Rating Area 5 Tobacco User/Non-Tobacco User 64 and over1009.23 1009.23
18939PA0010025 Rating Area 6 Tobacco User/Non-Tobacco User 0-14311.72 311.72
18939PA0010025 Rating Area 6 Tobacco User/Non-Tobacco User 15311.72 311.72
18939PA0010025 Rating Area 6 Tobacco User/Non-Tobacco User 16364.31 364.31
18939PA0010025 Rating Area 6 Tobacco User/Non-Tobacco User 17375.34 375.34
18939PA0010025 Rating Area 6 Tobacco User/Non-Tobacco User 18387.21 387.21
18939PA0010025 Rating Area 6 Tobacco User/Non-Tobacco User 19399.09 399.09
18939PA0010025 Rating Area 6 Tobacco User/Non-Tobacco User 20411.39 411.39
18939PA0010025 Rating Area 6 Tobacco User/Non-Tobacco User 21424.11 424.11
18939PA0010025 Rating Area 6 Tobacco User/Non-Tobacco User 22424.11 424.11
18939PA0010025 Rating Area 6 Tobacco User/Non-Tobacco User 23424.11 424.11
18939PA0010025 Rating Area 6 Tobacco User/Non-Tobacco User 24424.11 424.11
18939PA0010025 Rating Area 6 Tobacco User/Non-Tobacco User 25425.81 425.81
18939PA0010025 Rating Area 6 Tobacco User/Non-Tobacco User 26434.29 434.29
18939PA0010025 Rating Area 6 Tobacco User/Non-Tobacco User 27444.47 444.47
18939PA0010025 Rating Area 6 Tobacco User/Non-Tobacco User 28461.01 461.01
18939PA0010025 Rating Area 6 Tobacco User/Non-Tobacco User 29474.58 474.58
18939PA0010025 Rating Area 6 Tobacco User/Non-Tobacco User 30481.37 481.37
18939PA0010025 Rating Area 6 Tobacco User/Non-Tobacco User 31491.55 491.55
18939PA0010025 Rating Area 6 Tobacco User/Non-Tobacco User 32501.72 501.72
18939PA0010025 Rating Area 6 Tobacco User/Non-Tobacco User 33508.09 508.09
18939PA0010025 Rating Area 6 Tobacco User/Non-Tobacco User 34514.87 514.87
18939PA0010025 Rating Area 6 Tobacco User/Non-Tobacco User 35518.26 518.26
18939PA0010025 Rating Area 6 Tobacco User/Non-Tobacco User 36521.66 521.66
18939PA0010025 Rating Area 6 Tobacco User/Non-Tobacco User 37525.05 525.05
18939PA0010025 Rating Area 6 Tobacco User/Non-Tobacco User 38528.44 528.44
18939PA0010025 Rating Area 6 Tobacco User/Non-Tobacco User 39535.23 535.23
18939PA0010025 Rating Area 6 Tobacco User/Non-Tobacco User 40542.01 542.01
18939PA0010025 Rating Area 6 Tobacco User/Non-Tobacco User 41552.19 552.19
18939PA0010025 Rating Area 6 Tobacco User/Non-Tobacco User 42561.95 561.95
18939PA0010025 Rating Area 6 Tobacco User/Non-Tobacco User 43575.52 575.52
18939PA0010025 Rating Area 6 Tobacco User/Non-Tobacco User 44592.48 592.48
18939PA0010025 Rating Area 6 Tobacco User/Non-Tobacco User 45612.42 612.42
18939PA0010025 Rating Area 6 Tobacco User/Non-Tobacco User 46636.17 636.17
18939PA0010025 Rating Area 6 Tobacco User/Non-Tobacco User 47662.89 662.89
18939PA0010025 Rating Area 6 Tobacco User/Non-Tobacco User 48693.42 693.42
18939PA0010025 Rating Area 6 Tobacco User/Non-Tobacco User 49723.53 723.53
18939PA0010025 Rating Area 6 Tobacco User/Non-Tobacco User 50757.46 757.46
18939PA0010025 Rating Area 6 Tobacco User/Non-Tobacco User 51790.97 790.97
18939PA0010025 Rating Area 6 Tobacco User/Non-Tobacco User 52827.87 827.87
18939PA0010025 Rating Area 6 Tobacco User/Non-Tobacco User 53865.19 865.19
18939PA0010025 Rating Area 6 Tobacco User/Non-Tobacco User 54905.48 905.48
18939PA0010025 Rating Area 6 Tobacco User/Non-Tobacco User 55945.77 945.77
18939PA0010025 Rating Area 6 Tobacco User/Non-Tobacco User 56989.45 989.45
18939PA0010025 Rating Area 6 Tobacco User/Non-Tobacco User 571033.56 1033.56
18939PA0010025 Rating Area 6 Tobacco User/Non-Tobacco User 581080.64 1080.64
18939PA0010025 Rating Area 6 Tobacco User/Non-Tobacco User 591103.96 1103.96
18939PA0010025 Rating Area 6 Tobacco User/Non-Tobacco User 601151.04 1151.04
18939PA0010025 Rating Area 6 Tobacco User/Non-Tobacco User 611191.75 1191.75
18939PA0010025 Rating Area 6 Tobacco User/Non-Tobacco User 621218.47 1218.47
18939PA0010025 Rating Area 6 Tobacco User/Non-Tobacco User 631251.98 1251.98
18939PA0010025 Rating Area 6 Tobacco User/Non-Tobacco User 64 and over1271.91 1271.91
18939PA0010025 Rating Area 7 Tobacco User/Non-Tobacco User 0-14311.98 311.98
18939PA0010025 Rating Area 7 Tobacco User/Non-Tobacco User 15311.98 311.98
18939PA0010025 Rating Area 7 Tobacco User/Non-Tobacco User 16364.61 364.61
18939PA0010025 Rating Area 7 Tobacco User/Non-Tobacco User 17375.65 375.65
18939PA0010025 Rating Area 7 Tobacco User/Non-Tobacco User 18387.53 387.53
18939PA0010025 Rating Area 7 Tobacco User/Non-Tobacco User 19399.42 399.42
18939PA0010025 Rating Area 7 Tobacco User/Non-Tobacco User 20411.73 411.73
18939PA0010025 Rating Area 7 Tobacco User/Non-Tobacco User 21424.46 424.46
18939PA0010025 Rating Area 7 Tobacco User/Non-Tobacco User 22424.46 424.46
18939PA0010025 Rating Area 7 Tobacco User/Non-Tobacco User 23424.46 424.46
18939PA0010025 Rating Area 7 Tobacco User/Non-Tobacco User 24424.46 424.46
18939PA0010025 Rating Area 7 Tobacco User/Non-Tobacco User 25426.16 426.16
18939PA0010025 Rating Area 7 Tobacco User/Non-Tobacco User 26434.65 434.65
18939PA0010025 Rating Area 7 Tobacco User/Non-Tobacco User 27444.83 444.83
18939PA0010025 Rating Area 7 Tobacco User/Non-Tobacco User 28461.39 461.39
18939PA0010025 Rating Area 7 Tobacco User/Non-Tobacco User 29474.97 474.97
18939PA0010025 Rating Area 7 Tobacco User/Non-Tobacco User 30481.76 481.76
18939PA0010025 Rating Area 7 Tobacco User/Non-Tobacco User 31491.95 491.95
18939PA0010025 Rating Area 7 Tobacco User/Non-Tobacco User 32502.13 502.13
18939PA0010025 Rating Area 7 Tobacco User/Non-Tobacco User 33508.50 508.50
18939PA0010025 Rating Area 7 Tobacco User/Non-Tobacco User 34515.29 515.29
18939PA0010025 Rating Area 7 Tobacco User/Non-Tobacco User 35518.69 518.69
18939PA0010025 Rating Area 7 Tobacco User/Non-Tobacco User 36522.08 522.08
18939PA0010025 Rating Area 7 Tobacco User/Non-Tobacco User 37525.48 525.48
18939PA0010025 Rating Area 7 Tobacco User/Non-Tobacco User 38528.88 528.88
18939PA0010025 Rating Area 7 Tobacco User/Non-Tobacco User 39535.67 535.67
18939PA0010025 Rating Area 7 Tobacco User/Non-Tobacco User 40542.46 542.46
18939PA0010025 Rating Area 7 Tobacco User/Non-Tobacco User 41552.65 552.65
18939PA0010025 Rating Area 7 Tobacco User/Non-Tobacco User 42562.41 562.41
18939PA0010025 Rating Area 7 Tobacco User/Non-Tobacco User 43575.99 575.99
18939PA0010025 Rating Area 7 Tobacco User/Non-Tobacco User 44592.97 592.97
18939PA0010025 Rating Area 7 Tobacco User/Non-Tobacco User 45612.92 612.92
18939PA0010025 Rating Area 7 Tobacco User/Non-Tobacco User 46636.69 636.69
18939PA0010025 Rating Area 7 Tobacco User/Non-Tobacco User 47663.43 663.43
18939PA0010025 Rating Area 7 Tobacco User/Non-Tobacco User 48693.99 693.99
18939PA0010025 Rating Area 7 Tobacco User/Non-Tobacco User 49724.13 724.13
18939PA0010025 Rating Area 7 Tobacco User/Non-Tobacco User 50758.08 758.08
18939PA0010025 Rating Area 7 Tobacco User/Non-Tobacco User 51791.62 791.62
18939PA0010025 Rating Area 7 Tobacco User/Non-Tobacco User 52828.54 828.54
18939PA0010025 Rating Area 7 Tobacco User/Non-Tobacco User 53865.90 865.90
18939PA0010025 Rating Area 7 Tobacco User/Non-Tobacco User 54906.22 906.22
18939PA0010025 Rating Area 7 Tobacco User/Non-Tobacco User 55946.54 946.54
18939PA0010025 Rating Area 7 Tobacco User/Non-Tobacco User 56990.26 990.26
18939PA0010025 Rating Area 7 Tobacco User/Non-Tobacco User 571034.41 1034.41
18939PA0010025 Rating Area 7 Tobacco User/Non-Tobacco User 581081.52 1081.52
18939PA0010025 Rating Area 7 Tobacco User/Non-Tobacco User 591104.87 1104.87
18939PA0010025 Rating Area 7 Tobacco User/Non-Tobacco User 601151.98 1151.98
18939PA0010025 Rating Area 7 Tobacco User/Non-Tobacco User 611192.73 1192.73
18939PA0010025 Rating Area 7 Tobacco User/Non-Tobacco User 621219.47 1219.47
18939PA0010025 Rating Area 7 Tobacco User/Non-Tobacco User 631253.00 1253.00
18939PA0010025 Rating Area 7 Tobacco User/Non-Tobacco User 64 and over1272.95 1272.95
18939PA0010025 Rating Area 8 Tobacco User/Non-Tobacco User 0-14317.11 317.11
18939PA0010025 Rating Area 8 Tobacco User/Non-Tobacco User 15317.11 317.11
18939PA0010025 Rating Area 8 Tobacco User/Non-Tobacco User 16370.61 370.61
18939PA0010025 Rating Area 8 Tobacco User/Non-Tobacco User 17381.83 381.83
18939PA0010025 Rating Area 8 Tobacco User/Non-Tobacco User 18393.91 393.91
18939PA0010025 Rating Area 8 Tobacco User/Non-Tobacco User 19405.99 405.99
18939PA0010025 Rating Area 8 Tobacco User/Non-Tobacco User 20418.50 418.50
18939PA0010025 Rating Area 8 Tobacco User/Non-Tobacco User 21431.45 431.45
18939PA0010025 Rating Area 8 Tobacco User/Non-Tobacco User 22431.45 431.45
18939PA0010025 Rating Area 8 Tobacco User/Non-Tobacco User 23431.45 431.45
18939PA0010025 Rating Area 8 Tobacco User/Non-Tobacco User 24431.45 431.45
18939PA0010025 Rating Area 8 Tobacco User/Non-Tobacco User 25433.17 433.17
18939PA0010025 Rating Area 8 Tobacco User/Non-Tobacco User 26441.80 441.80
18939PA0010025 Rating Area 8 Tobacco User/Non-Tobacco User 27452.16 452.16
18939PA0010025 Rating Area 8 Tobacco User/Non-Tobacco User 28468.98 468.98
18939PA0010025 Rating Area 8 Tobacco User/Non-Tobacco User 29482.79 482.79
18939PA0010025 Rating Area 8 Tobacco User/Non-Tobacco User 30489.69 489.69
18939PA0010025 Rating Area 8 Tobacco User/Non-Tobacco User 31500.05 500.05
18939PA0010025 Rating Area 8 Tobacco User/Non-Tobacco User 32510.40 510.40
18939PA0010025 Rating Area 8 Tobacco User/Non-Tobacco User 33516.87 516.87
18939PA0010025 Rating Area 8 Tobacco User/Non-Tobacco User 34523.78 523.78
18939PA0010025 Rating Area 8 Tobacco User/Non-Tobacco User 35527.23 527.23
18939PA0010025 Rating Area 8 Tobacco User/Non-Tobacco User 36530.68 530.68
18939PA0010025 Rating Area 8 Tobacco User/Non-Tobacco User 37534.13 534.13
18939PA0010025 Rating Area 8 Tobacco User/Non-Tobacco User 38537.58 537.58
18939PA0010025 Rating Area 8 Tobacco User/Non-Tobacco User 39544.49 544.49
18939PA0010025 Rating Area 8 Tobacco User/Non-Tobacco User 40551.39 551.39
18939PA0010025 Rating Area 8 Tobacco User/Non-Tobacco User 41561.75 561.75
18939PA0010025 Rating Area 8 Tobacco User/Non-Tobacco User 42571.67 571.67
18939PA0010025 Rating Area 8 Tobacco User/Non-Tobacco User 43585.47 585.47
18939PA0010025 Rating Area 8 Tobacco User/Non-Tobacco User 44602.73 602.73
18939PA0010025 Rating Area 8 Tobacco User/Non-Tobacco User 45623.01 623.01
18939PA0010025 Rating Area 8 Tobacco User/Non-Tobacco User 46647.17 647.17
18939PA0010025 Rating Area 8 Tobacco User/Non-Tobacco User 47674.35 674.35
18939PA0010025 Rating Area 8 Tobacco User/Non-Tobacco User 48705.42 705.42
18939PA0010025 Rating Area 8 Tobacco User/Non-Tobacco User 49736.05 736.05
18939PA0010025 Rating Area 8 Tobacco User/Non-Tobacco User 50770.57 770.57
18939PA0010025 Rating Area 8 Tobacco User/Non-Tobacco User 51804.65 804.65
18939PA0010025 Rating Area 8 Tobacco User/Non-Tobacco User 52842.19 842.19
18939PA0010025 Rating Area 8 Tobacco User/Non-Tobacco User 53880.15 880.15
18939PA0010025 Rating Area 8 Tobacco User/Non-Tobacco User 54921.14 921.14
18939PA0010025 Rating Area 8 Tobacco User/Non-Tobacco User 55962.13 962.13
18939PA0010025 Rating Area 8 Tobacco User/Non-Tobacco User 561006.57 1006.57
18939PA0010025 Rating Area 8 Tobacco User/Non-Tobacco User 571051.44 1051.44
18939PA0010025 Rating Area 8 Tobacco User/Non-Tobacco User 581099.33 1099.33
18939PA0010025 Rating Area 8 Tobacco User/Non-Tobacco User 591123.06 1123.06
18939PA0010025 Rating Area 8 Tobacco User/Non-Tobacco User 601170.95 1170.95
18939PA0010025 Rating Area 8 Tobacco User/Non-Tobacco User 611212.37 1212.37
18939PA0010025 Rating Area 8 Tobacco User/Non-Tobacco User 621239.55 1239.55
18939PA0010025 Rating Area 8 Tobacco User/Non-Tobacco User 631273.63 1273.63
18939PA0010025 Rating Area 8 Tobacco User/Non-Tobacco User 64 and over1293.91 1293.91
18939PA0010025 Rating Area 9 Tobacco User/Non-Tobacco User 0-14295.94 295.94
18939PA0010025 Rating Area 9 Tobacco User/Non-Tobacco User 15295.94 295.94
18939PA0010025 Rating Area 9 Tobacco User/Non-Tobacco User 16345.87 345.87
18939PA0010025 Rating Area 9 Tobacco User/Non-Tobacco User 17356.34 356.34
18939PA0010025 Rating Area 9 Tobacco User/Non-Tobacco User 18367.62 367.62
18939PA0010025 Rating Area 9 Tobacco User/Non-Tobacco User 19378.89 378.89
18939PA0010025 Rating Area 9 Tobacco User/Non-Tobacco User 20390.57 390.57
18939PA0010025 Rating Area 9 Tobacco User/Non-Tobacco User 21402.65 402.65
18939PA0010025 Rating Area 9 Tobacco User/Non-Tobacco User 22402.65 402.65
18939PA0010025 Rating Area 9 Tobacco User/Non-Tobacco User 23402.65 402.65
18939PA0010025 Rating Area 9 Tobacco User/Non-Tobacco User 24402.65 402.65
18939PA0010025 Rating Area 9 Tobacco User/Non-Tobacco User 25404.26 404.26
18939PA0010025 Rating Area 9 Tobacco User/Non-Tobacco User 26412.31 412.31
18939PA0010025 Rating Area 9 Tobacco User/Non-Tobacco User 27421.97 421.97
18939PA0010025 Rating Area 9 Tobacco User/Non-Tobacco User 28437.68 437.68
18939PA0010025 Rating Area 9 Tobacco User/Non-Tobacco User 29450.56 450.56
18939PA0010025 Rating Area 9 Tobacco User/Non-Tobacco User 30457.00 457.00
18939PA0010025 Rating Area 9 Tobacco User/Non-Tobacco User 31466.67 466.67
18939PA0010025 Rating Area 9 Tobacco User/Non-Tobacco User 32476.33 476.33
18939PA0010025 Rating Area 9 Tobacco User/Non-Tobacco User 33482.37 482.37
18939PA0010025 Rating Area 9 Tobacco User/Non-Tobacco User 34488.81 488.81
18939PA0010025 Rating Area 9 Tobacco User/Non-Tobacco User 35492.03 492.03
18939PA0010025 Rating Area 9 Tobacco User/Non-Tobacco User 36495.25 495.25
18939PA0010025 Rating Area 9 Tobacco User/Non-Tobacco User 37498.47 498.47
18939PA0010025 Rating Area 9 Tobacco User/Non-Tobacco User 38501.70 501.70
18939PA0010025 Rating Area 9 Tobacco User/Non-Tobacco User 39508.14 508.14
18939PA0010025 Rating Area 9 Tobacco User/Non-Tobacco User 40514.58 514.58
18939PA0010025 Rating Area 9 Tobacco User/Non-Tobacco User 41524.24 524.24
18939PA0010025 Rating Area 9 Tobacco User/Non-Tobacco User 42533.50 533.50
18939PA0010025 Rating Area 9 Tobacco User/Non-Tobacco User 43546.39 546.39
18939PA0010025 Rating Area 9 Tobacco User/Non-Tobacco User 44562.50 562.50
18939PA0010025 Rating Area 9 Tobacco User/Non-Tobacco User 45581.42 581.42
18939PA0010025 Rating Area 9 Tobacco User/Non-Tobacco User 46603.97 603.97
18939PA0010025 Rating Area 9 Tobacco User/Non-Tobacco User 47629.33 629.33
18939PA0010025 Rating Area 9 Tobacco User/Non-Tobacco User 48658.32 658.32
18939PA0010025 Rating Area 9 Tobacco User/Non-Tobacco User 49686.91 686.91
18939PA0010025 Rating Area 9 Tobacco User/Non-Tobacco User 50719.12 719.12
18939PA0010025 Rating Area 9 Tobacco User/Non-Tobacco User 51750.93 750.93
18939PA0010025 Rating Area 9 Tobacco User/Non-Tobacco User 52785.96 785.96
18939PA0010025 Rating Area 9 Tobacco User/Non-Tobacco User 53821.40 821.40
18939PA0010025 Rating Area 9 Tobacco User/Non-Tobacco User 54859.65 859.65
18939PA0010025 Rating Area 9 Tobacco User/Non-Tobacco User 55897.90 897.90
18939PA0010025 Rating Area 9 Tobacco User/Non-Tobacco User 56939.37 939.37
18939PA0010025 Rating Area 9 Tobacco User/Non-Tobacco User 57981.25 981.25
18939PA0010025 Rating Area 9 Tobacco User/Non-Tobacco User 581025.94 1025.94
18939PA0010025 Rating Area 9 Tobacco User/Non-Tobacco User 591048.09 1048.09
18939PA0010025 Rating Area 9 Tobacco User/Non-Tobacco User 601092.78 1092.78
18939PA0010025 Rating Area 9 Tobacco User/Non-Tobacco User 611131.43 1131.43
18939PA0010025 Rating Area 9 Tobacco User/Non-Tobacco User 621156.80 1156.80
18939PA0010025 Rating Area 9 Tobacco User/Non-Tobacco User 631188.61 1188.61
18939PA0010025 Rating Area 9 Tobacco User/Non-Tobacco User 64 and over1207.53 1207.53
2018 Rates Table Template v7.1 All fields with an asterisk ( * ) are required. To validate press Validate button or Ctrl + Shift + I. To finalize, press Finalize button or Ctrl + Shift + F.
If macros are disabled, press and hold the ALT key and press t If you are in a community rating state, select Family-Tier Rates under Rating Method and fill in all columns.If you are not in a community rating state, select Age-Based Rates under Rating Method and provide an Individual Rate for every age band.If Tobacco is Tobacco User/Non-Tobacco User, you must give a rate for Tobacco Use and Non-Tobacco Use.To add a new sheet, press the Add Sheet button, or Ctrl + Shift + H. All plans must have the same dates on a sheet.
Plan ID* Rating Area ID* Tobacco* Age* Individual Rate* Individual Tobacco Rate*
Required:Enter the 14-character Plan ID
Required:Select the Rating Area ID
Required:Select if Tobacco use of subscriber is used to
determine if a person is eligible for a rate from a plan
Required:Select the age of a subscriber eligible for the
rate
Required:Enter the rate of an Individual Non-Tobacco or
No Preference enrollee on a plan
Required:Enter the rate of an Individual tobacco enrollee
on a plan
18939PA0010025 Rating Area 1 Tobacco User/Non-Tobacco User 0-14 256.16 256.1618939PA0010025 Rating Area 1 Tobacco User/Non-Tobacco User 15 256.16 256.1618939PA0010025 Rating Area 1 Tobacco User/Non-Tobacco User 16 299.37 299.3718939PA0010025 Rating Area 1 Tobacco User/Non-Tobacco User 17 308.43 308.4318939PA0010025 Rating Area 1 Tobacco User/Non-Tobacco User 18 318.19 318.1918939PA0010025 Rating Area 1 Tobacco User/Non-Tobacco User 19 327.95 327.9518939PA0010025 Rating Area 1 Tobacco User/Non-Tobacco User 20 338.06 338.0618939PA0010025 Rating Area 1 Tobacco User/Non-Tobacco User 21 348.51 348.5118939PA0010025 Rating Area 1 Tobacco User/Non-Tobacco User 22 348.51 348.5118939PA0010025 Rating Area 1 Tobacco User/Non-Tobacco User 23 348.51 348.5118939PA0010025 Rating Area 1 Tobacco User/Non-Tobacco User 24 348.51 348.5118939PA0010025 Rating Area 1 Tobacco User/Non-Tobacco User 25 349.91 349.9118939PA0010025 Rating Area 1 Tobacco User/Non-Tobacco User 26 356.88 356.8818939PA0010025 Rating Area 1 Tobacco User/Non-Tobacco User 27 365.24 365.2418939PA0010025 Rating Area 1 Tobacco User/Non-Tobacco User 28 378.83 378.8318939PA0010025 Rating Area 1 Tobacco User/Non-Tobacco User 29 389.99 389.9918939PA0010025 Rating Area 1 Tobacco User/Non-Tobacco User 30 395.56 395.5618939PA0010025 Rating Area 1 Tobacco User/Non-Tobacco User 31 403.93 403.9318939PA0010025 Rating Area 1 Tobacco User/Non-Tobacco User 32 412.29 412.2918939PA0010025 Rating Area 1 Tobacco User/Non-Tobacco User 33 417.52 417.5218939PA0010025 Rating Area 1 Tobacco User/Non-Tobacco User 34 423.10 423.1018939PA0010025 Rating Area 1 Tobacco User/Non-Tobacco User 35 425.88 425.8818939PA0010025 Rating Area 1 Tobacco User/Non-Tobacco User 36 428.67 428.6718939PA0010025 Rating Area 1 Tobacco User/Non-Tobacco User 37 431.46 431.4618939PA0010025 Rating Area 1 Tobacco User/Non-Tobacco User 38 434.25 434.2518939PA0010025 Rating Area 1 Tobacco User/Non-Tobacco User 39 439.82 439.8218939PA0010025 Rating Area 1 Tobacco User/Non-Tobacco User 40 445.40 445.4018939PA0010025 Rating Area 1 Tobacco User/Non-Tobacco User 41 453.76 453.7618939PA0010025 Rating Area 1 Tobacco User/Non-Tobacco User 42 461.78 461.7818939PA0010025 Rating Area 1 Tobacco User/Non-Tobacco User 43 472.93 472.9318939PA0010025 Rating Area 1 Tobacco User/Non-Tobacco User 44 486.87 486.8718939PA0010025 Rating Area 1 Tobacco User/Non-Tobacco User 45 503.25 503.2518939PA0010025 Rating Area 1 Tobacco User/Non-Tobacco User 46 522.77 522.7718939PA0010025 Rating Area 1 Tobacco User/Non-Tobacco User 47 544.73 544.7318939PA0010025 Rating Area 1 Tobacco User/Non-Tobacco User 48 569.82 569.8218939PA0010025 Rating Area 1 Tobacco User/Non-Tobacco User 49 594.56 594.5618939PA0010025 Rating Area 1 Tobacco User/Non-Tobacco User 50 622.44 622.4418939PA0010025 Rating Area 1 Tobacco User/Non-Tobacco User 51 649.98 649.9818939PA0010025 Rating Area 1 Tobacco User/Non-Tobacco User 52 680.30 680.3018939PA0010025 Rating Area 1 Tobacco User/Non-Tobacco User 53 710.97 710.9718939PA0010025 Rating Area 1 Tobacco User/Non-Tobacco User 54 744.08 744.0818939PA0010025 Rating Area 1 Tobacco User/Non-Tobacco User 55 777.18 777.1818939PA0010025 Rating Area 1 Tobacco User/Non-Tobacco User 56 813.08 813.0818939PA0010025 Rating Area 1 Tobacco User/Non-Tobacco User 57 849.33 849.3318939PA0010025 Rating Area 1 Tobacco User/Non-Tobacco User 58 888.01 888.0118939PA0010025 Rating Area 1 Tobacco User/Non-Tobacco User 59 907.18 907.1818939PA0010025 Rating Area 1 Tobacco User/Non-Tobacco User 60 945.86 945.8618939PA0010025 Rating Area 1 Tobacco User/Non-Tobacco User 61 979.32 979.3218939PA0010025 Rating Area 1 Tobacco User/Non-Tobacco User 62 1001.28 1001.2818939PA0010025 Rating Area 1 Tobacco User/Non-Tobacco User 63 1028.81 1028.8118939PA0010025 Rating Area 1 Tobacco User/Non-Tobacco User 64 and over 1045.19 1045.1918939PA0010025 Rating Area 2 Tobacco User/Non-Tobacco User 0-14 258.37 258.3718939PA0010025 Rating Area 2 Tobacco User/Non-Tobacco User 15 258.37 258.3718939PA0010025 Rating Area 2 Tobacco User/Non-Tobacco User 16 301.96 301.9618939PA0010025 Rating Area 2 Tobacco User/Non-Tobacco User 17 311.10 311.1018939PA0010025 Rating Area 2 Tobacco User/Non-Tobacco User 18 320.95 320.9518939PA0010025 Rating Area 2 Tobacco User/Non-Tobacco User 19 330.79 330.7918939PA0010025 Rating Area 2 Tobacco User/Non-Tobacco User 20 340.98 340.9818939PA0010025 Rating Area 2 Tobacco User/Non-Tobacco User 21 351.53 351.5318939PA0010025 Rating Area 2 Tobacco User/Non-Tobacco User 22 351.53 351.5318939PA0010025 Rating Area 2 Tobacco User/Non-Tobacco User 23 351.53 351.5318939PA0010025 Rating Area 2 Tobacco User/Non-Tobacco User 24 351.53 351.53
18939PA0010025 Rating Area 2 Tobacco User/Non-Tobacco User 25 352.94 352.9418939PA0010025 Rating Area 2 Tobacco User/Non-Tobacco User 26 359.97 359.9718939PA0010025 Rating Area 2 Tobacco User/Non-Tobacco User 27 368.40 368.4018939PA0010025 Rating Area 2 Tobacco User/Non-Tobacco User 28 382.11 382.1118939PA0010025 Rating Area 2 Tobacco User/Non-Tobacco User 29 393.36 393.3618939PA0010025 Rating Area 2 Tobacco User/Non-Tobacco User 30 398.99 398.9918939PA0010025 Rating Area 2 Tobacco User/Non-Tobacco User 31 407.42 407.4218939PA0010025 Rating Area 2 Tobacco User/Non-Tobacco User 32 415.86 415.8618939PA0010025 Rating Area 2 Tobacco User/Non-Tobacco User 33 421.13 421.1318939PA0010025 Rating Area 2 Tobacco User/Non-Tobacco User 34 426.76 426.7618939PA0010025 Rating Area 2 Tobacco User/Non-Tobacco User 35 429.57 429.5718939PA0010025 Rating Area 2 Tobacco User/Non-Tobacco User 36 432.38 432.3818939PA0010025 Rating Area 2 Tobacco User/Non-Tobacco User 37 435.19 435.1918939PA0010025 Rating Area 2 Tobacco User/Non-Tobacco User 38 438.01 438.0118939PA0010025 Rating Area 2 Tobacco User/Non-Tobacco User 39 443.63 443.6318939PA0010025 Rating Area 2 Tobacco User/Non-Tobacco User 40 449.25 449.2518939PA0010025 Rating Area 2 Tobacco User/Non-Tobacco User 41 457.69 457.6918939PA0010025 Rating Area 2 Tobacco User/Non-Tobacco User 42 465.78 465.7818939PA0010025 Rating Area 2 Tobacco User/Non-Tobacco User 43 477.02 477.0218939PA0010025 Rating Area 2 Tobacco User/Non-Tobacco User 44 491.09 491.0918939PA0010025 Rating Area 2 Tobacco User/Non-Tobacco User 45 507.61 507.6118939PA0010025 Rating Area 2 Tobacco User/Non-Tobacco User 46 527.29 527.2918939PA0010025 Rating Area 2 Tobacco User/Non-Tobacco User 47 549.44 549.4418939PA0010025 Rating Area 2 Tobacco User/Non-Tobacco User 48 574.75 574.7518939PA0010025 Rating Area 2 Tobacco User/Non-Tobacco User 49 599.71 599.7118939PA0010025 Rating Area 2 Tobacco User/Non-Tobacco User 50 627.83 627.8318939PA0010025 Rating Area 2 Tobacco User/Non-Tobacco User 51 655.60 655.6018939PA0010025 Rating Area 2 Tobacco User/Non-Tobacco User 52 686.18 686.1818939PA0010025 Rating Area 2 Tobacco User/Non-Tobacco User 53 717.12 717.1218939PA0010025 Rating Area 2 Tobacco User/Non-Tobacco User 54 750.51 750.5118939PA0010025 Rating Area 2 Tobacco User/Non-Tobacco User 55 783.91 783.9118939PA0010025 Rating Area 2 Tobacco User/Non-Tobacco User 56 820.12 820.1218939PA0010025 Rating Area 2 Tobacco User/Non-Tobacco User 57 856.68 856.6818939PA0010025 Rating Area 2 Tobacco User/Non-Tobacco User 58 895.70 895.7018939PA0010025 Rating Area 2 Tobacco User/Non-Tobacco User 59 915.03 915.0318939PA0010025 Rating Area 2 Tobacco User/Non-Tobacco User 60 954.05 954.0518939PA0010025 Rating Area 2 Tobacco User/Non-Tobacco User 61 987.80 987.8018939PA0010025 Rating Area 2 Tobacco User/Non-Tobacco User 62 1009.94 1009.9418939PA0010025 Rating Area 2 Tobacco User/Non-Tobacco User 63 1037.71 1037.7118939PA0010025 Rating Area 2 Tobacco User/Non-Tobacco User 64 and over 1054.24 1054.2418939PA0010025 Rating Area 3 Tobacco User/Non-Tobacco User 0-14 325.71 325.7118939PA0010025 Rating Area 3 Tobacco User/Non-Tobacco User 15 325.71 325.7118939PA0010025 Rating Area 3 Tobacco User/Non-Tobacco User 16 380.66 380.6618939PA0010025 Rating Area 3 Tobacco User/Non-Tobacco User 17 392.19 392.1918939PA0010025 Rating Area 3 Tobacco User/Non-Tobacco User 18 404.59 404.5918939PA0010025 Rating Area 3 Tobacco User/Non-Tobacco User 19 417.00 417.0018939PA0010025 Rating Area 3 Tobacco User/Non-Tobacco User 20 429.85 429.8518939PA0010025 Rating Area 3 Tobacco User/Non-Tobacco User 21 443.15 443.1518939PA0010025 Rating Area 3 Tobacco User/Non-Tobacco User 22 443.15 443.1518939PA0010025 Rating Area 3 Tobacco User/Non-Tobacco User 23 443.15 443.1518939PA0010025 Rating Area 3 Tobacco User/Non-Tobacco User 24 443.15 443.1518939PA0010025 Rating Area 3 Tobacco User/Non-Tobacco User 25 444.92 444.9218939PA0010025 Rating Area 3 Tobacco User/Non-Tobacco User 26 453.78 453.7818939PA0010025 Rating Area 3 Tobacco User/Non-Tobacco User 27 464.42 464.4218939PA0010025 Rating Area 3 Tobacco User/Non-Tobacco User 28 481.70 481.7018939PA0010025 Rating Area 3 Tobacco User/Non-Tobacco User 29 495.88 495.8818939PA0010025 Rating Area 3 Tobacco User/Non-Tobacco User 30 502.97 502.9718939PA0010025 Rating Area 3 Tobacco User/Non-Tobacco User 31 513.61 513.6118939PA0010025 Rating Area 3 Tobacco User/Non-Tobacco User 32 524.24 524.2418939PA0010025 Rating Area 3 Tobacco User/Non-Tobacco User 33 530.89 530.8918939PA0010025 Rating Area 3 Tobacco User/Non-Tobacco User 34 537.98 537.9818939PA0010025 Rating Area 3 Tobacco User/Non-Tobacco User 35 541.53 541.5318939PA0010025 Rating Area 3 Tobacco User/Non-Tobacco User 36 545.07 545.0718939PA0010025 Rating Area 3 Tobacco User/Non-Tobacco User 37 548.62 548.6218939PA0010025 Rating Area 3 Tobacco User/Non-Tobacco User 38 552.16 552.1618939PA0010025 Rating Area 3 Tobacco User/Non-Tobacco User 39 559.25 559.2518939PA0010025 Rating Area 3 Tobacco User/Non-Tobacco User 40 566.34 566.3418939PA0010025 Rating Area 3 Tobacco User/Non-Tobacco User 41 576.98 576.9818939PA0010025 Rating Area 3 Tobacco User/Non-Tobacco User 42 587.17 587.1718939PA0010025 Rating Area 3 Tobacco User/Non-Tobacco User 43 601.35 601.3518939PA0010025 Rating Area 3 Tobacco User/Non-Tobacco User 44 619.08 619.0818939PA0010025 Rating Area 3 Tobacco User/Non-Tobacco User 45 639.90 639.9018939PA0010025 Rating Area 3 Tobacco User/Non-Tobacco User 46 664.72 664.7218939PA0010025 Rating Area 3 Tobacco User/Non-Tobacco User 47 692.64 692.6418939PA0010025 Rating Area 3 Tobacco User/Non-Tobacco User 48 724.55 724.5518939PA0010025 Rating Area 3 Tobacco User/Non-Tobacco User 49 756.01 756.0118939PA0010025 Rating Area 3 Tobacco User/Non-Tobacco User 50 791.46 791.4618939PA0010025 Rating Area 3 Tobacco User/Non-Tobacco User 51 826.47 826.4718939PA0010025 Rating Area 3 Tobacco User/Non-Tobacco User 52 865.02 865.0218939PA0010025 Rating Area 3 Tobacco User/Non-Tobacco User 53 904.02 904.0218939PA0010025 Rating Area 3 Tobacco User/Non-Tobacco User 54 946.12 946.1218939PA0010025 Rating Area 3 Tobacco User/Non-Tobacco User 55 988.22 988.22
18939PA0010025 Rating Area 3 Tobacco User/Non-Tobacco User 56 1033.86 1033.8618939PA0010025 Rating Area 3 Tobacco User/Non-Tobacco User 57 1079.95 1079.9518939PA0010025 Rating Area 3 Tobacco User/Non-Tobacco User 58 1129.14 1129.1418939PA0010025 Rating Area 3 Tobacco User/Non-Tobacco User 59 1153.51 1153.5118939PA0010025 Rating Area 3 Tobacco User/Non-Tobacco User 60 1202.70 1202.7018939PA0010025 Rating Area 3 Tobacco User/Non-Tobacco User 61 1245.24 1245.2418939PA0010025 Rating Area 3 Tobacco User/Non-Tobacco User 62 1273.16 1273.1618939PA0010025 Rating Area 3 Tobacco User/Non-Tobacco User 63 1308.17 1308.1718939PA0010025 Rating Area 3 Tobacco User/Non-Tobacco User 64 and over 1329.00 1329.0018939PA0010025 Rating Area 4 Tobacco User/Non-Tobacco User 0-14 264.37 264.3718939PA0010025 Rating Area 4 Tobacco User/Non-Tobacco User 15 264.37 264.3718939PA0010025 Rating Area 4 Tobacco User/Non-Tobacco User 16 308.97 308.9718939PA0010025 Rating Area 4 Tobacco User/Non-Tobacco User 17 318.32 318.3218939PA0010025 Rating Area 4 Tobacco User/Non-Tobacco User 18 328.40 328.4018939PA0010025 Rating Area 4 Tobacco User/Non-Tobacco User 19 338.47 338.4718939PA0010025 Rating Area 4 Tobacco User/Non-Tobacco User 20 348.90 348.9018939PA0010025 Rating Area 4 Tobacco User/Non-Tobacco User 21 359.69 359.6918939PA0010025 Rating Area 4 Tobacco User/Non-Tobacco User 22 359.69 359.6918939PA0010025 Rating Area 4 Tobacco User/Non-Tobacco User 23 359.69 359.6918939PA0010025 Rating Area 4 Tobacco User/Non-Tobacco User 24 359.69 359.6918939PA0010025 Rating Area 4 Tobacco User/Non-Tobacco User 25 361.13 361.1318939PA0010025 Rating Area 4 Tobacco User/Non-Tobacco User 26 368.32 368.3218939PA0010025 Rating Area 4 Tobacco User/Non-Tobacco User 27 376.95 376.9518939PA0010025 Rating Area 4 Tobacco User/Non-Tobacco User 28 390.98 390.9818939PA0010025 Rating Area 4 Tobacco User/Non-Tobacco User 29 402.49 402.4918939PA0010025 Rating Area 4 Tobacco User/Non-Tobacco User 30 408.25 408.2518939PA0010025 Rating Area 4 Tobacco User/Non-Tobacco User 31 416.88 416.8818939PA0010025 Rating Area 4 Tobacco User/Non-Tobacco User 32 425.51 425.5118939PA0010025 Rating Area 4 Tobacco User/Non-Tobacco User 33 430.91 430.9118939PA0010025 Rating Area 4 Tobacco User/Non-Tobacco User 34 436.66 436.6618939PA0010025 Rating Area 4 Tobacco User/Non-Tobacco User 35 439.54 439.5418939PA0010025 Rating Area 4 Tobacco User/Non-Tobacco User 36 442.42 442.4218939PA0010025 Rating Area 4 Tobacco User/Non-Tobacco User 37 445.29 445.2918939PA0010025 Rating Area 4 Tobacco User/Non-Tobacco User 38 448.17 448.1718939PA0010025 Rating Area 4 Tobacco User/Non-Tobacco User 39 453.93 453.9318939PA0010025 Rating Area 4 Tobacco User/Non-Tobacco User 40 459.68 459.6818939PA0010025 Rating Area 4 Tobacco User/Non-Tobacco User 41 468.31 468.3118939PA0010025 Rating Area 4 Tobacco User/Non-Tobacco User 42 476.59 476.5918939PA0010025 Rating Area 4 Tobacco User/Non-Tobacco User 43 488.10 488.1018939PA0010025 Rating Area 4 Tobacco User/Non-Tobacco User 44 502.49 502.4918939PA0010025 Rating Area 4 Tobacco User/Non-Tobacco User 45 519.39 519.3918939PA0010025 Rating Area 4 Tobacco User/Non-Tobacco User 46 539.53 539.5318939PA0010025 Rating Area 4 Tobacco User/Non-Tobacco User 47 562.19 562.1918939PA0010025 Rating Area 4 Tobacco User/Non-Tobacco User 48 588.09 588.0918939PA0010025 Rating Area 4 Tobacco User/Non-Tobacco User 49 613.63 613.6318939PA0010025 Rating Area 4 Tobacco User/Non-Tobacco User 50 642.40 642.4018939PA0010025 Rating Area 4 Tobacco User/Non-Tobacco User 51 670.82 670.8218939PA0010025 Rating Area 4 Tobacco User/Non-Tobacco User 52 702.11 702.1118939PA0010025 Rating Area 4 Tobacco User/Non-Tobacco User 53 733.77 733.7718939PA0010025 Rating Area 4 Tobacco User/Non-Tobacco User 54 767.94 767.9418939PA0010025 Rating Area 4 Tobacco User/Non-Tobacco User 55 802.11 802.1118939PA0010025 Rating Area 4 Tobacco User/Non-Tobacco User 56 839.15 839.1518939PA0010025 Rating Area 4 Tobacco User/Non-Tobacco User 57 876.56 876.5618939PA0010025 Rating Area 4 Tobacco User/Non-Tobacco User 58 916.49 916.4918939PA0010025 Rating Area 4 Tobacco User/Non-Tobacco User 59 936.27 936.2718939PA0010025 Rating Area 4 Tobacco User/Non-Tobacco User 60 976.20 976.2018939PA0010025 Rating Area 4 Tobacco User/Non-Tobacco User 61 1010.73 1010.7318939PA0010025 Rating Area 4 Tobacco User/Non-Tobacco User 62 1033.39 1033.3918939PA0010025 Rating Area 4 Tobacco User/Non-Tobacco User 63 1061.80 1061.8018939PA0010025 Rating Area 4 Tobacco User/Non-Tobacco User 64 and over 1078.71 1078.71
18939PA0010025 Rating Area 5 Tobacco User/Non-Tobacco User 0-14254.51 254.51
18939PA0010025 Rating Area 5 Tobacco User/Non-Tobacco User 15254.51 254.51
18939PA0010025 Rating Area 5 Tobacco User/Non-Tobacco User 16297.45 297.45
18939PA0010025 Rating Area 5 Tobacco User/Non-Tobacco User 17306.45 306.45
18939PA0010025 Rating Area 5 Tobacco User/Non-Tobacco User 18316.15 316.15
18939PA0010025 Rating Area 5 Tobacco User/Non-Tobacco User 19325.85 325.85
18939PA0010025 Rating Area 5 Tobacco User/Non-Tobacco User 20335.89 335.89
18939PA0010025 Rating Area 5 Tobacco User/Non-Tobacco User 21346.28 346.28
18939PA0010025 Rating Area 5 Tobacco User/Non-Tobacco User 22346.28 346.28
18939PA0010025 Rating Area 5 Tobacco User/Non-Tobacco User 23346.28 346.28
18939PA0010025 Rating Area 5 Tobacco User/Non-Tobacco User 24346.28 346.28
18939PA0010025 Rating Area 5 Tobacco User/Non-Tobacco User 25347.66 347.66
18939PA0010025 Rating Area 5 Tobacco User/Non-Tobacco User 26354.59 354.59
18939PA0010025 Rating Area 5 Tobacco User/Non-Tobacco User 27362.90 362.90
18939PA0010025 Rating Area 5 Tobacco User/Non-Tobacco User 28376.40 376.40
18939PA0010025 Rating Area 5 Tobacco User/Non-Tobacco User 29387.48 387.48
18939PA0010025 Rating Area 5 Tobacco User/Non-Tobacco User 30393.02 393.02
18939PA0010025 Rating Area 5 Tobacco User/Non-Tobacco User 31401.33 401.33
18939PA0010025 Rating Area 5 Tobacco User/Non-Tobacco User 32409.65 409.65
18939PA0010025 Rating Area 5 Tobacco User/Non-Tobacco User 33414.84 414.84
18939PA0010025 Rating Area 5 Tobacco User/Non-Tobacco User 34420.38 420.38
18939PA0010025 Rating Area 5 Tobacco User/Non-Tobacco User 35423.15 423.15
18939PA0010025 Rating Area 5 Tobacco User/Non-Tobacco User 36425.92 425.92
18939PA0010025 Rating Area 5 Tobacco User/Non-Tobacco User 37428.69 428.69
18939PA0010025 Rating Area 5 Tobacco User/Non-Tobacco User 38431.46 431.46
18939PA0010025 Rating Area 5 Tobacco User/Non-Tobacco User 39437.00 437.00
18939PA0010025 Rating Area 5 Tobacco User/Non-Tobacco User 40442.54 442.54
18939PA0010025 Rating Area 5 Tobacco User/Non-Tobacco User 41450.85 450.85
18939PA0010025 Rating Area 5 Tobacco User/Non-Tobacco User 42458.82 458.82
18939PA0010025 Rating Area 5 Tobacco User/Non-Tobacco User 43469.90 469.90
18939PA0010025 Rating Area 5 Tobacco User/Non-Tobacco User 44483.75 483.75
18939PA0010025 Rating Area 5 Tobacco User/Non-Tobacco User 45500.02 500.02
18939PA0010025 Rating Area 5 Tobacco User/Non-Tobacco User 46519.41 519.41
18939PA0010025 Rating Area 5 Tobacco User/Non-Tobacco User 47541.23 541.23
18939PA0010025 Rating Area 5 Tobacco User/Non-Tobacco User 48566.16 566.16
18939PA0010025 Rating Area 5 Tobacco User/Non-Tobacco User 49590.75 590.75
18939PA0010025 Rating Area 5 Tobacco User/Non-Tobacco User 50618.45 618.45
18939PA0010025 Rating Area 5 Tobacco User/Non-Tobacco User 51645.81 645.81
18939PA0010025 Rating Area 5 Tobacco User/Non-Tobacco User 52675.93 675.93
18939PA0010025 Rating Area 5 Tobacco User/Non-Tobacco User 53706.40 706.40
18939PA0010025 Rating Area 5 Tobacco User/Non-Tobacco User 54739.30 739.30
18939PA0010025 Rating Area 5 Tobacco User/Non-Tobacco User 55772.20 772.20
18939PA0010025 Rating Area 5 Tobacco User/Non-Tobacco User 56807.86 807.86
18939PA0010025 Rating Area 5 Tobacco User/Non-Tobacco User 57843.88 843.88
18939PA0010025 Rating Area 5 Tobacco User/Non-Tobacco User 58882.31 882.31
18939PA0010025 Rating Area 5 Tobacco User/Non-Tobacco User 59901.36 901.36
18939PA0010025 Rating Area 5 Tobacco User/Non-Tobacco User 60939.79 939.79
18939PA0010025 Rating Area 5 Tobacco User/Non-Tobacco User 61973.04 973.04
18939PA0010025 Rating Area 5 Tobacco User/Non-Tobacco User 62994.85 994.85
18939PA0010025 Rating Area 5 Tobacco User/Non-Tobacco User 631022.21 1022.21
18939PA0010025 Rating Area 5 Tobacco User/Non-Tobacco User 64 and over1038.48 1038.48
18939PA0010025 Rating Area 6 Tobacco User/Non-Tobacco User 0-14320.76 320.76
18939PA0010025 Rating Area 6 Tobacco User/Non-Tobacco User 15320.76 320.76
18939PA0010025 Rating Area 6 Tobacco User/Non-Tobacco User 16374.87 374.87
18939PA0010025 Rating Area 6 Tobacco User/Non-Tobacco User 17386.22 386.22
18939PA0010025 Rating Area 6 Tobacco User/Non-Tobacco User 18398.44 398.44
18939PA0010025 Rating Area 6 Tobacco User/Non-Tobacco User 19410.66 410.66
18939PA0010025 Rating Area 6 Tobacco User/Non-Tobacco User 20423.31 423.31
18939PA0010025 Rating Area 6 Tobacco User/Non-Tobacco User 21436.40 436.40
18939PA0010025 Rating Area 6 Tobacco User/Non-Tobacco User 22436.40 436.40
18939PA0010025 Rating Area 6 Tobacco User/Non-Tobacco User 23436.40 436.40
18939PA0010025 Rating Area 6 Tobacco User/Non-Tobacco User 24436.40 436.40
18939PA0010025 Rating Area 6 Tobacco User/Non-Tobacco User 25438.15 438.15
18939PA0010025 Rating Area 6 Tobacco User/Non-Tobacco User 26446.88 446.88
18939PA0010025 Rating Area 6 Tobacco User/Non-Tobacco User 27457.35 457.35
18939PA0010025 Rating Area 6 Tobacco User/Non-Tobacco User 28474.37 474.37
18939PA0010025 Rating Area 6 Tobacco User/Non-Tobacco User 29488.34 488.34
18939PA0010025 Rating Area 6 Tobacco User/Non-Tobacco User 30495.32 495.32
18939PA0010025 Rating Area 6 Tobacco User/Non-Tobacco User 31505.79 505.79
18939PA0010025 Rating Area 6 Tobacco User/Non-Tobacco User 32516.27 516.27
18939PA0010025 Rating Area 6 Tobacco User/Non-Tobacco User 33522.81 522.81
18939PA0010025 Rating Area 6 Tobacco User/Non-Tobacco User 34529.79 529.79
18939PA0010025 Rating Area 6 Tobacco User/Non-Tobacco User 35533.28 533.28
18939PA0010025 Rating Area 6 Tobacco User/Non-Tobacco User 36536.78 536.78
18939PA0010025 Rating Area 6 Tobacco User/Non-Tobacco User 37540.27 540.27
18939PA0010025 Rating Area 6 Tobacco User/Non-Tobacco User 38543.76 543.76
18939PA0010025 Rating Area 6 Tobacco User/Non-Tobacco User 39550.74 550.74
18939PA0010025 Rating Area 6 Tobacco User/Non-Tobacco User 40557.72 557.72
18939PA0010025 Rating Area 6 Tobacco User/Non-Tobacco User 41568.20 568.20
18939PA0010025 Rating Area 6 Tobacco User/Non-Tobacco User 42578.23 578.23
18939PA0010025 Rating Area 6 Tobacco User/Non-Tobacco User 43592.20 592.20
18939PA0010025 Rating Area 6 Tobacco User/Non-Tobacco User 44609.66 609.66
18939PA0010025 Rating Area 6 Tobacco User/Non-Tobacco User 45630.17 630.17
18939PA0010025 Rating Area 6 Tobacco User/Non-Tobacco User 46654.61 654.61
18939PA0010025 Rating Area 6 Tobacco User/Non-Tobacco User 47682.10 682.10
18939PA0010025 Rating Area 6 Tobacco User/Non-Tobacco User 48713.52 713.52
18939PA0010025 Rating Area 6 Tobacco User/Non-Tobacco User 49744.50 744.50
18939PA0010025 Rating Area 6 Tobacco User/Non-Tobacco User 50779.42 779.42
18939PA0010025 Rating Area 6 Tobacco User/Non-Tobacco User 51813.89 813.89
18939PA0010025 Rating Area 6 Tobacco User/Non-Tobacco User 52851.86 851.86
18939PA0010025 Rating Area 6 Tobacco User/Non-Tobacco User 53890.26 890.26
18939PA0010025 Rating Area 6 Tobacco User/Non-Tobacco User 54931.72 931.72
18939PA0010025 Rating Area 6 Tobacco User/Non-Tobacco User 55973.18 973.18
18939PA0010025 Rating Area 6 Tobacco User/Non-Tobacco User 561018.13 1018.13
18939PA0010025 Rating Area 6 Tobacco User/Non-Tobacco User 571063.51 1063.51
18939PA0010025 Rating Area 6 Tobacco User/Non-Tobacco User 581111.96 1111.96
18939PA0010025 Rating Area 6 Tobacco User/Non-Tobacco User 591135.96 1135.96
18939PA0010025 Rating Area 6 Tobacco User/Non-Tobacco User 601184.40 1184.40
18939PA0010025 Rating Area 6 Tobacco User/Non-Tobacco User 611226.29 1226.29
18939PA0010025 Rating Area 6 Tobacco User/Non-Tobacco User 621253.79 1253.79
18939PA0010025 Rating Area 6 Tobacco User/Non-Tobacco User 631288.26 1288.26
18939PA0010025 Rating Area 6 Tobacco User/Non-Tobacco User 64 and over1308.77 1308.77
18939PA0010025 Rating Area 7 Tobacco User/Non-Tobacco User 0-14321.02 321.02
18939PA0010025 Rating Area 7 Tobacco User/Non-Tobacco User 15321.02 321.02
18939PA0010025 Rating Area 7 Tobacco User/Non-Tobacco User 16375.18 375.18
18939PA0010025 Rating Area 7 Tobacco User/Non-Tobacco User 17386.53 386.53
18939PA0010025 Rating Area 7 Tobacco User/Non-Tobacco User 18398.76 398.76
18939PA0010025 Rating Area 7 Tobacco User/Non-Tobacco User 19410.99 410.99
18939PA0010025 Rating Area 7 Tobacco User/Non-Tobacco User 20423.66 423.66
18939PA0010025 Rating Area 7 Tobacco User/Non-Tobacco User 21436.76 436.76
18939PA0010025 Rating Area 7 Tobacco User/Non-Tobacco User 22436.76 436.76
18939PA0010025 Rating Area 7 Tobacco User/Non-Tobacco User 23436.76 436.76
18939PA0010025 Rating Area 7 Tobacco User/Non-Tobacco User 24436.76 436.76
18939PA0010025 Rating Area 7 Tobacco User/Non-Tobacco User 25438.51 438.51
18939PA0010025 Rating Area 7 Tobacco User/Non-Tobacco User 26447.24 447.24
18939PA0010025 Rating Area 7 Tobacco User/Non-Tobacco User 27457.73 457.73
18939PA0010025 Rating Area 7 Tobacco User/Non-Tobacco User 28474.76 474.76
18939PA0010025 Rating Area 7 Tobacco User/Non-Tobacco User 29488.74 488.74
18939PA0010025 Rating Area 7 Tobacco User/Non-Tobacco User 30495.72 495.72
18939PA0010025 Rating Area 7 Tobacco User/Non-Tobacco User 31506.21 506.21
18939PA0010025 Rating Area 7 Tobacco User/Non-Tobacco User 32516.69 516.69
18939PA0010025 Rating Area 7 Tobacco User/Non-Tobacco User 33523.24 523.24
18939PA0010025 Rating Area 7 Tobacco User/Non-Tobacco User 34530.23 530.23
18939PA0010025 Rating Area 7 Tobacco User/Non-Tobacco User 35533.72 533.72
18939PA0010025 Rating Area 7 Tobacco User/Non-Tobacco User 36537.22 537.22
18939PA0010025 Rating Area 7 Tobacco User/Non-Tobacco User 37540.71 540.71
18939PA0010025 Rating Area 7 Tobacco User/Non-Tobacco User 38544.20 544.20
18939PA0010025 Rating Area 7 Tobacco User/Non-Tobacco User 39551.19 551.19
18939PA0010025 Rating Area 7 Tobacco User/Non-Tobacco User 40558.18 558.18
18939PA0010025 Rating Area 7 Tobacco User/Non-Tobacco User 41568.66 568.66
18939PA0010025 Rating Area 7 Tobacco User/Non-Tobacco User 42578.71 578.71
18939PA0010025 Rating Area 7 Tobacco User/Non-Tobacco User 43592.68 592.68
18939PA0010025 Rating Area 7 Tobacco User/Non-Tobacco User 44610.15 610.15
18939PA0010025 Rating Area 7 Tobacco User/Non-Tobacco User 45630.68 630.68
18939PA0010025 Rating Area 7 Tobacco User/Non-Tobacco User 46655.14 655.14
18939PA0010025 Rating Area 7 Tobacco User/Non-Tobacco User 47682.66 682.66
18939PA0010025 Rating Area 7 Tobacco User/Non-Tobacco User 48714.10 714.10
18939PA0010025 Rating Area 7 Tobacco User/Non-Tobacco User 49745.11 745.11
18939PA0010025 Rating Area 7 Tobacco User/Non-Tobacco User 50780.05 780.05
18939PA0010025 Rating Area 7 Tobacco User/Non-Tobacco User 51814.56 814.56
18939PA0010025 Rating Area 7 Tobacco User/Non-Tobacco User 52852.56 852.56
18939PA0010025 Rating Area 7 Tobacco User/Non-Tobacco User 53890.99 890.99
18939PA0010025 Rating Area 7 Tobacco User/Non-Tobacco User 54932.48 932.48
18939PA0010025 Rating Area 7 Tobacco User/Non-Tobacco User 55973.98 973.98
18939PA0010025 Rating Area 7 Tobacco User/Non-Tobacco User 561018.96 1018.96
18939PA0010025 Rating Area 7 Tobacco User/Non-Tobacco User 571064.39 1064.39
18939PA0010025 Rating Area 7 Tobacco User/Non-Tobacco User 581112.87 1112.87
18939PA0010025 Rating Area 7 Tobacco User/Non-Tobacco User 591136.89 1136.89
18939PA0010025 Rating Area 7 Tobacco User/Non-Tobacco User 601185.37 1185.37
18939PA0010025 Rating Area 7 Tobacco User/Non-Tobacco User 611227.30 1227.30
18939PA0010025 Rating Area 7 Tobacco User/Non-Tobacco User 621254.81 1254.81
18939PA0010025 Rating Area 7 Tobacco User/Non-Tobacco User 631289.32 1289.32
18939PA0010025 Rating Area 7 Tobacco User/Non-Tobacco User 64 and over1309.85 1309.85
18939PA0010025 Rating Area 8 Tobacco User/Non-Tobacco User 0-14326.30 326.30
18939PA0010025 Rating Area 8 Tobacco User/Non-Tobacco User 15326.30 326.30
18939PA0010025 Rating Area 8 Tobacco User/Non-Tobacco User 16381.36 381.36
18939PA0010025 Rating Area 8 Tobacco User/Non-Tobacco User 17392.90 392.90
18939PA0010025 Rating Area 8 Tobacco User/Non-Tobacco User 18405.33 405.33
18939PA0010025 Rating Area 8 Tobacco User/Non-Tobacco User 19417.76 417.76
18939PA0010025 Rating Area 8 Tobacco User/Non-Tobacco User 20430.63 430.63
18939PA0010025 Rating Area 8 Tobacco User/Non-Tobacco User 21443.95 443.95
18939PA0010025 Rating Area 8 Tobacco User/Non-Tobacco User 22443.95 443.95
18939PA0010025 Rating Area 8 Tobacco User/Non-Tobacco User 23443.95 443.95
18939PA0010025 Rating Area 8 Tobacco User/Non-Tobacco User 24443.95 443.95
18939PA0010025 Rating Area 8 Tobacco User/Non-Tobacco User 25445.73 445.73
18939PA0010025 Rating Area 8 Tobacco User/Non-Tobacco User 26454.61 454.61
18939PA0010025 Rating Area 8 Tobacco User/Non-Tobacco User 27465.26 465.26
18939PA0010025 Rating Area 8 Tobacco User/Non-Tobacco User 28482.58 482.58
18939PA0010025 Rating Area 8 Tobacco User/Non-Tobacco User 29496.78 496.78
18939PA0010025 Rating Area 8 Tobacco User/Non-Tobacco User 30503.89 503.89
18939PA0010025 Rating Area 8 Tobacco User/Non-Tobacco User 31514.54 514.54
18939PA0010025 Rating Area 8 Tobacco User/Non-Tobacco User 32525.20 525.20
18939PA0010025 Rating Area 8 Tobacco User/Non-Tobacco User 33531.85 531.85
18939PA0010025 Rating Area 8 Tobacco User/Non-Tobacco User 34538.96 538.96
18939PA0010025 Rating Area 8 Tobacco User/Non-Tobacco User 35542.51 542.51
18939PA0010025 Rating Area 8 Tobacco User/Non-Tobacco User 36546.06 546.06
18939PA0010025 Rating Area 8 Tobacco User/Non-Tobacco User 37549.61 549.61
18939PA0010025 Rating Area 8 Tobacco User/Non-Tobacco User 38553.16 553.16
18939PA0010025 Rating Area 8 Tobacco User/Non-Tobacco User 39560.27 560.27
18939PA0010025 Rating Area 8 Tobacco User/Non-Tobacco User 40567.37 567.37
18939PA0010025 Rating Area 8 Tobacco User/Non-Tobacco User 41578.03 578.03
18939PA0010025 Rating Area 8 Tobacco User/Non-Tobacco User 42588.24 588.24
18939PA0010025 Rating Area 8 Tobacco User/Non-Tobacco User 43602.44 602.44
18939PA0010025 Rating Area 8 Tobacco User/Non-Tobacco User 44620.20 620.20
18939PA0010025 Rating Area 8 Tobacco User/Non-Tobacco User 45641.07 641.07
18939PA0010025 Rating Area 8 Tobacco User/Non-Tobacco User 46665.93 665.93
18939PA0010025 Rating Area 8 Tobacco User/Non-Tobacco User 47693.90 693.90
18939PA0010025 Rating Area 8 Tobacco User/Non-Tobacco User 48725.86 725.86
18939PA0010025 Rating Area 8 Tobacco User/Non-Tobacco User 49757.38 757.38
18939PA0010025 Rating Area 8 Tobacco User/Non-Tobacco User 50792.90 792.90
18939PA0010025 Rating Area 8 Tobacco User/Non-Tobacco User 51827.97 827.97
18939PA0010025 Rating Area 8 Tobacco User/Non-Tobacco User 52866.59 866.59
18939PA0010025 Rating Area 8 Tobacco User/Non-Tobacco User 53905.66 905.66
18939PA0010025 Rating Area 8 Tobacco User/Non-Tobacco User 54947.84 947.84
18939PA0010025 Rating Area 8 Tobacco User/Non-Tobacco User 55990.01 990.01
18939PA0010025 Rating Area 8 Tobacco User/Non-Tobacco User 561035.74 1035.74
18939PA0010025 Rating Area 8 Tobacco User/Non-Tobacco User 571081.91 1081.91
18939PA0010025 Rating Area 8 Tobacco User/Non-Tobacco User 581131.19 1131.19
18939PA0010025 Rating Area 8 Tobacco User/Non-Tobacco User 591155.61 1155.61
18939PA0010025 Rating Area 8 Tobacco User/Non-Tobacco User 601204.89 1204.89
18939PA0010025 Rating Area 8 Tobacco User/Non-Tobacco User 611247.51 1247.51
18939PA0010025 Rating Area 8 Tobacco User/Non-Tobacco User 621275.48 1275.48
18939PA0010025 Rating Area 8 Tobacco User/Non-Tobacco User 631310.55 1310.55
18939PA0010025 Rating Area 8 Tobacco User/Non-Tobacco User 64 and over1331.41 1331.41
18939PA0010025 Rating Area 9 Tobacco User/Non-Tobacco User 0-14304.52 304.52
18939PA0010025 Rating Area 9 Tobacco User/Non-Tobacco User 15304.52 304.52
18939PA0010025 Rating Area 9 Tobacco User/Non-Tobacco User 16355.90 355.90
18939PA0010025 Rating Area 9 Tobacco User/Non-Tobacco User 17366.67 366.67
18939PA0010025 Rating Area 9 Tobacco User/Non-Tobacco User 18378.27 378.27
18939PA0010025 Rating Area 9 Tobacco User/Non-Tobacco User 19389.87 389.87
18939PA0010025 Rating Area 9 Tobacco User/Non-Tobacco User 20401.89 401.89
18939PA0010025 Rating Area 9 Tobacco User/Non-Tobacco User 21414.31 414.31
18939PA0010025 Rating Area 9 Tobacco User/Non-Tobacco User 22414.31 414.31
18939PA0010025 Rating Area 9 Tobacco User/Non-Tobacco User 23414.31 414.31
18939PA0010025 Rating Area 9 Tobacco User/Non-Tobacco User 24414.31 414.31
18939PA0010025 Rating Area 9 Tobacco User/Non-Tobacco User 25415.97 415.97
18939PA0010025 Rating Area 9 Tobacco User/Non-Tobacco User 26424.26 424.26
18939PA0010025 Rating Area 9 Tobacco User/Non-Tobacco User 27434.20 434.20
18939PA0010025 Rating Area 9 Tobacco User/Non-Tobacco User 28450.36 450.36
18939PA0010025 Rating Area 9 Tobacco User/Non-Tobacco User 29463.62 463.62
18939PA0010025 Rating Area 9 Tobacco User/Non-Tobacco User 30470.25 470.25
18939PA0010025 Rating Area 9 Tobacco User/Non-Tobacco User 31480.19 480.19
18939PA0010025 Rating Area 9 Tobacco User/Non-Tobacco User 32490.13 490.13
18939PA0010025 Rating Area 9 Tobacco User/Non-Tobacco User 33496.35 496.35
18939PA0010025 Rating Area 9 Tobacco User/Non-Tobacco User 34502.98 502.98
18939PA0010025 Rating Area 9 Tobacco User/Non-Tobacco User 35506.29 506.29
18939PA0010025 Rating Area 9 Tobacco User/Non-Tobacco User 36509.61 509.61
18939PA0010025 Rating Area 9 Tobacco User/Non-Tobacco User 37512.92 512.92
18939PA0010025 Rating Area 9 Tobacco User/Non-Tobacco User 38516.24 516.24
18939PA0010025 Rating Area 9 Tobacco User/Non-Tobacco User 39522.87 522.87
18939PA0010025 Rating Area 9 Tobacco User/Non-Tobacco User 40529.49 529.49
18939PA0010025 Rating Area 9 Tobacco User/Non-Tobacco User 41539.44 539.44
18939PA0010025 Rating Area 9 Tobacco User/Non-Tobacco User 42548.97 548.97
18939PA0010025 Rating Area 9 Tobacco User/Non-Tobacco User 43562.23 562.23
18939PA0010025 Rating Area 9 Tobacco User/Non-Tobacco User 44578.80 578.80
18939PA0010025 Rating Area 9 Tobacco User/Non-Tobacco User 45598.27 598.27
18939PA0010025 Rating Area 9 Tobacco User/Non-Tobacco User 46621.47 621.47
18939PA0010025 Rating Area 9 Tobacco User/Non-Tobacco User 47647.57 647.57
18939PA0010025 Rating Area 9 Tobacco User/Non-Tobacco User 48677.40 677.40
18939PA0010025 Rating Area 9 Tobacco User/Non-Tobacco User 49706.82 706.82
18939PA0010025 Rating Area 9 Tobacco User/Non-Tobacco User 50739.97 739.97
18939PA0010025 Rating Area 9 Tobacco User/Non-Tobacco User 51772.70 772.70
18939PA0010025 Rating Area 9 Tobacco User/Non-Tobacco User 52808.74 808.74
18939PA0010025 Rating Area 9 Tobacco User/Non-Tobacco User 53845.20 845.20
18939PA0010025 Rating Area 9 Tobacco User/Non-Tobacco User 54884.56 884.56
18939PA0010025 Rating Area 9 Tobacco User/Non-Tobacco User 55923.92 923.92
18939PA0010025 Rating Area 9 Tobacco User/Non-Tobacco User 56966.60 966.60
18939PA0010025 Rating Area 9 Tobacco User/Non-Tobacco User 571009.69 1009.69
18939PA0010025 Rating Area 9 Tobacco User/Non-Tobacco User 581055.67 1055.67
18939PA0010025 Rating Area 9 Tobacco User/Non-Tobacco User 591078.46 1078.46
18939PA0010025 Rating Area 9 Tobacco User/Non-Tobacco User 601124.45 1124.45
18939PA0010025 Rating Area 9 Tobacco User/Non-Tobacco User 611164.23 1164.23
18939PA0010025 Rating Area 9 Tobacco User/Non-Tobacco User 621190.33 1190.33
18939PA0010025 Rating Area 9 Tobacco User/Non-Tobacco User 631223.06 1223.06
18939PA0010025 Rating Area 9 Tobacco User/Non-Tobacco User 64 and over1242.53 1242.53
Blair Cambria
Huntingdon Westmoreland
Clearfield Centre
Cumberland Lancaster
Lebanon
Dauphin Schuylkill
Carbon
Cameron
York
Adams
Franklin
Juniata Mifflin
Northumberland
Columbia Montour
Luzerne
Lackawanna
Lehigh
Delaware Fulton
Allegheny
Washington
Butler
Lawrence
Erie
Armstrong
Beaver
Bedford
Berks
Bradford
Bucks
Chester
Clarion Clinton
Crawford
Elk
Fayette
Forest
Greene
Indiana
Jefferson
Lycoming
Mckean
Mercer
Monroe
Montgomery
Northampton
Perry
Philadelphia
Pike
Potter
Snyder
Somerset
Sullivan
Susquehanna Tioga
Union
Venango
Warren
Wayne Wyoming
01/01/2017 Service Area Issuer: Aetna HealthAssurance of PA Market: Small Group
Key (modify as needed) : 2017 on-exchange service area : 2017 off-exchange only service area
Blair Cambria
Huntingdon Westmoreland
Clearfield Centre
Cumberland Lancaster
Lebanon
Dauphin Schuylkill
Carbon
Cameron
York
Adams
Franklin
Juniata Mifflin
Northumberland
Columbia Montour
Luzerne
Lackawanna
Lehigh
Delaware Fulton
Allegheny
Washington
Butler
Lawrence
Erie
Armstrong
Beaver
Bedford
Berks
Bradford
Bucks
Chester
Clarion Clinton
Crawford
Elk
Fayette
Forest
Greene
Indiana
Jefferson
Lycoming
Mckean
Mercer
Monroe
Montgomery
Northampton
Perry
Philadelphia
Pike
Potter
Snyder
Somerset
Sullivan
Susquehanna Tioga
Union
Venango
Warren
Wayne Wyoming
01/01/2018 Service Area Issuer: Aetna HealthAssurance of PA Market: Small Group
Key (modify as needed) : 2018 on-exchange service area : 2018 off-exchange only service area
PA SILVER PPO 5000 80/50
Actuarial Value Snapshot
The Actuarial Value Calculator (AV Calculator) is designed to give an estimate of network liability for a given plan design. This build of the AV Calculator uses data from a large national commercial database to build continuance tables by metal tier.
Justification for Confidentiality Requests
Company Legal Name: Aetna Health Assurance of PA NAIC #: 18527 Market: Small Group Off-Exchange Effective Date: 01/01/2018 Avg rate change requested: -1.7% Range of rate change requested: -20.4% to +30.5% Products: PPO Rating Areas: Rating Areas 1-3 and 5-9, certain counties excluded Metal Levels: Silver Current # covered lives: 9,989 Current # policyholders: 5,701 Number of plans offered: 1 HIOS Issuer ID / Binder #: 18939 Rate Filing Tracking Number: AETN-131033573 Policy Form(s): AHASPA SG HCOC-2018-PPO 02 Form Filing Tracking Number: AETN-130914613 A.2. RFJ Part III – Actuarial Memorandum Name and contact information are kept confidential to protect actuary identity.
D.6. Actuarial Certifications Name and contact information are kept confidential to protect actuary identity. AV Screenshots AV Screenshots redacted as per Department expectations of a necessary redaction.
SERFF Tracking
Number:
AETN-131033573 State: Pennsylvania
Filing Company: Aetna HealthAssurance Pennsylvania, Inc. State Tracking
Number:
AETN-131033573
Company Tracking
Number:
TOI: H15G Group Health -
Hospital/Surgical/Medical Expense
Sub-TOI: H15G.003 Small
Group Only
Product Name: 2018 PA SG AHASPA Filing
Project Name:
Objection Letter Status:Pending Industry Response
Objection Letter Date:06/16/2017
Respond By Date:06/23/2017
Submitted Date:06/16/2017 02:21 PM
Introduction: The Pennsylvania Insurance Department has received and conducted a review of the above
captioned filing. In order to complete the review, we are requesting the following information. To facilitate a
timely review, we request this information be provided within 5 business days of the date of this letter.
1. The URRT Worksheet (WS) 1, Section III, does not appear to tie to Table 5, but appears to tie to Table 5
in the Aetna Life Insurance Company (AETN-131033620). Please correct and re-submit the URRT.
2. URRT Worksheet 2 does not show any plans as “Renewing” while tab IV of the PA Act Memo Exhibits does
show the mapping of plans occurring. Please provide an explanation for the inconsistency between the
workbooks and which of them is accurate.
3. While we acknowledge the explanation on Page 8 of the Federal Actuarial Memorandum (Act Memo), it is
not clear why there is such a large variation between WS1 and WS2 Section III of the URRT. Specifically,
why does the membership vary from 123,243 on WS1 to 36,839 on WS2? We would expect that the
experience period membership would not vary between these sheets. The same concern follows for the
other information creating a ‘WARNING’ on WS2. Please provide an illustration of how these numbers
reconcile and are consistent with the 2018 URRT Instructions.
4. Please correct or justify the discrepancy on Page 1 of PA Act Memo which shows the average rate change
of 1.8%, whereas Table 10, Cell AC15, as referenced in the same section on Page 1 shows 2.39%. There is
a similar discrepancy between the - 24.8% in the PA Act Memo and Table 11, Cell AN13.
5. The rate change of 2.4% in Table 10, Cell AC15 includes the mapping of Bronze, Gold, and Platinum plans
to Silver plans. When only Silver-to-Silver plan mapping is considered, the rate change increases to 11.3%.
Please quantify all drivers of the 11.3% increase when only Silver-to-Silver plan mapping is considered.
6. Plans with a Mental Health/Substance Abuse (MH/SA) benefits set to the Specialist cost sharing may not
be Mental Health Parity (MHP) compliant. Please illustrate that the $75 copay on MH/SA is compliant with
MHP regulations.
7. Please provide an explanation for how the AV Calculator (AVC) inputs for the Specialty Drug benefit were
determined when there is different cost sharing between preferred and non-preferred drugs, as shown in
Exhibit A-2.
8. Please provide an explanation and illustration for the calculation of the 0.845 paid-to- allowed ratio for
the Silver plans.
9. Please illustrate the development of the network factors.
10. Please illustrate the development of the trend factor used in Exhibit 12 (~12.1% trend) as it relates to
Exhibit 8 (~10.6% trend); specifically, please show how the leveraging is applied, as noted on Page 5 of the
Federal Act Memo.
11. Please provide numerical support for the trend assumptions shown in Exhibit 8. We understand that
additional considerations are applied other than historical trends as stated in the Act Memos, but please
justify the large discrepancy in historical pharmacy trend with what is being shown in Exhibit 8.
12. Please provide numerical support for the morbidity assumption for both the Actual Experience Data and
Manual Data.
13. Please show the breakout of the components that make up the ‘other’ adjustment for both the Actual
Experience Data and Manual Data. Clearly illustrate the ‘Change in Network’ is not being double counted, as
the PA Act Memo states the ‘Change in Network’ is included in ‘Change in Other.,’ but Table 5 shows it
applied on its own.
14. Please provide numerical support for the development of the Risk Adjustment amount.
15. Please reconcile the discrepancy between Table 5’s projected risk adjustment which is shown as a
payment of $28.89, compared to Exhibit E-1 which equates to $30.17 ((551.03 – 515.33) * 0.845).
16. Please provide numerical support for the development of the Health Insurer Fee.
17. Please reconcile the discrepancy between Exhibit 11’s ‘Premium (pmpm)’ of $560.57 compared to URRT
WS1 which shows $557.87?
18. Please reconcile the discrepancy between Exhibit 11’s ‘Medical Cost (pmpm)’ of
$442.86 compared to URRT WS1 which shows $443.38?
19. Please reconcile the discrepancy between Exhibit 11’s ‘Taxes and Fees’ of $39.29 compared to URRT
WS1 which shows $36.17? We should expect this to differ by only the Risk Adjustment User Fee amount.
20. The Service Area Template included in the Binder indicates that AHI is statewide; however the Service
Area Map included in this rate filing shows 16 counties in which coverage will not be offered in 2018. Please
review and revise.
21. Please confirm the HIOS submission and update the cover letter to include the Binder # in addition to
the HIOS Issuer ID.
22. Please confirm that you have tested to ensure that the PID rate exhibits the Federal rates template
included in this filing and the binder are the same.
23. The Rate/Rule Schedule tab shows 5,701 policy holders while cell V15 of Table 10 shows 7,224 and the
Rate Change Request Summary Attachment shows 9,989 covered lives as of February 1, 2017. Be advised
that the 2018 Guidance, consistent with the 2017 Guidance, states that the policyholders in the Rate/Rule
Schedule tab should show the number of covered lives and that this number should equal the figure shown
in Table 1 and Table 10. Please review the Mapping instructions in section D.3.C and revise.
24. Please provide the experience period data and projection factors used to develop the credibility manual
data, in the same format as Worksheet I, Sections I and II of the URRT.
25. Please show quantitatively, including an Excel spreadsheet with formulas, the derivation of the --$28.88
Projected Risk Adjustments PMPM amount found in Section III, Worksheet 1 of the URRT and in Table 5 cell
C31. Also provide a detailed narrative that describers the development of the estimated risk adjustment
transfer payment. In demonstrating the development of the transfer payment, please show all risk transfer
formula components, the estimated market-wide average risk assumptions as well as support for those
assumptions. Since this response should include detailed insight into the risk adjustment transfer
methodology, you may redact this response as appropriate.
26. Please show quantitatively the derivation of the trend assumptions for each benefit category as shown in
Table 3b. Please include the sources and source claims data in Table 4b. Also provide a detailed narrative
that explains why this data is appropriate and how it was used in developing the trend, including all
assumptions and adjustments. Also discuss the impact of provider contracting and leveraging on trend. The
specific provider contracting agreement and amount may be redacted, but not aggregate amounts.
27. Table 6, cell B54, indicates the PCORI fee is $0.19. The 2018 PCORI pmpm amount should be $0.20 or
$0.21. Please revise.
28. On page 14 of the 2018 Guidance, the department requested data regarding the development of the
Pricing AVs and Induced Demand in Table 10. Please provide this data in Excel.
29. Please show quantitatively, including an Excel spreadsheet with formulas, the development of the age
(1.430) and geographic (0.921) calibration factors in cells T4 and T5 of Table 10. Also, state the associated
age.
30. Please show the calculation of the PA Premium Tax percentage shown in Table 6, cell C55; I note the
maximum tax payable is 0% for HMO and RANLI business, and 2% for all other business.
32. Please show quantitatively, including an Excel spreadsheet with formulas the development of and
discuss the basis for the Change in Morbidity (1.093), Change in Demographics (0.958), Change in Network
(1.020) and the Change in Other (.997) in Table 5.
33. Table 6 cell C63 indicates the Single Risk Pool pmpm is $581.27, while the Single risk pool in the URRT
in cell V43 indicates $557.87. Please reconcile.
34. Please show the development of the average commission and circumstances in which broker
commissions will be paid and if they will vary based on geographic location, metal level, plan, open
enrollment vs SEP enrollment, etc. Additionally, the current and 2018 broker agreements should be included
and used to develop the percent shown in Table 6 as well as the associated pmpm dollar amount.
Please be advised that there may be additional questions subsequent to your responses to the above. To the
extent that concerns have been raised by the Department in this filing and not in this entity’s other market
or affiliate companies, where the issue exists in the other market or affiliate, please make the appropriate
adjustment and advise in the response to the data call. Data and exhibits in response to this request should
be provided via SERFF in Microsoft Excel spreadsheets (version 2013 or less). Please retain all formulas.
Should you have any questions regarding this correspondence, please contact me at (717) 783-2115.
XXXXXXXXXXXXXXX XXXXXXXXXXXX
XXXXXXXXXXXXX XXXXXXXXXXX
June 23, 2017 Mr. Michael Gurgiolo Actuarial Review Division Bureau of Accident & Health Insurance 1311 Strawberry Square Harrisburg, PA 17120 Subject: Aetna HealthAssurance Pennsylvania, Inc. Small Group Rate Filing SERFF # AETN-131033573
Dear Mr. Michael Gurgiolo: Enclosed is additional information related to the items contained in your objection letter dated 06/16/2017 for the above referenced rate filing.
1. The URRT Worksheet (WS) 1, Section III, does not appear to tie to Table 5, but appears to tie to Table 5 in the Aetna Life Insurance Company (AETN-131033620). Please correct and re-submit the URRT. Table 5 has been updated, we apologize for the oversight.
2. URRT Worksheet 2 does not show any plans as “Renewing” while tab IV of the PA Act Memo Exhibits does show the mapping of plans occurring. Please provide an explanation for the inconsistency between the workbooks and which of them is accurate. All membership from 2017 is being offered a 2018 plan which is shown in the exhibits. However, the 2018 plan does not meet the UBM mapping requirements of the URRT, therefore it is considered a new plan.
3. While we acknowledge the explanation on Page 8 of the Federal Actuarial Memorandum (Act Memo), it is not clear why there is such a large variation between WS1 and WS2 Section III of the URRT. Specifically, why does the membership vary from 123,243 on WS1 to 36,839 on WS2? We would expect that the experience period membership would not vary between these sheets. The same concern follows for the other information creating a ‘WARNING’ on WS2. Please provide an illustration of how these numbers reconcile and are consistent with the 2018 URRT Instructions. Worksheet 1icludes the historical experience for the Small Group transitional policies or Keep What You Have. This is consistent with the 2018 URRT instructions (page 13). However, Worksheet 2 does not include these plans.
XXXXXXXXXXXXXXX XXXXXXXXXXXX
XXXXXXXXXXXXX XXXXXXXXXXX
4. Please correct or justify the discrepancy on Page 1 of PA Act Memo which shows the average rate change of 1.8%, whereas Table 10, Cell AC15, as referenced in the same section on Page 1 shows 2.39%. There is a similar discrepancy between the - 24.8% in the PA Act Memo and Table 11, Cell AN13. The discrepancy has been corrected and updated. Please see “Updated 2018 PA Actuarial Memorandum SG AHASPA”.
5. The rate change of 2.4% in Table 10, Cell AC15 includes the mapping of Bronze, Gold, and Platinum plans to Silver plans. When only Silver-to-Silver plan mapping is considered, the rate change increases to 11.3%. Please quantify all drivers of the 11.3% increase when only Silver-to-Silver plan mapping is considered. The drivers of the rate change are:
Trend 11.5% Population Morbidity 6.1% HIF 3.2% Profit 1.9% Benefit & Other Changes -10.5% Total 11.3%
6. Plans with a Mental Health/Substance Abuse (MH/SA) benefits set to the Specialist cost
sharing may not be Mental Health Parity (MHP) compliant. Please illustrate that the $75 copay on MH/SA is compliant with MHP regulations. Aetna’s plan complies with the “substantially all” and “predominant” tests of the Mental Health Parity and Addiction Equity Act (“MHPAEA”). MHPAEA provides that the financial requirement applicable to behavioral health and substance use disorder benefits must arise from a comparison of all medical and surgical benefits within a given classification. In the case of the “Outpatient- In Network” classification, MHPAEA permits plans to subclassify benefits as “Office Visits,” including specialist, primary care and behavioral health office visits, and “All Other.” In accordance with MHPAEA, for the plan in Aetna’s filing, the cost share for outpatient behavioral health benefits is the “type” applicable to “substantially all” (or at least 2/3 of) medical and surgical benefits within the applicable sub-classification. Further, the “level” (or amount) of any such cost share is no greater than the “predominant” level (or applicable to more than 1/2 of) for medical and surgical benefits. In the case of the plan at issue here, the “substantially all” actuarial analysis set forth in MHPAEA results in a cost share for the behavioral health “outpatient office” sub-classification that aligns in “type” (e.g., copay or coinsurance) with both primary care and specialist office visits. On the other hand, the “predominant” actuarial analysis
XXXXXXXXXXXXXXX XXXXXXXXXXXX
XXXXXXXXXXXXX XXXXXXXXXXX
results in a cost share “level,” or amount, which aligns with specialist office visits, not primary care. When tested on the basis of actuarially-credible data, the Plan passes the substantially all and predominant tests. The BH/SUD cost share type (copay) applies to 83.7% (or substantially all) of the in-network M/S benefits in the office subclassification. Further, the level of that cost share ($75) applies to 78.6% (predominant) of the M/S benefits. In other words, the plan passes the substantially all and predominant tests.
7. Please provide an explanation for how the AV Calculator (AVC) inputs for the Specialty Drug benefit were determined when there is different cost sharing between preferred and non-preferred drugs, as shown in Exhibit A-2. When calculating the AV, we entered the preferred tier cost sharing. Weighting between the preferred and non-preferred tiers is not material to the Actuarial Value.
8. Please provide an explanation and illustration for the calculation of the 0.845 paid-to- allowed ratio for the Silver plans. Paid to allowed ratios are based on 2016 experience that is adjusted for the impact of any plan benefit changes based on our internal pricing models and trend deductible-leveraging.
9. Please illustrate the development of the network factors. All network factors are 1.0 for this filing.
10. Please illustrate the development of the trend factor used in Exhibit 12 (~12.1% trend) as it relates to Exhibit 8 (~10.6% trend); specifically, please show how the leveraging is applied, as noted on Page 5 of the Federal Act Memo. Exhibit 8 uses our projected Allowed trend, while Exhibit 12 uses our projected Paid trend. The only difference between the two is the adjustment for leveraging. We apply an adjustment separately to Inpatient, Outpatient and Physician to appropriately reflect the leveraging impact by cost category.
11. Please provide numerical support for the trend assumptions shown in Exhibit 8. We
understand that additional considerations are applied other than historical trends as stated in the Act Memos, but please justify the large discrepancy in historical pharmacy trend with what is being shown in Exhibit 8 Please see Exhibit 8 for the trend components by category. For utilization trends, our trends are determined by studying our national Small Group data. We use a rolling-12
XXXXXXXXXXXXXXX XXXXXXXXXXXX
XXXXXXXXXXXXX XXXXXXXXXXX
utilization per thousand statistic for a continuous, normalized population, and exclude catastrophic claims. For Unit Costs, we track projected unit cost increases at each facility/provider and develop a weighted average increase based on our volume at each facility location. Pharmacy Unit Cost trend considers the impact of formulary changes, patent expirations, new drugs, and other general market share shifts. It is important to note for both medical and pharmacy unit cost trend, historical unit costs are not indicative of the known changes we include in our forward projections.
12. Please provide numerical support for the morbidity assumption for both the Actual Experience Data and Manual Data. Please see the table below for changes in the average morbidity of the population.
Experience Manual Experience Period
0.981
1.071
Projection Period
1.171
1.171
Morbidity Factor
1.194
1.093
*Morbidity factor is developed by taking the Projection Period Factor/Experience Period Factor (1.171/.981 = 1.194)
13. Please show the breakout of the components that make up the ‘other’ adjustment for both the Actual Experience Data and Manual Data. Clearly illustrate the ‘Change in Network’ is not being double counted, as the PA Act Memo states the ‘Change in Network’ is included in ‘Change in Other.,’ but Table 5 shows it applied on its own. Please see tab ‘Objection 13’ and ‘Objection 13 cont.” of “Objections 6-16-17.xlsx”. The Network change is only utilized in one place in the formula.
14. Please provide numerical support for the development of the Risk Adjustment amount. Please see the table below for the calculation of the Projected Risk Adjustment PMPM
Risk Transfer Estimate from PA DOI $ (31.60) Adjustment for Admin components of Premium
$ 4.42
2018 Risk Adjustment Fee $ (0.14) 2018 Net High Risk Pool Prem less Recoveries $ (1.56) Projected Risk Adjustment PMPM $ (28.88)
XXXXXXXXXXXXXXX XXXXXXXXXXXX
XXXXXXXXXXXXX XXXXXXXXXXX
15. Please reconcile the discrepancy between Table 5’s projected risk adjustment which is shown as a payment of $28.89, compared to Exhibit E-1 which equates to $30.17 ((551.03 – 515.33) * 0.845). Exhibit E-1 provides the risk adjustment value on an allowed bases (before the paid to allowed adjustment) and trended to the midpoint of the projection period for all policies offered in 2018 (not just the first quarter policies as on Worksheet I of the URRT).
16. Please provide numerical support for the development of the Health Insurer Fee. We are estimating the Health Insurer Fee to be 3.15% of premium for 2018. The Health Insurer Fee was calculated for Aetna by taking the total dollar value due to the HIF and by estimating our national market share. To calculate this, we used growth assumptions for Aetna by market and compared to industry wide growth assumptions.
17. Please reconcile the discrepancy between Exhibit 11’s ‘Premium (pmpm)’ of $560.57 compared to URRT WS1 which shows $557.87? Exhibit 11 has been updated to reflect the correct value of $557.87. The URRT and Exhibit now reconcile. Please see “Updated PA SG AHASPA FACT Exhibits.xlsx”.
18. Please reconcile the discrepancy between Exhibit 11’s ‘Medical Cost (pmpm)’ of $442.86 compared to URRT WS1 which shows $443.38? The corrected value on Exhibit 11 is $440.45. 0.5% of costs are moved from medicate costs to Taxes and fees to account for the cost of the high risk pool.
19. Please reconcile the discrepancy between Exhibit 11’s ‘Taxes and Fees’ of $39.29 compared to URRT WS1 which shows $36.17? We should expect this to differ by only the Risk Adjustment User Fee amount. The difference is we are increasing the Taxes and fees by the.5% of premium that was reduced from the Medical Cost for the high risk pool.
20. The Service Area Template included in the Binder indicates that AHI is statewide; however the Service Area Map included in this rate filing shows 16 counties in which coverage will not be offered in 2018. Please review and revise. A revised binder will be submitted. We apologize for the oversight.
21. Please confirm the HIOS submission and update the cover letter to include the Binder # in addition to the HIOS Issuer ID.
XXXXXXXXXXXXXXX XXXXXXXXXXXX
XXXXXXXXXXXXX XXXXXXXXXXX
HIOS was submitted and the Binder tracking number is AETN-PA18-125071663. The cover letter has been updated to reflect this.
22. Please confirm that you have tested to ensure that the PID rate exhibits the Federal rates template included in this filing and the binder are the same. We have confirmed the rates now match. See uploaded “Rates Tables” files.
23. The Rate/Rule Schedule tab shows 5,701 policy holders while cell V15 of Table 10 shows 7,224 and the Rate Change Request Summary Attachment shows 9,989 covered lives as of February 1, 2017. Be advised that the 2018 Guidance, consistent with the 2017 Guidance, states that the policyholders in the Rate/Rule Schedule tab should show the number of covered lives and that this number should equal the figure shown in Table 1 and Table 10. Please review the Mapping instructions in section D.3.C and revise. 5,701 is the number of current policy holders, 7,224 is the number of current covered lives mapped to 2018 plans, and 9,989 is the total covered lives as of February 1, 2017. The Rate/Rule Schedule tab will be updated to match Table 1’s cell D18 and Table 10’s cell AP15 value of 9,989 covered lives.
24. Please provide the experience period data and projection factors used to develop the credibility manual data, in the same format as Worksheet I, Sections I and II of the URRT. Please see tab ‘Objection 11’ of “Objections 6-16-17.xlsx”.
25. Please show quantitatively, including an Excel spreadsheet with formulas, the derivation of the --$28.88 Projected Risk Adjustments PMPM amount found in Section III, Worksheet 1 of the URRT and in Table 5 cell C31. Also provide a detailed narrative that describers the development of the estimated risk adjustment transfer payment. In demonstrating the development of the transfer payment, please show all risk transfer formula components, the estimated market-wide average risk assumptions as well as support for those assumptions. Since this response should include detailed insight into the risk adjustment transfer methodology, you may redact this response as appropriate. Please see the response to Question 14. As noted above, our projected Risk Adjustment PMPM relied upon the information provided by the Pennsylvania DOI.
26. Please show quantitatively the derivation of the trend assumptions for each benefit category as shown in Table 3b. Please include the sources and source claims data in Table 4b. Also provide a detailed narrative that explains why this data is appropriate and how it was used in developing the trend, including all assumptions and adjustments. Also discuss the impact of provider contracting and leveraging on trend. The specific provider contracting agreement and amount may be redacted, but not aggregate amounts.
XXXXXXXXXXXXXXX XXXXXXXXXXXX
XXXXXXXXXXXXX XXXXXXXXXXX
Please see the response to Question 11 for the derivation of the trend assumption. The data in Table 4b is not appropriate to develop trend assumptions as it has not been normalized for benefit changes, demographic changes, or catastrophic claims. We also develop a prospective forward looking trend estimate, rather than a historical view so that we able to appropriately price for the projected claims for the 2018 policies.
27. Table 6, cell B54, indicates the PCORI fee is $0.19. The 2018 PCORI pmpm amount should be $0.20 or $0.21. Please revise. Table 6 had been updated to reflect a $0.20 PCORI pmpm amount.
28. On page 14 of the 2018 Guidance, the department requested data regarding the development of the Pricing AVs and Induced Demand in Table 10. Please provide this data in Excel. Please see Question 8 for the development of the Pricing AV. Induced Demand is 1.0 for the plans in this filing.
29. Please show quantitatively, including an Excel spreadsheet with formulas, the development of the age (1.430) and geographic (0.921) calibration factors in cells T4 and T5 of Table 10. Also, state the associated age. Please see “Objection 29- Geographic Calibration” tab of “Objections 6-16-17.xlsx”.
XXXXXXXXXXXXXXX XXXXXXXXXXXX
XXXXXXXXXXXXX XXXXXXXXXXX
32. Please show quantitatively, including an Excel spreadsheet with formulas the
development of and discuss the basis for the Change in Morbidity (1.093), Change in Demographics (0.958), Change in Network (1.020) and the Change in Other (.997) in Table 5. Please see tab ‘Objection 13 cont. & Obj 32’ in “Objections 6-16-17.xlsx”.
33. Table 6 cell C63 indicates the Single Risk Pool pmpm is $581.27, while the Single risk pool in the URRT in cell V43 indicates $557.87. Please reconcile. Table 6 uses the average of all policies offered through the year, while the URRT Worksheet 1 cell V43 only represents the first quarter policies.
34. Please show the development of the average commission and circumstances in which broker commissions will be paid and if they will vary based on geographic location, metal level, plan, open enrollment vs SEP enrollment, etc. Additionally, the current and 2018 broker agreements should be included and used to develop the percent shown in Table 6 as well as the associated pmpm dollar amount. As noted in our actuarial memorandum, the commission expense factor covers anticipated sales and marketing expenses. Those may include, without limitation, purchase of television, internet and other advertising; payments of commissions and other incentive compensation to Company’s internal sales force; and payment of commissions to external brokers. The exact amounts and distribution among the categories of sales and marketing expenses will depend on a variety of factors including competitive conditions, business strategy, consumer behaviors, and legal and regulatory requirements. The consumer behaviors would capture whether they use a particular distribution channel, commissioned or not, as well as their experience.
Please let us know if you need any additional information to complete your review of this filing. Sincerely, XXXXXXX, FSA Senior Director, Aetna
Projection Period: 01/01/2018 to 12/31/2018 Mid-point to Mid-point, Exper to Proj: 24 months
Benefit Category IP OP Prof Other Cap RxUtil/1,000 303.39 1,733.66 10,530.75 2,109.49 12,000.00 11,721.22
Development of the Projected Index Rate Manual DataTotal Allowed EHB Claims + EHB Capitation PMPM (net of prescription drug rebates) PMPM 426.60$ Two year trend projection Factor 1.081Unadjusted Projected Allowed EHB Claims PMPM 461.17$ Single Risk Pool Adjustment Factors Change in Morbidity 1.093 Change in Other 0.974 Change in Demographics 0.958 Change in Network 1.020 Change in Benefits 1.000 Change in Other 0.997
1 3% 0.7850 5% 0.7850 2 0% 0.7918 0% 0.7918 3 2% 0.9982 1% 0.9982 4 20% 0.8102 23% 0.8102 Note: 5 3% 0.7800 2% 0.7800 Average Experience Period Area Factor computed 6 2% 0.9830 1% 0.9830 as the weighted average of Experience Period Area 7 29% 0.9838 31% 0.9838 Factors by experience period membership distribution. 8 25% 1.0000 16% 1.0000 9 16% 0.9332 19% 0.9332
Note:Projected Area Factorcomputed as the weighted average of Projection PeriodArea Factors by projected membership distribution.
Note:Area Shift Factor computed as the ratio of the ProjectedMembership by Area over the Experience Membership by AreaFactor represents:The impact due to the shift of the populationdistribution across areas.
Note:Area Factor Change computed as the ratio of the ProjectedArea Factor over the Experience Area Factor both using projected membershipFactor represents:The impact due to cost relativity changes, includingchanges to provider networks and contracts, from the experience period to the rating period.
July 14, 2017 Mr. Michael Gurgiolo Actuarial Review Division Bureau of Accident & Health Insurance 1311 Strawberry Square Harrisburg, PA 17120 Subject: Aetna HealthAssurance Pennsylvania, Inc. Small Group Rate Filing SERFF # AETN-131033573 Dear Mr. Michael Gurgiolo: Enclosed is additional information related to the items contained in your objection letter dated 07/07/2017 for the above referenced rate filing.
1) In reference to response #2, please review Sections ‘2.2.1 Guaranteed Renewability and Uniform modification of Coverage’ and ‘2.2.2 Plan Mapping Instructions’ beginning on page 25 of the Unified Rate Review (URR) Instructions. We would expect one or more plans to be listed as ‘Renewing’ in the URR template in order to avoid a market withdrawal. Please provide support for having all 2018 plans listed as ‘New’ in the URR template while avoiding a market withdrawal or revise the URR template accordingly. Prior CMS guidance deemed carriers discontinuing all current plans to withdraw from a market even if those carriers already filed new plans for the following year. However, because this guidance evidenced a disconnect between traditional market withdrawal concepts and a carrier’s evidence of continued commitment to a market, CMS recently revised its position through a Q&A document. Now, discontinuing all current plans and replacing with all new plans will not be deemed to be a market withdrawal. CMS does specify that carriers cannot use this approach to avoid the rate review process and must apply the reasonable rate review process to the newly filed plans. The applicable excerpt from the Q&A says: To reflect these exceptions to market withdrawal requirements, we proposed to add new paragraph (d)(3) to § 147.106 to provide that an issuer has not discontinued offering all health insurance coverage in a market if the issuer continues to offer and make available a product in the applicable market in a State and subjects the new product to the rate review requirements under part 154 of this title (to the extent otherwise applicable to coverage of the same type and in the same market) as if that part applied to that product, and reasonably identifies a discontinued product that corresponds to the new product for purposes of such rate review. We are finalizing the proposal as proposed by adding § 147.106(d)(3) with minor non-substantive modifications to the structure and text of the regulation, and also making conforming amendments to §§ 146.152(d)(3) and 148.122(e)(4).
2) In reference to response #3, please include the transitional policies (or Keep What You Have) on Worksheet 2 of the URR template. Refer to Page 33 of the URR Instructions, under ‘Product,’ which states “all products included in the single risk pool experience shown on Worksheet 1 must be entered in this section of Worksheet 2.” We will revise and provide an updated copy of the URRT to reflect the requested revision by COB July 18, 2017.
3) In reference to response #5, please provide further information for what is contained in the
“Benefit and Other Changes” grouping which is a -10.5% change. Since the overall total is only comparing silver plans, we would not expect there to be much impact from benefit changes. In 2017 we offered a variety of silver plans across the range of allowable actuarial value. However, in 2018 we are only offering a single silver plan. Overall, the benefits for the silver plan filed in 2018 were much leaner the benefits filed than the average silver plan for 2017 causing there to be a -10.5% change. Such leaning out of benefits include moving to a $5000 deductible, $7000 MOOP, 20% coinsurance, $30 PCP copay and $50 Specialty copay for an individual.
4) In reference to response #10, please illustrate how the paid trend in Exhibit 12 ties to the allowed trend in Exhibit 8 and show the leveraging impact, including how it was calculated, by cost category. Please see tab ‘Objection 4’ of ‘AHASPA Objection Response 7-7-17 for PA_DOI.xlsx’. The leveraging impact was calculated by assessing the impact of fixed member cost share on the overall ratio of paid to allowed claims, after unit cost and utilization trend. Historical levels of paid to allowed changes at the cost category level are used to determine the factor to apply.
5) In reference to response #12, please provide further information on how the experience period and projection period factors were calculated and what the factors represent. The Experience Period factor represents the average morbidity of the population covered during the 2016 historical period. It is calculated based on internal risk scores. The Projection period factors represent the average morbidity we expect in 2018 and was calculated by projecting forward which populations would remain in the single risk pool in 2018.
6) In reference to response #13, please illustrate the development of the ‘Area Mix’ and ‘Deductible Suppression’ factors. In addition, please provide an explanation for what the ‘Deductible Suppression’ factor represents. Please see tab ‘Objection 6’ of AHASPA Objection Response 7-7-17 for PA_DOI.xlsx. The deductible suppression factor represents the durational impact of members in the base period not being active for the full 12 months of the year. The result of this is that a higher level of allowed claims is applied to deductible in the base period than would be expected in the projection period. The deductible suppression factor adjusts the base period claims to the expected level for 12 month contract.
7) In reference to response #14, please illustrate the development of the ‘2018 Net High Risk Pool Prem less Recoveries’ amount was calculated. How was it determined that the premium paid would be more than the recoveries received? We anticipate, based on historical ACA national averaging, that our high risk pool recoveries will be .22% of overall claims. With the expected risk pool premium charge of .5%, we anticipate premium less recoveries to equal .28% of total premium.
8) In reference to response #16, please provide numerical support for the development of the 3.15%
Health Insurer Fee assumption. The 3.15% is calculated based on the national Aetna HIF liability and depend on market share projections in each State. Unfortunately we are not able to publically disclose these detailed market share projection calculations. Our projections of the HIF have been accurate in prior years
9) In regards to response #18 and #19, please provide support for deducting the risk adjustment high risk pool amount from premium as our understanding is that it is not an allowable adjustment in the MLR calculation. We reached out to HHS for clarification on this point, and received the following response: “The pooling charge should be considered a fee, while the recoveries should be reflected in the ‘Allowed Claims which are not the Issuer’s Obligation.”
10) Regarding response #29, I note that the response addresses geographic factors but not age factors. Please provide the requested information regarding the age calibration factors and associated age. Please see ‘Objection 10(AGE)” tab of the AHASPA Objection Response 7-7-17 for PA_DOI.xlsx spreadsheet. The state associated age is 35.
11) Please remove the Total Premium Tax from the filing.
Federal and Pennsylvania regulations require us to file adequate rates. In Actuarial Standard of Practice #8, this is defined as “Rates may be considered adequate if they provide for payment of claims, administrative expenses, taxes, and regulatory fees and have reasonable contingency or profit margins”. As we are required to pay these taxes and fees, removal of them would prevent us from certifying that we are providing actuarially sound adequate rates. Therefore, they have not been removed from this filing.
12) Regarding response #37, please ensure that the factors supported in the Objections 6-16-17 workbook are consistent with those shown in Table 5, and provide the requested discussion of the development of these factors. The factors are consistent with the ones shown in Table 5. The development of these factors can be seen in the excel workbook previously provided. These factors were developed by: Change in morbidity- The Experience Period factor represents the average morbidity of the population covered during the 2016 historical period. It is calculated based on internal risk scores. The Projection period factors represents the average morbidity we expect in 2018 and was calculated by projecting forward which populations would remain in the single risk pool in 2018. Change in Demographic- The change in demographic factor represents comparing the average demographic profile for the manual membership to the demographic of the projected enrollment in 2018. Change in Network-This factor was developed by comparing the average network factor in the experience period, to the average network factor available in 2018 Change in Other-The components of this factor includes the deductible suppression factor of .997 which is discussed in response to objection 6.
13) Regarding response #39, the Agent/Broker Fees and Commissions line in Table 6 should include only scheduled compensation paid to agents and brokers; all other advertising/marketing expenses should be shown under Administrative Expenses – General and Claims. We believe we have appropriately bucketed this expense.
If you wish to make adjustments to the projected RA amount included in this rate submission and the URRT, based on the June 30, 2017 Summary Report on Transitional Reinsurance Payments and Permanent Risk Adjustment Transfers, please do so. Provide narrative and an Excel spreadsheet demonstrating the development and assumptions. In your June 14th response you indicated that corrections would be when the final files are uploaded in SERFF. Be advised, all revisions must be reflected in this resubmission. Please provide a PDF file for public review (Public Rate Filing PDF) in SERFF to show the updated rate request. The following updated supporting items must be included: • Cover Letter • Rate Change Request Summary (Attachment 1) • Part 1 - Unified Rate Review Template (URRT) • Part II – Consumer Friendly Justification • Part III – Federal Actuarial Memorandum (redacted) • PA Actuarial Memorandum (redacted) • PA Actuarial Memorandum Rate Exhibits • PA Plan Design Summary and Rate Tables • Federal Rates Templates • Service Area Maps • Correspondence – Q&A’s and supporting exhibits Please remain cognizant of the limited redactions as outlined on pages 3 and 4 of the 2018 Guidance. Only those specific items may be redacted. Since AV screenshots and commission schedules are proprietary, they should not be included in this public PDF. Additionally, please ensure that documents and spreadsheets are internally consistent and that the Excel exhibit with formula corrections emailed to you on June 6, 2017 is used. The deadline for the revised PDF is COB July 18, 2017.
Service Type Unit Cost Utilizatio
n
Facility Inpatient 7.8% 3.0% Effective QuarMembershipTrend Facto Index Rate
HIOS ISSUER ID: 18939 Aetna HealthAssurance Pennsylvania, Inc.
PennsylvaniaAetna HealthAssurance Pennsylvania, Inc.
1Q18 Small Group Rates Objection 4: Trend
Aetna HealthAssurance Pennsylvania, Inc.
Total Projection Mmos 19,978 Projection % distribution (0- 25.65% Age Calibration Factor Justification - Total Premium Recovered with Age Calibration Factor in O80-20 age mmos 5,124 All Members $0 Prem Member Rated Members
Member Months 19,978 179 19,799Premium Factors by Age & Gender Single Risk Pool Gross $557.87 $557.87 $557.87
Age Gender Projection Factor Projection Member Months Projection % Distribution0-20 $0 Prem MMs M + F 0.000 179 0.9%0-20 Prem MMs M + F 0.782 5,124 25.6% Age Calibration Facto 1.437 1.437 1.4300 M 0.735 106 0.5% Consumer Premium R $388.19 $388.19 $390.091 M 0.735 111 0.6% Age Gender of Rated 1.437 0.782 1.4432 M 0.735 113 0.6% Total Premium $11,145,042 $54,305 $11,145,0423 M 0.735 123 0.6%4 M 0.735 110 0.6%5 M 0.735 121 0.6%6 M 0.735 119 0.6%7 M 0.735 128 0.6%8 M 0.735 118 0.6%9 M 0.735 132 0.7%10 M 0.735 129 0.6%11 M 0.735 130 0.7%12 M 0.735 130 0.7%13 M 0.735 135 0.7%14 M 0.735 141 0.7%15 M 0.735 137 0.7%16 M 0.859 142 0.7%17 M 0.885 138 0.7%18 M 0.913 139 0.7%19 M 0.941 144 0.7%20 M 0.970 150 0.8%21 M 1.000 145 0.7%22 M 1.000 143 0.7%23 M 1.000 149 0.7%24 M 1.000 142 0.7%25 M 1.004 166 0.8%26 M 1.024 169 0.8%27 M 1.048 176 0.9%28 M 1.087 174 0.9%29 M 1.119 175 0.9%30 M 1.135 181 0.9%31 M 1.159 176 0.9%32 M 1.183 167 0.8%33 M 1.198 167 0.8%34 M 1.214 173 0.9%35 M 1.222 172 0.9%36 M 1.230 179 0.9%37 M 1.238 166 0.8%38 M 1.246 154 0.8%39 M 1.262 154 0.8%40 M 1.278 154 0.8%41 M 1.302 165 0.8%42 M 1.325 159 0.8%43 M 1.357 164 0.8%44 M 1.397 171 0.9%45 M 1.444 184 0.9%46 M 1.500 186 0.9%47 M 1.563 166 0.8%48 M 1.635 180 0.9%49 M 1.706 177 0.9%50 M 1.786 178 0.9%51 M 1.865 190 1.0%52 M 1.952 198 1.0%53 M 2.040 187 0.9%54 M 2.135 199 1.0%55 M 2.230 188 0.9%56 M 2.333 181 0.9%57 M 2.437 190 1.0%58 M 2.548 183 0.9%59 M 2.603 180 0.9%60 M 2.714 171 0.9%61 M 2.810 163 0.8%62 M 2.873 147 0.7%63 M 2.952 136 0.7%64 M 3.000 132 0.7%65 M 3.000 205 1.0%0 F 0.735 121 0.6%1 F 0.735 118 0.6%2 F 0.735 107 0.5%3 F 0.735 117 0.6%4 F 0.735 115 0.6%5 F 0.735 109 0.5%6 F 0.735 115 0.6%7 F 0.735 121 0.6%8 F 0.735 129 0.6%9 F 0.735 122 0.6%10 F 0.735 122 0.6%11 F 0.735 125 0.6%12 F 0.735 129 0.6%13 F 0.735 134 0.7%14 F 0.735 121 0.6%15 F 0.735 136 0.7%16 F 0.859 134 0.7%17 F 0.885 127 0.6%18 F 0.913 137 0.7%19 F 0.941 129 0.6%20 F 0.970 136 0.7%21 F 1.000 135 0.7%22 F 1.000 123 0.6%23 F 1.000 132 0.7%24 F 1.000 143 0.7%25 F 1.004 156 0.8%26 F 1.024 163 0.8%27 F 1.048 162 0.8%28 F 1.087 170 0.9%29 F 1.119 154 0.8%30 F 1.135 171 0.9%31 F 1.159 156 0.8%
PennsylvaniaAetna HealthAssurance Pennsylvania, Inc.
1Q18 Small Group Rates Objection 10: Age Calibration
32 F 1.183 156 0.8%33 F 1.198 150 0.7%34 F 1.214 164 0.8%35 F 1.222 163 0.8%36 F 1.230 153 0.8%37 F 1.238 152 0.8%38 F 1.246 155 0.8%39 F 1.262 147 0.7%40 F 1.278 148 0.7%41 F 1.302 155 0.8%42 F 1.325 149 0.7%43 F 1.357 156 0.8%44 F 1.397 165 0.8%45 F 1.444 179 0.9%46 F 1.500 168 0.8%47 F 1.563 159 0.8%48 F 1.635 158 0.8%49 F 1.706 163 0.8%50 F 1.786 157 0.8%51 F 1.865 167 0.8%52 F 1.952 172 0.9%53 F 2.040 174 0.9%54 F 2.135 166 0.8%55 F 2.230 174 0.9%56 F 2.333 170 0.9%57 F 2.437 169 0.8%58 F 2.548 167 0.8%59 F 2.603 149 0.7%60 F 2.714 139 0.7%61 F 2.810 140 0.7%62 F 2.873 134 0.7%63 F 2.952 133 0.7%64 F 3.000 115 0.6%65 F 3.000 184 0.9%
Area Shift Factor computed as the ratio of the Projected Membership by Area over the Manual Membership by Area Factor represents: The impact due to the shift of the population distribution across areas.
Objection Letter Status:Pending Industry Response
Objection Letter Date:07/19/2017
Respond By Date:07/20/2017
Submitted Date:07/19/2017 09:04 AM Dear Allegra Sciandra,
Introduction: The following items are in reference to the responses dated July 14, 2017. Please submit your
responses for the Department’s consideration by 10:00 on July 20, 2017:
1. In reference to response #3, please provide the development of the -10.5% for ‘Benefit and Other
Changes’, as we would not expect such a large change due to benefits within a metal level due to limits of
the de minimis range.
2. In reference to response #4, please provide greater detail on the development of the projection period
morbidity factors. Please demonstrate how you projected forward the populations that would be in the single
risk pool in 2018.
3. In reference to response #5, the trend appears to be higher than expected. Please clearly address the
following to ensure the trend assumption is fully supported:
a. Please provide an exhibit showing the original PMPMs, all distinct normalization factors broken out (i.e.,
age, gender, plan benefits, risk, etc.), and the resulting normalized PMPM used in the trend development.
b. Please confirm there is no margin being applied to the trend.
c. Please provide a demonstration of how the leveraging is developed for both medical and RX.
July 20, 2017 Mr. Michael Gurgiolo Actuarial Review Division Bureau of Accident & Health Insurance 1311 Strawberry Square Harrisburg, PA 17120 Subject: Aetna HealthAssurance Pennsylvania, Inc. Small Group Rate Filing SERFF # AETN-131033573 Dear Mr. Michael Gurgiolo: Enclosed is additional information related to the items contained in your objection letter dated 07/19/2017 for the above referenced rate filing. 1. In reference to response #3, please provide the development of the -10.5% for ‘Benefit and Other
Changes’, as we would not expect such a large change due to benefits within a metal level due to limits of the de minimis range.
2. In reference to response #4, please provide greater detail on the development of the projection period morbidity factors. Please demonstrate how you projected forward the populations that would be in the single risk pool in 2018.
Please see tab 2 of the ‘AHASPA Objection Responses 7-19-17.xlsx’
3. In reference to response #5, the trend appears to be higher than expected. Please clearly address the following to ensure the trend assumption is fully supported:
a. Please provide an exhibit showing the original PMPMs, all distinct normalization factors
broken out (i.e., age, gender, plan benefits, risk, etc.), and the resulting normalized PMPM used in the trend development. Please see tab ‘3’ of the ‘AHASPA Objection Responses 7-19-17.xlsx’
b. Please confirm there is no margin being applied to the trend. We confirm there is no margin being applied to the trend.
c. Please provide a demonstration of how the leveraging is developed for both medical and RX. Leveraging for medical and pharmacy is developed using the Milliman Health Cost Guidelines Deductible Leveraging table. Based on the average deductible, a load factor is applied to the allowed trend to calculate the paid trend. An example is below.
Allowed Trend = 10.0% Average Deductible = $2,000 Lookup From Deductible Leveraging Table for $2,000 = 1.15 Leveraging Trend = (1 + Allowed Trend * Deductible Lookup)/(1+Allowed Trend) – 1
Please let us know if you need any additional information to complete your review of this filing. Sincerely, David Grieshaber, ASA, MAAA Actuarial Manager, Aetna
PennsylvaniaAetna HealthAssurance Pennsylvania, Inc.
1Q18 Small Group Rates
Tota
l Oth
er
Objection Letter Status:Pending Industry Response
Objection Letter Date:08/07/2017
Respond By Date:08/08/2017
Submitted Date:08/07/2017 02:32 PM
Sincerely,Cherri Sanders-Jones
Objection Letter for AETN-131033573 SERFF Tracking Number:
AETN-131033573 State: Pennsylvania
Filing Company: Aetna HealthAssurance Pennsylvania, Inc. State Tracking Number:
AETN-131033573
Company Tracking Number:TOI: H15G Group Health -
Hospital/Surgical/Medical ExpenseSub-TOI: H15G.003 Small
Group OnlyProduct Name: 2018 PA SG AHASPA FilingProject Name:
Dear Allegra Sciandra,
Introduction:1. Regarding morbidity, please provide the data and your analysis that supports the statement that the average morbidity of the your block has deteriorated 7% since December 2016. In your analysis show how this is being driven by new or existing membership.
Cherri Sanders-Jones (717) 787-5172
Conclusion:
Page 1 of 1SERFF - System for Electronic Rate and Form Filing
August 8, 2018 Ms. Cherri Sanders-Jones Actuarial Review Division Bureau of Accident & Health Insurance 1311 Strawberry Square Harrisburg, PA 17120 Subject: Aetna HealthAssurance Pennsylvania, Inc. Small Group Rate Filing SERFF # AETN-131033573 Dear Ms. Cherri Sanders-Jones: Enclosed is additional information related to the items contained in your objection letter dated 08/07/2017 for the above referenced rate filing.
1. Regarding morbidity, please provide the data and your analysis that supports the statement that the average morbidity of the your block has deteriorated 7% since December 2016. In your analysis show how this is being driven by new or existing membership. In the most recent filing objection, we provided the support for our development of the morbidity assumption, as shown in rows 14-20 of the Excel file, Morbidity Explanation.xlsx. In this exhibit, we are implying that the morbidity of our block of business would deteriorate by approximately 5.5% for the full year of 2017. Based on our most recent available information, we have seen our block deteriorate by 6.8% in the first six months of 2017. This is driven by a few different factors as shown in rows 23-29 of the Excel file: • Higher termination rate than projected • Lower new sales than projected • Lower morbidity of termed members than expected As the morbidity of our block has already shown more deterioration in the first six months of 2017 than we had projected for the full year in 2017, we feel that the factors applied in our rate development are appropriate. As is shown in rows 31-35 of the Excel file, our 9.3% change in morbidity assumption is within the range of what we would use if we were to develop rates based on the most updated information.
Please let us know if you need any additional information to complete your review of this filing. Sincerely, XXXXXXX, FSA, MAAA Sr. Director, Actuarial, Aetna